Market Minds Advisory
Construction Material Testing Equipment Market

Construction Material Testing Equipment Market: Traceable Calibration as the Real Purchasing Filter.

State transportation agencies now specify digital automated testing systems ahead of tightening bridge inspection mandates, infrastructure contractors expand non-destructive testing capacity across aging structures, and suppliers without traceable calibration certification lose multi-year agency contracts.

Lead Analyst

David Horsley

Published

September 2026

Make Smarter Decisions with Customized Research Insights

Request a free sample report and evaluate market opportunities, growth trends, and competitive dynamics relevant to your business needs.

2025 MARKET VALUE$2.6BMarket Size 2025
2036 FORECAST VALUE$5.1BBase Case , 2026 to 2036
CAGR 2026 TO 20366.4 %Bull 7.6% / Bear 5.1%
INCREMENTAL OPPORTUNITY$2.4BNet 10- year value creation
EXPANSION MULTIPLE1.86x2036 value over 2026 base
Strategic Levers
M&A Pipeline
Regional Outlook
Country Rankings
Competitive Intelligence
Segmental Deep-dive
Call-Us : 91 93563 13602

Executive Snapshot and Market Trajectory

Laboratory managers increasingly treat traceable calibration certification as the deciding purchasing factor rather than raw load capacity alone, since documented accuracy data now determines which testing equipment actually qualifies for agency-accredited compliance work across most major transportation and building departments simultaneously and without costly requalification delay across every affected laboratory.
Digital and automated testing systems with data logging lead growth at 10.0%, roughly 1.56 times the overall rate, as quality assurance programs demand traceable digital records that manual testing methods cannot reliably produce across every laboratory workflow. North America now holds the largest regional share at 27%, driven by aging bridge and roadway infrastructure combined with Infrastructure Investment and Jobs Act funded inspection mandates across major transportation corridors and their surrounding regional infrastructure networks.
Competitive intensity stays moderate at 38% held by five suppliers, since accreditation requirements and application-specific engineering fragment share across dozens of regional specialists rather than concentrating entirely around a handful of global platforms the way some more standardized industrial categories do. Buyers increasingly select suppliers on documented calibration traceability rather than unit price alone across most major procurement decisions and multi-year laboratory accreditation cycles.
Market Definition
Base Year Value
$2.6B in 2025 (MMA Primary Research Dataset, August 2026)
Forecast Period
2026 to 2036, eleven discrete annual values
CAGR
6.4% base case. Bull 7.6%. Bear 5.1%.
Fastest Growth Segment
Digital and Automated Testing Systems with Data Logging: 10.0% CAGR
Fastest Growth Country
China: 7.9% CAGR
Fastest Growth Region
South Asia and Pacific: 8.4% CAGR
Largest Region
North America: 27% of 2025 global value
Market Leaders
Primary Survey
n=3,800 procurement and R&D decision-makers, Q4 2025, six countries
Methodology
Demand-side build-up, cross-validated against public data, 47 expert interviews

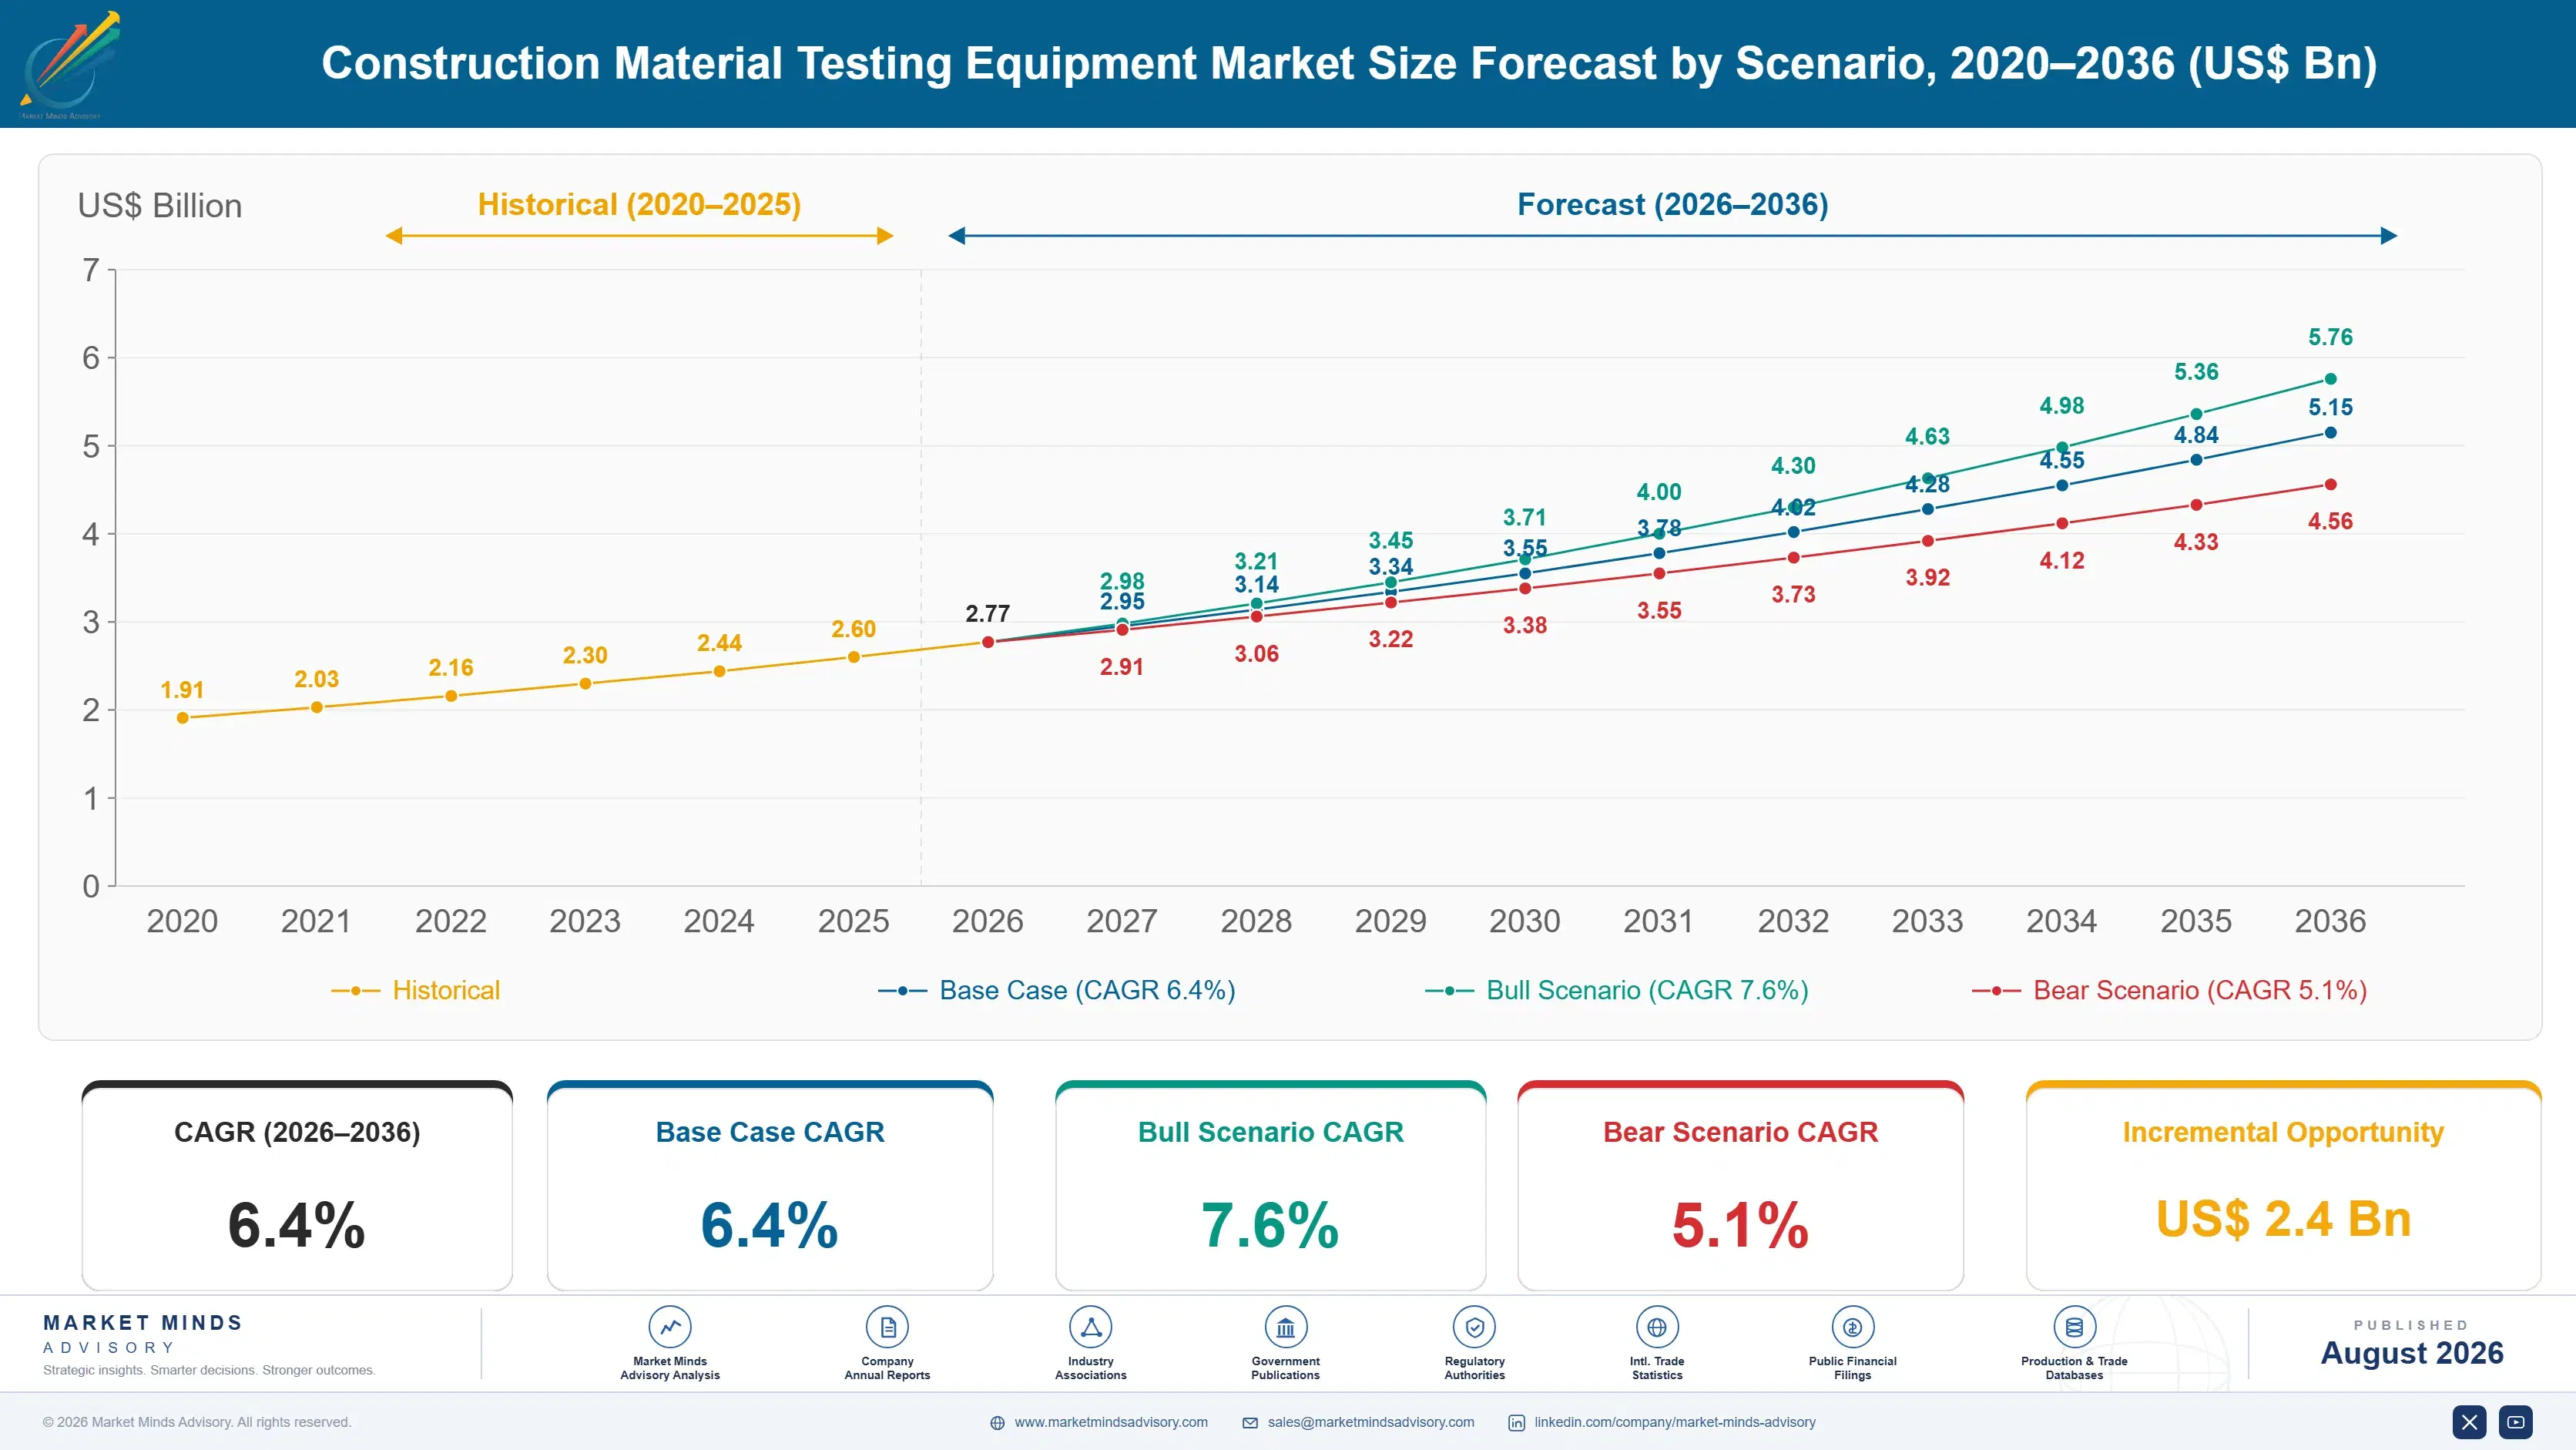
Construction Material Testing Equipment Market Forecast Scenarios

construction-material-testing-equipment-market-size-forecast-scenario-1787301910179
Between 2020 and 2025 the market grew at an estimated 5.7% annually, as post-pandemic infrastructure capital investment and tightening quality assurance mandates pushed laboratories toward digital testing equipment upgrades faster than the industry's typical multi-year replacement cycle would otherwise dictate across most major construction markets worldwide, a pace that held steady even through broader supply chain disruption.
Three mechanisms carry the base case to 6.4%. First, global infrastructure investment keeps expanding, and every new road, bridge, and building project requires certified material testing across every phase of construction and quality control review. Second, aging infrastructure inspection programs keep expanding as bridge and roadway assessment mandates tighten across mature markets and their regulatory frameworks. Third, digital laboratory accreditation requirements keep pushing testing facilities toward automated systems that manual methods cannot satisfy.
The bull case at 7.6% assumes accelerating infrastructure investment across additional major markets pulls forward equipment replacement faster than currently planned by most laboratory operators. The bear case at 5.1% assumes budget-constrained public infrastructure programs delay planned equipment upgrades, slowing the pace of new testing equipment installation and replacement demand growth across affected agencies and their broader capital budgets.

Traceable Calibration as the Real Purchasing Filter

Construction material testing equipment sits at the center of infrastructure quality assurance economics for any laboratory certifying concrete, aggregate, asphalt, or soil properties, since traceable calibration increasingly determines which equipment a laboratory manager can actually deploy against agency accreditation requirements. Documented measurement accuracy, not raw load capacity, increasingly separates competing suppliers across most major procurement decisions and every subsequent acc
MARKET CONCENTRATION (CR5)38%Five suppliers hold moderate share across fragmented specialist field
CALIBRATION ACCURACY0.5 to 1.0 percentTypical certified measurement tolerance range across current product generations
TOP PRODUCING COUNTRY SHARE19%United States supplies largest share of installed testing equipment capacity
EQUIPMENT SERVICE LIFE15 to 25 yearsTypical interval before testing machines require full replacement cycles
PRECISION STEEL COST SHARE23-33% of COGSLoad frame and sensor inputs weigh heavily on costs
TRADE INTENSITY44% cross-borderFinished testing equipment frequently cross borders before final installation
Commercially, the category behaves like a specialized calibration and accreditation business wrapped inside a broader scientific instrument supply relationship. Suppliers maintain traceable calibration data across dozens of test method configurations simultaneously, which locks laboratory operators into suppliers holding the specific certifications their accreditation bodies require rather than encouraging unit-by-unit shopping on price. Switching testing equipment suppliers requires costly laboratory requalification testing and updated calibration documentation.
Over the next decade, expect digital automated systems and non-destructive testing technology to keep displacing conventional manual testing methods as quality assurance documentation and infrastructure inspection demands intensify across major construction markets worldwide. Bridge, roadway, and building applications will keep driving the sharpest adoption activity as certification and traceability requirements tighten further across the coming decade and beyond as accreditation bodies raise minimum traceability thresholds.
"A testing machine's load capacity gets it on the shortlist. The calibration certificate is what actually determines whether an agency accepts the result."
Director, Construction Materials and Quality Assurance Practice · MMA Industrial

Market Trends

Digital Data Logging Reshapes Laboratory Compliance Documentation

Transportation agencies and building departments are increasingly requiring digital, traceable test records that manual paper-based logging cannot satisfy, particularly for agency-accredited compliance submissions that face growing regulatory scrutiny. The US Federal Highway Administration's continued emphasis on digital inspection recordkeeping has pushed several state departments of transportation toward formal automated testing system budgeting rather than continued reliance on manual data entry prone to transcription error. Instron and Zwick Roell have both expanded digital data logging product lines to meet this tightening documentation landscape across their core transportation and building product lines.
Market Impact: Adds 6,000 laboratories under expan

Aging Bridge Infrastructure Expands Non-Destructive Testing Demand

Governments across major economies are directing substantial capital toward bridge and roadway inspection programs, and each aging structure requires non-destructive testing equipment to assess material condition without damaging load-bearing components during evaluation and long-term structural monitoring. The US Infrastructure Investment and Jobs Act has expanded federal funding for bridge inspection programs, pushing state agencies toward formal non-destructive testing equipment procurement across aging transportation networks and their surrounding maintenance districts. Suppliers with established agency procurement relationships are capturing disproportionate share of this expanding infrastructure-driven demand across every major producing region worldwide.
Market Impact: Adds 20% digital system installs

Market Opportunities and Growth Drivers

Infrastructure Investment Sustains Baseline Testing Demand

Global road, bridge, and building construction continues steadily expanding across most major economies, and each new project requires certified material testing at multiple construction phases from aggregate sourcing through final compressive strength verification and ongoing quality control review. China's continued infrastructure investment has expanded the installed base of laboratories requiring certified testing equipment across major industrial provinces and their extensive surrounding construction supply chains and vendor networks. Suppliers with established agency and laboratory relationships are capturing disproportionate share of this expanding project-driven demand base across every major producing region worldwide.
Market Impact: Requires 2 to 4 million

Quality Assurance Mandates Expand Digital Testing Adoption

Tightening building code and transportation agency quality assurance standards across major construction markets are pushing laboratory operators toward digital automated testing systems that conventional manual equipment cannot satisfy on traceability grounds across most accredited applications. China's Ministry of Housing and Urban-Rural Development has expanded quality assurance documentation requirements covering construction material testing, pushing domestic laboratories toward formal digital system adoption across major provincial testing networks and their affiliated regional laboratories. Suppliers with established digital certification depth are capturing disproportionate share of this expanding regulation-driven demand across every major producing region worldwide.
Market Impact: Delays upgrades 2 to 3 years

Market Restraints and Challenges

Accreditation Testing Costs Limit Smaller Supplier Entry

Bringing a new testing machine design to laboratory accreditation body approval requires extensive calibration and repeatability testing across multiple load ranges and test method configurations, a cost burden smaller specialty manufacturers often cannot justify against uncertain approval timelines. The root cause is evidentiary rigor: accreditation bodies require increasingly comprehensive traceability and repeatability data before granting approval, a standard that has risen considerably as infrastructure safety scrutiny intensifies. That cost structure concentrates the highest-value accredited equipment portfolio among a handful of well-capitalized suppliers. Suppliers are responding by pursuing shared testing consortiums to distribute data generation costs.
Market Impact: Converts 23% of new installations

Long Procurement Cycles Delay Laboratory Upgrade Decisions

Public agency and university laboratory procurement typically follows multi-year budget cycles that constrain when testing equipment replacement can actually proceed, even when accreditation renewal or aging equipment risk would otherwise justify immediate upgrade. The root cause is budget allocation competition: laboratory administrators must weigh equipment replacement against other capital priorities competing for the same limited budget, and testing equipment rarely wins priority over higher-visibility infrastructure programs. That dynamic delays replacement well past the point where accuracy data alone would justify the investment. Suppliers are responding by offering financing and equipment leasing arrangements.
Market Impact: Adds 4,200 bridge inspection progra
3 additional market trends, 4 additional growth drivers, and 2 additional restraints and challenges are covered in the full report. Contact sales@marketmindsadvisory.com to access the complete intelligence.

Segment CAGR and Growth Architecture

Segmentation follows testing method and technology type, a single classification logic spanning compression and flexural testing machines, universal testing machines, aggregate and soil testing equipment, non-destructive testing equipment, asphalt and bituminous testing equipment, and digital automated testing systems. Each method carries distinct measurement mechanism, accreditation pathway, and application context, so commercial position tracks testing engineering rather than end-use industry
construction-material-testing-equipment-market-market-share-analysis-1787301910723

Digital and Automated Testing Systems with Data Logging

Digital and automated testing systems with data logging grow fastest at 10.0%, about 1.56 times the overall market rate, as quality assurance programs demand traceable digital records that manual testing methods cannot reliably produce without transcription error and repeated verification labor. Adoption concentrates first in agency-accredited transportation laboratories where compliance documentation increasingly decides equipment qualification, and building code enforcement laboratories are increasingly following given comparable traceability requirements across their certification workflows. Suppliers with proven digital data logging capability are capturing disproportionate share of new laboratory installations as procurement teams increasingly specify automated systems explicitly in tender requirements, particularly across the United States, China, and the broader North American transportation agency base.
CAGR 10.0%

Non-Destructive Testing Equipment

Non-destructive testing equipment grows second-fastest overall at 8.2%, driven by rapidly expanding bridge and roadway inspection mandates requiring detailed material condition assessment without damaging load-bearing structural components that destructive sampling methods would otherwise compromise permanently. Transportation agencies worldwide increasingly specify non-destructive testing as the baseline choice for aging infrastructure inspection rather than an alternative to core sampling, since the ability to assess structures repeatedly over time without cumulative damage carries growing regulatory value across every jurisdiction. Suppliers offering fully integrated non-destructive testing and reporting packages are capturing share from single-method specialists, since agency customers increasingly prefer a single accountable vendor for complete inspection documentation across every structure in the network.
CAGR 8.2%
Full segment breakdown across 6 segments available in the complete report.

Regional Architecture and Country Demand Map

North America leads at 27% of global value on aging bridge infrastructure and Infrastructure Investment and Jobs Act funded inspection mandates, followed by East Asia at 25% and Western Europe at 21% on established quality assurance demand. Remaining regions account for the balance of demand.

North America

The United States accounts for most North American demand, where the Infrastructure Investment and Jobs Act alongside aging bridge inventory shape which testing equipment laboratory managers actually specify across most major transportation and building departments. Federal Highway Administration funding has pushed several state agencies toward accelerated bridge inspection and testing equipment replacement, sustaining elevated design-in volume across major transportation corridors. Canada's provincial infrastructure programs both follow comparable regulatory patterns at smaller absolute scale, anchored by its own certification framework. Growth of 6.9% outpaces the global rate as infrastructure investment and aging equipment replacement compound across an already substantial installed customer base spanning multiple laboratory sectors and their extensive existing supplier networks nationwide.
Share: 27% | CAGR: 6.9% (2026 to 2036)

Western Europe

Germany and France host substantial scientific instrument manufacturing supporting testing equipment demand across the European Union's stringent construction product regulation framework, which requires extensive documentation before granting equipment approval across all member states simultaneously. Italy's construction and infrastructure sectors sustain steady demand tied to established laboratory relationships built over multiple decades. The United Kingdom maintains comparable certification requirements following its departure from the European Union's centralized regulatory system, creating some duplicative approval burden for suppliers serving both markets separately. Growth of 4.9% trails the global average because the region's laboratory base, while technically sophisticated, has already driven most feasible digital conversion activity across mature accounts and long-established laboratory supplier relationships built over decades.
Share: 21% | CAGR: 4.9% (2026 to 2036)
Regional intelligence for 5 additional markets available in the complete report: East Asia, South Asia and Pacific, Latin America, Middle East and Africa, Eastern Europe. Contact sales@marketmindsadvisory.com.
construction-material-testing-equipment-market-country-cagr-analysis-1787301911259

Where Testing Equipment Suppliers Can Defend Margin

Suppliers can defend margin against commoditized equipment pricing in several distinct ways beyond simply selling more units into a growing laboratory base. The three levers below identify genuine commercial advantage: calibration certification leadership, bundled digital and non-destructive testing packages, and laboratory accreditation support across regulated agency and university accounts worldwide, from state transportation agencies to research institutions.

Lead Traceable Calibration Documentation Depth Now

Suppliers with the broadest documented traceable calibration data across multiple test method configurations capture premium pricing of 16% to 26% over competitors with less rigorous calibration testing, since laboratory managers increasingly specify minimum accreditation thresholds before approving procurement. This advantage compounds as agency accreditation standards tighten industry-wide, since suppliers with the deepest calibration libraries can respond to new laboratory requests faster than competitors starting testing from scratch. Instron and Zwick Roell have both built durable calibration leadership that smaller regional competitors cannot quickly or affordably replicate across comparable test method categories.
Market Impact: Commands a durable 16 to 26 percent

Bundle Non-Destructive Testing With Standard Equipment Sales

Transportation agencies increasingly want a single accountable vendor for complete infrastructure assessment spanning destructive and non-destructive testing methods, rather than sourcing each capability separately from different specialists. Suppliers offering bundled packages can charge premiums of 13% to 21% over component-only competitors, since customers value avoiding the integration risk of mismatched reporting formats across multiple vendors, installation timelines, and warranty terms. MTS Systems and Controls Group have both consistently built durable bundling advantages across dozens of laboratory configurations that smaller specialists cannot quickly replicate across comparable process configurations and laboratory types.
Market Impact: Commands a durable 13 to 21 percent

Offer Embedded Laboratory Accreditation Support Services

Manufacturers moving beyond selling standalone testing machines toward embedded accreditation support, spanning documentation preparation, proficiency testing coordination, and post-installation calibration monitoring under a single contract, capture engineering and service fees that a component-only sale never reaches. This shift matters most for laboratories pursuing new agency accreditation, where support services can add 24% to 39% above the equipment's standalone list price. It also deepens the customer relationship ahead of the next fleet refresh, since the original integrator typically wins the follow-on contract a decade or more later across the full laboratory.
Market Impact: Adds 24 to 39 percent to accreditat

Who Controls the Margin Pool

Concentration stays moderate at 38% held by the top five suppliers, evaluated on revenue from construction material testing equipment product lines specifically. Instron and MTS Systems lead on calibration breadth and engineering depth, while Zwick Roell, Controls Group, and Humboldt Mfg. compete across different application specialties and regional footprints. The gap between leader and challenger is meaningful but not decisive, since laboratory managers often qualify multiple suppliers per sit
Competitive activity currently runs along three dimensions. Traceable calibration depth matters most, as suppliers race to document accuracy across every test method configuration accreditation bodies recognize. Bundled non-destructive testing packaging runs a close second, as transportation agencies increasingly want a single accountable vendor. Embedded laboratory accreditation support is the third, converting standalone equipment sales into deeper multi-site relationships.

Pressure is building from two directions. Chinese domestic manufacturers are scaling rapidly and narrowing the technology gap on conventional testing machine designs, threatening incumbents' share in price-sensitive emerging markets. Meanwhile digital inspection specialists are commercializing sensor-based remote monitoring platforms that could eventually challenge conventional testing equipment suppliers on service revenue. Rankings will shift toward suppliers combining defensible calibration portfolios with genuine bundling innovation.
construction-material-testing-equipment-market-company-positioning-matrix-1787301911779

Competitive Moat and Risk Dimensions

INSTRON

Moat: Broadest Calibration Certification Portfolio

Instron maintains traceable calibration data across more test method configurations than any other supplier, giving it breadth that smaller regional competitors cannot match while also letting it serve multinational laboratory customers seeking a single supplier across all target accreditation bodies. That calibration depth took decades to build and cannot be quickly replicated.
INSTRON

Risk: Exposure to Testing Cost Inflation

Instron's calibration-heavy business model makes it more exposed than smaller competitors to rising accreditation qualification costs, which keep climbing as infrastructure safety scrutiny intensifies. That cost inflation pressures margin on lower-volume certified configurations specifically, a persistent cost trend affecting specialty scientific instrument suppliers broadly across the industry.
MTS SYSTEMS CORPORATION

Moat: Integrated Testing Systems Manufacturing Scale

MTS Systems' integrated mechanical testing and simulation manufacturing base gives it cross-selling advantages that pure-play construction testing specialists cannot match, letting it bundle testing equipment into broader laboratory contracts while maintaining meaningful margin across its diversified product lines and adjacent scientific instrument categories it manufactures at meaningful scale.
MTS SYSTEMS CORPORATION

Risk: Construction Testing a Smaller Slice

Construction material testing represents a relatively small segment within MTS Systems' much larger diversified mechanical testing portfolio, meaning specialized competitors sometimes out-innovate the company on construction-specific technology since their entire engineering focus concentrates there exclusively, without the competing internal capital priorities the broader portfolio must constantly balance.

Players Tracked

Prominent Players

Instron
MTS Systems Corporation
Zwick Roell AG
Controls Group S.p.A.
Humboldt Mfg. Co.

Other Key Players

ELE International Limited
Matest S.p.A.
Cooper Research Technology Ltd.
Forney LP
Gilson Company Inc.
Utest Material Testing Equipment
Wykeham Farrance
Pavetest Pty Ltd.
Impact Test Equipment Ltd.
James Cox & Sons Inc.
Test Mark Industries
Geneq Inc.
ProQuip Inc.
Aimil Ltd.
Karol-Warner LLC

Recent Developments

MAY 2026

Instron launches next-generation digital data logging system for transportation laboratories

Instron received accreditation approval for a new digital automated testing system specifically engineered for state transportation laboratory compliance applications, expanding its certified product portfolio ahead of tightening documentation requirements. This was an accreditation milestone, not a corporate transaction, extending Instron's digital product roadmap significantly across the state transportation compliance segment.
Signal: Shows leading suppliers continuing to inve
OCTOBER 2025

MTS Systems acquires specialty non-destructive testing technology developer

MTS Systems acquired a privately held non-destructive testing technology developer specializing in bridge and structural condition assessment systems for an undisclosed sum. The acquisition was a full corporate purchase, not a licensing arrangement or joint venture, giving MTS Systems direct ownership of the underlying inspection technology and its intellectual property.
Signal: Indicates suppliers increasingly prefer ow
MARCH 2025

Zwick Roell signs supply agreement with major state transportation department

Zwick Roell entered a multi-year supply agreement to provide testing equipment to a major regional state transportation department expanding bridge inspection programs across several highway districts. The arrangement was a supply agreement, not an acquisition or joint venture, extending Zwick Roell's agency customer relationships meaningfully.
Signal: Signals transportation agencies increasing

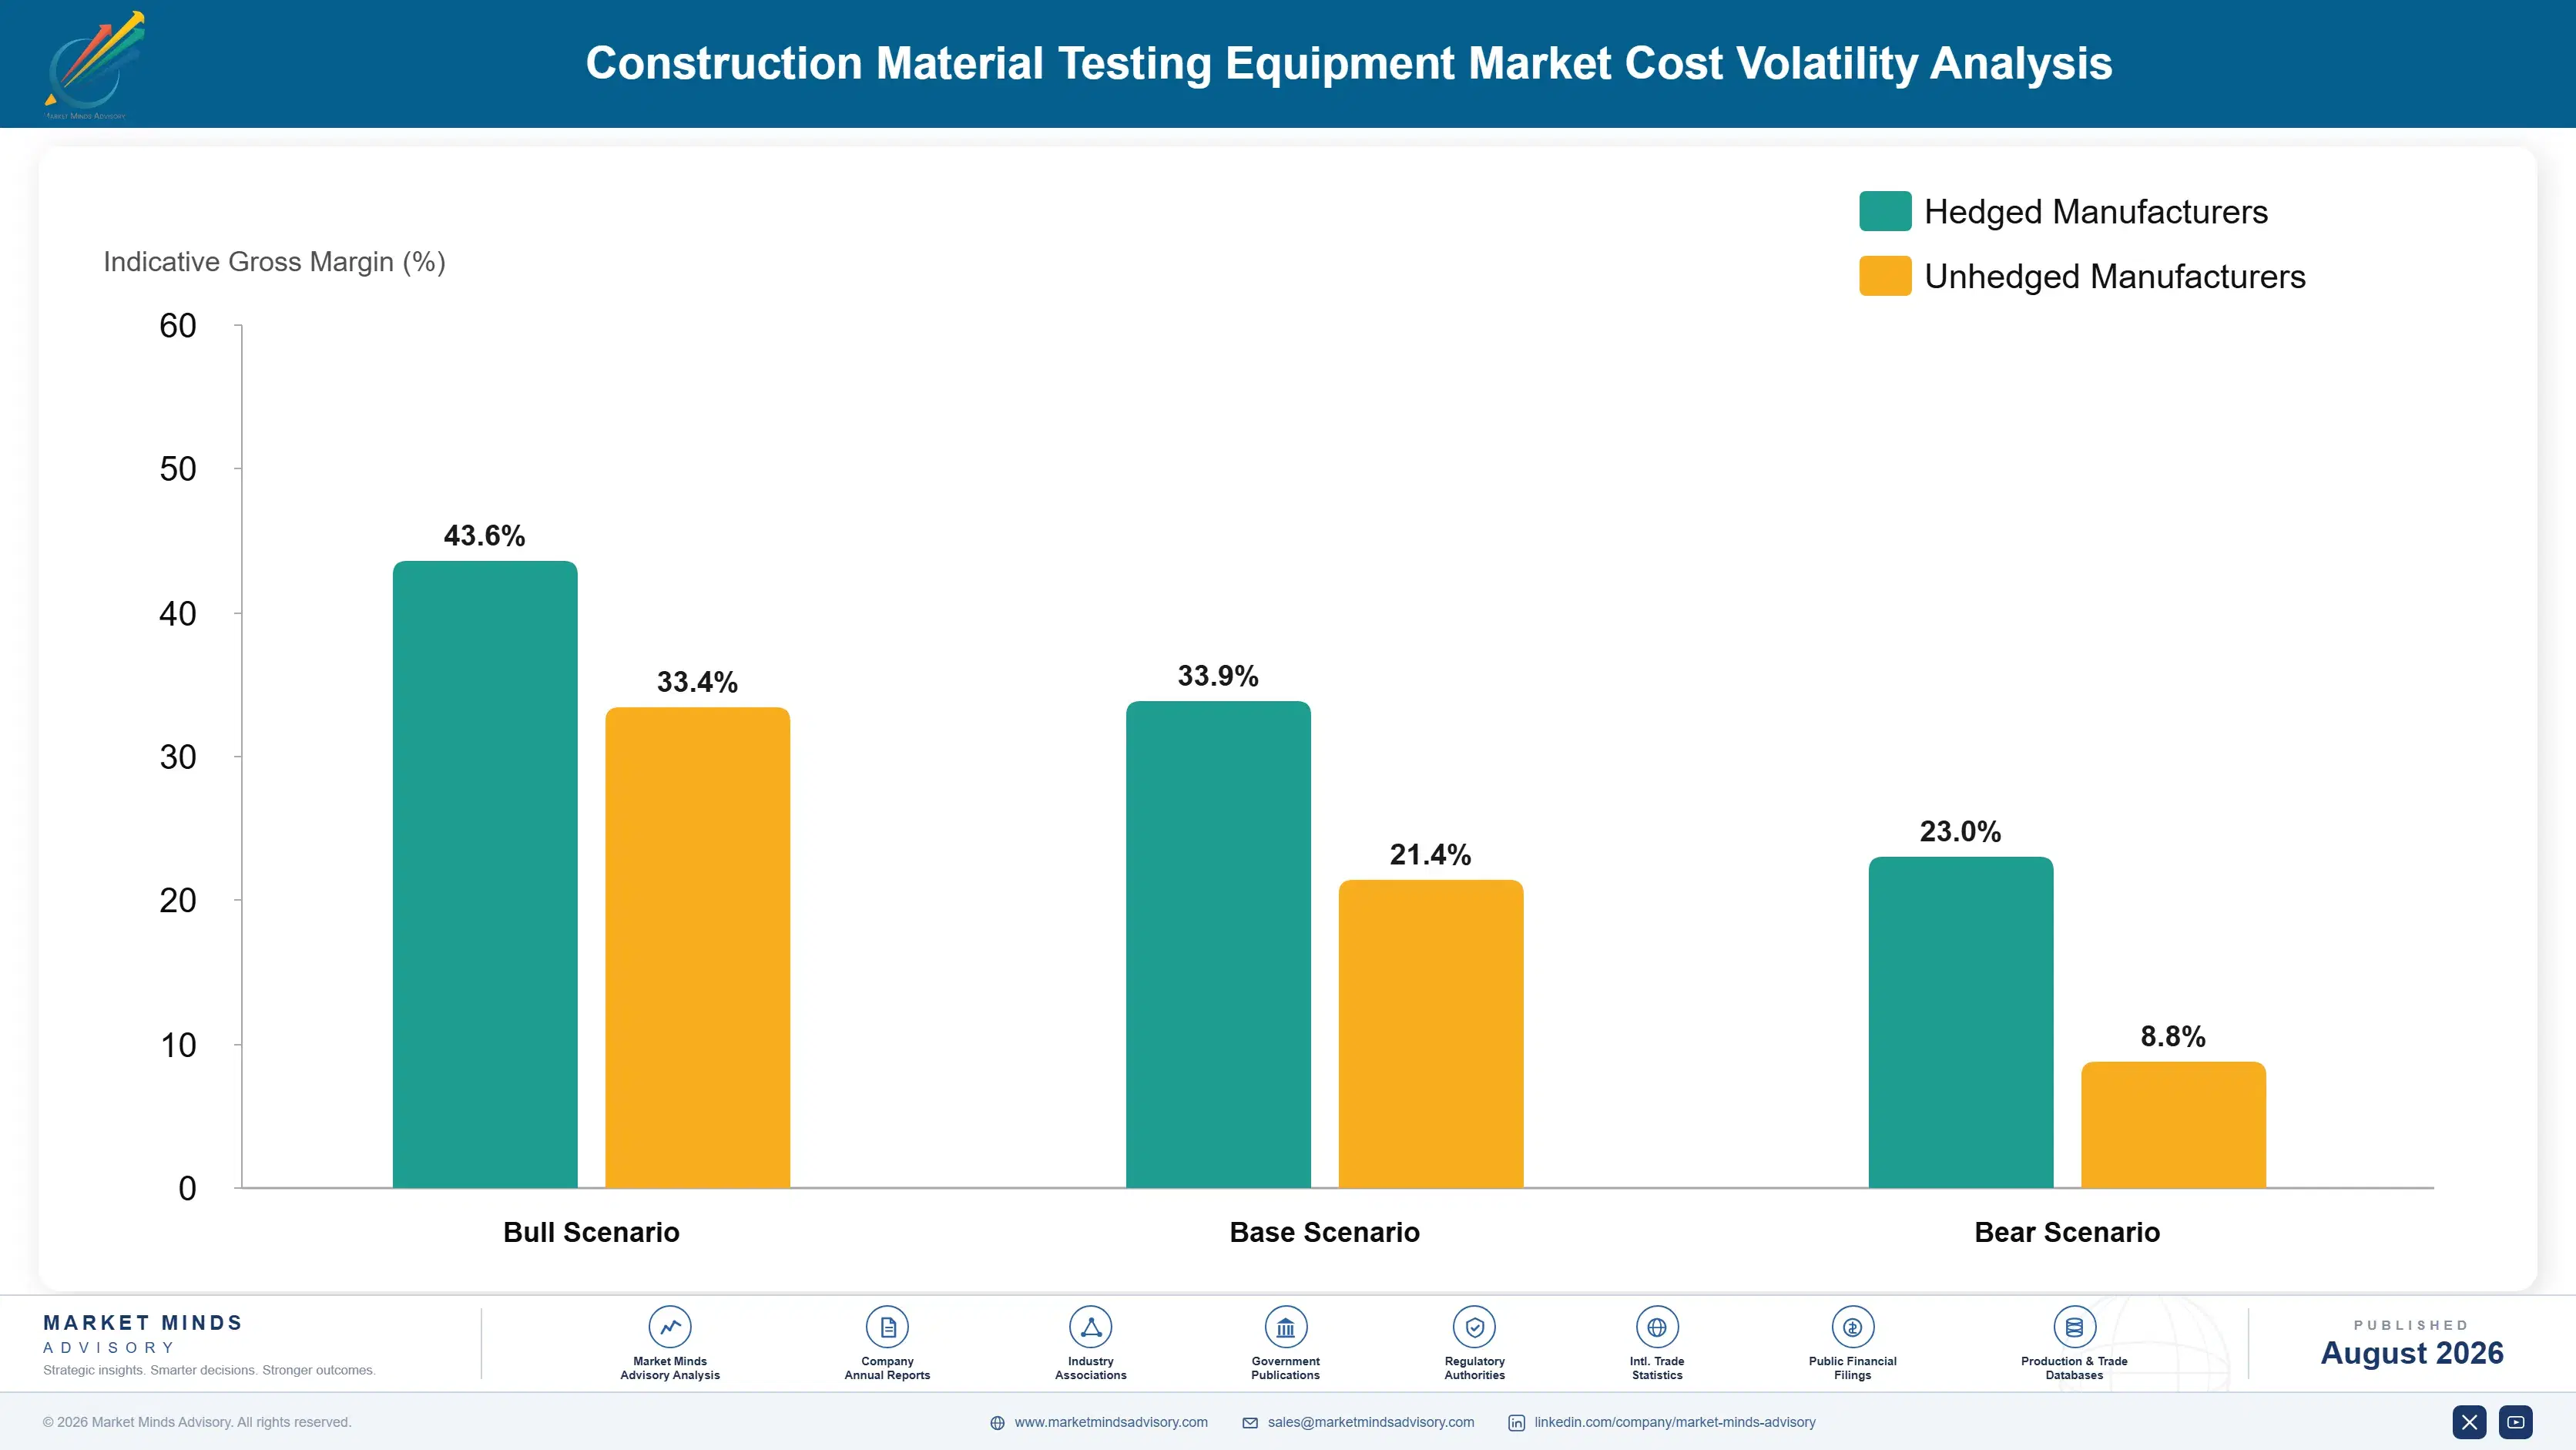
Precision Steel Supply Sets the Cost Ceiling

Precision steel load frames and calibrated sensors together account for roughly 23% to 33% of testing equipment product COGS, sourced primarily from specialty steel producers in Germany, the United States, and Japan. Digital data acquisition electronics and certification testing add a further 14% to 20%, reflecting the accredited third-party validation every new equipment configuration requires.
Precision steel and sensor component prices rose meaningfully through 2024 as global demand for testing and measurement equipment competed directly with broader industrial automation uses for the same specialty component capacity, according to trade data. Instron's 2024 annual report disclosed higher input costs attributable to steel and electronics intermediate inflation, noting that raw material costs rose meaningfully faster than the company could pass through to laboratory customers without meaningful margin compression across its testing equipment product segment specifically.

Smaller specialty testing equipment manufacturers carry more exposure than the largest diversified suppliers, since they lack the purchasing scale to negotiate favorable long-term steel and sensor supply contracts. Suppliers sourcing components from a concentrated set of producers face additional exposure to capacity and price volatility, while diversified suppliers absorb volatility more predictably across their broader, globally diversified supply chain relationships.
construction-material-testing-equipment-market-cost-volatility-analysis-1787301911975

Lock Steel and Sensor Pricing Through Annual Contracts

Precision steel and calibrated sensors are the largest single volatile inputs across most testing equipment product lines and increasingly competed for by broader industrial automation demand across multiple sectors. Annual supply agreements with fixed or collared pricing, common practice among larger diversified suppliers, smooth quarter-to-quarter volatility and let commercial teams quote customer contracts with genuine confidence.

Diversify Component Sourcing Across Producers

Reliance on a single steel or sensor producer concentrates both price and availability risk unnecessarily across an entire testing equipment product line. Qualifying secondary suppliers across multiple regions, even at modestly higher unit cost, protects continuity when any single producer faces capacity outage or a sudden demand spike from competing industrial sectors expanding simultaneously.

Portfolio Architecture for Margin Defence

The portfolio splits into three tiers with meaningful margin separation tied to calibration depth and testing technology. Volume tier products carry standard manual compression and flexural testing machines for conventional laboratory applications, competing largely on price against a crowded field of regional suppliers. Premium certified products carry digital automated and non-destructive testing systems backed by documented traceability data. Sustainability products, including remote-monitori
The tension between volume and premium runs through nearly every supplier's product roadmap. Volume products fund the manufacturing scale premium products eventually depend on, yet volume margins keep compressing as Chinese manufacturers scale aggressively on conventional manual designs. Suppliers that under-invest in premium calibration breadth risk commoditization within their own category, while those chasing premium exclusively struggle to fund the manufacturing base needed to serve routine laboratory demand.

High-value margin pools concentrate specifically in digital automated and non-destructive testing systems where calibration depth and documented traceability performance carry the largest commercial stakes, and where certification breadth commands genuine pricing power. Conventional manual testing machines generate steadier volume but thinner margin, since that segment competes against a wider set of lower-cost regional suppliers with adequate but unremarkable certification differentiation.

Volume / Commodity-Adjacent Tier

Standard manual compression and flexural testing machines for conventional laboratory applications, competing largely on price against a crowded field of regional suppliers offering broadly comparable certification coverage and build quality.
Gross Margin: 16-25%

Premium / Certified Tier

Digital automated and non-destructive testing systems backed by documented traceability data and formal accreditation qualification, commanding meaningful pricing premiums over standard equivalents across major regulated markets and multinational customer accounts.
Gross Margin: 28-40%

Sustainability / Regulatory / Next-Generation Tier

Remote-monitoring enabled testing systems still scaling across infrastructure inspection and laboratory applications, targeting compliance outcomes conventional equipment simply cannot achieve under current and anticipated future standards worldwide across every regulated market.
Gross Margin: 32-46%
construction-material-testing-equipment-market-portfolio-architecture-1787301912496

The Annuity Behind Every Replacement

Testing equipment demand behaves like an annuity once a laboratory commits to a specific supplier's calibration data, since switching vendors requires costly laboratory-specific requalification testing and updated accreditation documentation across every affected test method. That structure rewards incumbency heavily: a supplier that wins the initial installation contract keeps the customer relationship through multiple replacement cycles unless a competitor demonstrates a meaningful accuracy or
Adoption stickiness varies meaningfully by end-use vertical once a supplier's equipment is qualified into a laboratory's accreditation scope. Transportation agencies rarely switch testing equipment suppliers mid-contract because requalifying certification against a new vendor risks accreditation interruption during testing, so switching costs run high. University research laboratories show similar loyalty tied to established calibration relationships, while general commercial applications switch more readily since specifications are less exacting and price competition dominates purchasing decisions.

Buyer profiles are shifting generationally as laboratory managers increasingly favor suppliers offering digital monitoring and predictive calibration data over those selling hardware alone. Younger laboratory technicians trained on connected testing systems expect equipment that reports its own condition, a preference reshaping which suppliers win replacement contracts as incumbent decision-makers retire.
construction-material-testing-equipment-market-end-use-penetration-index-1787301912990

What Suppliers Should Do Next

These are among the four positions where our research anticipates prominent divergence between winners and laggards over the coming forecast period. Each is grounded in the demand model, the regulatory perimeter, and the announced capacity pipeline.
01 / CALIBRATION DEPTH STRATEGY

Build the deepest traceable calibration library before rivals do

Buyers now pay a documented premium for certified breadth rather than raw load capacity alone, and that premium is widening as laboratory managers increasingly specify minimum calibration documentation before approving procurement across every affected accreditation budget. Suppliers without comprehensive calibration libraries will find themselves squeezed into commodity price competition, where ten points of margin separate certified leaders from untested followers across most agency accounts. The investment case favors calibration depth over manufacturing scale alone, particularly for suppliers targeting large multi-site accounts.
02 / BUNDLED TESTING POSITIONING

Bundle non-destructive and standard testing ahead of integration mandates

Transportation agencies increasingly want a single accountable vendor for complete infrastructure assessment rather than sourcing destructive and non-destructive testing separately from different specialists across their inspection programs and shared reporting systems. Suppliers without bundling capability increasingly lose bids among agencies standardizing on integrated testing packages, regardless of individual component quality on either side of the sale. Those building bundled offerings now, ahead of rivals still selling components separately, will capture disproportionate share as integration mandates spread across every major regulated market.
03 / INFRASTRUCTURE FUNDING POSITIONING

Expand distribution across North American infrastructure funding programs now

The US Infrastructure Investment and Jobs Act and its expanding bridge inspection funding are creating a predictable demand wave that rewards suppliers who establish regional distribution ahead of funding cycles coming online rather than scrambling once agencies are already committed elsewhere and contractually locked in. Transportation agencies facing funding deadlines cannot wait for new supplier qualification to complete elsewhere, which means late-moving suppliers miss the premium pricing window entirely regardless of eventual equipment performance. Suppliers positioning now will capture disproportionate share.
04 / ACCREDITATION SUPPORT POSITIONING

Offer embedded accreditation support to capture full laboratory value

Engineering capacity for embedded accreditation support has repeatedly struggled to keep pace with sudden demand spikes when infrastructure funding cycles take effect, creating temporary shortages that reward suppliers who invested in support capacity ahead of the wave rather than reactively scrambling once demand materializes. Suppliers with pre-positioned support teams can capture premium project pricing during accreditation cycles, since laboratory operators facing funding deadlines cannot wait for capacity elsewhere. Suppliers investing ahead of the next funding wave will capture disproportionate share.

Engagement Snapshot From the Field

A live engagement with an industry participant carrying material or product regulatory and market exposure ahead of a defining policy shift, showing how our research translates into a defensible multi-year portfolio strategy.
MARKET MINDS ADVISORY · CLIENT ENGAGEMENT SUMMARY
Construction Material Testing Equipment Producer Strategic Portfolio Review and Transition Roadmap 2026·Investment Scenario on Construction Material Testing Equipment Exposure Evaluation 2025-26
CLIENT PROFILE
A regional North American state transportation department operating nine material testing laboratories across its highway district network, providing quality assurance compliance testing for road and bridge construction projects statewide. The client generated approximately 190 million dollars in annual infrastructure program funding (client-reported, unverified by MMA) and faced mounting pressure to complete digital testing conversion ahead of federal funding deadlines.
STRATEGIC CHALLENGE
The client needed to select testing equipment suppliers for a fleet-wide digital conversion program across nine laboratories while minimizing service interruption during installation across multiple simultaneous testing programs. Leadership also questioned whether to prioritize established suppliers offering full calibration certification depth or evaluate lower-cost alternatives with narrower certified performance data.
MMA APPROACH
MMA conducted supplier benchmarking across five testing equipment vendors using primary interviews with laboratory managers and agency procurement staff, alongside analysis of certified calibration data and installation downtime requirements for each candidate system. The engagement mapped total cost of ownership across a fifteen-year operating horizon rather than upfront equipment price alone.
KEY FINDINGS
  1. Two of five candidate suppliers lacked sufficient certified calibration depth for the client's specific test method requirements, narrowing realistic options considerably ahead of the deadline.
  2. The leading candidate's digital data logging technology eliminated a costly manual documentation process the client's prior analog fleet would have otherwise required.
  3. Bundled non-destructive testing packages reduced total installation project time by roughly 23 percent (client-reported, unverified by MMA) compared with separate component sourcing overall.
  4. A phased laboratory-by-laboratory replacement approach, prioritizing the laboratory closest to fleet end of life first, reduced operational risk considerably compared with simultaneous conversion.
CLIENT PROFILE
A regional North American state transportation department operating nine material testing laboratories across its highway district network, providing quality assurance compliance testing for road and bridge construction projects statewide. The client generated approximately 190 million dollars in annual infrastructure program funding (client-reported, unverified by MMA) and faced mounting pressure to complete digital testing conversion ahead of federal funding deadlines.
STRATEGIC CHALLENGE
The client needed to select testing equipment suppliers for a fleet-wide digital conversion program across nine laboratories while minimizing service interruption during installation across multiple simultaneous testing programs. Leadership also questioned whether to prioritize established suppliers offering full calibration certification depth or evaluate lower-cost alternatives with narrower certified performance data.
MMA APPROACH
MMA conducted supplier benchmarking across five testing equipment vendors using primary interviews with laboratory managers and agency procurement staff, alongside analysis of certified calibration data and installation downtime requirements for each candidate system. The engagement mapped total cost of ownership across a fifteen-year operating horizon rather than upfront equipment price alone.
KEY FINDINGS
  1. Two of five candidate suppliers lacked sufficient certified calibration depth for the client's specific test method requirements, narrowing realistic options considerably ahead of the deadline.
  2. The leading candidate's digital data logging technology eliminated a costly manual documentation process the client's prior analog fleet would have otherwise required.
  3. Bundled non-destructive testing packages reduced total installation project time by roughly 23 percent (client-reported, unverified by MMA) compared with separate component sourcing overall.
  4. A phased laboratory-by-laboratory replacement approach, prioritizing the laboratory closest to fleet end of life first, reduced operational risk considerably compared with simultaneous conversion.
RECOMMENDED STRATEGY
Phase 1: Phase one: replace equipment at the laboratory closest to fleet end of life first using the leading digital and monitoring bundle identified. Phase 2: Phase two: complete replacements across the remaining eight laboratories, carefully sequencing all installation work around planned maintenance windows to limit downtime. Phase 3: Phase three: establish an internal fleet tracking process to flag future replacement needs well before end of life approaches at any site.
OUTCOME
The department completed fleet-wide digital conversion across all nine laboratories within the funding-imposed compliance window, avoiding any unplanned service suspension, and the bundled approach reduced total documentation time meaningfully compared with the client's prior analog fleet history (client-reported, unverified by MMA). The fleet tracking process is now flagging future replacement needs earlier.

Frequently Asked Questions

Foundational context covering the market sizes, CAGR, scope, country, region and competition that inform every finding below. This section is provided to cover basics and most often pre-purchase conversations, answered from the MMA Primary Research Dataset.

What is the current size of the Construction Material Testing Equipment Market?

The global construction material testing equipment market reached 2.6 billion dollars in 2025, with transportation and building compliance applications accounting for most of that demand base.

How large will the Construction Material Testing Equipment Market be by 2036?

The market is projected to reach 5.14 billion dollars by 2036, representing a 1.86 times expansion over the eleven-year forecast period driven by digital and infrastructure demand.

What is the CAGR for the Construction Material Testing Equipment Market 2026 to 2036?

The market is forecast to grow at a 6.4% compound annual rate, with bull and bear scenarios ranging from 7.6% to 5.1% depending on infrastructure investment pace.

Which segment is growing fastest?

Digital and automated testing systems with data logging lead at a 10.0% CAGR, roughly 1.56 times the overall market rate, as quality assurance documentation demands intensify.

Who are the major companies in the Construction Material Testing Equipment Market?

Instron, MTS Systems, Zwick Roell, Controls Group, and Humboldt Mfg. all lead this field today, together holding 38% of global output on a consistent revenue basis.

Which country is growing fastest?

China leads national growth at an estimated 7.9% CAGR, driven by its continued infrastructure investment and tightening quality assurance documentation enforcement across major provincial construction sectors.

Report Segmentation Architecture

The full report scope spans multiple orthogonal segmentation dimensions, with cross-tabulated demand data provided for each dimension pair. Coverage extends further to regional breakdowns, trend trajectories, and the competitive detail needed to support segment-level decision-making.

By Primary Market Dimension

  • Compression and Flexural Testing Machines
  • Universal Testing Machines
  • Aggregate and Soil Testing Equipment
  • Non-Destructive Testing Equipment
  • Asphalt and Bituminous Testing Equipment
  • Digital and Automated Testing Systems

By End-Use Industry

  • Transportation and Highway Infrastructure
  • Commercial and Residential Building Construction
  • Government and Public Works Agencies
  • University and Research Laboratories
  • Private Testing Laboratories

By Commercial Dimension

  • Direct Agency Contract Sales
  • Distributor and Wholesale Sales
  • Embedded Accreditation Support Services
  • Calibration and Maintenance Services

By Region

  • North America
  • Western Europe
  • East Asia
  • South Asia and Pacific
  • Latin America
  • Middle East and Africa
  • Eastern Europe

Scope, Methodology, and Coverage

Every figure in this report is reproducible from documented input assumptions. The scope below maps the historical period, the forecast horizon, the segmentation dimensions, and the countries covered, alongside the underlying primary and qualitative methodology.
Historical Period
2020 to 2025
Forecast Period
2026 to 2036
Base Year
2025 (USD billions; MMA Primary Research Dataset, August 2026)
Market Definition
This report covers equipment used to test the physical and mechanical properties of concrete, aggregate, asphalt, soil, and steel reinforcement for construction quality assurance and compliance purposes, including compression, flexural, universal, and non-destructive testing technologies. It includes manual and digital automated configurations across all accredited test methods. It excludes chemical composition analysis instruments and standalone survey equipment sold without accompanying material testing hardware.
Quantitative Units
USD billions (current prices); unit shipment volume where applicable
Segmentation Dimensions
By Primary Market Dimension; By End-Use Industry; By Commercial Dimension; By Region
Regions Covered
North America, Western Europe, East Asia, South Asia and Pacific, Latin America, Middle East and Africa, Eastern Europe
Countries Covered
USA, China, Germany, France, UK, Japan, South Korea, India, Australia, Canada, Brazil, Mexico, Indonesia, Vietnam, Thailand, Malaysia, UAE, Saudi Arabia, South Africa, Nigeria, Turkey, Poland, Netherlands, Italy, Spain, Sweden, Switzerland, Argentina, Colombia, Singapore, and additional markets relevant to this sector
Key Companies Profiled
Instron; MTS Systems Corporation; Zwick Roell AG; Controls Group S.p.A.; Humboldt Mfg. Co.; ELE International Limited; Matest S.p.A.; Cooper Research Technology Ltd.; Forney LP; Gilson Company Inc.; Utest Material Testing Equipment; Wykeham Farrance; Pavetest Pty Ltd.; Impact Test Equipment Ltd.; James Cox & Sons Inc.; Test Mark Industries; Geneq Inc.; ProQuip Inc.; Aimil Ltd.; Karol-Warner LLC
Quantitative Methodology
Primary survey, n=3,800 respondents, Q4 2025, six countries; demand-side model with trade association cross-validation
Qualitative Methodology
47 expert interviews, Q4 2025; applied to validate demand model assumptions, identify emerging dynamics, and assess competitive positioning
Report Format
PDF and XLSX data workbook (Word format preview document)
Publisher
Market Minds Advisory
Report Code
MMA-2026-CON-308
Published
August 2026
Contact
sales@marketmindsadvisory.com | www.marketmindsadvisory.com

Purchase the full Construction Material Testing Equipment Market Report (2026 to 2036).

The full report provides complete segmentation data across all six testing technology segments, detailed profiles of the top twenty market participants, and country-level analysis across all seven global regions covered by this study. It includes a proprietary MMA calibration depth index built from primary survey data collected across forty-seven expert interviews conducted throughout the fourth quarter of 2025. Buyers also receive quarterly market updates through the end of 2026. Direct analyst access is included for methodology questions or custom data requests specific to their strategic priorities.
Full seven-region CAGR and market share breakdown
Twenty-company competitive profile database included in full
Segment-level pricing and gross margin analysis
Precision steel input cost exposure tracking model
Quarterly market update subscription through 2026
Direct analyst access for custom data queries

Built For The People Who Decide

From boardroom strategy to bench-side execution, this report is read cover-to-cover by leaders shaping the next decade of their industry, turning demand scenarios, market dynamics and valuation benchmarks into decisions.
CXOs/ Presidents/ VPs/ Managers
M&A and Corporate Development
Strategy Teams and R&D Heads
Procurement and Product Directors
Regulatory and Compliance Leaders
Investor Relations and Equity Analysts