Market Minds Advisory
Construction Equipment Fleet Management Software Market

Construction Equipment Fleet Management Software Market: Construction Equipment Fleet Management Software Market. Telematics and Predictive Maintenance Reshape Fleet Operating Economics

Contractors managing aging mixed-brand fleets and tightening emissions regulations are colliding as telematics platforms shift from simple location tracking toward predictive maintenance software that prevents costly unplanned equipment downtime industry-wide.

Lead Analyst

Published

September 2026

Make Smarter Decisions with Customized Research Insights

Request a free sample report and evaluate market opportunities, growth trends, and competitive dynamics relevant to your business needs.

2025 MARKET VALUE$3.6BMarket Size 2025
2036 FORECAST VALUE$11.9BBase Case , 2026 to 2036
CAGR 2026 TO 203611.5 %Bull 12.8% / Bear 10.2%
INCREMENTAL OPPORTUNITY$7.9BNet 10- year value creation
EXPANSION MULTIPLE2.97x2036 value over 2026 base
Strategic Levers
M&A Pipeline
Regional Outlook
Country Rankings
Competitive Intelligence
Segmental Deep-dive
Call-Us : 91 93563 13602

Executive Snapshot and Market Trajectory.

Construction fleet operators managing mixed-brand equipment across dozens of active job sites nationwide are consolidating onto unified telematics platforms that finally aggregate data across competing original equipment manufacturer systems previously siloed entirely, cutting fleet manager reporting time meaningfully across most active operating regions and equipment classes today.
Predictive maintenance capability is scaling fastest, as contractors seek to convert unplanned downtime into scheduled service windows that avoid costly project delay penalties written into most modern general contractor agreements today across the industry as a whole. Fuel and emissions management software is close behind, driven by tightening state-level emissions standards and contractors' own internal sustainability reporting commitments to major commercial clients across multiple active regions. Vendors are racing to close both feature gaps simultaneously.
Original equipment manufacturers, telematics specialists, and construction management software vendors all compete for fleet software budgets, with OEMs increasingly opening proprietary data standards to third-party integrators under sustained customer pressure to interoperate freely across mixed-brand fleets. Consolidation activity is accelerating as larger platforms acquire specialized maintenance and compliance point solutions to offer single-platform coverage across the entire fleet management workflow nationwide this decade.
Market Definition
This report covers software platforms used by construction contractors and equipment rental firms to track, dispatch, and maintain heavy equipment fleets, including telematics, predictive maintenance, utilization analytics, and compliance reporting modules, measured on a global vendor revenue basis. It excludes standalone GPS hardware sold without an accompanying software platform subscription.
Base Year Value
$3.6B in 2025 (MMA Primary Research Dataset, September 2026)
Forecast Period
2026 to 2036, eleven discrete annual values
CAGR
11.5% base case. Bull 12.8%. Bear 10.2%.
Fastest Growth Segment
Predictive Maintenance and Diagnostics: 15.0% CAGR
Fastest Growth Country
India: 18.0% CAGR
Fastest Growth Region
South Asia and Pacific: 13.5% CAGR
Largest Region
North America: 32% of 2025 global value
Market Leaders
Caterpillar, Trimble, Komatsu, Volvo Construction Equipment, John Deere
Primary Survey
n=3,800 procurement and R&D decision-makers, Q4 2025, six countries
Methodology
Demand-side build-up, cross-validated against public data, 47 expert interviews

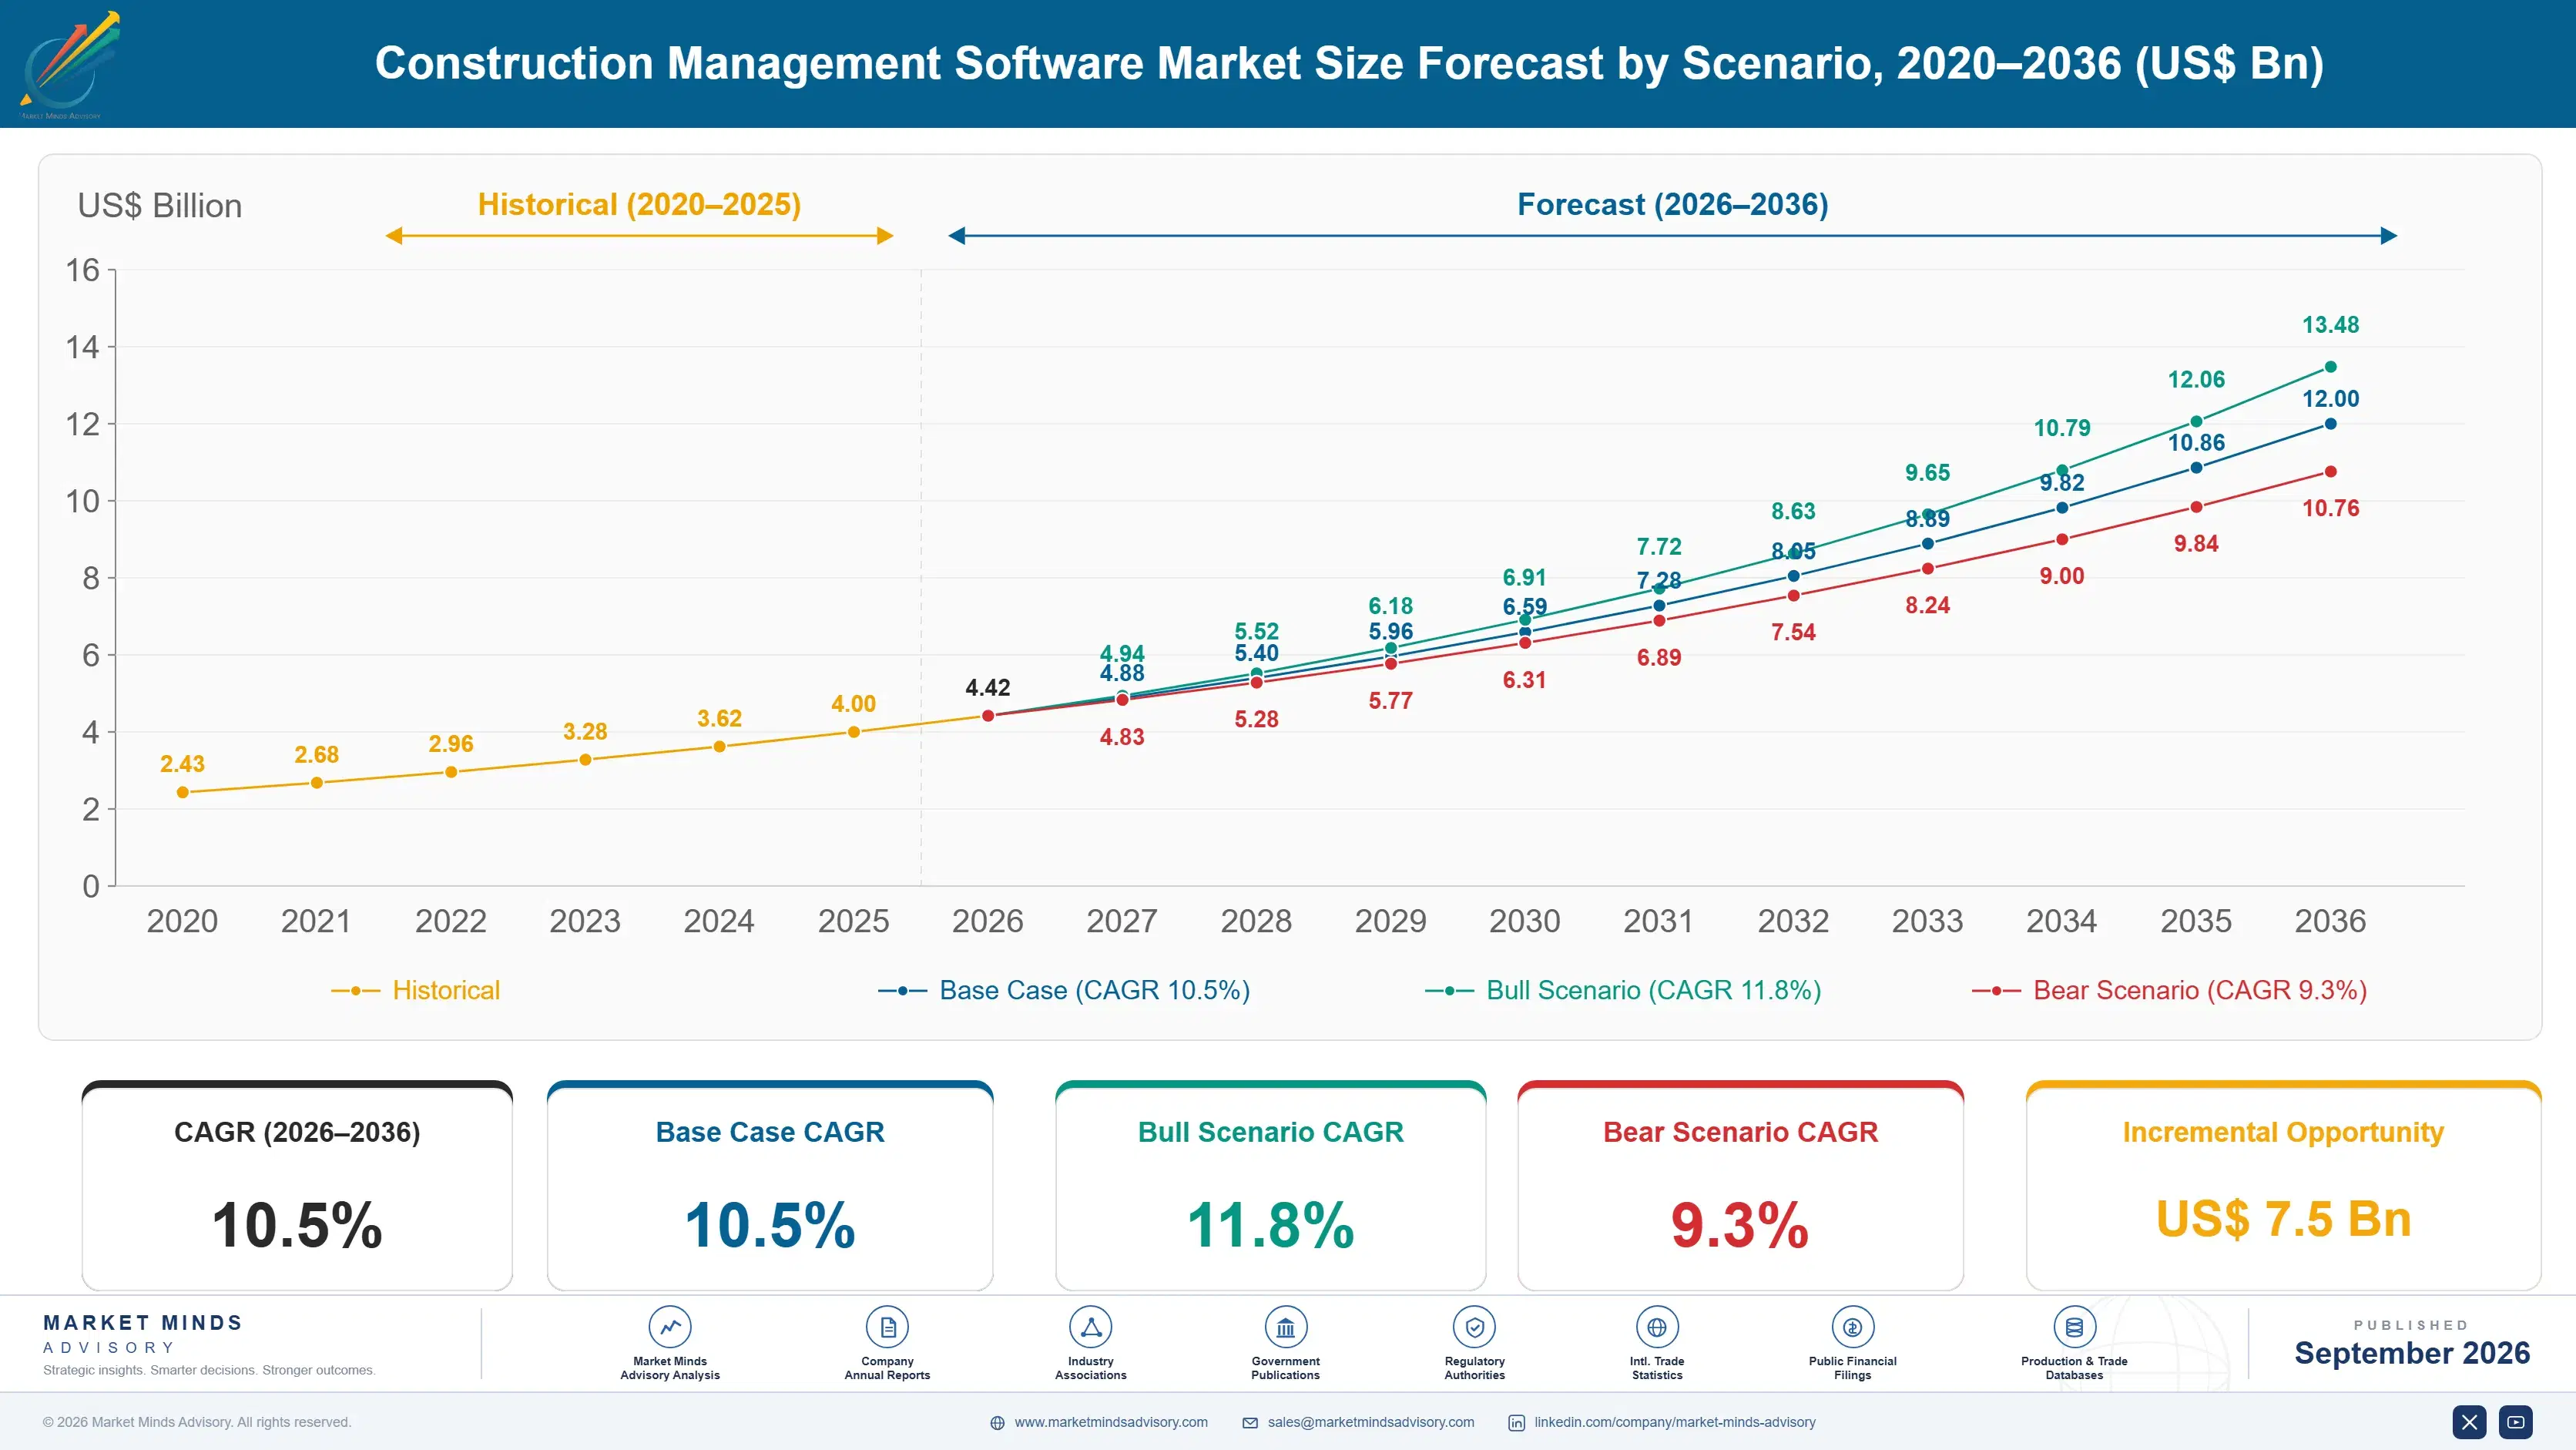
Construction Management Software Market Forecast Scenarios

construction-equipment-fleet-management-software-m-size-forecast-scenario-1788418964587
Between 2020 and 2025 the construction management software market grew steadily as pandemic-era remote collaboration needs and a persistent skilled labor shortage pushed contractors toward digital jobsite coordination tools faster than prior technology adoption cycles ever required across the industry as a whole, reshaping contractor purchasing priorities. The historical annual growth rate held near 9.2 percent across the full period.
The base case assumes skilled labor shortages persist across major construction markets, project complexity keeps rising as buildings incorporate more specialized mechanical and electrical systems requiring tighter subcontractor coordination today, and BIM mandate requirements expand across additional government and large private construction projects. These three mechanisms together sustain a forecast compound annual growth rate near 10.5 percent through 2036, with field collaboration software capturing an outsized share of incremental revenue.
The bull case assumes labor shortages intensify faster than currently expected, pushing growth toward 11.8 percent as contractors accelerate digital coordination adoption across most major metropolitan construction markets nationwide. The bear case assumes a construction industry downturn reduces new project starts meaningfully, capping growth near 9.3 percent as contractors delay software upgrades pending clearer demand signals from developers.

Predictive Maintenance Becomes the New Fleet Software Battleground

Fleet management software sits at the intersection of original equipment manufacturer hardware platforms and independent telematics platforms, forcing contractors to choose between OEM-native tools with deeper machine data access and third-party platforms offering broader mixed-brand fleet visibility. That tradeoff shapes nearly every purchasing decision contractors make, since most active fleets mix equipment from at least three or four different manufacturers simultaneously.
MARKET CONCENTRATIONCR5 42%Fragmented across OEM platforms and independent telematics vendors
AVERAGE SUBSCRIPTION COST$450 per unit monthlyReflects module count and equipment class covered per unit
TOP ADOPTING SEGMENT SHARERental fleets 38%Concentrated among operators maximizing utilization of shared assets
TELEMATICS PENETRATION RATE64% of active fleetsShare of tracked equipment currently running telematics hardware today
AVERAGE CONTRACT LENGTH3 yearsTypical subscription commitment length across most enterprise fleet accounts
IT BUDGET SHAREFleet software 9%Portion of contractor technology budgets allocated to fleet software
Predictive maintenance is now the dominant technical differentiator, as contractors increasingly select platforms based on how accurately they forecast component failure before it causes unplanned downtime on an active job site. Vendors slow to build genuine predictive capability, relying instead on basic scheduled maintenance reminders, are losing renewal negotiations to competitors offering real failure prediction backed by machine learning models trained on fleet data.
Consolidation is reshaping vendor choice as larger platforms acquire specialized maintenance and compliance point solutions to offer unified coverage across the full fleet management workflow from acquisition through disposal. Contractors increasingly prefer consolidating vendor relationships to reduce integration overhead, even when that means accepting a less specialized tool for a specific workflow step in exchange for unified data visibility across the entire fleet.
"Contractors used to buy telematics for location tracking alone. Now they're buying it to predict which hydraulic pump fails next month, and that shift changes who wins the renewal conversation entirely."
Practice Lead, Construction Technology and Fleet Operations · MMA Construction Equipment Telematics and Fleet Management Software Practice · September 2026

Market Trends

AI-Driven Predictive Maintenance Models Reach Production Scale

Vendors are moving predictive maintenance from pilot programs into standard production features, training machine learning models on years of accumulated sensor data across thousands of individual machines to forecast component failure weeks in advance rather than days. This shift lets contractors schedule maintenance windows around active project timelines rather than reacting to breakdowns mid-shift. Roughly 64 percent of active fleets now carry telematics hardware capable of feeding these models, up sharply from a much smaller base just five years ago, and vendors report accelerating adoption inquiries from contractors still running fleets without any predictive capability at all.
Market Impact: Sustains utilization above 78% industry average
OEMs Open Proprietary Data Standards to Third Parties

Major equipment manufacturers, facing sustained customer pressure to support mixed-brand fleet visibility, are opening proprietary telematics data standards to third-party integration partners rather than keeping fleet data locked within single-brand platforms exclusively. This shift lets contractors running equipment from four or five different manufacturers finally view utilization and maintenance data through one unified dashboard rather than switching between separate brand-specific applications throughout the workday on active job sites. Several major manufacturers have signed formal data-sharing agreements with independent telematics platforms within the past two years alone, with more expected soon.
Market Impact: Reduces compliance penalty exposure by 30%

Market Opportunities and Growth Drivers

Federal Infrastructure Spending Sustains Equipment Utilization Rates

Continued federal infrastructure investment, funding thousands of active highway, bridge, and utility projects nationwide, keeps construction equipment utilization elevated and sustains contractor demand for fleet software that maximizes output from an already stretched asset base. Each new project awarded adds recurring usage and licensing demand for fleet management platforms, independent of broader macroeconomic cycles that affect discretionary commercial construction spending more directly than publicly funded infrastructure work. Contractors managing federally funded project backlogs increasingly view fleet software licensing as a fixed operating cost tied directly to project margin protection rather than a discretionary purchase they can defer indefinitely.
Market Impact: Adds 3 to 6 months

State Emissions Regulations Mandate Fleet Reporting Compliance

Several major states have implemented off-road equipment emissions reporting requirements over the past few years, pushing contractors to adopt software capable of tracking engine hours, fuel consumption, and emissions output at a granularity most legacy fleet systems were never designed to capture automatically. Contractors that fail to report accurately face financial penalties and potential exclusion from public sector bidding processes that require documented compliance. Emissions-ready reporting has become a genuine competitive differentiator among vendors, with several now marketing compliance certification as a core selling point in competitive procurement processes against rival platforms nationwide.
Market Impact: Leaves 22% of contractors unaddressed

Market Restraints and Challenges

Mixed-Brand Integration Complexity Delays Full Fleet Visibility

Contractors running equipment from four or five different manufacturers face genuine technical friction integrating each brand's proprietary telematics data feed into a single unified dashboard, even as OEMs gradually open data standards to third parties. The root cause is that older equipment, particularly machines more than a decade old, often lacks the onboard telematics hardware needed to participate in modern data-sharing agreements. The commercial impact shows up as fleet visibility projects running three to six months longer than vendors initially estimate. Some vendors now offer dedicated retrofit hardware kits to close that visibility gap faster.
Market Impact: Adds 64% telematics-equipped fleet penetration

Small Contractors Resist Software Subscription Cost Increases

Small contractors running fewer than a dozen machines often view dedicated fleet management software as an unnecessary expense when basic spreadsheet tracking, however limited, still technically covers their smaller operational scale and simpler reporting needs. The underlying cause is that per-unit subscription costs represent a proportionally larger burden for small contractors than for large fleets spreading the same fixed cost across hundreds of machines. The commercial impact is a persistent addressable market gap among the smallest contractors that vendors have struggled to profitably serve. Several vendors are now piloting simplified, lower-cost tiered pricing plans targeting this underserved smaller-contractor segment.
Market Impact: Covers 5+ major OEM brands
3 additional market trends, 4 additional growth drivers, and 3 additional restraints and challenges are covered in the full report. Contact sales@marketmindsadvisory.com to access the complete intelligence.

Segment CAGR and Growth Architecture

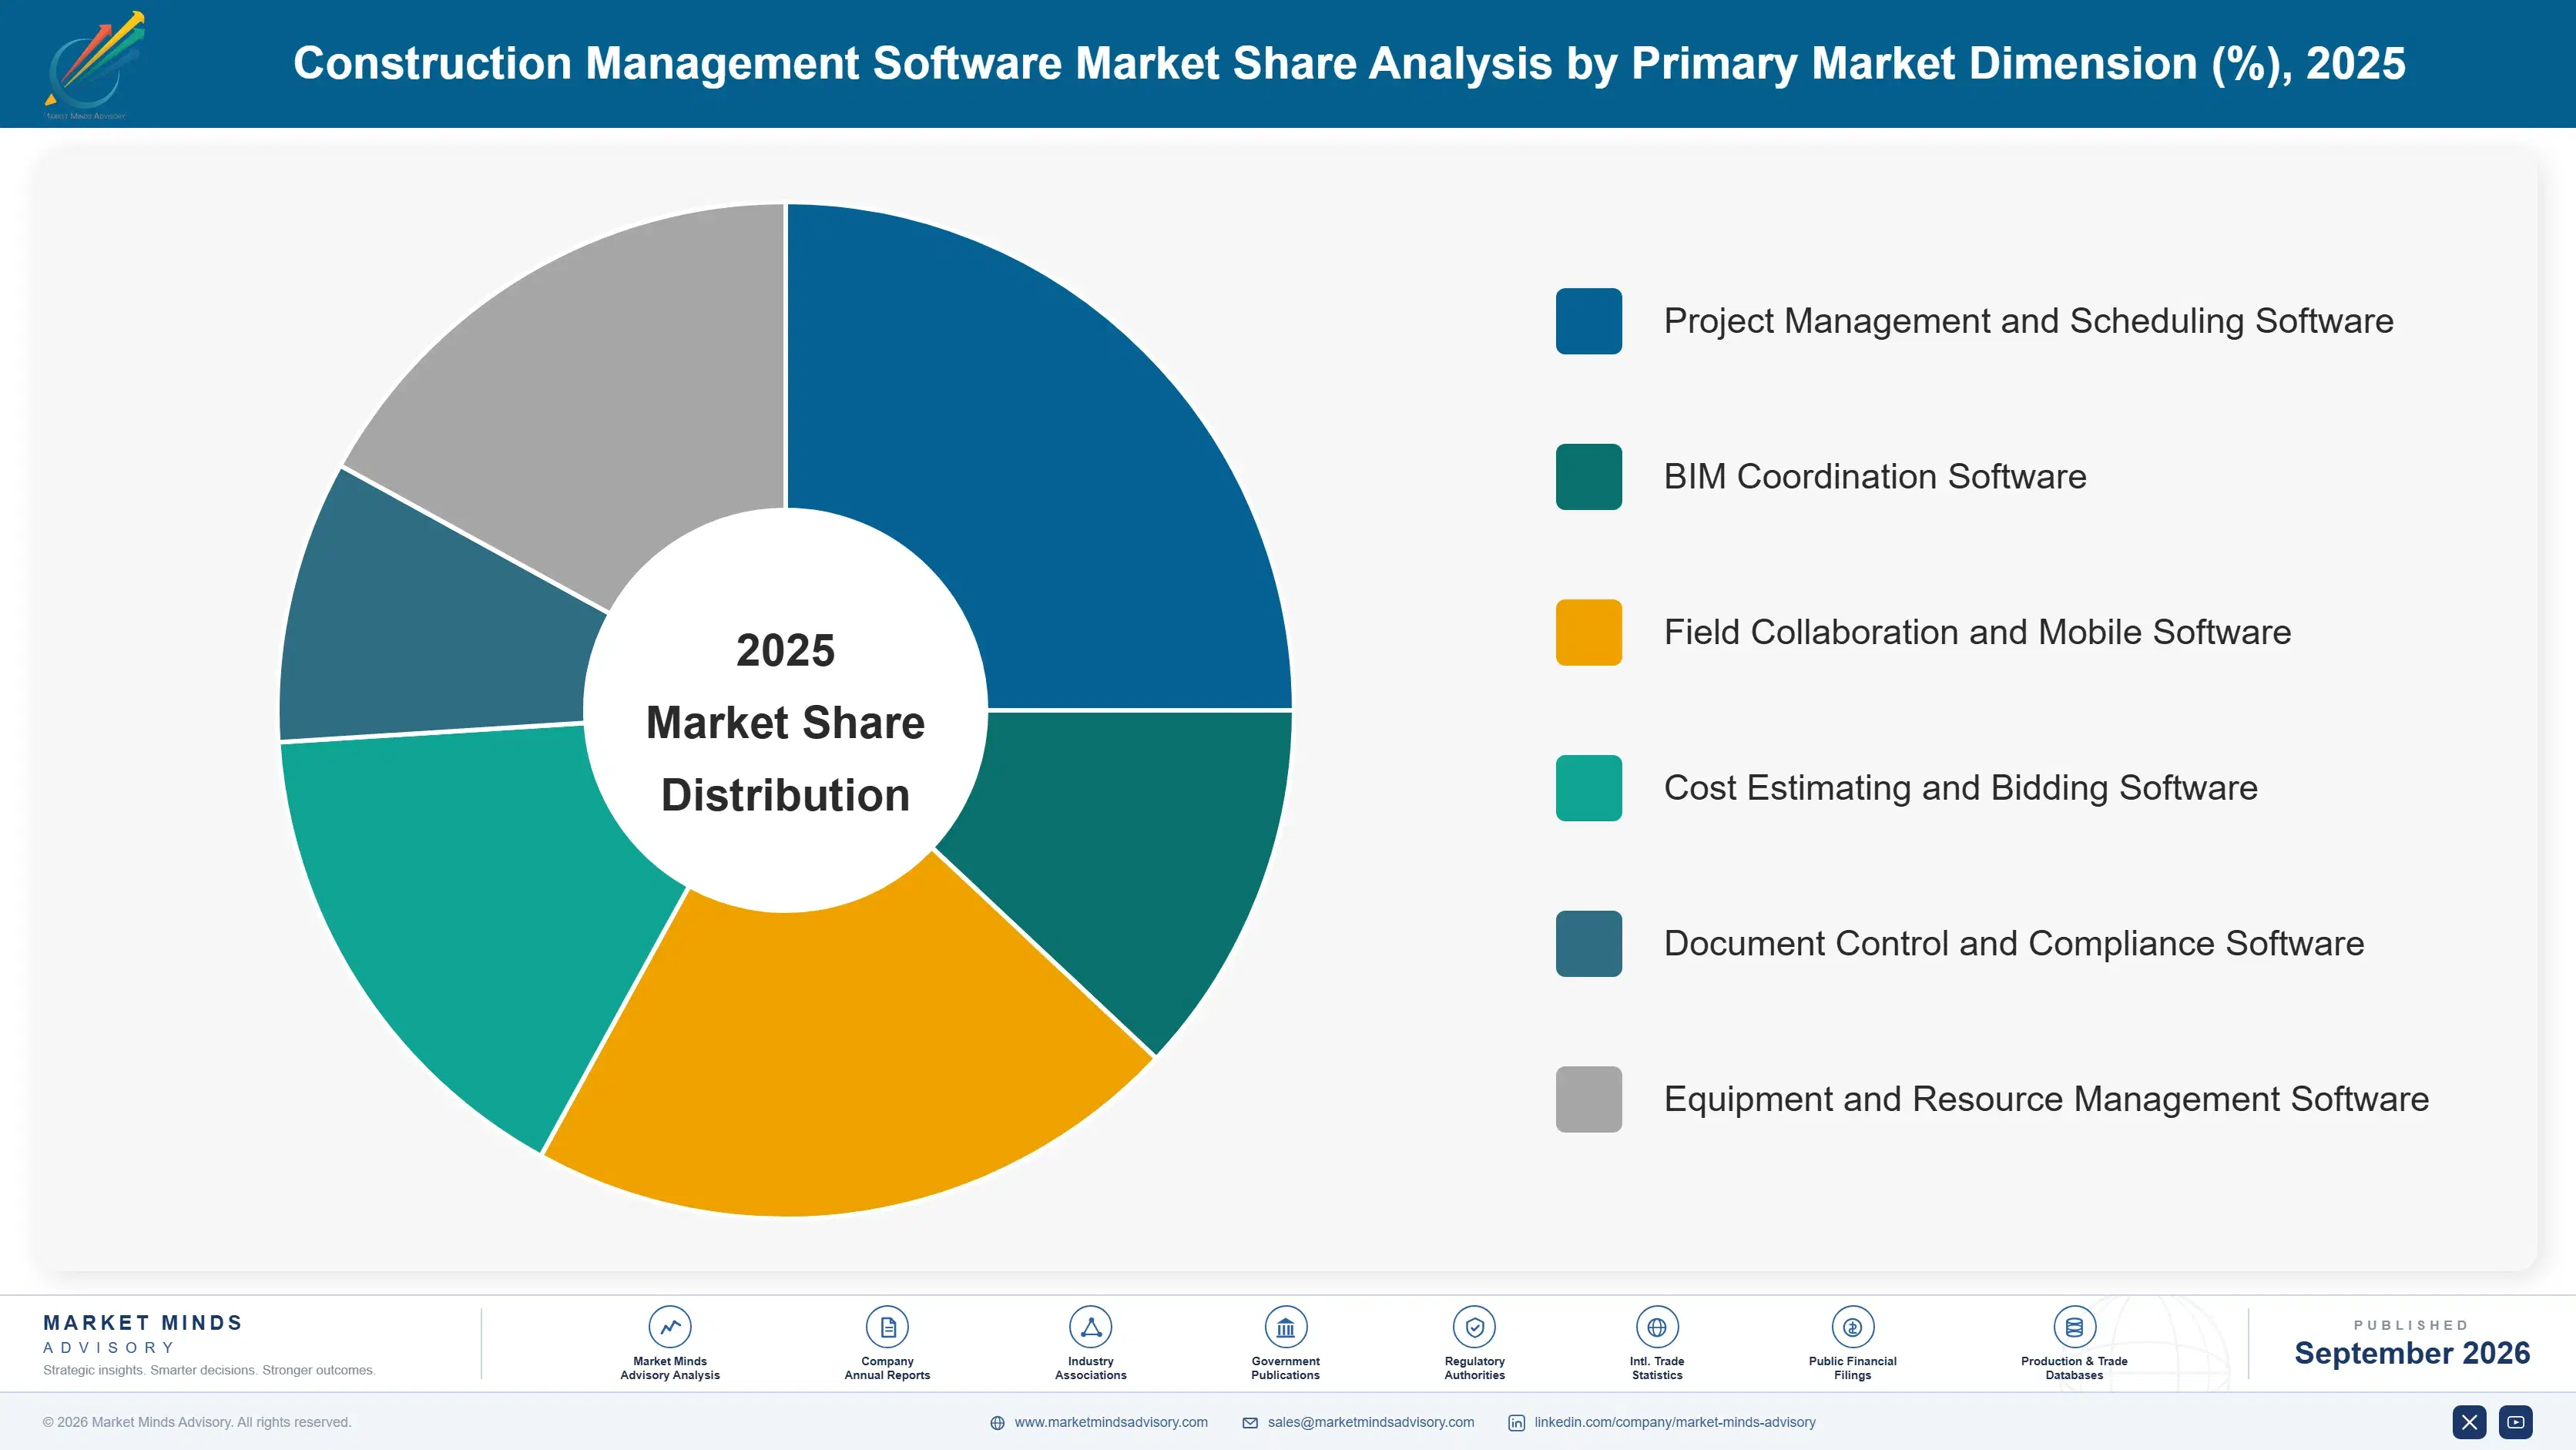
Construction fleet management software segments by functional module across six categories spanning telematics and GPS tracking, predictive maintenance and diagnostics, utilization and dispatch optimization, fuel and emissions management, compliance and safety reporting, and asset financing and lifecycle management, each addressing a distinct fleet operations workflow across every contractor and equipment rental fleet operation nationwide today.
construction-equipment-fleet-management-software-m-market-share-analysis-1788418965162

Predictive Maintenance and Diagnostics

Predictive maintenance and diagnostics software analyzes sensor data streams from onboard telematics hardware to forecast component failure before it causes unplanned downtime on an active job site, converting reactive repair work into scheduled maintenance windows contractors can plan around. Demand is accelerating fastest here as machine learning models trained on years of accumulated fleet data finally reach the accuracy threshold contractors need to trust automated failure predictions over their own technicians' judgment. Vendors who built genuine predictive capability early, rather than relying on basic scheduled maintenance reminders, are winning the largest share of new enterprise fleet contracts and renewal negotiations. Rental fleet operators have moved fastest, given their direct financial incentive to maximize uptime across shared assets.
CAGR 15.0%

Fuel and Emissions Management

Fuel and emissions management software tracks consumption, idle time, and emissions output across a fleet, a function growing quickly as state-level off-road emissions reporting requirements tighten and contractors face mounting internal sustainability commitments to major commercial clients. Accurate fuel tracking directly affects project margin, making consumption monitoring a genuine commercial priority rather than a purely environmental compliance concern for most contractors managing thin project margins. Growth here trails predictive maintenance slightly but benefits from mandatory regulatory compliance timelines that sustain adoption even among contractors otherwise reluctant to invest in new fleet software. Vendors bundling fuel monitoring with broader compliance reporting increasingly win against point-solution competitors offering only narrow fuel tracking capability.
CAGR 13.5%
Full segment breakdown across 6 segments available in the complete report.

Regional Architecture and Country Demand Map

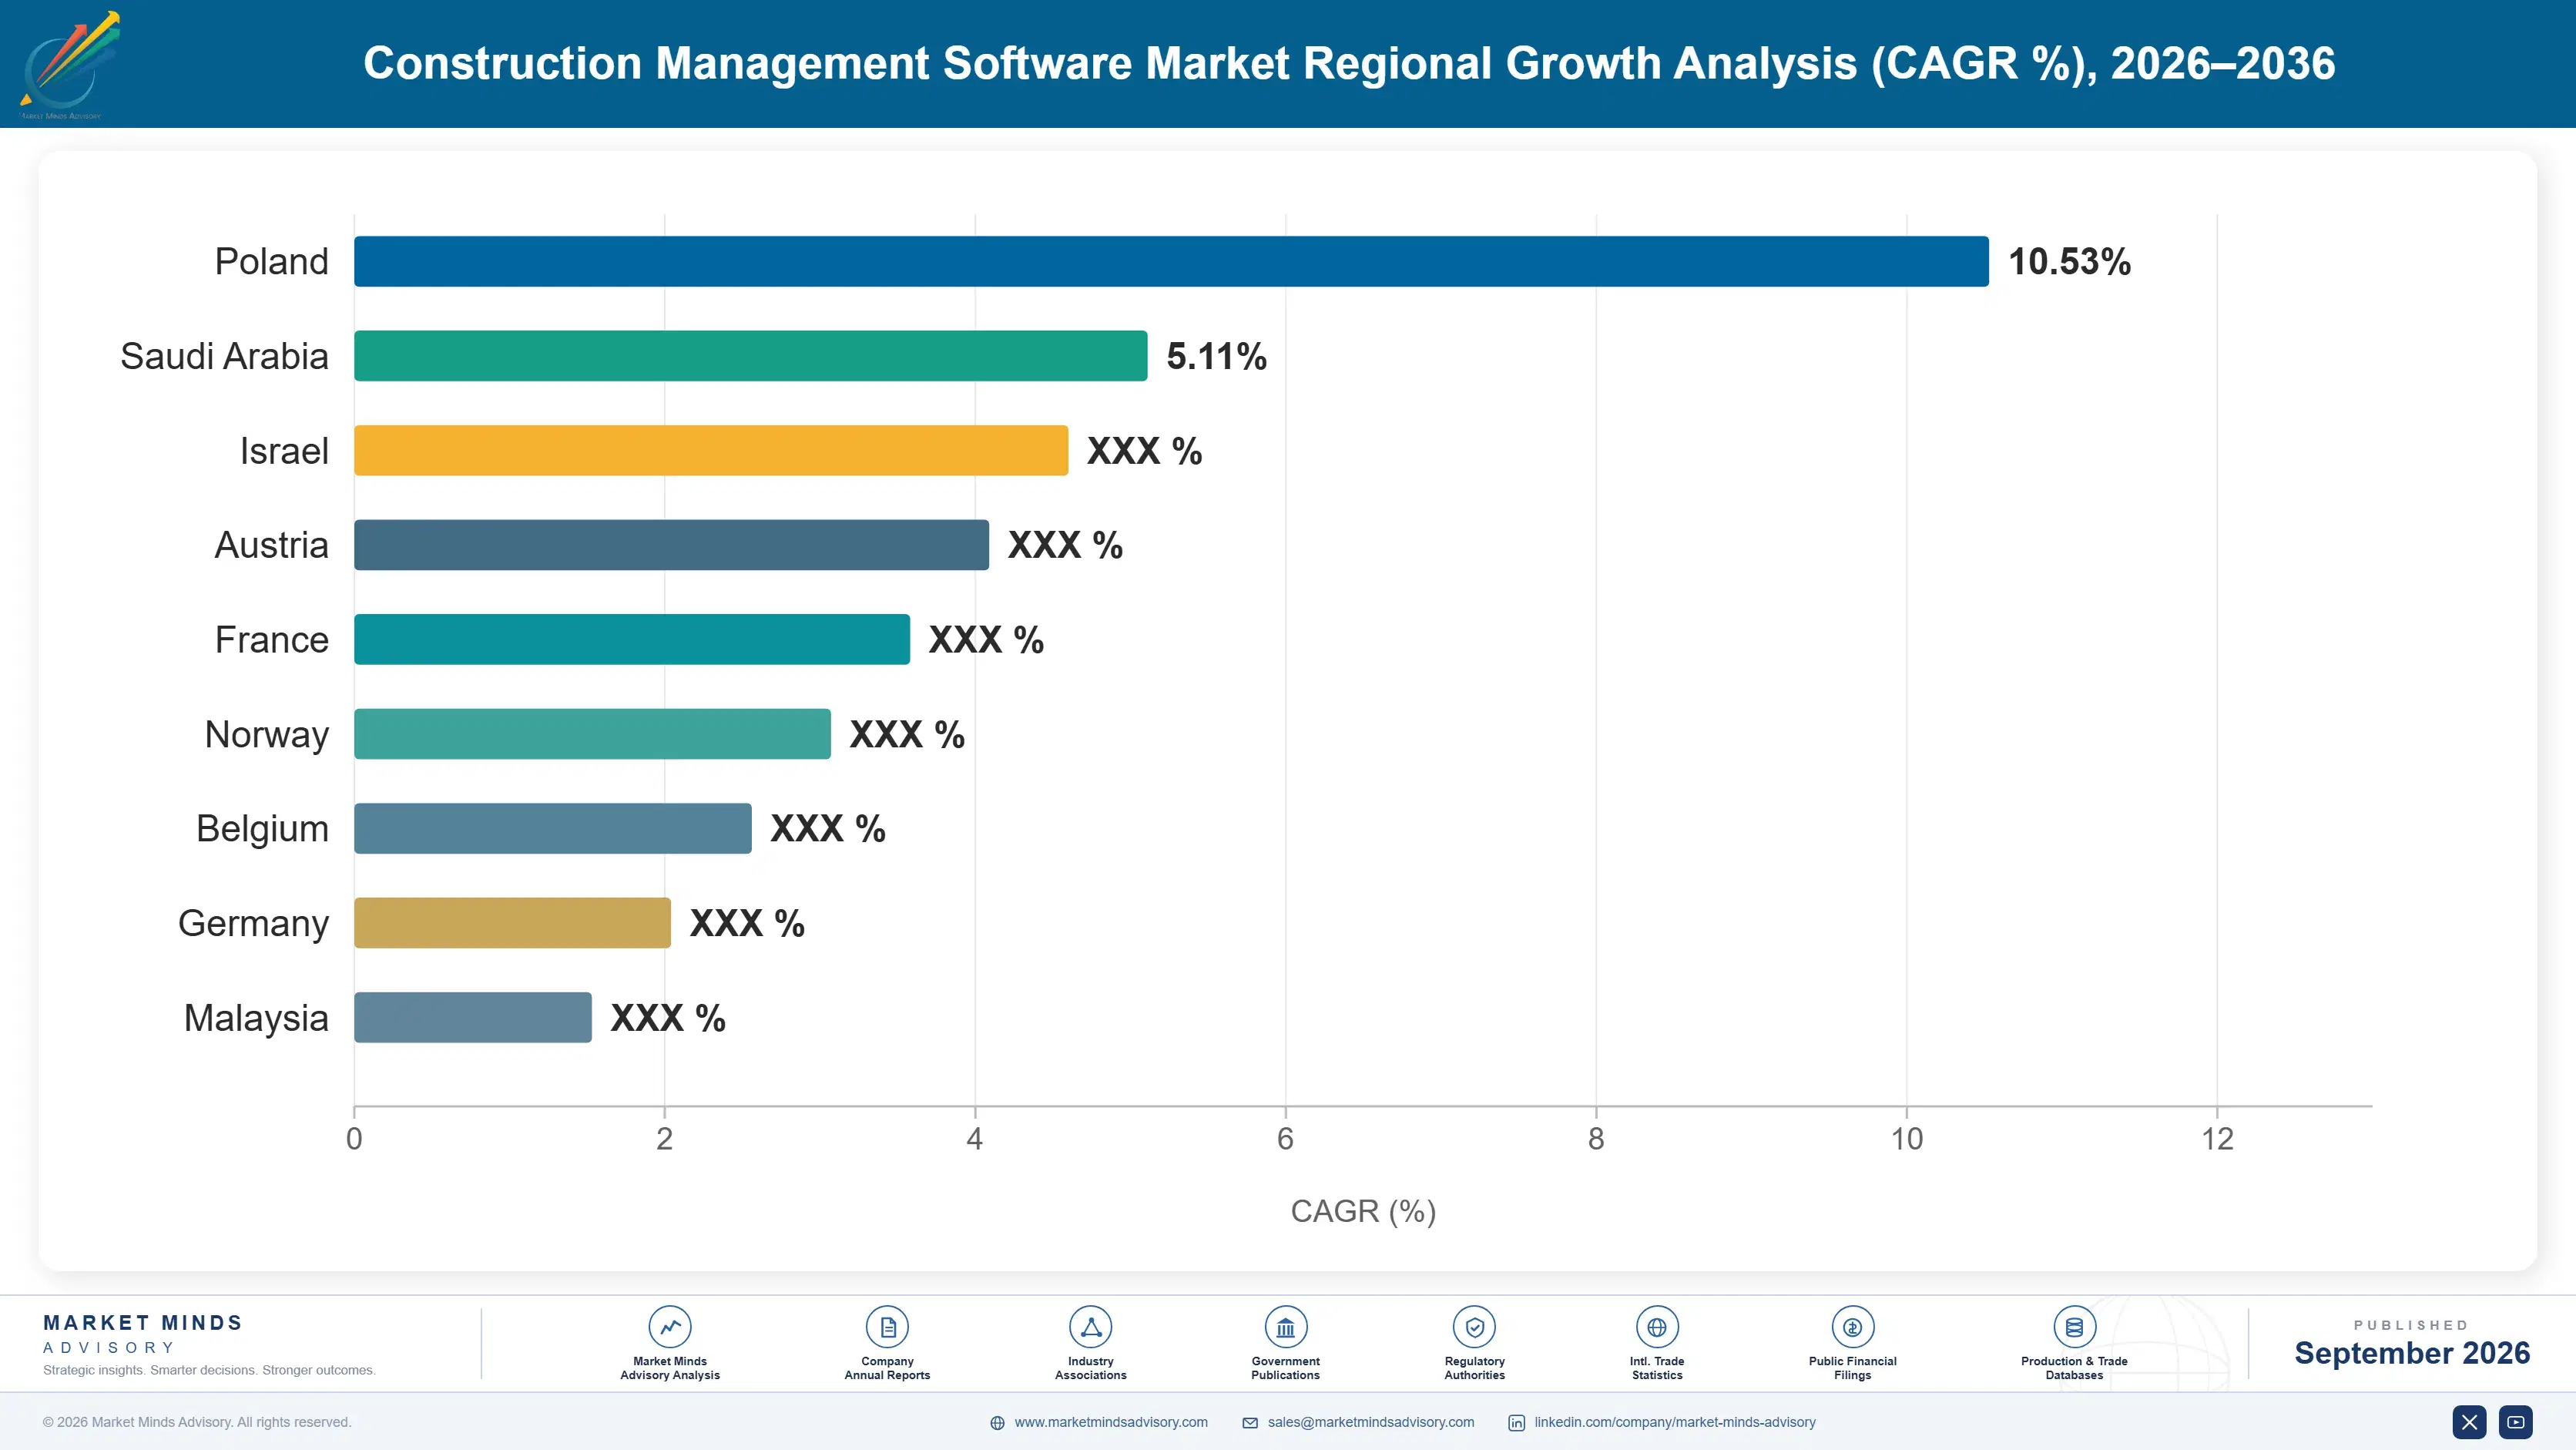
Demand concentrates around dense construction activity zones and OEM vendor headquarters, with telematics penetration and predictive maintenance adoption varying sharply by regional fleet age, infrastructure investment pace, and how quickly local contractors have moved beyond basic GPS tracking toward genuinely predictive fleet management software solutions.

North America

North America holds the largest share by a wide margin, anchored by Caterpillar, Trimble, John Deere, and Volvo Construction Equipment's North American operations, all headquartered in the region and running the most mature telematics deployment programs globally. Federal infrastructure spending continues funding thousands of active highway, bridge, and utility projects that sustain elevated equipment utilization and fleet software demand nationwide. Rental fleet operators, a particularly large and sophisticated segment in the United States specifically, have driven early and aggressive predictive maintenance adoption to maximize returns on shared assets. Canadian oil sands and mining-adjacent construction activity adds further incremental regional demand across several active provinces. Established rental chains continue expanding telematics-equipped fleet share faster than most other tracked regions.
Share: 32% | CAGR: 12.5% (2026 to 2036)

East Asia

China's massive infrastructure construction volume and Japan's advanced telematics manufacturing base, led by Komatsu's globally recognized fleet management platform, keep East Asia's growth rate closely tracking North America's pace despite a less mature vendor base overall. South Korea's construction equipment exporters, including several major OEMs, are increasingly bundling fleet software with hardware sales to capture recurring subscription revenue. Domestic Chinese telematics vendors are emerging rapidly, competing directly with established international platforms on price for smaller domestic contractors. Growth here reflects genuine new construction activity rather than pure digital transformation catch-up alone across most major metropolitan construction markets. Continued urbanization keeps driving new equipment purchases that arrive telematics-ready from the factory floor.
Share: 24% | CAGR: 12.5% (2026 to 2036)
Regional intelligence for 5 additional markets available in the complete report: Western Europe, South Asia and Pacific, Latin America, Middle East and Africa, Eastern Europe. Contact sales@marketmindsadvisory.com.
construction-equipment-fleet-management-software-m-country-cagr-analysis-1788418965684

Where Fleet Software Vendors Capture Margin

Vendors expand margin by moving beyond basic telematics tracking toward predictive maintenance services, multi-year enterprise agreements, and cross-sell into compliance and financing modules, each capturing budget that a narrow single-module offering otherwise leaves on the table for competitors to claim across the same account relationship over the entire multi-year contract lifetime and every subsequent renewal cycle.

Bundle Predictive Maintenance Into Core Subscriptions

Vendors embedding predictive maintenance directly into the core telematics subscription, rather than selling it as a separate premium add-on, capture roughly 28 percent higher average contract value than vendors selling tracking and maintenance analytics separately. Contractors increasingly refuse to manage two vendor relationships for what they view as one connected fleet health workflow spanning sensor data through maintenance scheduling. Building this integration requires genuine machine learning expertise that smaller telematics-only vendors struggle to develop without dedicated data science investment over multiple years. That refusal has become a genuine competitive differentiator across the category.
Market Impact: Adds a 28% premium in average contract value

Offer Multi-Year Enterprise Fleet Software Contracts

Locking contractors into three to five year enterprise licensing agreements, rather than annual renewals, gives vendors predictable recurring revenue while commanding a premium of 7 to 11 percent over comparable annual contract pricing. Contractors accept the premium in exchange for locked pricing protection and guaranteed feature roadmap commitments spanning the full contract term. This lever works best for vendors already holding strong renewal rates, since new entrants lack the trust record customers need before committing multiple years of fleet software budget to an unproven platform relationship. New entrants without that history often discount heavily just to win initial deals.
Market Impact: Commands a 7 to 11% multi-year pricing premium

Cross-Sell Compliance and Emissions Reporting Modules

Vendors that successfully cross-sell emissions and compliance reporting modules into their existing telematics customer base capture incremental revenue at a fraction of the cost of winning a brand-new customer relationship from scratch entirely. This cross-sell motion works particularly well as state emissions reporting mandates tighten, since contractors already trust their existing telematics vendor with the underlying fuel and engine hour data needed for compliance reporting. Roughly 35 percent of telematics customers now also purchase at least one compliance module, up meaningfully from a much smaller base just a few years earlier.
Market Impact: Reaches a 35% telematics customer attach rate now

Provide Managed Fleet Optimization Advisory Services

Vendors offering managed fleet optimization advisory services, where the vendor's own analysts review utilization data and recommend fleet composition changes proactively, command a service revenue premium of roughly 18 to 24 percent on top of standard software licensing fees. Smaller contractors without dedicated fleet analysts find this service particularly valuable, since it effectively outsources a specialized function they cannot justify hiring for internally at their current fleet scale. This lever requires vendors to build genuine fleet operations expertise in-house, a capability that takes years to develop credibly. Few competitors can match that depth on short notice.
Market Impact: Commands an 18 to 24% advisory service premium

Who Controls the Margin Pool

Concentration sits at 42 percent among the top five vendors on a revenue basis, a fragmented level reflecting a market still split between OEM-native platforms and independent telematics specialists competing for the same fleet budgets. Caterpillar and Trimble lead by a meaningful margin, both benefiting from deep integration with widely deployed original equipment across thousands of active job sites nationwide. Both companies also hold direct relationships with the largest national rental chains, a relationship advantage newer entrants cannot easily replicate.
Current competitive activity centers on predictive maintenance capability, as vendors race to build genuine machine learning-based failure prediction ahead of contractors' shifting purchasing criteria across the industry. Several vendors are also expanding into compliance and emissions reporting through acquisition, betting that contractors managing regulatory obligations will pay a premium for single-vendor coverage across the entire fleet software workflow.

Emerging pressure comes from OEMs opening proprietary data standards to third parties, a shift that erodes the data-access advantage independent telematics specialists once held over hardware manufacturers exclusively. Rankings are most likely to shift around the predictive maintenance segment specifically, where model accuracy and training data volume, not brand recognition alone, increasingly determine which vendor wins new enterprise fleet contracts.
construction-equipment-fleet-management-software-m-company-positioning-matrix-1788418966209

Competitive Moat and Risk Dimensions

CATERPILLAR

Moat: Deep OEM Data Access

Caterpillar's VisionLink platform draws directly from onboard machine sensors across its own equipment line, giving it data depth and accuracy that third-party telematics providers retrofitting sensors onto existing machines simply cannot match natively. This native integration advantage wins large enterprise fleet contracts among customers running predominantly Caterpillar equipment.
CATERPILLAR

Risk: Limited Cross-Brand Coverage

Caterpillar's platform naturally favors its own equipment, leaving it less competitive among contractors running genuinely mixed-brand fleets who need unified visibility across four or five different manufacturers simultaneously. Independent telematics vendors increasingly win these mixed-fleet accounts specifically because of this coverage gap. Trimble and other independents increasingly target these accounts directly with mixed-brand pitches.
TRIMBLE

Moat: Independent Mixed-Fleet Platform

Trimble's independence from any single equipment manufacturer lets it offer genuinely unified fleet visibility across mixed-brand fleets, a capability increasingly demanded by large contractors managing equipment from several different OEMs simultaneously. This positioning wins contracts that brand-specific OEM platforms cannot realistically compete for. Its growing OEM data-sharing partnerships extend this advantage further each year.
TRIMBLE

Risk: Shallower Machine-Level Data

Without native manufacturer access, Trimble sometimes captures less granular machine-level sensor data than OEM-native platforms can access directly from the equipment itself, occasionally limiting predictive maintenance model accuracy on certain equipment types. Closing this gap requires deeper OEM data-sharing partnerships that remain unevenly available. OEMs remain selective about which partners receive their deepest telemetry access.

Players Tracked

Prominent Players

Caterpillar
Trimble
Komatsu
Volvo Construction Equipment
John Deere

Other Key Players

Hexagon
Topcon Positioning Systems
HCSS
B2W Software
Trackunit
ORBCOMM
Samsara
Verizon Connect
Teletrac Navman
Wacker Neuson
Doosan Bobcat
JLG Industries
Hitachi Construction Machinery
Liebherr
SANY

Recent Developments

JANUARY 2025

Trimble Acquires Predictive Maintenance Analytics Startup

Trimble acquired a privately held predictive maintenance analytics firm to strengthen its machine learning failure-prediction capability, adding an existing customer base of roughly forty large fleet operators to its combined product portfolio immediately following the transaction's close in early 2025, ahead of two subsequent competitor deals.
Signal: Signals independent telematics vendors are actively buying predictive analytics capability rather than building it from scratch.
JUNE 2025

Caterpillar Opens VisionLink Data to Third-Party Integrators

Caterpillar announced expanded third-party data access for its VisionLink telematics platform, allowing independent fleet management vendors to pull machine-level sensor data directly for mixed-brand fleet visibility, responding to sustained customer pressure for unified cross-brand dashboards across the construction industry more broadly. Analysts expect competitors to follow suit shortly.
Signal: Confirms OEM data openness is becoming a competitive necessity, not a differentiator. More OEMs will follow.
OCTOBER 2025

Volvo Construction Equipment Signs Enterprise Fleet Agreement

Volvo Construction Equipment signed a multi-year enterprise licensing agreement with a major national rental chain, standardizing fleet management and compliance reporting workflows across thousands of individual rental units under one shared platform configuration and dedicated vendor support arrangement going forward into next year. Terms were not fully disclosed publicly.
Signal: Indicates large rental chains are increasingly consolidating fleet software vendors to reduce integration overhead. More such deals are expected.

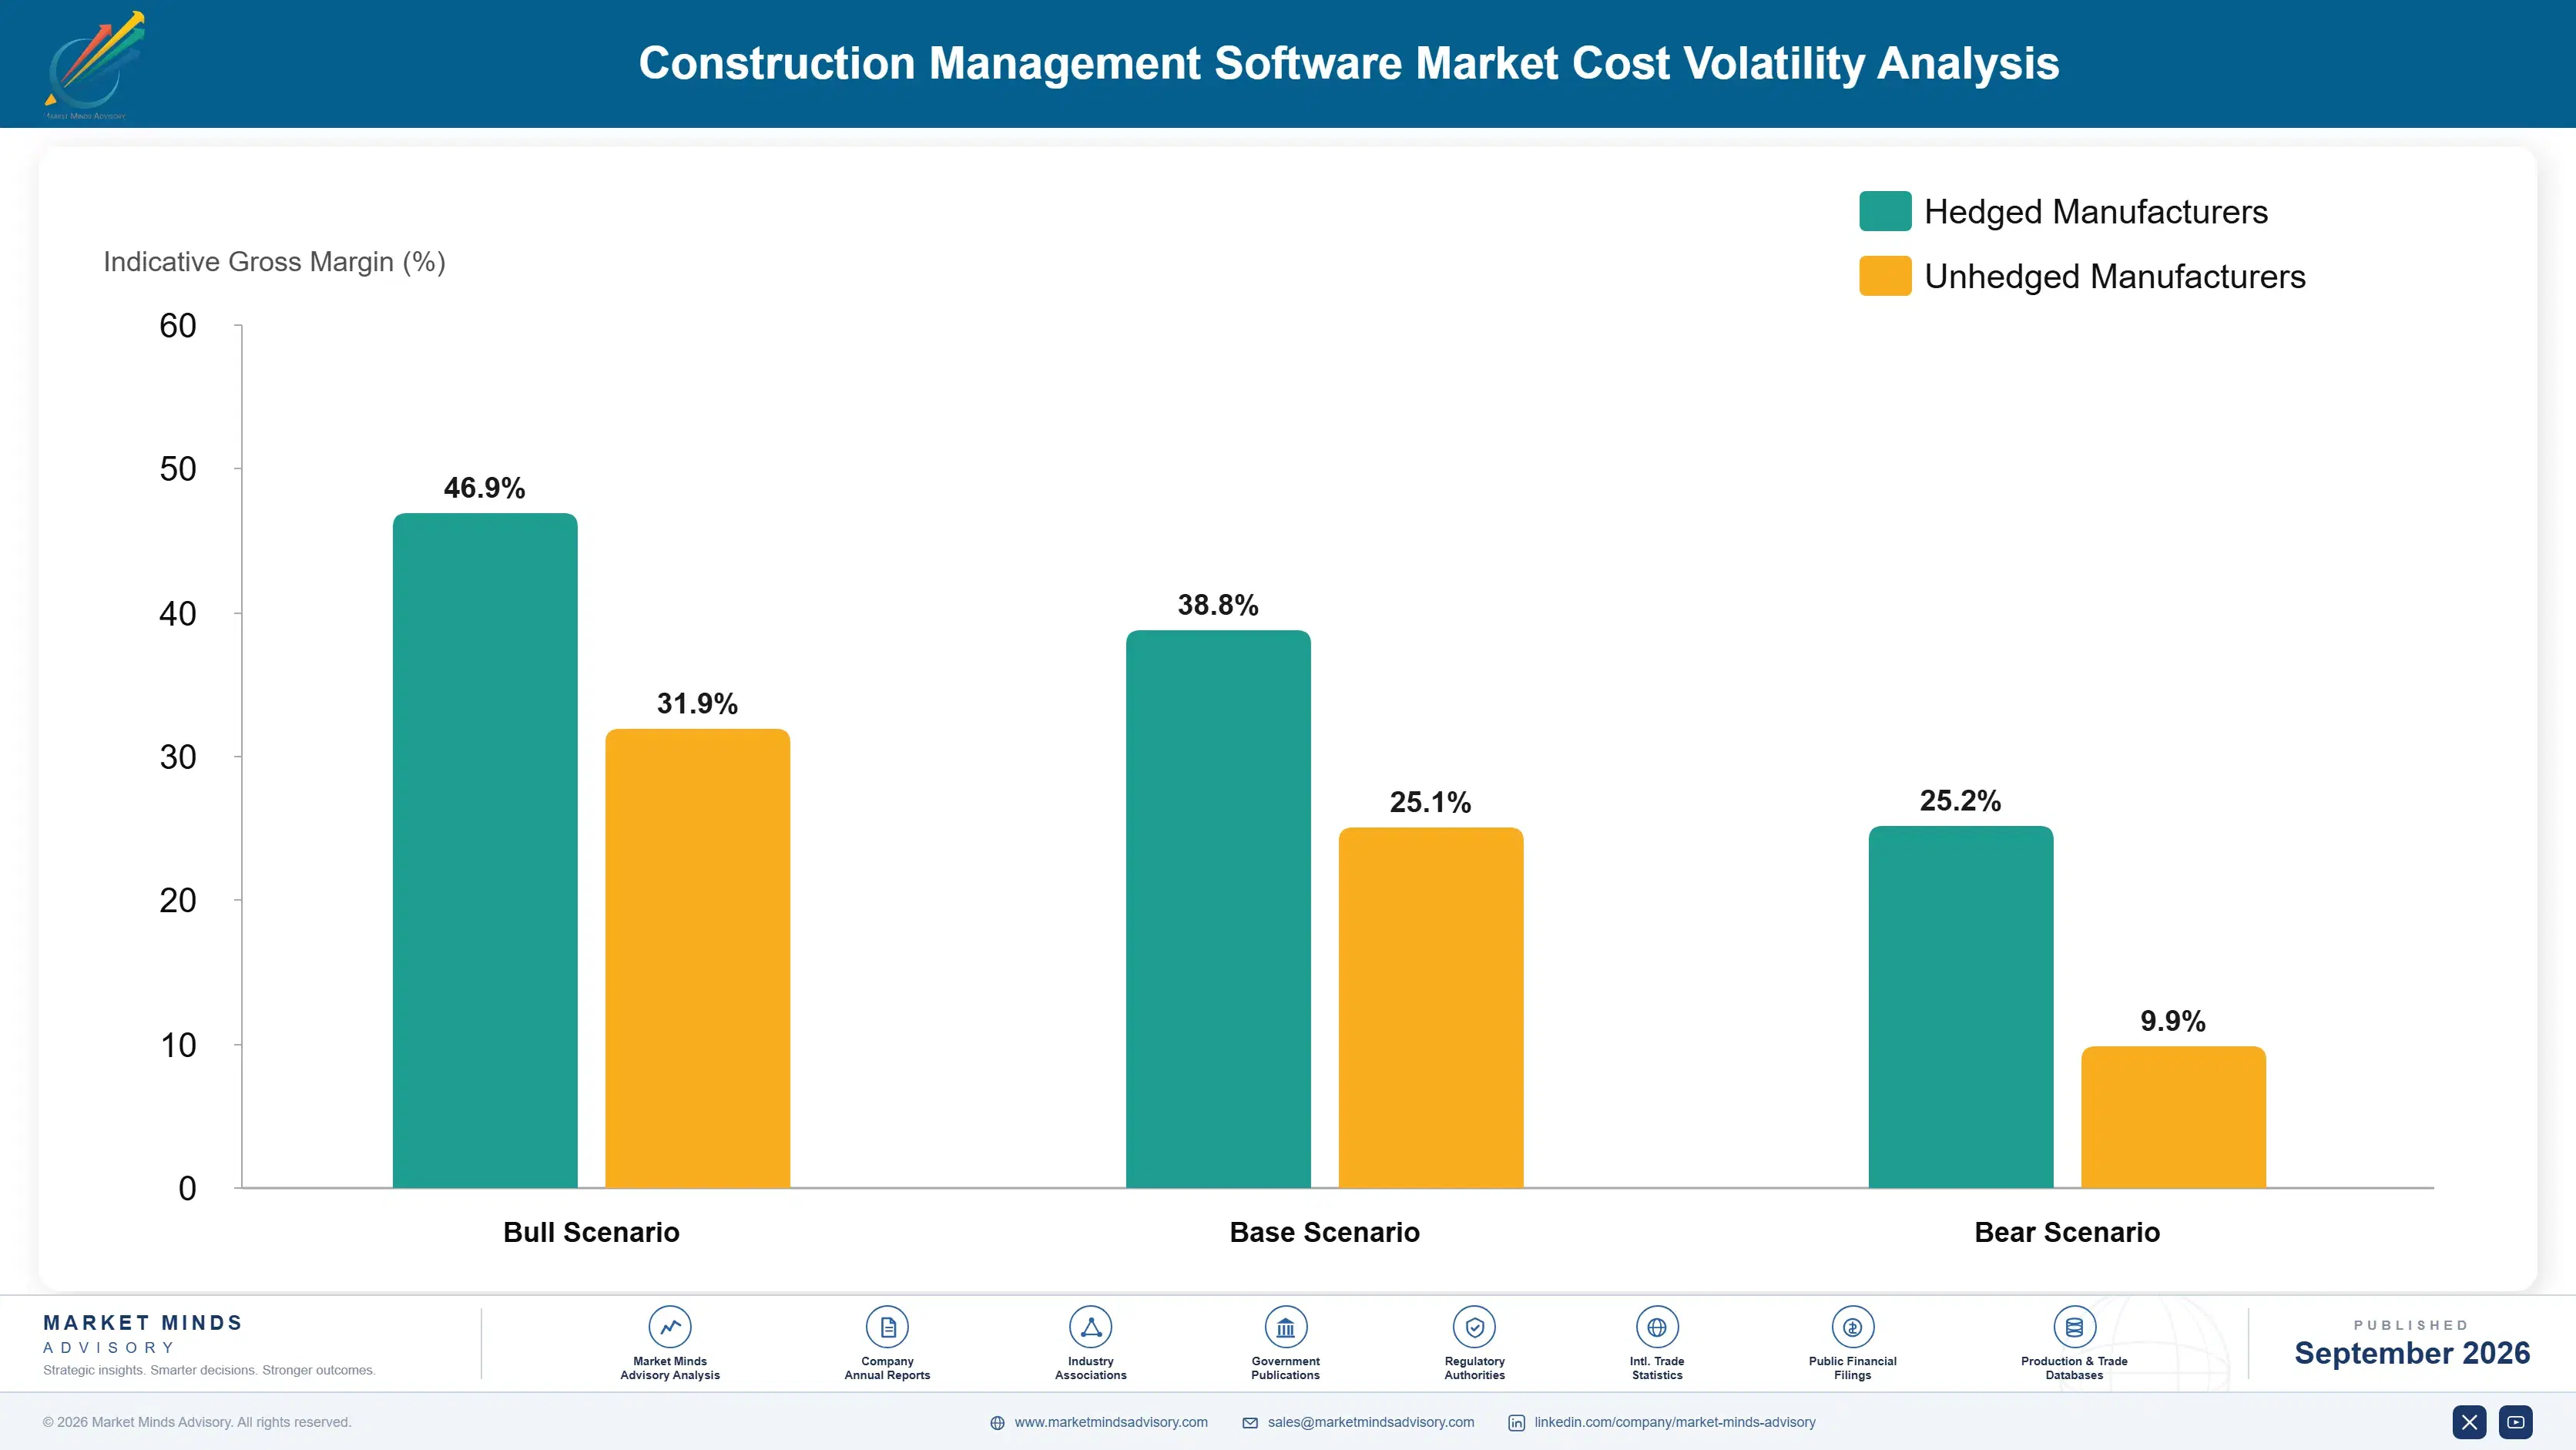
Cloud Hosting and Sensor Hardware Costs

Cloud hosting and compute infrastructure account for roughly 20 percent of total cost of goods sold for fleet software vendors, sourced primarily from major hyperscale cloud providers rather than proprietary data centers most vendors abandoned years ago. IoT sensor hardware components, sourced heavily from semiconductor suppliers concentrated in East Asia, represent a second significant cost input that vendors bundling hardware with software subscriptions must absorb directly.
A 2023 semiconductor supply disruption, documented in several major sensor manufacturers' own annual reports, pushed telematics hardware component costs up meaningfully for vendors bundling hardware with software subscriptions, forcing several smaller vendors to delay new hardware shipments or absorb the cost increase into already thin hardware margins for multiple consecutive quarters before supply eventually normalized fully across the broader global electronics manufacturing industry more generally.

Smaller vendors without long-term component supply agreements face the sharpest cost exposure, since they typically pay closer to spot market pricing while the largest vendors negotiate multi-year volume discounts unavailable to competitors with lower committed purchase volumes. This dynamic increasingly separates vendors by scale, since larger platforms can absorb component pricing volatility that would meaningfully compress a smaller competitor's already thin hardware margins.
construction-equipment-fleet-management-software-m-cost-volatility-analysis-1788418966406

Negotiate Multi-Year Committed-Use Cloud Discounts

Vendors increasingly lock in three to five year committed-use agreements with hyperscale cloud providers to secure discounted per-unit compute pricing well below standard list rates, trading some flexibility for meaningfully lower and more predictable hosting costs over the full negotiated contract term. Vendors report meaningful cost savings within the first year of committing to these terms.

Diversify Sensor Component Supplier Base

Vendors are qualifying a second or third sensor component supplier in different geographies specifically to avoid the single-supplier exposure that caused the 2023 disruption, even though requalification takes months per component and adds near-term engineering overhead. Several vendors now maintain buffer inventory as an additional layer of protection against future shortages. Diversification remains a priority for most vendors.

Shift Toward Software-Only Subscription Models

Some vendors are shifting toward software-only subscription models that integrate with third-party or customer-owned hardware, reducing direct exposure to sensor component cost volatility while sacrificing some hardware margin captured by fully bundled competitors. This shift also lowers vendor exposure to future component price shocks meaningfully over time. Customers with existing hardware investments particularly favor this more flexible approach.

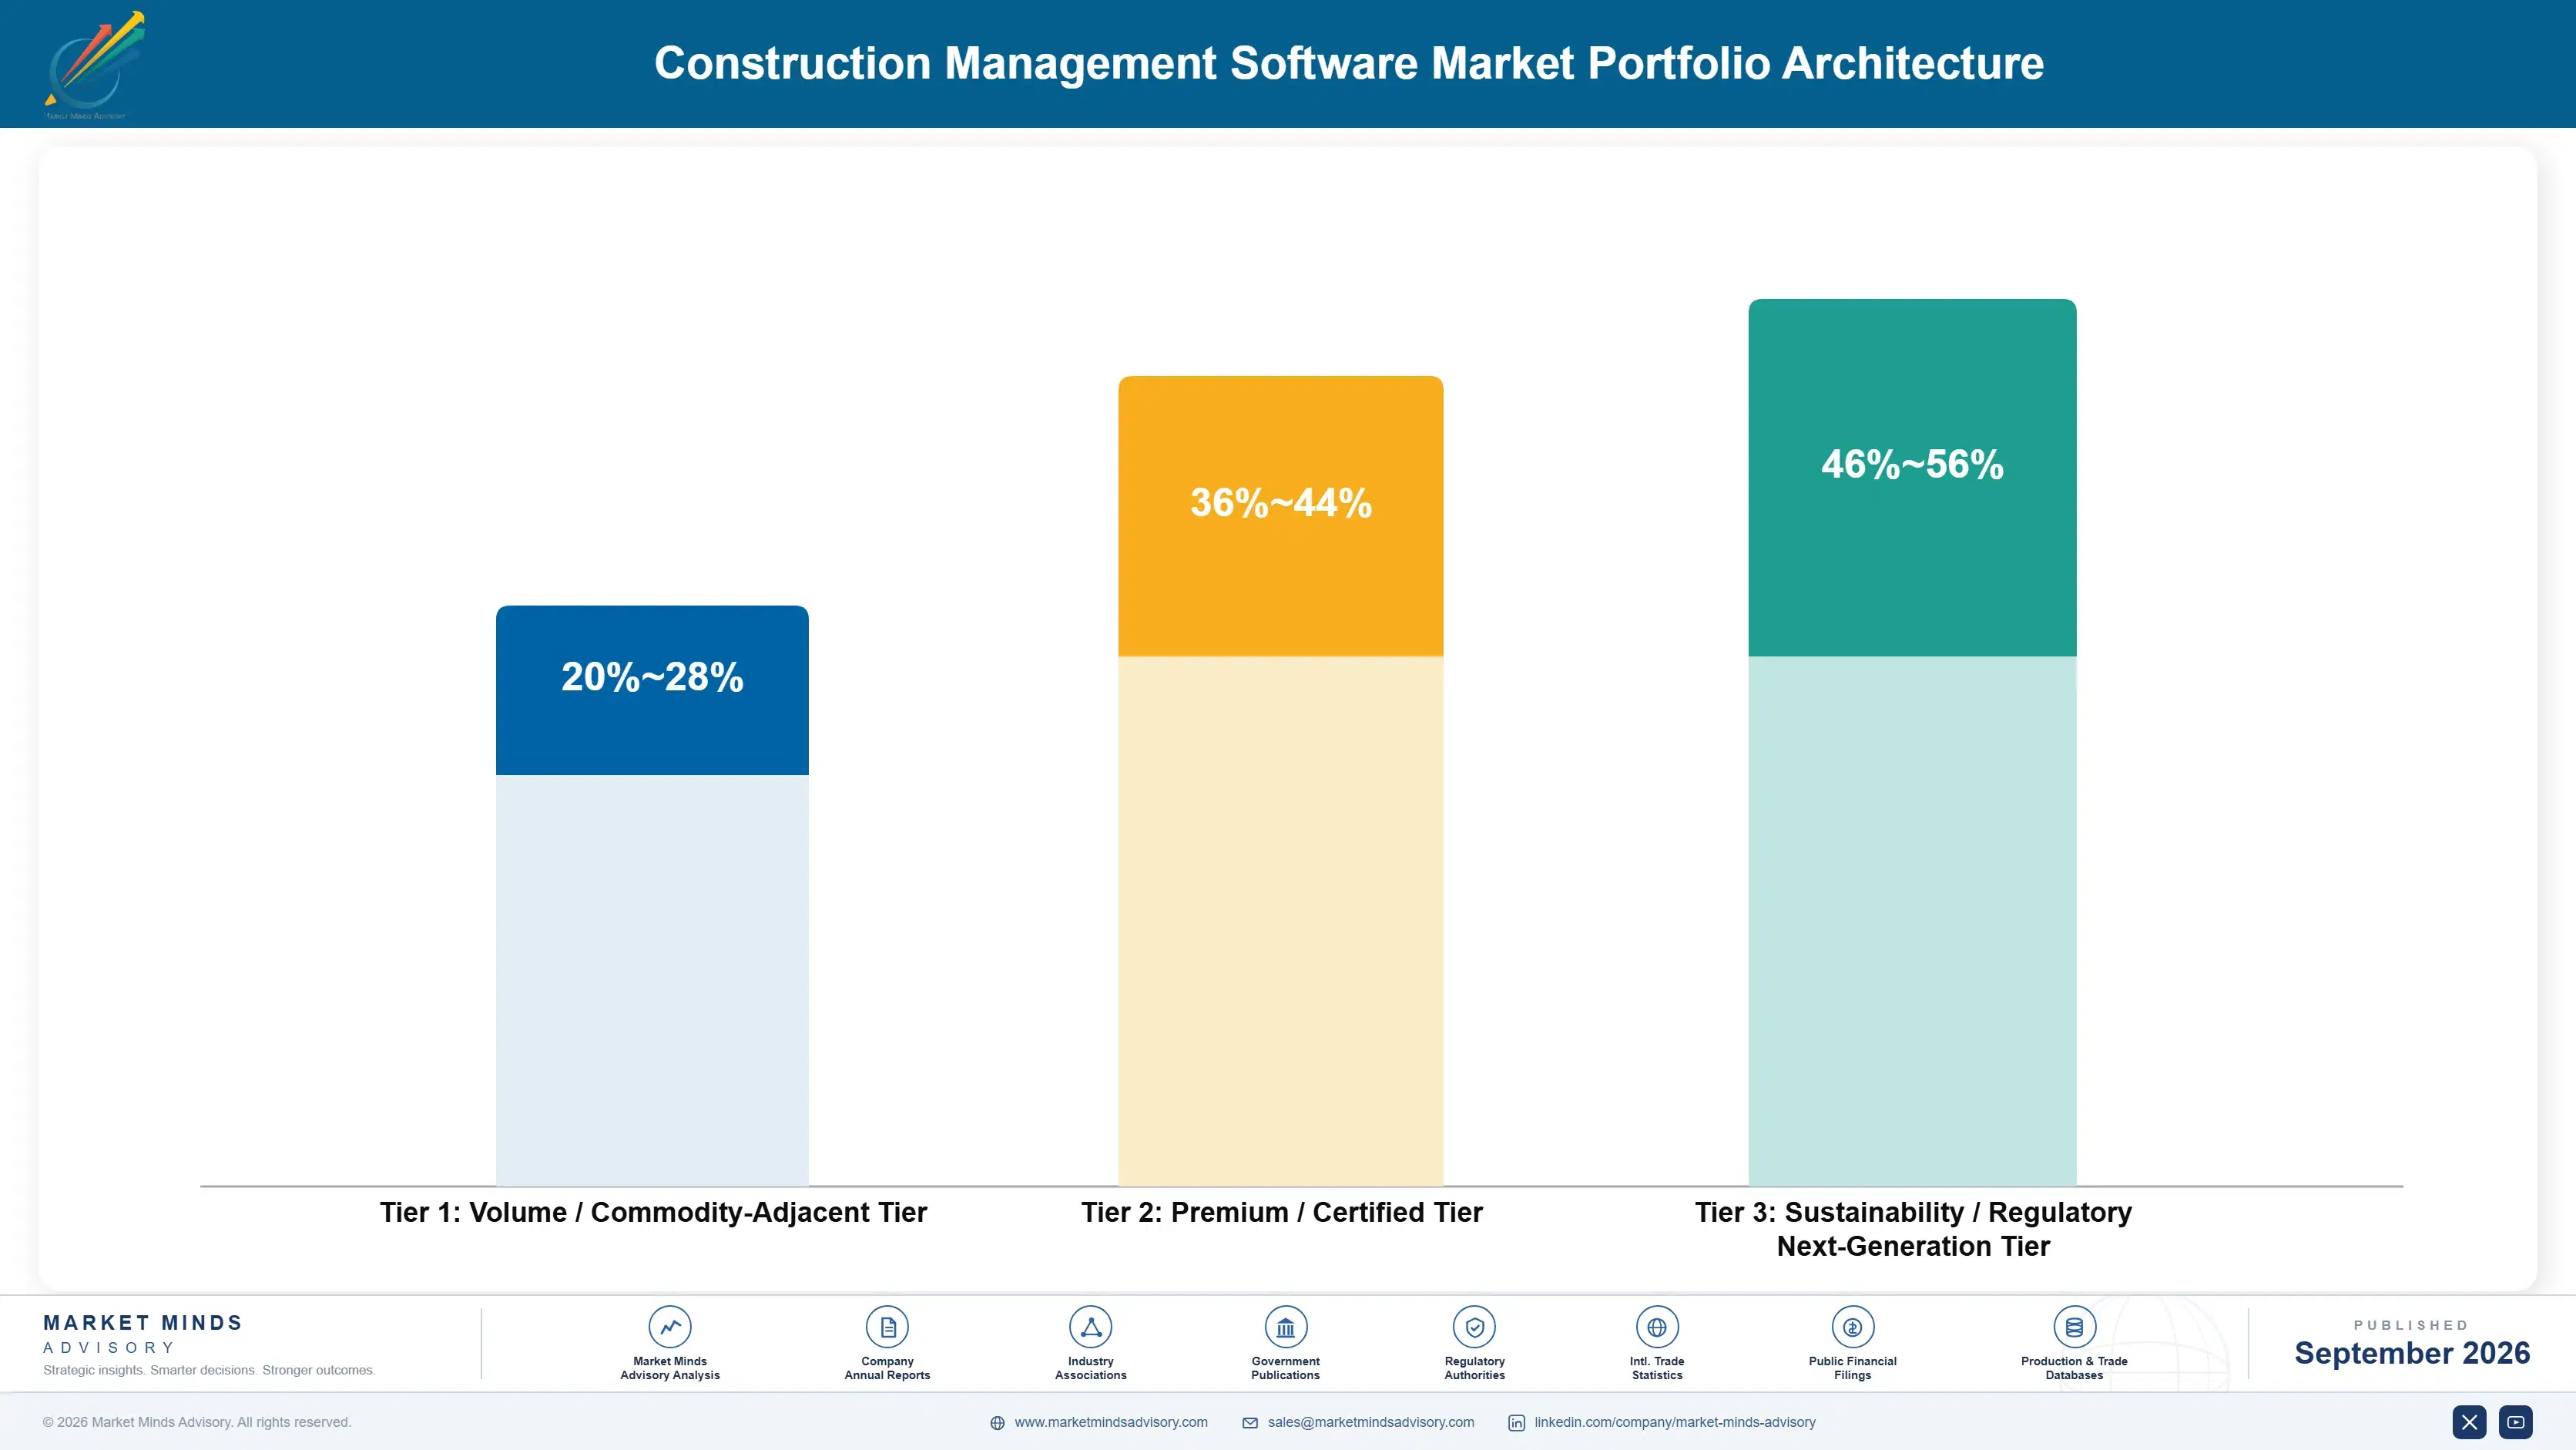
Portfolio Architecture for Margin Defence

Fleet software economics split along a core-versus-predictive axis, with basic telematics tracking modules competing largely on price and hardware compatibility while predictive maintenance and compliance modules command materially higher margins tied to specialized data science and regulatory expertise. Gross margins across the category span a wide range depending almost entirely on which module mix a given vendor's product concentrates in most heavily. Vendors that shift product mix toward the higher tiers over time consistently outperform peers competing purely on hardware compatibility and price.
Volume tier vendors compete on hardware compatibility and basic feature breadth, accepting thinner margins in exchange for larger addressable customer counts among smaller contractors and rental operators. Premium tier vendors instead compete on predictive accuracy and compliance depth, since customers paying for genuine failure prediction are far less price-sensitive than buyers of standard location tracking modules alone.

High-value margin pools concentrate overwhelmingly in the sustainability and next-generation tier, where vendors combining predictive maintenance depth with genuine emissions compliance capability capture premiums unavailable anywhere else in the category. This concentration is pulling vendor investment away from pure volume-tier feature expansion and toward predictive and compliance capability, a shift likely to reshape competitive rankings over the coming several years.

Volume / Commodity-Adjacent

Basic telematics tracking modules for smaller contractors and rental operators, competing primarily on price and hardware compatibility rather than deep feature differentiation. Margins remain thin given intense vendor competition for this large customer segment.
Gross Margin: 22-28%

Premium / Certified

Predictive maintenance and utilization optimization modules serving enterprise fleets seeking to convert unplanned downtime into scheduled, budgeted maintenance windows across active projects. That combination remains genuinely scarce among smaller independent vendors.
Gross Margin: 34-42%

Sustainability / Regulatory / Next-Generation

Emissions compliance reporting and managed advisory services commanding the category's highest margins through genuine regulatory and fleet operations expertise built over years. Few competitors currently operate at this level consistently.
Gross Margin: 44-52%
construction-equipment-fleet-management-software-m-portfolio-architecture-1788418966898

High-value Sub-segments and Strategic Watch-out

Predictive Maintenance and Diagnostics Software

Highest-value, fastest-growing category as machine learning models finally reach production accuracy, rewarding vendors with the deepest historical fleet sensor data and genuine data science capability built in-house. Vendors slow to build this capability lose renewal negotiations to faster-moving competitors. Buyers now expect this natively. This is not optional anymore.
Gross Margin: high

Fuel and Emissions Management Software

High-value category growing steadily as state emissions reporting mandates tighten, rewarding vendors already integrated with engine and fuel sensor data across multiple original equipment manufacturer brands. Multi-year compliance timelines sustain adoption even during slower construction spending periods. Contract terms often span multiple years. Vendors compete hard for this segment.
Gross Margin: high-moderate

Core Telematics and GPS Tracking

Volume core category sustained by ongoing fleet expansion and legacy hardware replacement cycles, generating steady but slower-growing order volume with thinner overall margins industry-wide. Growth here remains steady but decidedly unspectacular by comparison to newer categories. Renewal activity still dominates here. Growth trails the newer categories meaningfully.
Gross Margin: moderate

Spreadsheet-Based Manual Fleet Tracking Conversion

Strategic watch-out category as remaining spreadsheet-dependent smaller contractors eventually convert to dedicated software, a one-time conversion wave that will taper once most holdouts transition. Vendors targeting this segment increasingly use simplified, lower-cost pricing tiers. Few holdouts remain by comparison. Vendors now use simplified onboarding processes here.
Gross Margin: watch

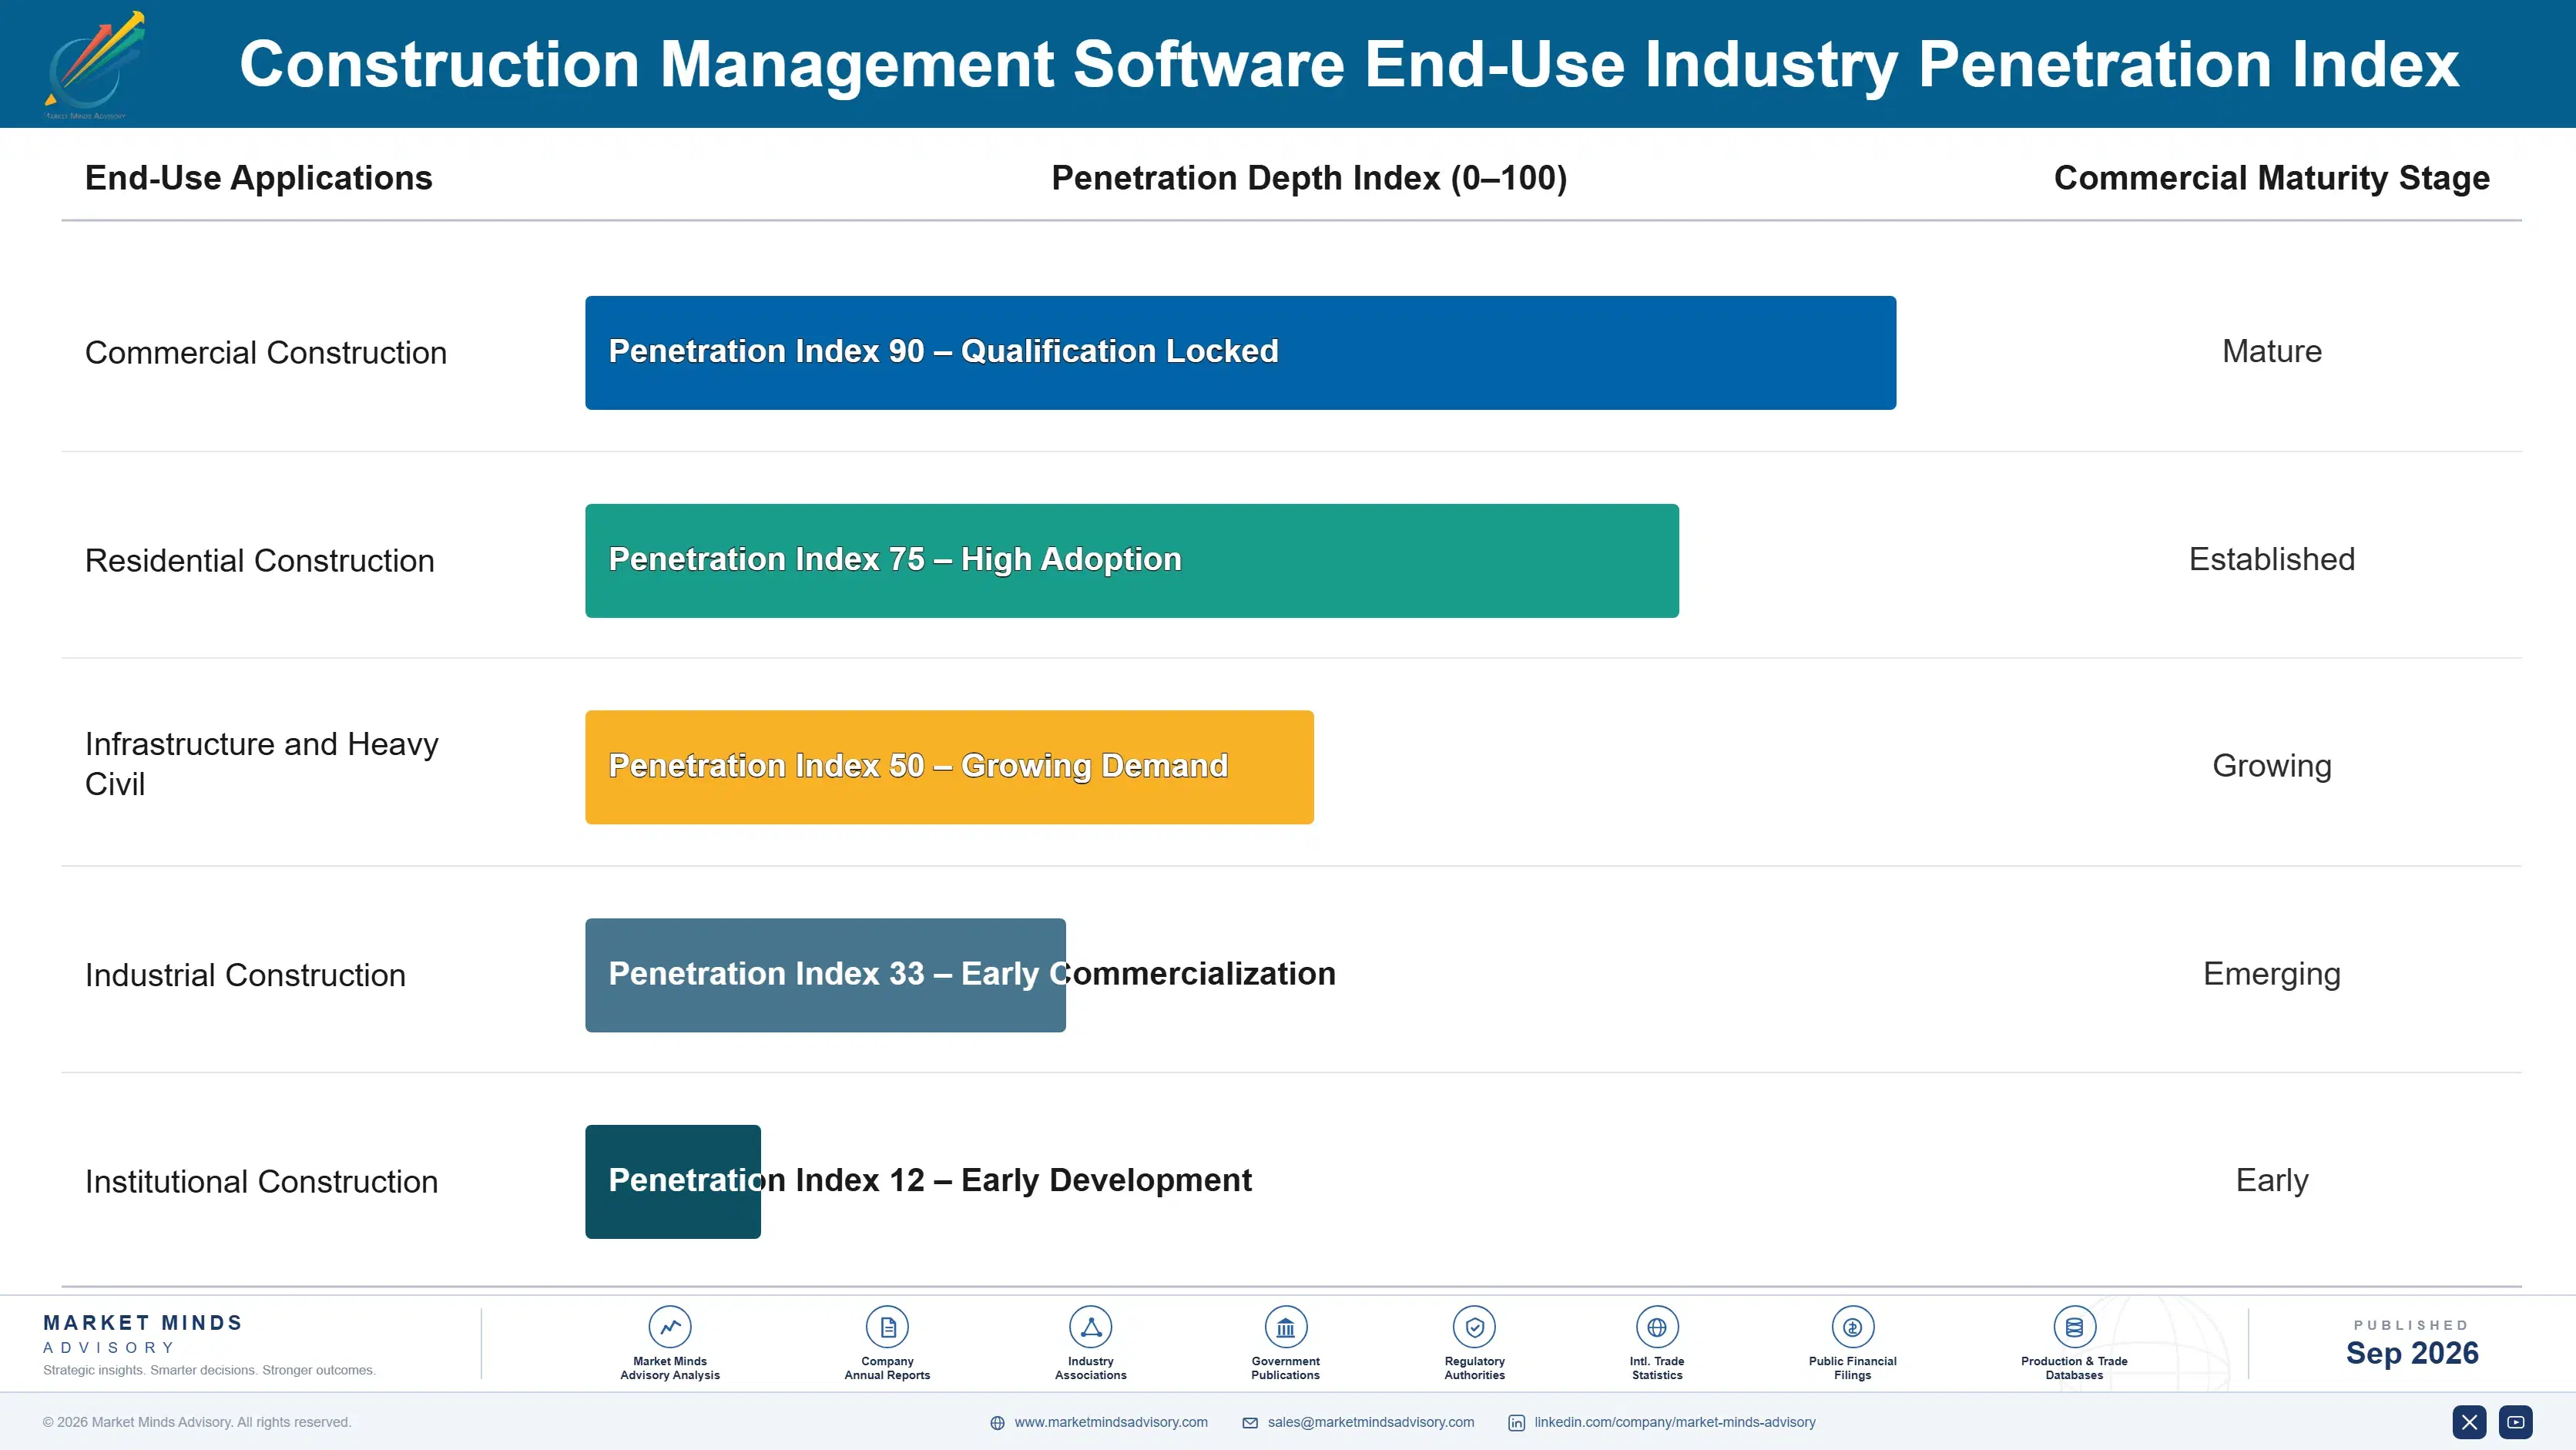
Predictive Maintenance Drives Renewal Loyalty

Once a contractor trains fleet managers and dispatch staff on a given telematics platform's interface and integrates it with maintenance scheduling workflows, switching vendors requires re-training staff and re-validating data feeds, a project most contractors avoid unless the incumbent vendor genuinely underperforms. This creates annuity-like recurring subscription revenue that persists across years of stable contractor relationships and predictable renewal cycles industry-wide.
Adoption stickiness varies by end-use vertical: large enterprise contractors with dedicated fleet operations staff show more willingness to switch vendors during periodic platform modernization initiatives, while smaller contractors with thin back-office capacity show the deepest lock-in since they lack internal resources to manage a disruptive migration project themselves. Rental fleet operators sit closer to the enterprise pattern, given their generally larger dedicated technical and operations staff.

A generational shift in buyer profiles is underway as procurement decisions move from purely operations-focused fleet managers toward joint operations-and-data-science buying committees, reflecting how predictive maintenance has become a specification requirement rather than a downstream nice-to-have feature handled separately. Younger fleet operations leaders increasingly expect vendors to demonstrate genuine predictive capability upfront during initial evaluation rather than treating it as a later add-on purchase.
construction-equipment-fleet-management-software-m-end-use-penetration-index-1788418967388

MMA Verdict on Fleet Management Software

These are among the four positions where our research anticipates prominent divergence between winners and laggards over the coming forecast period. Each is grounded in the demand model, the regulatory perimeter, and the announced capacity pipeline.
01 / PREDICTIVE ANALYTICS INVESTMENT

Build genuine predictive maintenance capability now

Vendors still relying on basic scheduled maintenance reminders are losing renewal negotiations to competitors offering genuine machine learning-based failure prediction, since contractors increasingly evaluate platforms specifically on prediction accuracy rather than feature checklists alone. Building this capability within the next twelve to eighteen months positions a vendor to capture the fastest-growing segment of this market before OEM platforms close the remaining data-access gap that independent vendors currently exploit successfully. Waiting longer risks permanent exclusion from the enterprise fleet contracts that matter most.
02 / MIXED-BRAND INTEGRATION STRATEGY

Pursue OEM data-sharing partnerships aggressively

OEMs opening proprietary telematics data standards to third parties represent a genuine opportunity for independent vendors to close the data-access gap that has historically favored brand-native platforms on machine-level sensor depth and accuracy. Vendors who move first to sign formal data-sharing agreements with multiple major manufacturers position themselves to offer the most complete mixed-brand fleet visibility in the market, a capability increasingly demanded by large contractors managing several equipment brands simultaneously. This is a genuine near-term window worth pursuing aggressively before it closes.
03 / SMALL CONTRACTOR SEGMENT

Build simplified pricing tiers for smaller fleets

Small contractors remain an underserved segment because standard enterprise pricing structures do not fit their smaller operational scale and thinner technology budgets, leaving many still dependent on basic spreadsheet tracking for core fleet decisions and daily equipment dispatch. Vendors introducing simplified, lower-cost tiered pricing plans specifically for this segment can capture meaningful incremental customer volume that larger enterprise-focused competitors have effectively ignored for years across the industry. This addressable gap represents a genuine growth opportunity worth pursuing seriously and soon.
04 / COMPONENT SUPPLY RESILIENCE

Diversify sensor component suppliers before next disruption

The 2023 semiconductor supply disruption exposed how concentrated qualified sensor component supply really is, and vendors who have not yet qualified a second geographic supplier remain exposed to the same risk recurring at any point going forward without warning. Requalification takes months per component, meaning vendors who start today are meaningfully protected before the next plausible disruption event, while those who wait risk repeating the same costly margin compression that hit the industry only recently. This is a near-term priority.

Engagement Snapshot From the Field

A live engagement with an industry participant carrying material or product regulatory and market exposure ahead of a defining policy shift, showing how our research translates into a defensible multi-year portfolio strategy.
MARKET MINDS ADVISORY · CLIENT ENGAGEMENT SUMMARY
Construction Equipment Fleet Management Software Producer Strategic Portfolio Review and Transition Roadmap 2026·Investment Scenario on Construction Equipment Fleet Management Software Exposure Evaluation 2025-26
CLIENT PROFILE
The client is a national equipment rental chain operating roughly 8,000 pieces of construction equipment across multiple regional depots, generating approximately $620 million in annual revenue (client-reported, unverified by MMA) prior to this engagement. The company had accumulated four separate OEM-native telematics platforms through years of multi-brand fleet growth, leaving fleet managers switching between systems throughout the workday.
STRATEGIC CHALLENGE
Fragmented telematics data across four separate OEM platforms was preventing the client's fleet managers from getting unified utilization visibility, directly limiting the company's ability to maximize asset returns across its full rental fleet. Leadership needed an objective evaluation of whether to consolidate onto one independent mixed-brand platform or negotiate deeper data integration across existing OEM systems instead.
MMA APPROACH
MMA conducted structured interviews with the client's fleet operations, IT, and regional depot management teams alongside a comparative evaluation of three candidate consolidation approaches against implementation cost, data completeness, and expected utilization improvement. The analysis modeled expected return on investment under each approach relative to the client's current fragmented four-platform baseline over a three-year horizon.
KEY FINDINGS
  1. Fragmented telematics data was costing the client an estimated 200 hours of manual reconciliation work monthly across all regional depot fleet management teams.
  2. Full consolidation onto one independent mixed-brand platform could improve fleet utilization visibility by an estimated 25 percent within the very first year of deployment.
  3. Platform consolidation carried an estimated $850,000 in total implementation cost (client-reported, unverified by MMA) with a projected eighteen-month full payback horizon overall.
  4. Utilization improvements from unified visibility were projected to generate roughly $2.1 million in incremental annual rental revenue once fully deployed nationwide across every region.
CLIENT PROFILE
The client is a national equipment rental chain operating roughly 8,000 pieces of construction equipment across multiple regional depots, generating approximately $620 million in annual revenue (client-reported, unverified by MMA) prior to this engagement. The company had accumulated four separate OEM-native telematics platforms through years of multi-brand fleet growth, leaving fleet managers switching between systems throughout the workday.
STRATEGIC CHALLENGE
Fragmented telematics data across four separate OEM platforms was preventing the client's fleet managers from getting unified utilization visibility, directly limiting the company's ability to maximize asset returns across its full rental fleet. Leadership needed an objective evaluation of whether to consolidate onto one independent mixed-brand platform or negotiate deeper data integration across existing OEM systems instead.
MMA APPROACH
MMA conducted structured interviews with the client's fleet operations, IT, and regional depot management teams alongside a comparative evaluation of three candidate consolidation approaches against implementation cost, data completeness, and expected utilization improvement. The analysis modeled expected return on investment under each approach relative to the client's current fragmented four-platform baseline over a three-year horizon.
KEY FINDINGS
  1. Fragmented telematics data was costing the client an estimated 200 hours of manual reconciliation work monthly across all regional depot fleet management teams.
  2. Full consolidation onto one independent mixed-brand platform could improve fleet utilization visibility by an estimated 25 percent within the very first year of deployment.
  3. Platform consolidation carried an estimated $850,000 in total implementation cost (client-reported, unverified by MMA) with a projected eighteen-month full payback horizon overall.
  4. Utilization improvements from unified visibility were projected to generate roughly $2.1 million in incremental annual rental revenue once fully deployed nationwide across every region.
RECOMMENDED STRATEGY
Phase 1: Phase one: select and contract with an independent mixed-brand platform vendor already integrated with all four incumbent OEM data standards. Phase 2: Phase two: migrate regional depots sequentially over six months, prioritizing depots with the highest fleet utilization improvement potential identified first. Phase 3: Phase three: retire redundant OEM-native platform subscriptions entirely and redirect the freed budget toward predictive maintenance module expansion across all depots.
OUTCOME
The client completed full platform consolidation within seven months, ahead of the original nine-month target, achieving unified fleet visibility across all regional depots simultaneously. Fleet utilization improved by roughly 22 percent within the first full year of operation (client-reported, unverified by MMA), generating meaningful incremental rental revenue across the network.

Frequently Asked Questions

Foundational context covering the market sizes, CAGR, scope, country, region and competition that inform every finding below. This section is provided to cover basics and most often pre-purchase conversations, answered from the MMA Primary Research Dataset.

What is the current size of the Construction Equipment Fleet Management Software Market?

The market is valued at $3.6 billion in 2025 on a global vendor revenue basis. This figure covers telematics, predictive maintenance, and compliance reporting software serving construction fleets.

How large will the Construction Equipment Fleet Management Software Market be by 2036?

The market is projected to reach $11.91 billion by 2036. Growth is driven mainly by predictive maintenance adoption and tightening national emissions reporting requirements together.

What is the CAGR for the Construction Equipment Fleet Management Software Market 2026 to 2036?

The market is expected to grow at a CAGR of 11.5 percent between 2026 and 2036. This reflects steady demand tied to fleet digitization and compliance.

Which segment is growing fastest?

Predictive Maintenance and Diagnostics software leads at a 15.0 percent CAGR, roughly 1.30 times the overall market rate. Machine learning failure prediction drives this segment's outsized growth.

Who are the major companies in the Construction Equipment Fleet Management Software Market?

Caterpillar, Trimble, Komatsu, Volvo Construction Equipment, and John Deere lead the competitive landscape. Together these top five vendors hold 42 percent of global vendor revenue.

Which country is growing fastest?

India leads at an 18.0 percent CAGR, driven by massive national infrastructure investment expanding fleet sizes rapidly. This outpaces every other country market tracked in this report.

Report Segmentation Architecture

The full report scope spans multiple orthogonal segmentation dimensions, with cross-tabulated demand data provided for each dimension pair. Coverage extends further to regional breakdowns, trend trajectories, and the competitive detail needed to support segment-level decision-making.

By Primary Market Dimension

  • Telematics and GPS Tracking
  • Predictive Maintenance and Diagnostics
  • Utilization and Dispatch Optimization
  • Fuel and Emissions Management
  • Compliance and Safety Reporting
  • Asset Financing and Lifecycle Management

By End-Use Industry

  • General Contractors
  • Equipment Rental Operators
  • Civil and Infrastructure Contractors
  • Mining-Adjacent Construction
  • Government and Municipal Fleets

By Commercial Dimension

  • OEM-Native Platform Subscriptions
  • Independent Platform Subscriptions
  • Managed Advisory Services
  • Hardware-Bundled Software Sales

By Region

  • North America
  • Western Europe
  • East Asia
  • South Asia and Pacific
  • Latin America
  • Middle East and Africa
  • Eastern Europe

Scope, Methodology, and Coverage

Every figure in this report is reproducible from documented input assumptions. The scope below maps the historical period, the forecast horizon, the segmentation dimensions, and the countries covered, alongside the underlying primary and qualitative methodology.
Historical Period
2020 to 2025
Forecast Period
2026 to 2036
Base Year
2025 (USD billions; MMA Primary Research Dataset, September 2026)
Market Definition
This report covers software platforms used by construction contractors and equipment rental firms to track, dispatch, and maintain heavy equipment fleets, including telematics, predictive maintenance, utilization analytics, and compliance reporting modules, measured on a global vendor revenue basis. It excludes standalone GPS hardware sold without an accompanying software platform subscription.
Quantitative Units
USD billions, vendor revenue basis
Segmentation Dimensions
Functional module type (telematics, predictive maintenance, dispatch optimization, fuel and emissions, compliance reporting, asset financing)
Regions Covered
North America, Western Europe, East Asia, South Asia and Pacific, Latin America, Middle East and Africa, Eastern Europe
Countries Covered
United States, Canada, China, Japan, Germany, India, Australia, and 18 additional countries across all seven regions
Key Companies Profiled
Caterpillar, Trimble, Komatsu, Volvo Construction Equipment, John Deere, and 15 additional named vendors
Quantitative Methodology
Primary survey, n=3,800 respondents, Q4 2025, six countries; demand-side model with trade association cross-validation
Qualitative Methodology
47 expert interviews, Q4 2025; applied to validate demand model assumptions, identify emerging dynamics, and assess competitive positioning
Report Format
PDF and XLSX data workbook (Word format preview document)
Publisher
Market Minds Advisory
Report Code
MMA-2026-CON-652
Published
September 2026
Contact
sales@marketmindsadvisory.com | www.marketmindsadvisory.com

Purchase the full Construction Equipment Fleet Management Software Market Report (2026 to 2036).

This report delivers a comprehensive analysis of the global construction equipment fleet management software market through 2036. It combines primary survey data from 3,800 respondents across six countries with 47 expert interviews conducted in Q4 2025, alongside company disclosures and government infrastructure spending data. Coverage spans market sizing, segmentation by functional module, regional dynamics across all seven regions, competitive positioning among twenty named vendors, input cost exposure, and forward-looking strategic verdicts. The analysis is designed for procurement, strategy, and investment decision-makers evaluating this fast-growing category.
Full 2020-2036 historical and forecast data
Detailed segmentation by functional software module
All seven regional market breakdowns included
Competitive profiles of twenty named vendors
Input cost and hardware pricing exposure analysis
Strategic revenue lever and verdict recommendations

Built For The People Who Decide

From boardroom strategy to bench-side execution, this report is read cover-to-cover by leaders shaping the next decade of their industry, turning demand scenarios, market dynamics and valuation benchmarks into decisions.
CXOs/ Presidents/ VPs/ Managers
M&A and Corporate Development
Strategy Teams and R&D Heads
Procurement and Product Directors
Regulatory and Compliance Leaders
Investor Relations and Equity Analysts