Market Minds Advisory
Construction Equipment Finance Market

Construction Equipment Finance Market: Construction Equipment Finance Market. Captive Lenders and Alternative Financing Reshape Equipment Acquisition

Contractors facing rising new equipment prices and tightening bank credit standards are colliding as captive OEM lenders and alternative finance providers compete aggressively for financing volume once dominated by traditional commercial banks.

Lead Analyst

Published

September 2026

Make Smarter Decisions with Customized Research Insights

Request a free sample report and evaluate market opportunities, growth trends, and competitive dynamics relevant to your business needs.

2025 MARKET VALUE$185.0BMarket Size 2025
2036 FORECAST VALUE$369.8BBase Case , 2026 to 2036
CAGR 2026 TO 20366.5 %Bull 7.8% / Bear 5.2%
INCREMENTAL OPPORTUNITY$172.8BNet 10- year value creation
EXPANSION MULTIPLE1.88x2036 value over 2026 base
Strategic Levers
M&A Pipeline
Regional Outlook
Country Rankings
Competitive Intelligence
Segmental Deep-dive
Call-Us : 91 93563 13602

Executive Snapshot and Market Trajectory.

Captive OEM lenders are steadily gaining share from traditional banks as equipment manufacturers bundle financing directly into sales negotiations, offering contractors faster approval and better residual value certainty than most independent lenders can match today across most active equipment categories and dealer networks, reshaping how contractors finance new equipment purchases.
Cranes and lifting equipment financing is scaling fastest, as large infrastructure and data center construction projects drive demand for expensive specialized equipment few contractors can afford to purchase outright. Compact and utility equipment financing is close behind, driven by urban infill construction and smaller contractors entering the market through lower-cost entry-level equipment purchases and shorter loan terms structured around faster payoff. Vendors on both sides are now racing to close underwriting speed gaps.
Captive finance arms, money-center banks, and independent leasing specialists all compete for origination volume, with captives increasingly winning deals through embedded point-of-sale financing that banks cannot easily replicate at the dealership level. Alternative lenders using equipment telematics data for underwriting are gaining share among smaller contractors traditional banks consider too risky to finance given thin credit histories and limited operating track records.
Market Definition
This report covers loan, lease, and rental-purchase financing products used to acquire construction equipment, provided by captive OEM finance arms, banks, and independent leasing companies, measured on a global origination volume basis. It excludes equipment rental revenue itself and general working capital lending not tied to a specific equipment purchase.
Base Year Value
$185.0B in 2025 (MMA Primary Research Dataset, September 2026)
Forecast Period
2026 to 2036, eleven discrete annual values
CAGR
6.5% base case. Bull 7.8%. Bear 5.2%.
Fastest Growth Segment
Cranes and Lifting Equipment: 8.5% CAGR
Fastest Growth Country
India: 12.5% CAGR
Fastest Growth Region
South Asia and Pacific: 8.5% CAGR
Largest Region
North America: 32% of 2025 global value
Market Leaders
Caterpillar Financial Services, John Deere Financial, Wells Fargo Equipment Finance, CNH Industrial Capital, Volvo Financial Services
Primary Survey
n=3,800 procurement and R&D decision-makers, Q4 2025, six countries
Methodology
Demand-side build-up, cross-validated against public data, 47 expert interviews

Construction Equipment Finance Market Forecast Scenarios

construction-equipment-finance-market-size-forecast-scenario-1788420876989
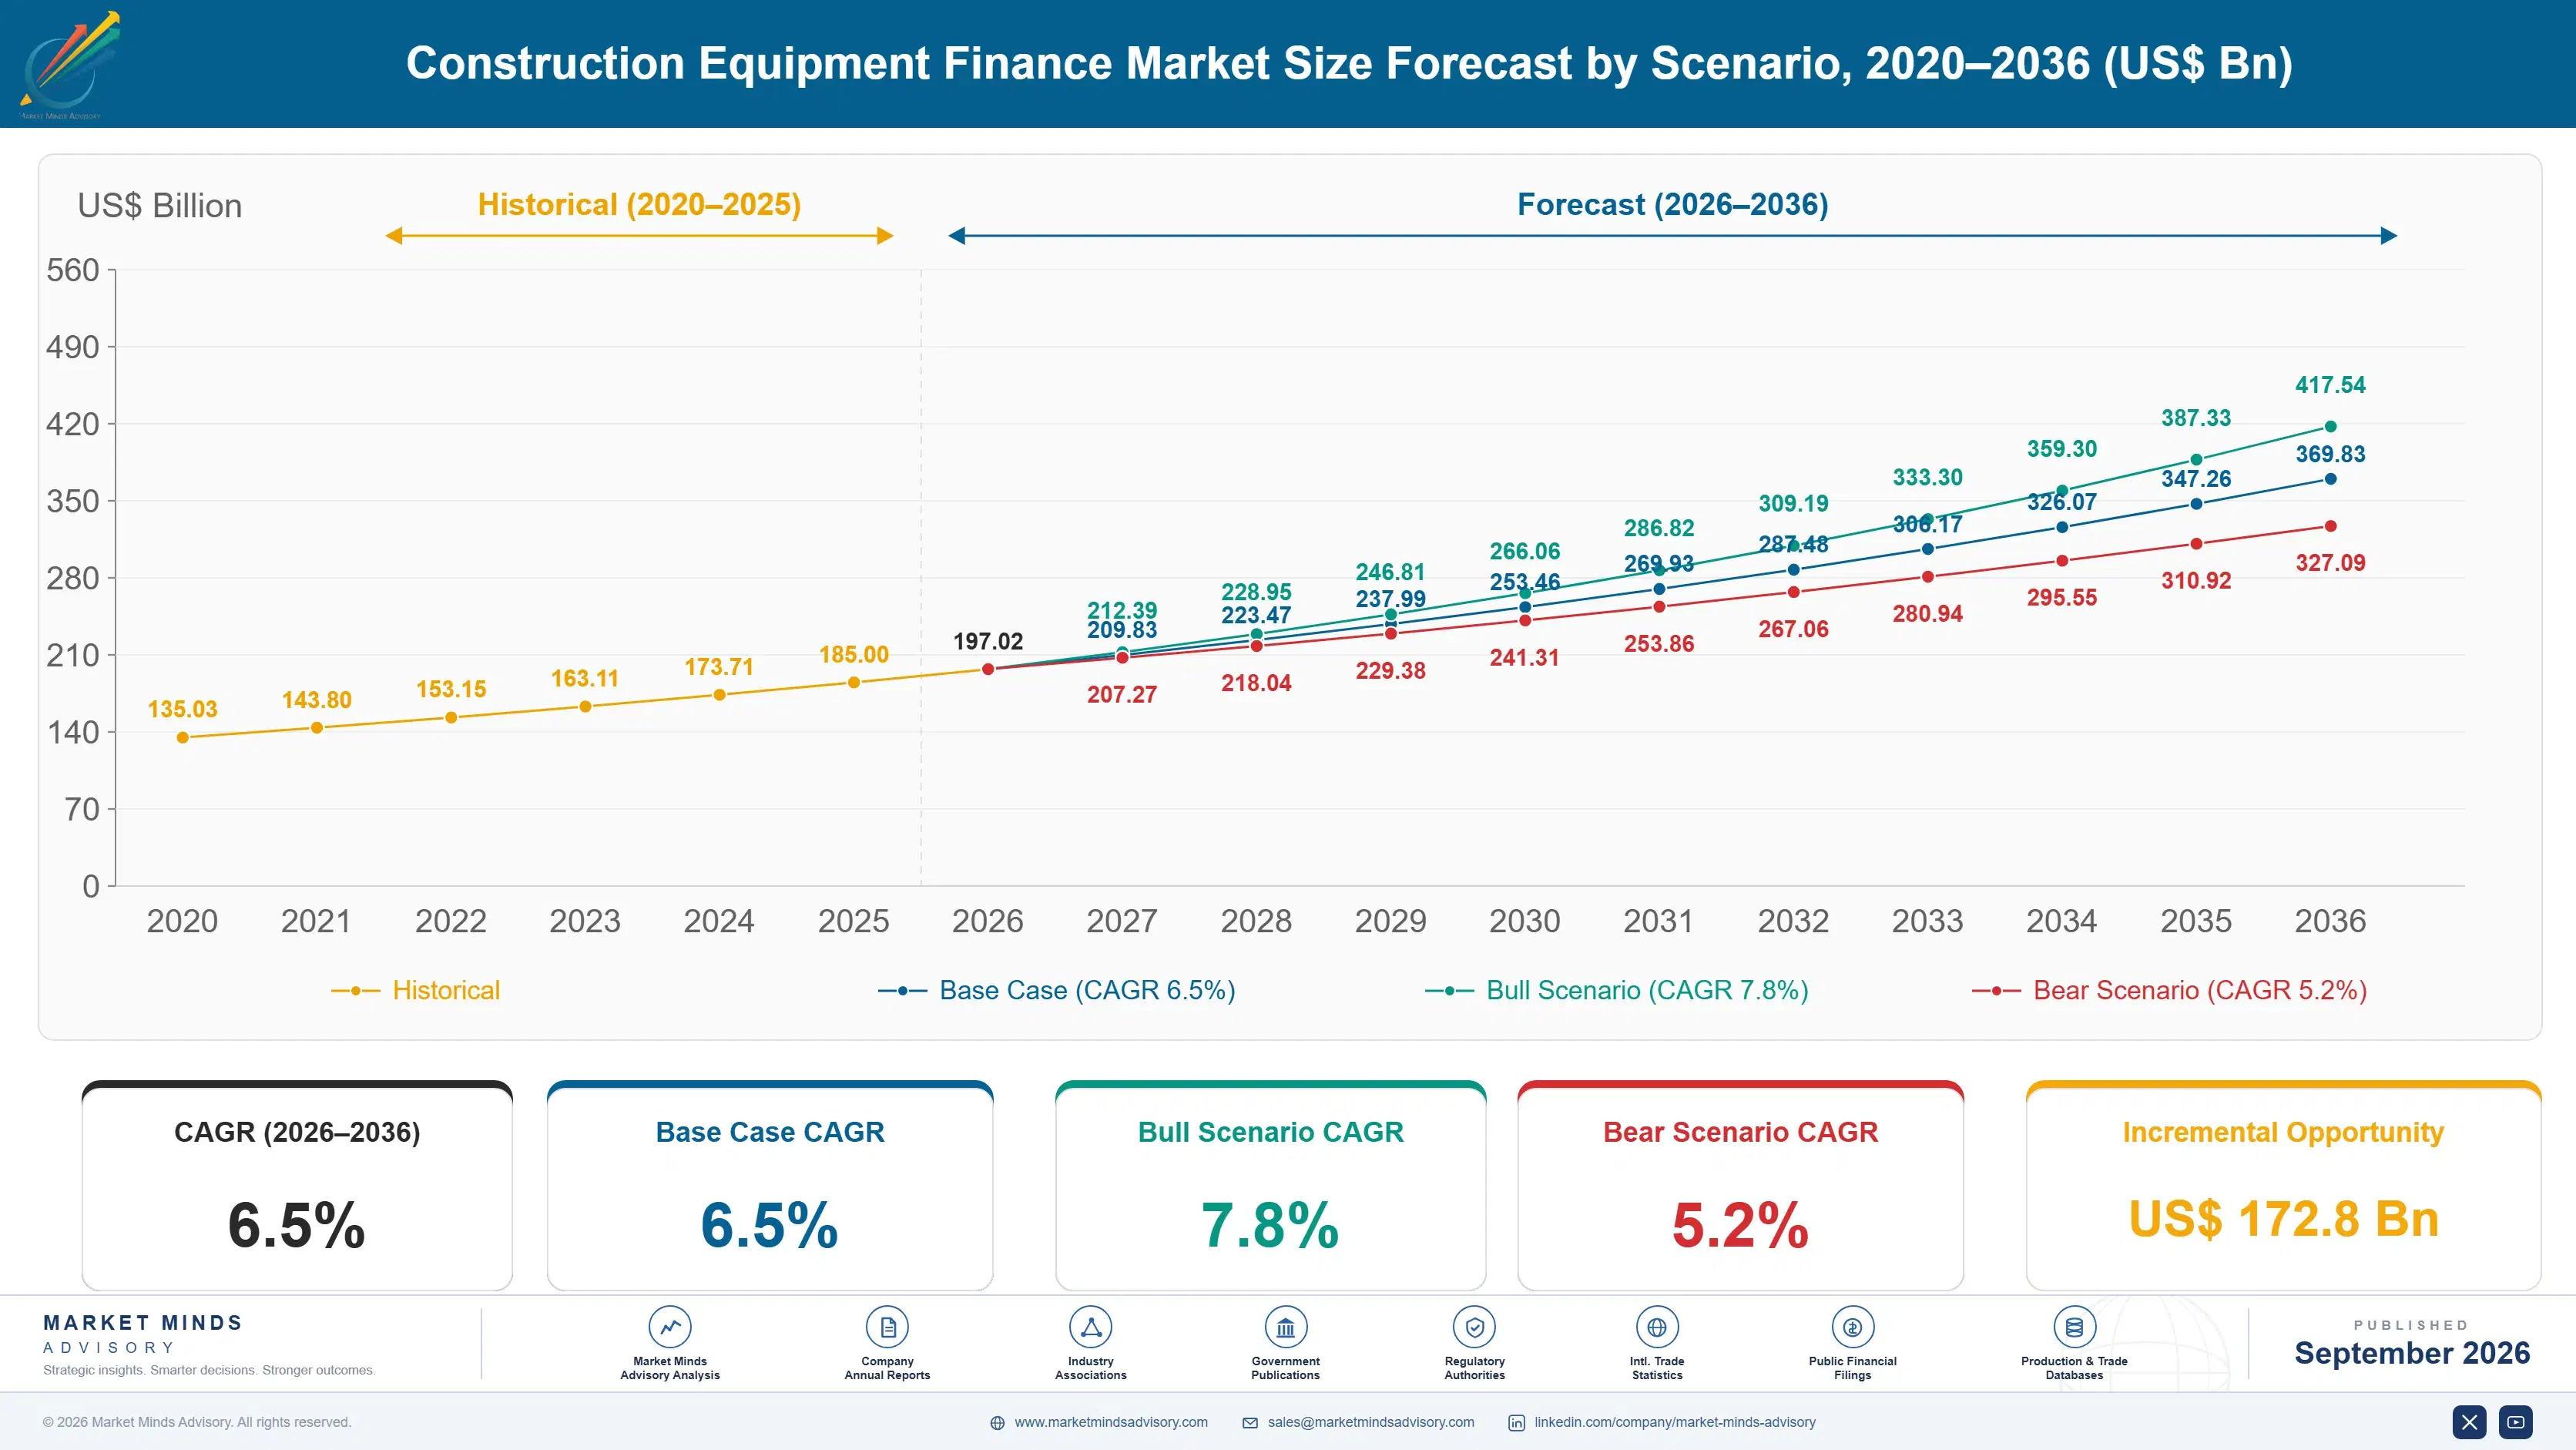
Equipment finance origination grew at a 5.5 percent historical rate between 2020 and 2025 as contractors rebuilt fleets following pandemic-era supply shortages and equipment prices climbed steadily across nearly every category. Captive lenders expanded fastest during this period, using manufacturer relationships to win financing volume banks were slower to underwrite given rising interest rate uncertainty at the time.
The base case assumes 6.5 percent annual growth through 2036, anchored by three mechanisms working together: continued equipment price inflation raising average financed transaction size, captive lenders expanding embedded point-of-sale financing penetration at the dealership level, and alternative lenders using telematics-based underwriting to reach previously unbanked smaller contractors across the industry. Bank participation is expected to stabilize as digital approval workflows narrow the underwriting speed gap with captive competitors over time.
A bull case near 7.8 percent growth hinges on sustained infrastructure spending keeping equipment prices and financed volumes elevated across most major contractor segments nationwide. A bear case near 5.2 percent follows rising interest rates curbing contractor appetite for new financed equipment purchases and pushing more activity toward equipment rental instead of outright ownership for many contractors.

Captive Lenders Redraw the Equipment Financing Landscape

Equipment financing sits at the intersection of manufacturer sales strategy and credit underwriting, forcing lenders to balance aggressive approval speed against genuine residual value risk on equipment that can lose substantial value if a borrower defaults mid-term. Captive lenders manage this tension differently than banks, since they can absorb thinner margins in exchange for locking in equipment sales through their parent manufacturer's dealer network.
MARKET CONCENTRATIONCR5 38%Fragmented across captive lenders, banks, and independents nationwide
AVERAGE FINANCED AMOUNT$165,000 per transactionReflects rising average new equipment purchase price levels
CAPTIVE LENDER SHAREOEM captives 42%Portion of originations funded directly by manufacturer finance arms
AVERAGE LOAN TERM5 yearsTypical financing term length across most equipment categories nationwide
APPROVAL TURNAROUND TIME24 to 48 hoursTime typically required for standard credit decision completion today
DELINQUENCY RATE1.8% of portfolioPortion of outstanding equipment finance balances currently past due
Underwriting speed is now the primary competitive battleground, as contractors increasingly select financing partners based on how quickly they can move from application to funded equipment delivery on an active job site timeline. Lenders slow to digitize approval workflows, relying instead on manual credit committee review, are losing origination volume to competitors offering same-day decisions backed by telematics and payment history data.
Consolidation is reshaping the lender landscape as larger platforms acquire smaller regional equipment finance companies to gain dealer relationships and portfolio scale simultaneously. Contractors increasingly prefer financing partners who also understand equipment-specific residual value dynamics, even when that means accepting a slightly higher rate in exchange for a lender who won't over-collateralize or under-value trade-in equipment during a refinancing negotiation.
"Banks used to win on rate alone. Now contractors care more about how fast they can get equipment on-site, and that shift has quietly handed captive lenders the upper hand in most deals."
Practice Lead, Construction Finance and Equipment Markets · MMA Construction Equipment Financing and Leasing Services Practice · September 2026

Market Trends

Telematics-Based Underwriting Expands Lending to Thin-File Borrowers

Alternative lenders are increasingly using equipment telematics data, including utilization hours and maintenance history, to underwrite smaller contractors who lack the multi-year credit history traditional banks require for approval. This data-driven approach lets lenders price risk more precisely than relying on credit scores alone, extending financing to contractors previously considered too risky to serve profitably. Roughly 42 percent of new originations now flow through captive and alternative lenders using some form of equipment usage data in underwriting decisions, up sharply from a much smaller base just five years earlier, and adoption continues accelerating industry-wide.
Market Impact: Raises average transaction size to $165,000
Digital Approval Workflows Compress Financing Decision Timelines

Lenders across the category are replacing manual credit committee review with automated digital approval workflows that pull credit, equipment, and dealer data simultaneously to render financing decisions within hours rather than days. This shift matters most for time-sensitive equipment purchases where contractors need machines on an active job site quickly to avoid costly project delays. Approval turnaround time has fallen to roughly 24 to 48 hours at leading lenders, down meaningfully from the multi-day timelines that were standard just several years ago, and further compression is actively underway across most competitors.
Market Impact: Sustains 78% infrastructure-linked financing demand

Market Opportunities and Growth Drivers

Rising Equipment Prices Increase Average Financed Amounts

Sustained new equipment price inflation, driven by higher steel input costs and increasingly sophisticated onboard electronics and emissions control systems, has pushed the average financed transaction amount to roughly 165,000 dollars per unit, up meaningfully from levels just a few years earlier. Contractors increasingly need financing even for equipment categories they previously purchased with cash reserves, expanding the addressable pool of financeable transactions across nearly every equipment class. Lenders benefit directly from larger average balances, even as higher prices modestly increase per-transaction credit risk exposure across their broader loan portfolios industry-wide.
Market Impact: Adds 150 basis points

Federal Infrastructure Spending Sustains Equipment Demand

Continued federal infrastructure investment, funding thousands of active highway, bridge, and utility projects nationwide, keeps contractor equipment purchasing activity elevated and sustains financing origination volume across nearly every major equipment category tracked in this report and every region served. Each new project awarded adds recurring financing demand as contractors expand fleets to handle larger simultaneous workloads across multiple active job sites. Lenders with strong dealer network relationships in infrastructure-heavy regions are capturing a disproportionate share of this project-driven financing volume ahead of competitors slower to build similarly comparable dealer relationships and financing programs.
Market Impact: Widens residual value risk buffer 8%

Market Restraints and Challenges

Rising Interest Rates Compress Lender and Borrower Margins

Elevated benchmark interest rates over the past several years have increased the cost of capital for lenders funding equipment portfolios, while raising monthly payments for contractors financing new purchases at variable or newly originated fixed rates. The root cause is that most lenders fund portfolios through wholesale credit markets directly tied to benchmark rates, leaving little room to absorb increases without passing them through to borrowers. The commercial impact shows up as contractors delaying non-essential purchases or shifting toward shorter loan terms to limit total interest exposure. Some lenders now offer rate-lock programs to help manage this uncertainty.
Market Impact: Adds 42% telematics-informed underwriting share

Residual Value Uncertainty Complicates Lease Structuring

Equipment lessors face growing difficulty forecasting residual values for newer electrified and highly computerized equipment models that lack the multi-decade resale history traditional diesel equipment has established over generations of contractor ownership. The underlying cause is that rapid technology change in equipment powertrains makes older valuation models less reliable predictors of future resale prices. The commercial impact is that lessors must price in wider risk buffers, making leases less price-competitive against loans for contractors confident in equipment longevity. Several lessors are now partnering with equipment auction houses to build better real-time residual value data models.
Market Impact: Cuts approval time to 24-48 hours
3 additional market trends, 4 additional growth drivers, and 3 additional restraints and challenges are covered in the full report. Contact sales@marketmindsadvisory.com to access the complete intelligence.

Segment CAGR and Growth Architecture

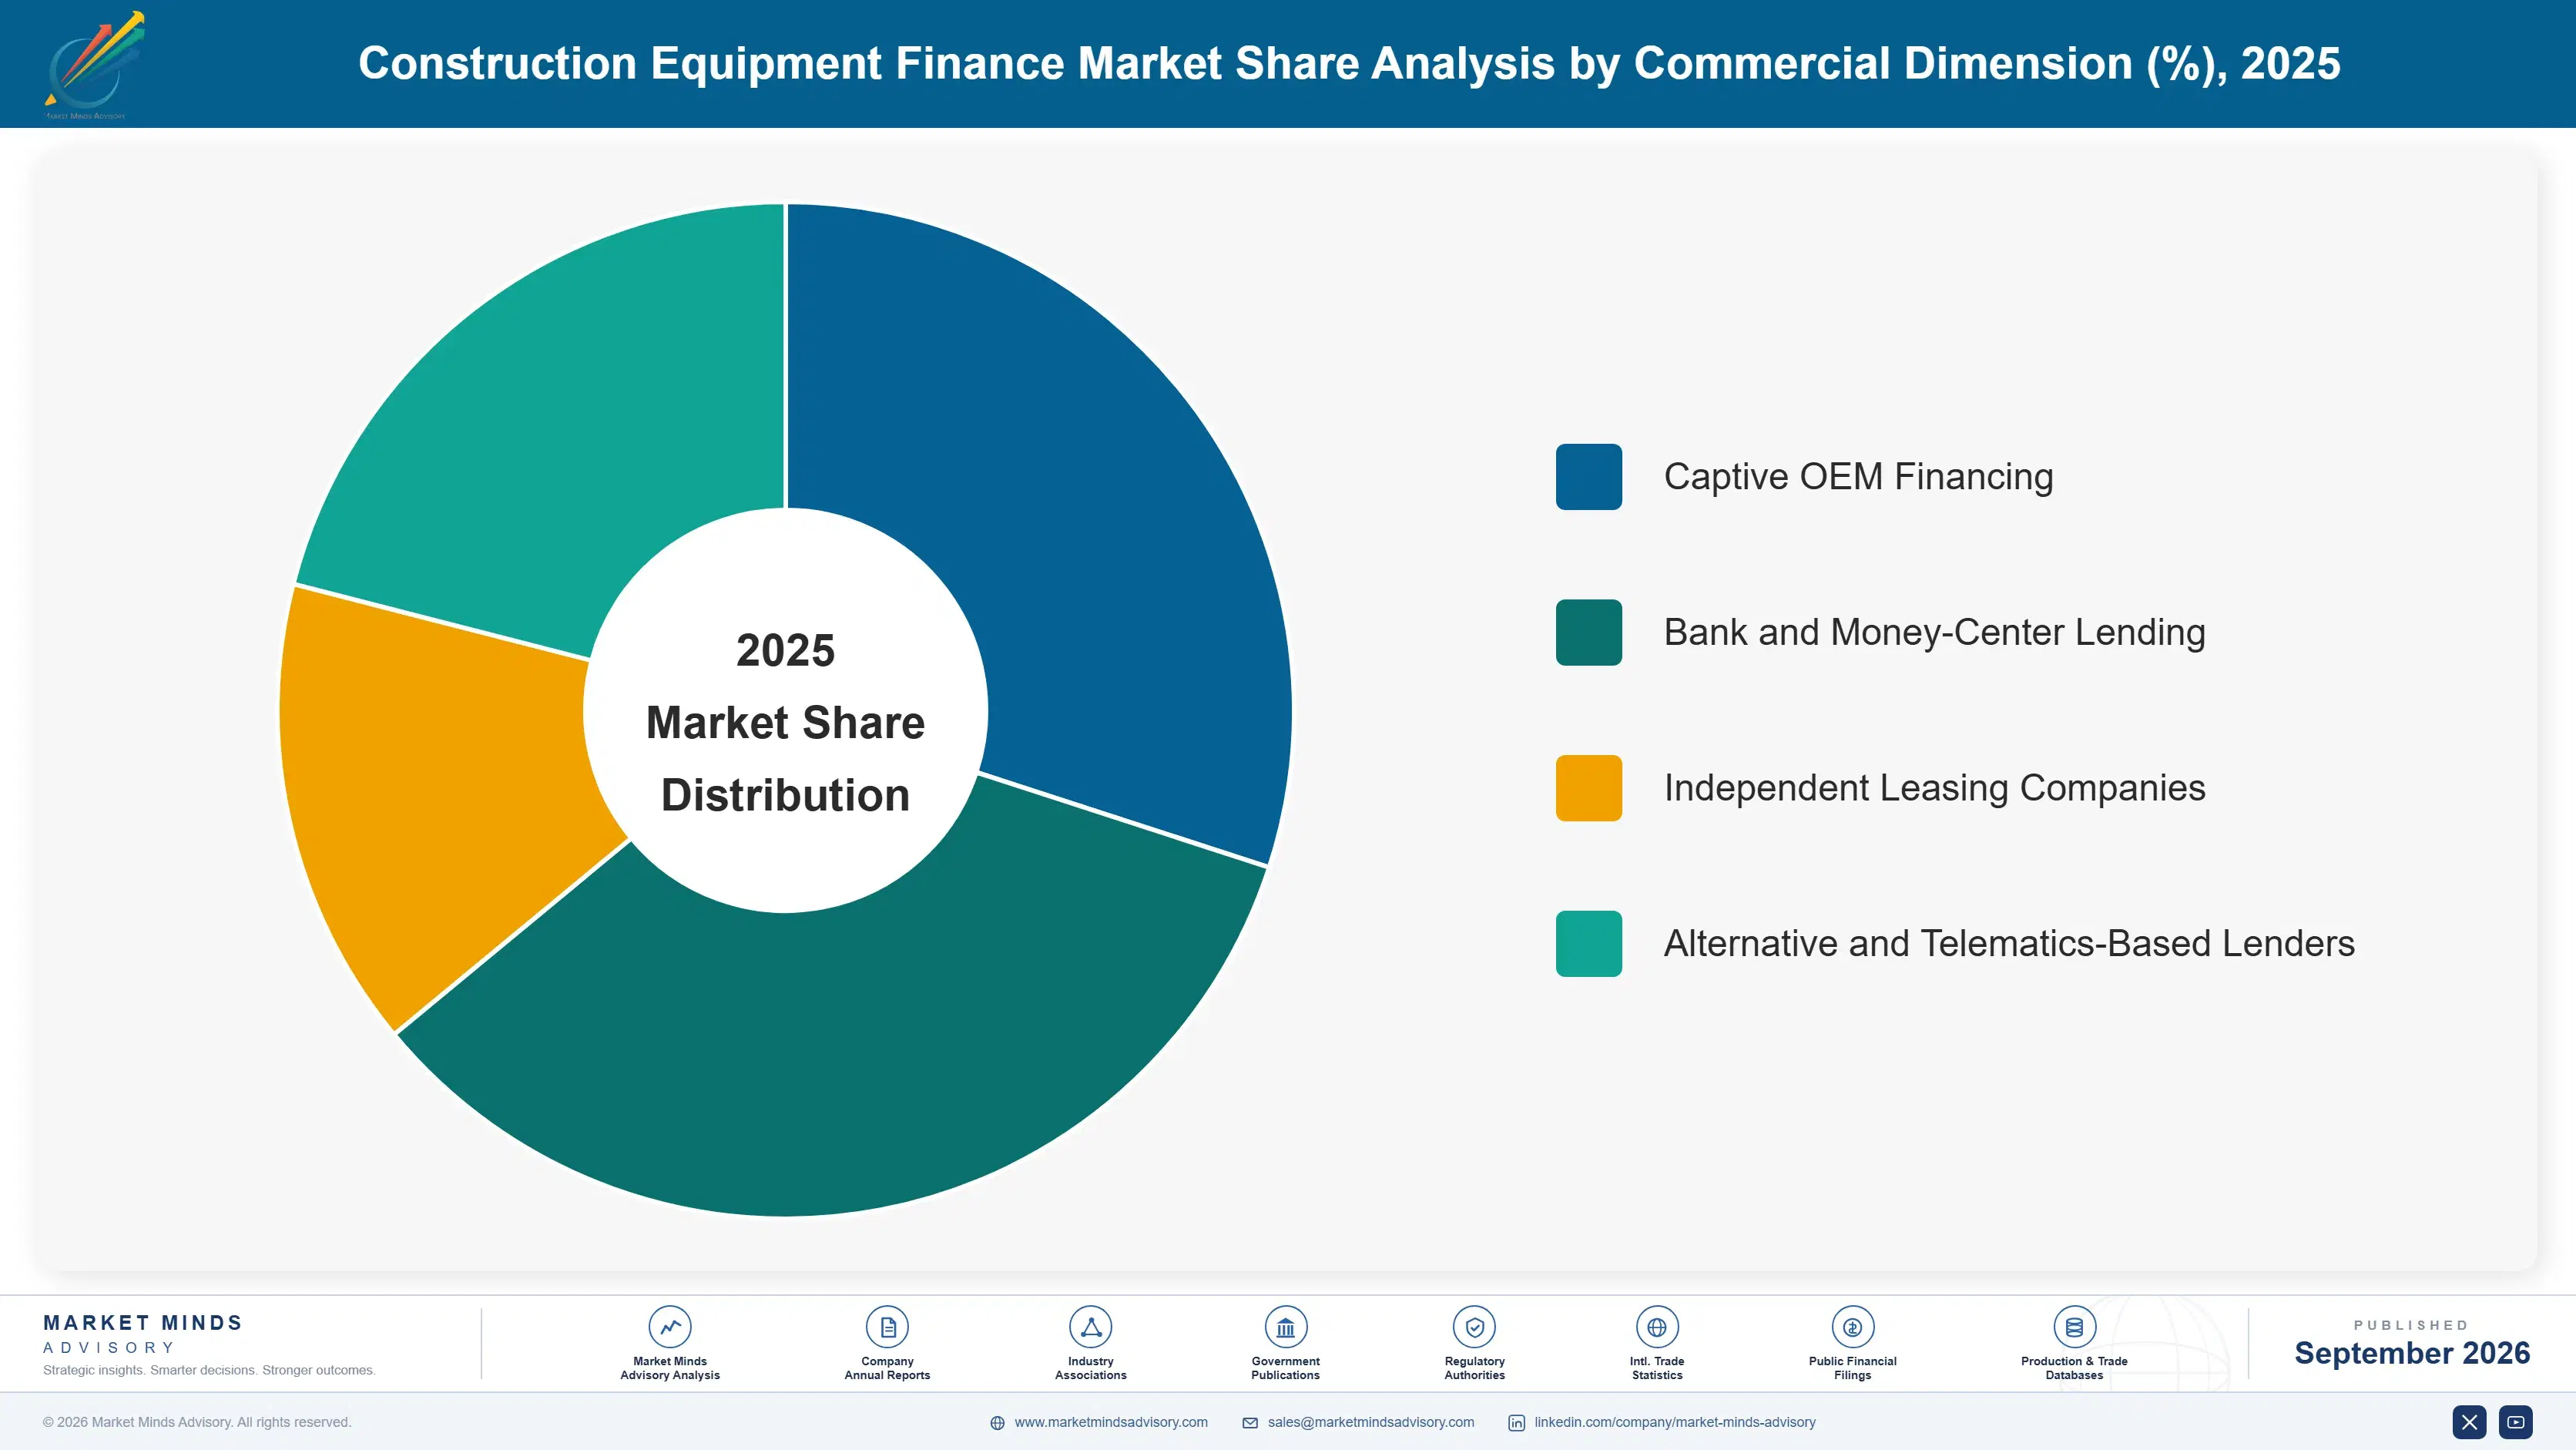
Construction equipment finance segments by equipment class financed across six categories spanning earthmoving equipment, material handling equipment, concrete and road construction equipment, cranes and lifting equipment, compact and utility equipment, and specialty and attachment equipment, each carrying a distinct residual value and credit risk profile that shapes how lenders underwrite and price financing terms.
construction-equipment-finance-market-market-share-analysis-1788420877584

Cranes and Lifting Equipment

Cranes and lifting equipment financing covers tower cranes, mobile cranes, and boom lifts used on large infrastructure and commercial construction projects, a category where high per-unit prices push most contractors toward financing rather than outright cash purchase. Demand is accelerating fastest here as data center and infrastructure megaprojects drive demand for specialized lifting equipment few contractors can afford to purchase outright without financing support. Lenders who built genuine expertise valuing this specialized equipment class early, rather than treating it like standard earthmoving equipment, are winning the largest share of new financing volume and capturing better risk-adjusted margins across their portfolios. Insurance and residual value guarantee partnerships increasingly accompany the largest crane financing deals given the concentrated exposure one unit represents.
CAGR 8.5%

Compact and Utility Equipment

Compact and utility equipment financing covers skid steers, mini excavators, and compact track loaders, a category growing quickly as urban infill construction and smaller contractors entering the market drive demand for lower-cost entry-level equipment. Shorter loan terms and smaller average balances characterize this segment relative to larger equipment classes, but higher unit volume and strong resale markets make it attractive to lenders seeking portfolio diversification away from concentrated large-ticket exposure. Growth here trails cranes and lifting slightly but benefits from consistently high transaction volume that sustains steady origination activity even during periods of slower overall construction spending. Fintech-style digital lenders have found particular success in this segment given its smaller ticket sizes and faster underwriting turnaround expectations.
CAGR 8.0%
Full segment breakdown across 6 segments available in the complete report.

Regional Architecture and Country Demand Map

Demand concentrates around dense construction activity zones and captive lender headquarters, with financing penetration and underwriting sophistication varying sharply by regional credit market maturity, dealer network density, and telematics-based underwriting adoption across major contractor markets worldwide. These dynamics shape which lenders win the most volume.

North America

North America holds the largest share by a wide margin, anchored by Caterpillar Financial Services, John Deere Financial, and Wells Fargo Equipment Finance all headquartered in the region and running the most sophisticated captive lending programs globally. Federal infrastructure spending continues funding thousands of active highway, bridge, and utility projects that sustain elevated equipment financing origination volume nationwide. Dense dealer networks across the United States and Canada give captive lenders direct point-of-sale access to contractors at the moment of purchase decision, an advantage independent lenders simply lack. Canadian oil sands and mining-adjacent construction activity adds further incremental regional financing demand across several active provinces. Established captive lenders continue expanding digital approval capability faster than most other tracked regions.
Share: 32% | CAGR: 7.5% (2026 to 2036)

East Asia

China's massive infrastructure construction volume and Japan's mature equipment manufacturing base, led by Komatsu's own captive finance arm, keep East Asia's growth rate closely tracking North America's pace despite a less mature independent lending base overall. South Korea's construction equipment exporters increasingly bundle financing with hardware sales to capture recurring interest revenue alongside equipment margins. Domestic Chinese leasing companies are emerging rapidly, competing directly with established international captive lenders on price for smaller domestic contractors. Growth here reflects genuine new construction activity rather than pure credit market deepening alone across most major metropolitan construction markets. Continued urbanization keeps driving new equipment purchases that increasingly arrive with bundled captive financing offers.
Share: 23% | CAGR: 7.5% (2026 to 2036)
Regional intelligence for 5 additional markets available in the complete report: Western Europe, South Asia and Pacific, Latin America, Middle East and Africa, Eastern Europe. Contact sales@marketmindsadvisory.com.
construction-equipment-finance-market-country-cagr-analysis-1788420878092

Where Equipment Lenders Capture Margin

Lenders expand margin by moving beyond standard term loans toward embedded point-of-sale financing, telematics-based underwriting for thin-file borrowers, and value-added residual value guarantee programs, each capturing origination volume that a narrow standard loan product otherwise leaves for competitors to claim across the same dealer relationship over the entire multi-year financing relationship and lifecycle together.

Embed Financing Directly Into Dealer Point-of-Sale Systems

Lenders integrating financing applications directly into dealer point-of-sale systems, rather than requiring a separate application process after the sale, capture roughly 30 percent higher approval-to-funding conversion rates than lenders relying on standalone application portals. Contractors increasingly expect financing decisions within the same conversation as the equipment purchase itself, rewarding lenders who eliminate friction between browsing and financing. Building this integration requires deep dealer management system partnerships that smaller independent lenders struggle to replicate without significant technology investment over multiple years. Few competitors can replicate this integration quickly. Deep dealer relationships remain the key differentiator here.
Market Impact: Adds a full 30% higher conversion rate overall

Offer Telematics-Based Underwriting for Thin-File Borrowers

Lenders using equipment telematics and payment history data to underwrite contractors without extensive credit history capture incremental origination volume at a premium yield of 2 to 3 percentage points over standard credit-score-based pricing. Contractors accept the premium in exchange for approval they could not otherwise obtain through traditional underwriting channels. This lever works best for lenders already holding telematics data partnerships, since building that data pipeline from scratch requires meaningful up-front technology investment and equipment manufacturer relationships most new entrants lack entirely. Data pipeline gaps keep most competitors locked out.
Market Impact: Commands a 2 to 3 point underwriting yield premium

Cross-Sell Extended Service and Insurance Products

Lenders that successfully cross-sell extended warranty, maintenance service contracts, and equipment insurance products alongside core financing capture incremental fee revenue at a fraction of the cost of winning a brand-new borrower relationship from scratch entirely. This cross-sell motion works particularly well at the point of initial financing, when contractors are already engaged in equipment-related purchasing decisions and receptive to bundled offers. Roughly 28 percent of financed transactions now also include at least one attached product, up meaningfully from a much smaller base just a few years earlier. Onboarding these products adds minimal incremental sales friction.
Market Impact: Reaches a full 28% attached-product penetration rate now

Provide Residual Value Guarantee Programs for Lessors

Lenders offering residual value guarantee programs, where the lender absorbs some downside risk on equipment resale value in exchange for a fee, command a premium of roughly 1 to 2 percentage points on top of standard lease pricing. Contractors and dealers find this service particularly valuable for equipment categories with genuinely uncertain resale markets, since it effectively transfers valuation risk to a party better positioned to model it. This lever requires lenders to build genuine equipment valuation expertise in-house, a capability that takes years to develop credibly and reliably. Few lenders currently offer this at meaningful scale.
Market Impact: Commands a 1 to 2 point residual guarantee fee

Who Controls the Margin Pool

Concentration sits at 38 percent among the top five lenders on an origination volume basis, a fragmented level reflecting a market split between captive manufacturer finance arms, money-center banks, and independent leasing specialists competing for the same origination pool. Caterpillar Financial Services and John Deere Financial lead by a meaningful margin, both benefiting from exclusive dealer network relationships across thousands of active locations nationwide. Both companies also hold decades-long dealer relationships that newer entrants cannot realistically replicate.
Current competitive activity centers on digital underwriting speed, as lenders race to compress approval timelines ahead of contractors' shifting expectations around same-day financing decisions. Several lenders are also expanding into telematics-based underwriting through partnership or acquisition, betting that data-driven risk pricing will win volume from thin-file borrowers traditional banks cannot profitably serve.

Emerging pressure comes from fintech-style alternative lenders using equipment usage data for underwriting, a genuinely different competitive threat than traditional bank competitors have posed before. Rankings are most likely to shift around the compact and utility equipment segment specifically, where underwriting speed and data sophistication, not brand recognition alone, increasingly determine which lender wins new origination volume.
construction-equipment-finance-market-company-positioning-matrix-1788420878614

Competitive Moat and Risk Dimensions

CATERPILLAR FINANCIAL SERVICES

Moat: Exclusive Dealer Network Access

Caterpillar Financial's embedded position within Caterpillar's global dealer network gives it point-of-sale access to nearly every Caterpillar equipment purchase, an advantage independent lenders cannot replicate without owning the dealer relationship themselves directly. This positioning wins the overwhelming majority of financing volume on Caterpillar-branded equipment purchases specifically.
CATERPILLAR FINANCIAL SERVICES

Risk: Limited Cross-Brand Volume

Caterpillar Financial's model naturally concentrates on Caterpillar-branded equipment, leaving it less competitive for contractors financing mixed-brand fleets who prefer a single lending relationship across multiple manufacturers. Independent lenders and banks increasingly win these mixed-fleet accounts specifically because of this brand concentration limitation. Diversifying beyond its own brand remains a slow, deliberate process.
JOHN DEERE FINANCIAL

Moat: Deep Agricultural and Construction Overlap

John Deere Financial benefits from overlapping agricultural and construction equipment dealer relationships, letting it cross-sell financing to contractors who also operate Deere agricultural equipment on adjacent projects. This dual-market positioning wins contracts that construction-only lenders cannot realistically compete for as effectively. Few competitors match this dual-sector dealer reach.
JOHN DEERE FINANCIAL

Risk: Slower Digital Approval Rollout

John Deere Financial has moved more cautiously than some competitors in rolling out fully digital approval workflows, occasionally losing time-sensitive deals to faster-moving fintech-style lenders. Closing this gap requires sustained technology investment that the company has only recently begun prioritizing at scale. Faster fintech-style rivals continue setting the pace on approval turnaround.

Players Tracked

Prominent Players

Caterpillar Financial Services
John Deere Financial
Wells Fargo Equipment Finance
CNH Industrial Capital
Volvo Financial Services

Other Key Players

Komatsu Financial
DLL
Banc of America Leasing
PNC Equipment Finance
US Bank Equipment Finance
KeyBank Equipment Finance
People's Capital and Leasing
Crest Capital
Balboa Capital
Ascentium Capital
Direct Capital
Marlin Business Services
Great America Financial Services
Signature Financial
Commerce Bank Equipment Finance

Recent Developments

FEBRUARY 2025

Wells Fargo Equipment Finance Launches Digital Approval Platform

Wells Fargo Equipment Finance launched a new digital approval platform capable of rendering standard credit decisions within 24 hours, replacing a multi-day manual review process for most routine equipment financing applications submitted through participating dealer networks nationwide, ahead of two subsequent competitor launches this year.
Signal: Signals traditional banks are investing heavily to close the underwriting speed gap with captive lenders quickly.
JULY 2025

CNH Industrial Capital Expands Telematics-Based Underwriting Program

CNH Industrial Capital expanded its telematics-based underwriting program to cover a broader range of equipment categories, using utilization and maintenance data to extend financing approval to smaller contractors previously considered too risky under traditional credit scoring models used industry-wide for decades. Analysts expect competitors to broaden similar programs soon.
Signal: Confirms telematics-informed underwriting is expanding well beyond pilot programs into mainstream lending. More lenders will follow soon.
NOVEMBER 2025

Volvo Financial Services Signs Residual Value Guarantee Partnership

Volvo Financial Services signed a residual value guarantee partnership with an independent equipment auction house, improving its ability to price leases on newer electrified equipment models lacking established multi-decade resale history across most contractor segments nationwide this cycle. Terms of the arrangement were not fully disclosed publicly.
Signal: Indicates lessors are increasingly outsourcing residual value risk modeling to specialized partners. More deals will follow.

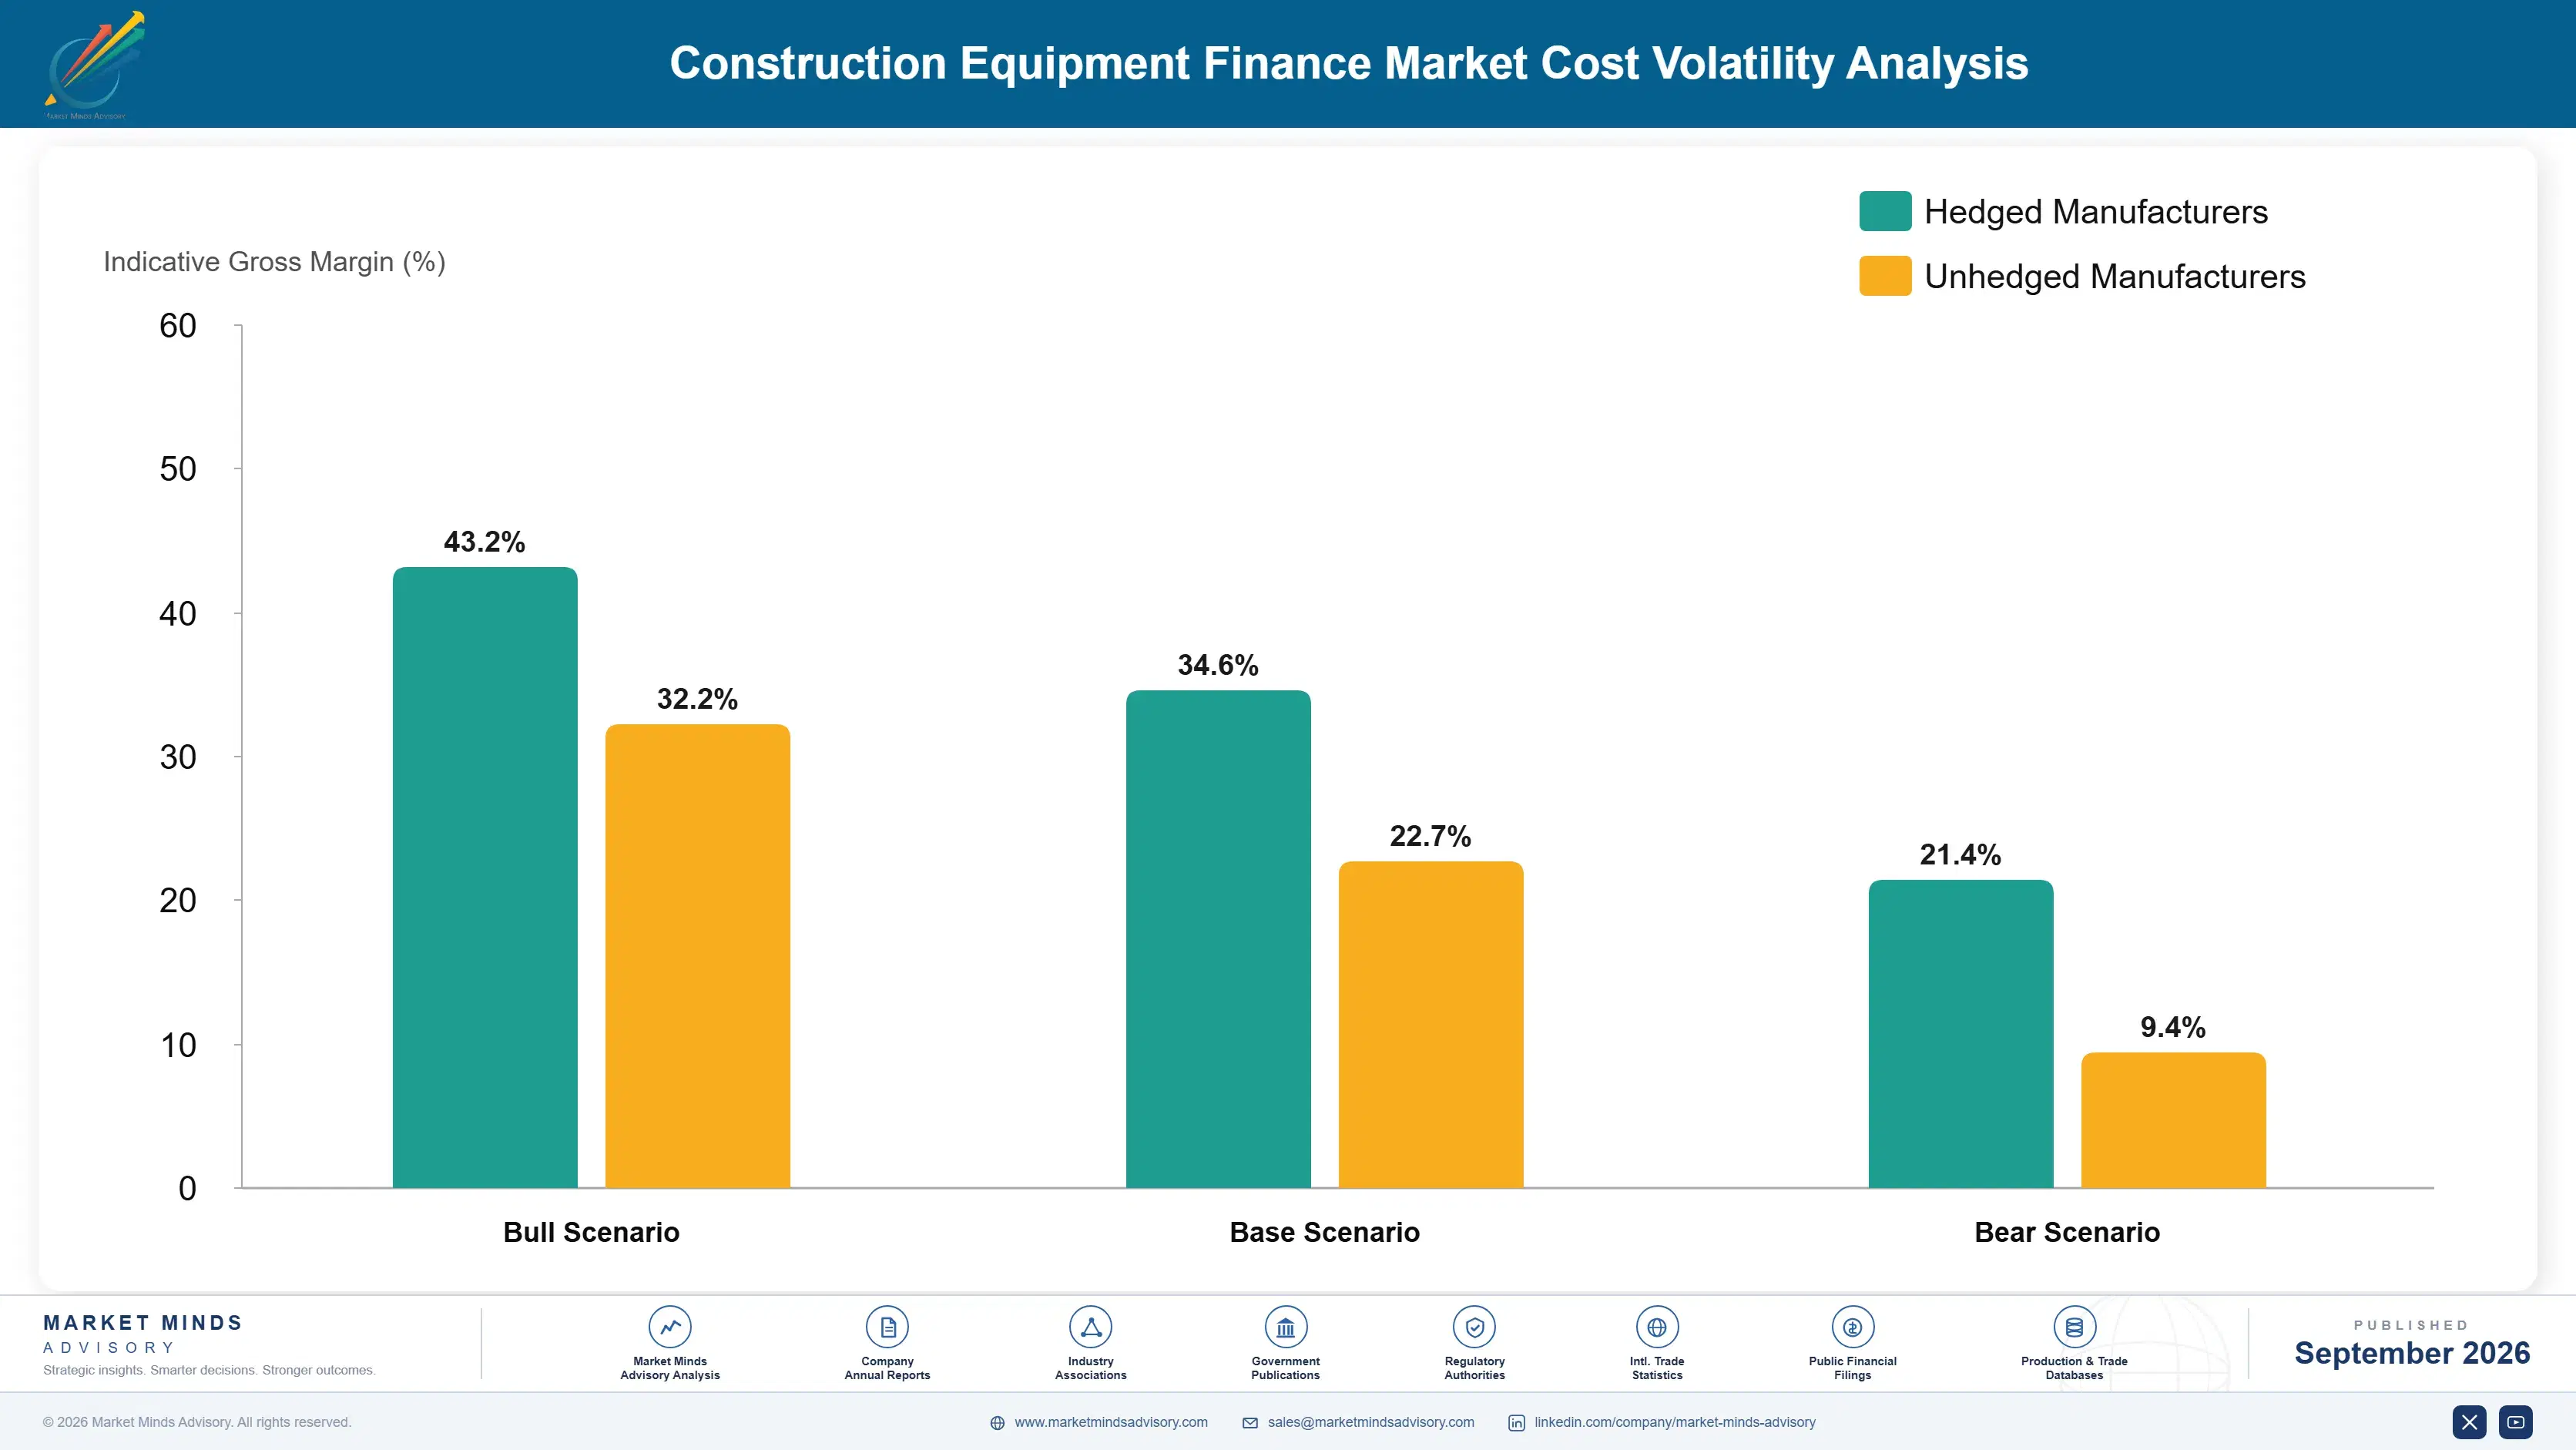
Wholesale Funding and Credit Loss Costs

Wholesale funding costs, tied directly to benchmark interest rates, account for roughly 55 percent of total cost-to-serve for equipment lenders, sourced primarily through commercial paper markets and bank credit facilities rather than retail deposits most captive lenders lack access to. Credit loss provisioning against delinquent and defaulted accounts represents the second largest cost input, varying meaningfully by borrower credit quality and equipment category residual risk.
A 2023 rate tightening cycle, documented in several major lenders' own annual reports, pushed wholesale funding costs up meaningfully for equipment lenders carrying large variable-rate portfolios, compressing net interest margins and forcing several smaller independent lenders to tighten underwriting standards or exit certain higher-risk equipment categories entirely for multiple consecutive quarters before conditions finally stabilized across the broader lending industry as a whole this cycle.

Smaller independent lenders without diversified funding sources face the sharpest cost exposure, since they typically borrow at spread premiums over benchmark rates while the largest captive lenders access cheaper parent-company-backed funding unavailable to standalone competitors. This dynamic increasingly separates lenders by scale, since larger platforms can absorb funding cost volatility that would meaningfully compress a smaller competitor's already thin net interest margin.
construction-equipment-finance-market-cost-volatility-analysis-1788420878810

Diversify Funding Sources Beyond Commercial Paper

Lenders increasingly diversify funding across commercial paper, securitization markets, and committed bank credit facilities to reduce dependence on any single funding channel, trading some complexity for meaningfully more resilient and stable access to capital during periods of market stress. Several lenders now maintain formal contingency funding plans specifically to manage a sudden channel disruption.

Match Asset and Liability Duration More Precisely

Lenders are matching the duration of funded loan portfolios more precisely against their underlying funding sources, reducing exposure to interest rate mismatches that compress margins when rates move faster than portfolio repricing schedules allow. Larger lenders with dedicated treasury teams and sophisticated modeling capability have the clearest advantage here. This capability is becoming a genuine competitive differentiator.

Tighten Underwriting on Higher-Risk Equipment Categories

Some lenders are tightening underwriting standards specifically on equipment categories with the least predictable residual values, accepting reduced origination volume in exchange for materially lower credit loss exposure across their overall loan portfolio. Smaller lenders find this discipline harder to sustain without losing volume to rivals. The tradeoff between volume and risk remains a constant balancing act.

Portfolio Architecture for Margin Defence

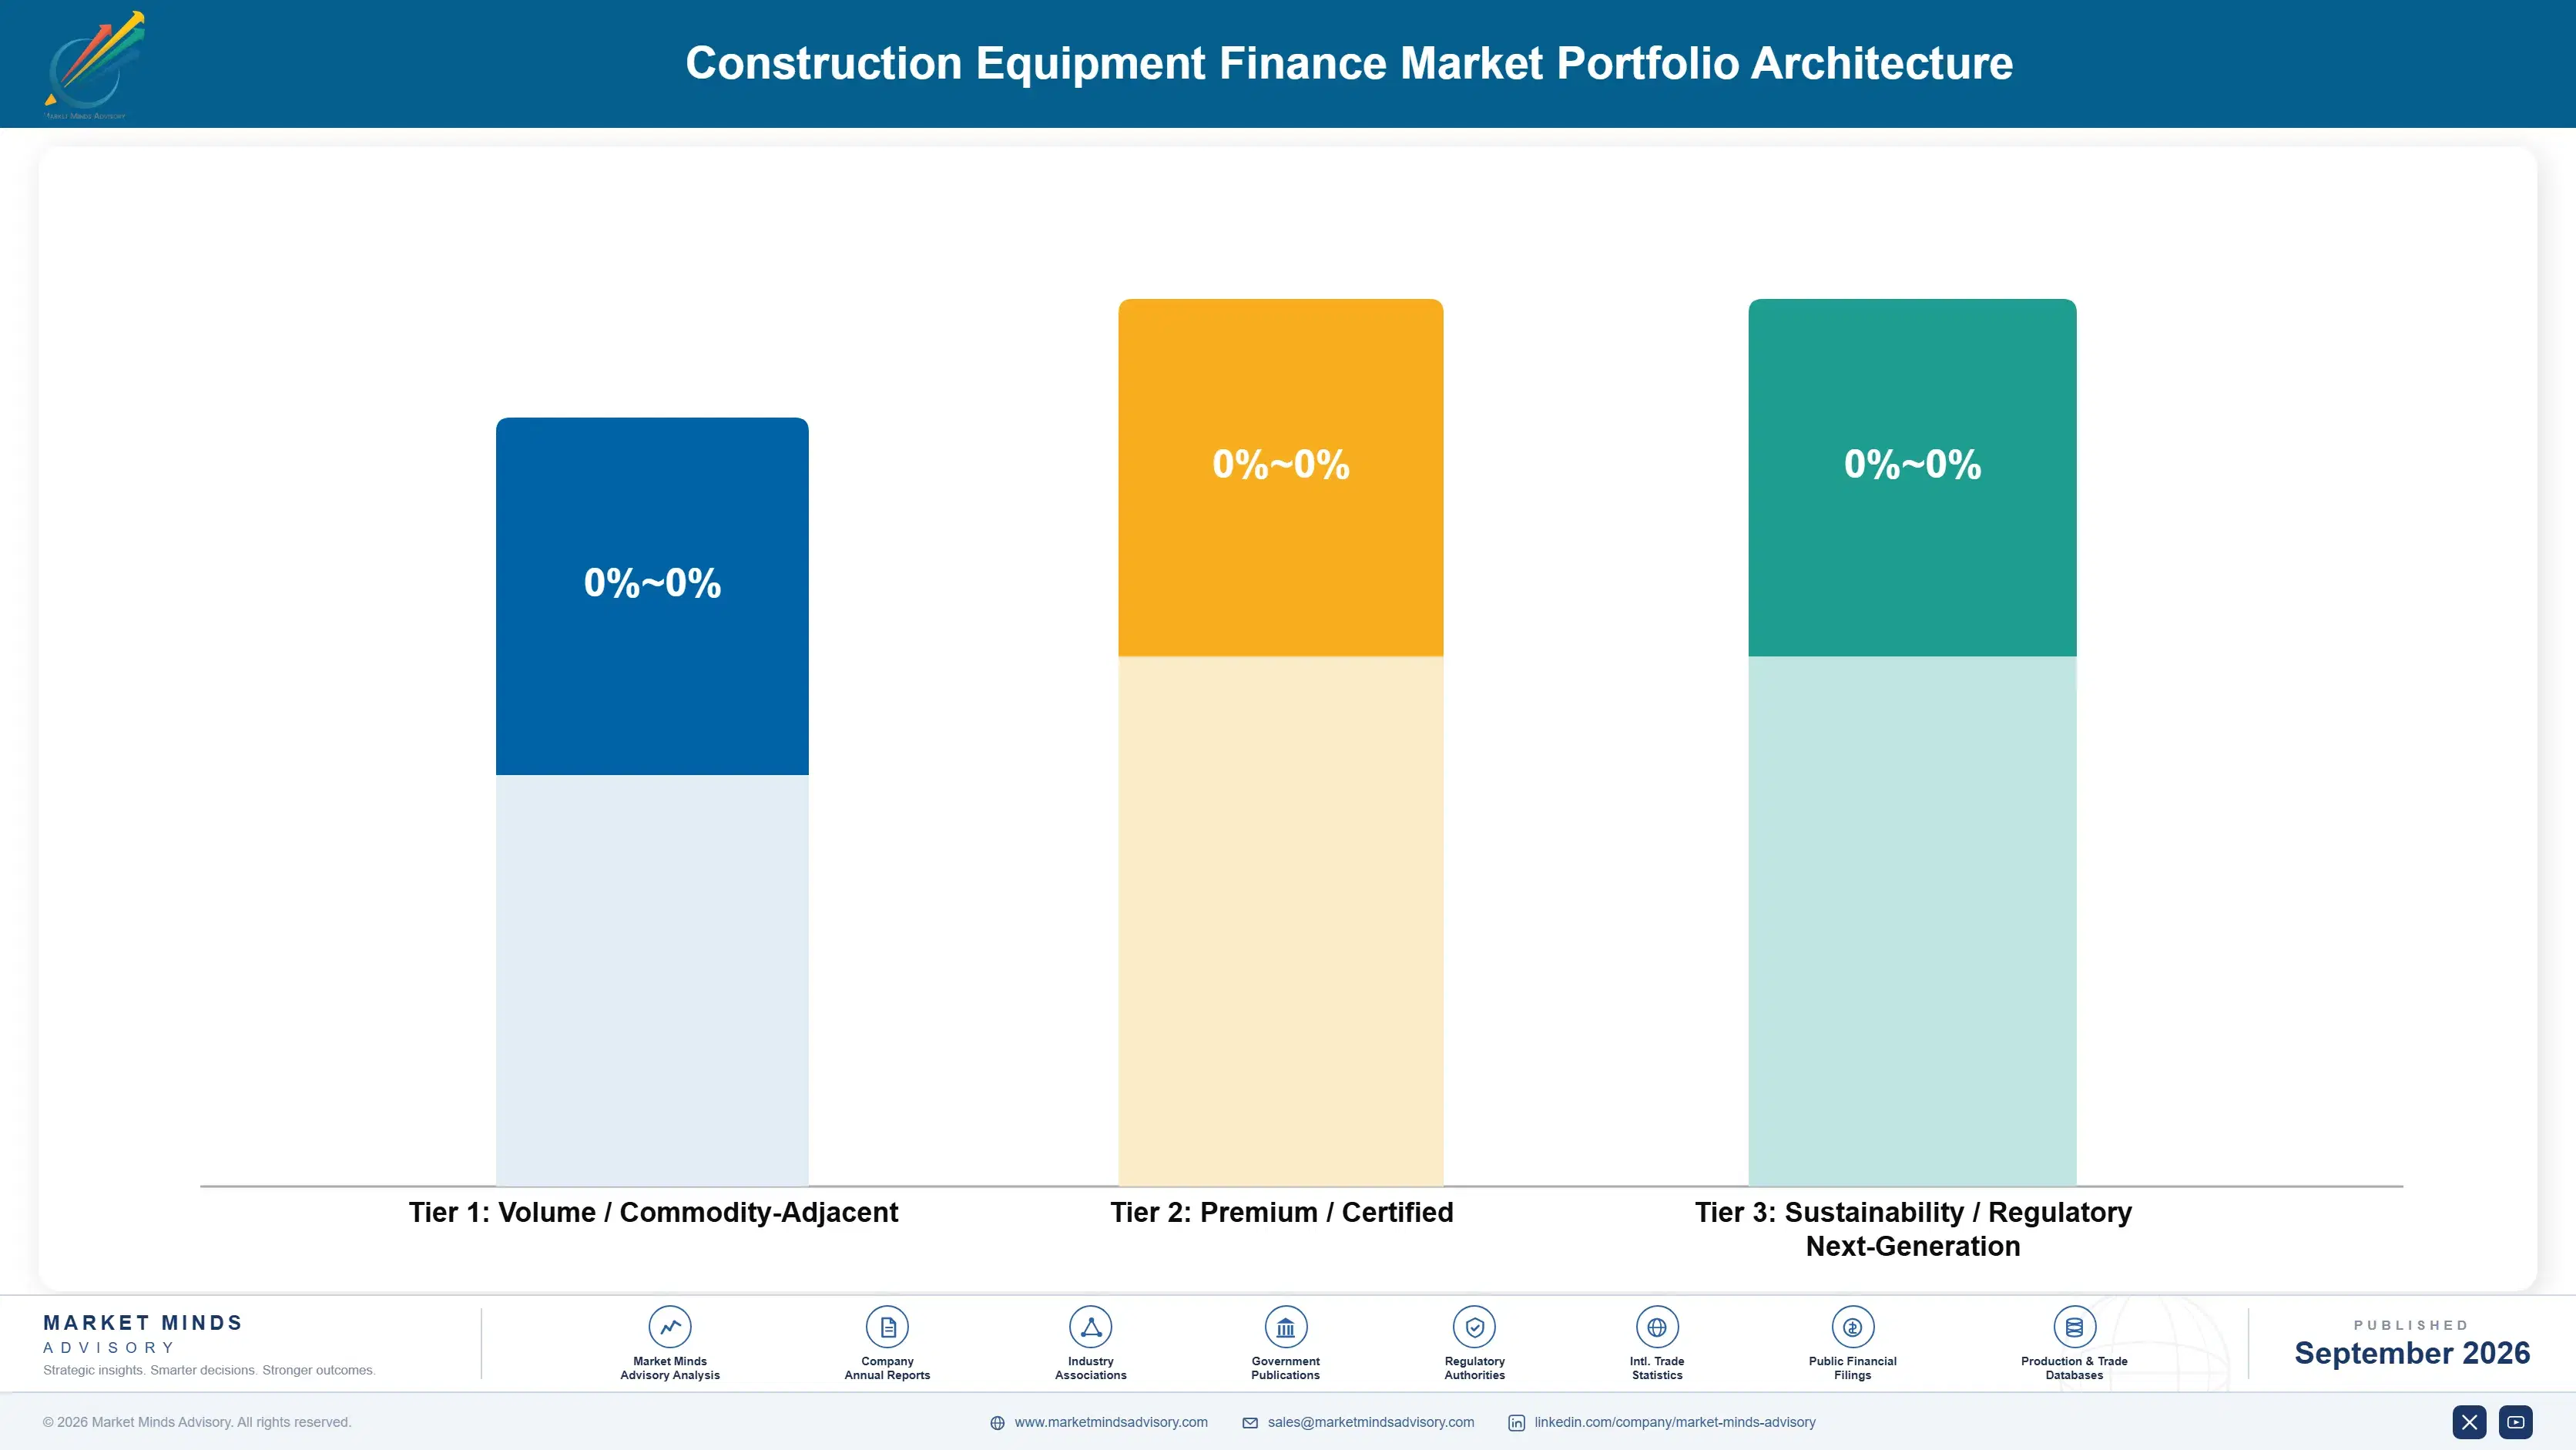
Lender economics split along a volume-versus-yield axis, with standard term loans on common equipment categories competing largely on rate while specialized financing for high-value or thin-file borrowers commands materially wider yield spreads tied to underwriting expertise and risk-pricing sophistication. Net interest margins across the category span a wide range depending almost entirely on which product and borrower mix a given lender's portfolio concentrates in. Lenders that shift portfolio mix toward the higher tiers over time consistently outperform peers competing purely on rate.
Volume tier lenders compete on rate and approval speed for well-qualified borrowers financing common equipment categories, accepting thinner yield spreads in exchange for larger origination volume and lower per-transaction underwriting cost. Premium tier lenders instead compete on underwriting sophistication, since thin-file and specialized-equipment borrowers paying for genuine risk-based pricing access are far less rate-sensitive than well-qualified borrowers financing standard equipment.

High-value yield pools concentrate overwhelmingly in the specialized and thin-file lending tier, where lenders combining telematics-based underwriting with genuine equipment valuation expertise capture spreads unavailable anywhere else in the category. This concentration is pulling lender investment away from pure volume-tier rate competition and toward underwriting sophistication, a shift likely to reshape competitive rankings over the coming several years.

Volume / Commodity-Adjacent

Standard term loans for well-qualified borrowers financing common equipment categories, competing primarily on rate and approval speed rather than deep underwriting differentiation. Yield spreads remain thin given intense lender competition for this large, well-qualified borrower segment.
Gross Margin: 1.5-2.5pp spread

Premium / Certified

Telematics-based underwriting and specialized equipment financing serving thin-file borrowers and high-value equipment categories needing sophisticated risk-based pricing. That combination remains genuinely scarce among smaller independent lenders currently. Few lenders currently offer this combination at meaningful scale.
Gross Margin: 3.0-4.0pp spread

Sustainability / Regulatory / Next-Generation

Residual value guarantee programs and managed advisory services commanding the category's widest spreads through genuine equipment valuation and risk modeling expertise. Few lenders currently operate at this level of sophistication consistently.
Gross Margin: 4.5-6.0pp spread
construction-equipment-finance-market-portfolio-architecture-1788420879312

High-value Sub-segments and Strategic Watch-out

Cranes and Lifting Equipment Financing

Highest-value, fastest-growing category as large infrastructure projects drive demand for expensive specialized equipment, rewarding lenders with deep equipment valuation expertise and residual value modeling capability. Lenders slow to build this capability lose origination volume to faster-moving competitors. Buyers now expect this natively. This is no longer optional.
Gross Margin: high

Compact and Utility Equipment Financing

High-value category growing steadily as smaller contractors enter the market, rewarding lenders with fast digital underwriting and strong dealer relationships across entry-level equipment categories. Digital-first lenders increasingly dominate this fast-cycling, high-volume segment. Contract terms often span multiple years. Lenders now compete very hard for this segment.
Gross Margin: high-moderate

Core Earthmoving Equipment Financing

Volume core category sustained by ongoing fleet replacement cycles, generating steady but slower-growing origination volume with thinner overall yield spreads industry-wide. Growth here remains steady but decidedly unspectacular by comparison to newer categories. Renewal activity still dominates here. Growth trails the newer categories quite meaningfully.
Gross Margin: moderate

Cash-Purchase to Financing Conversion

Strategic watch-out category as remaining cash-purchase contractors eventually shift toward financing as equipment prices climb, a gradual conversion wave that will taper once most holdouts transition. Lenders targeting this shift use simplified, low-friction application processes. Few holdouts remain by comparison. Lenders use simplified onboarding here.
Gross Margin: watch

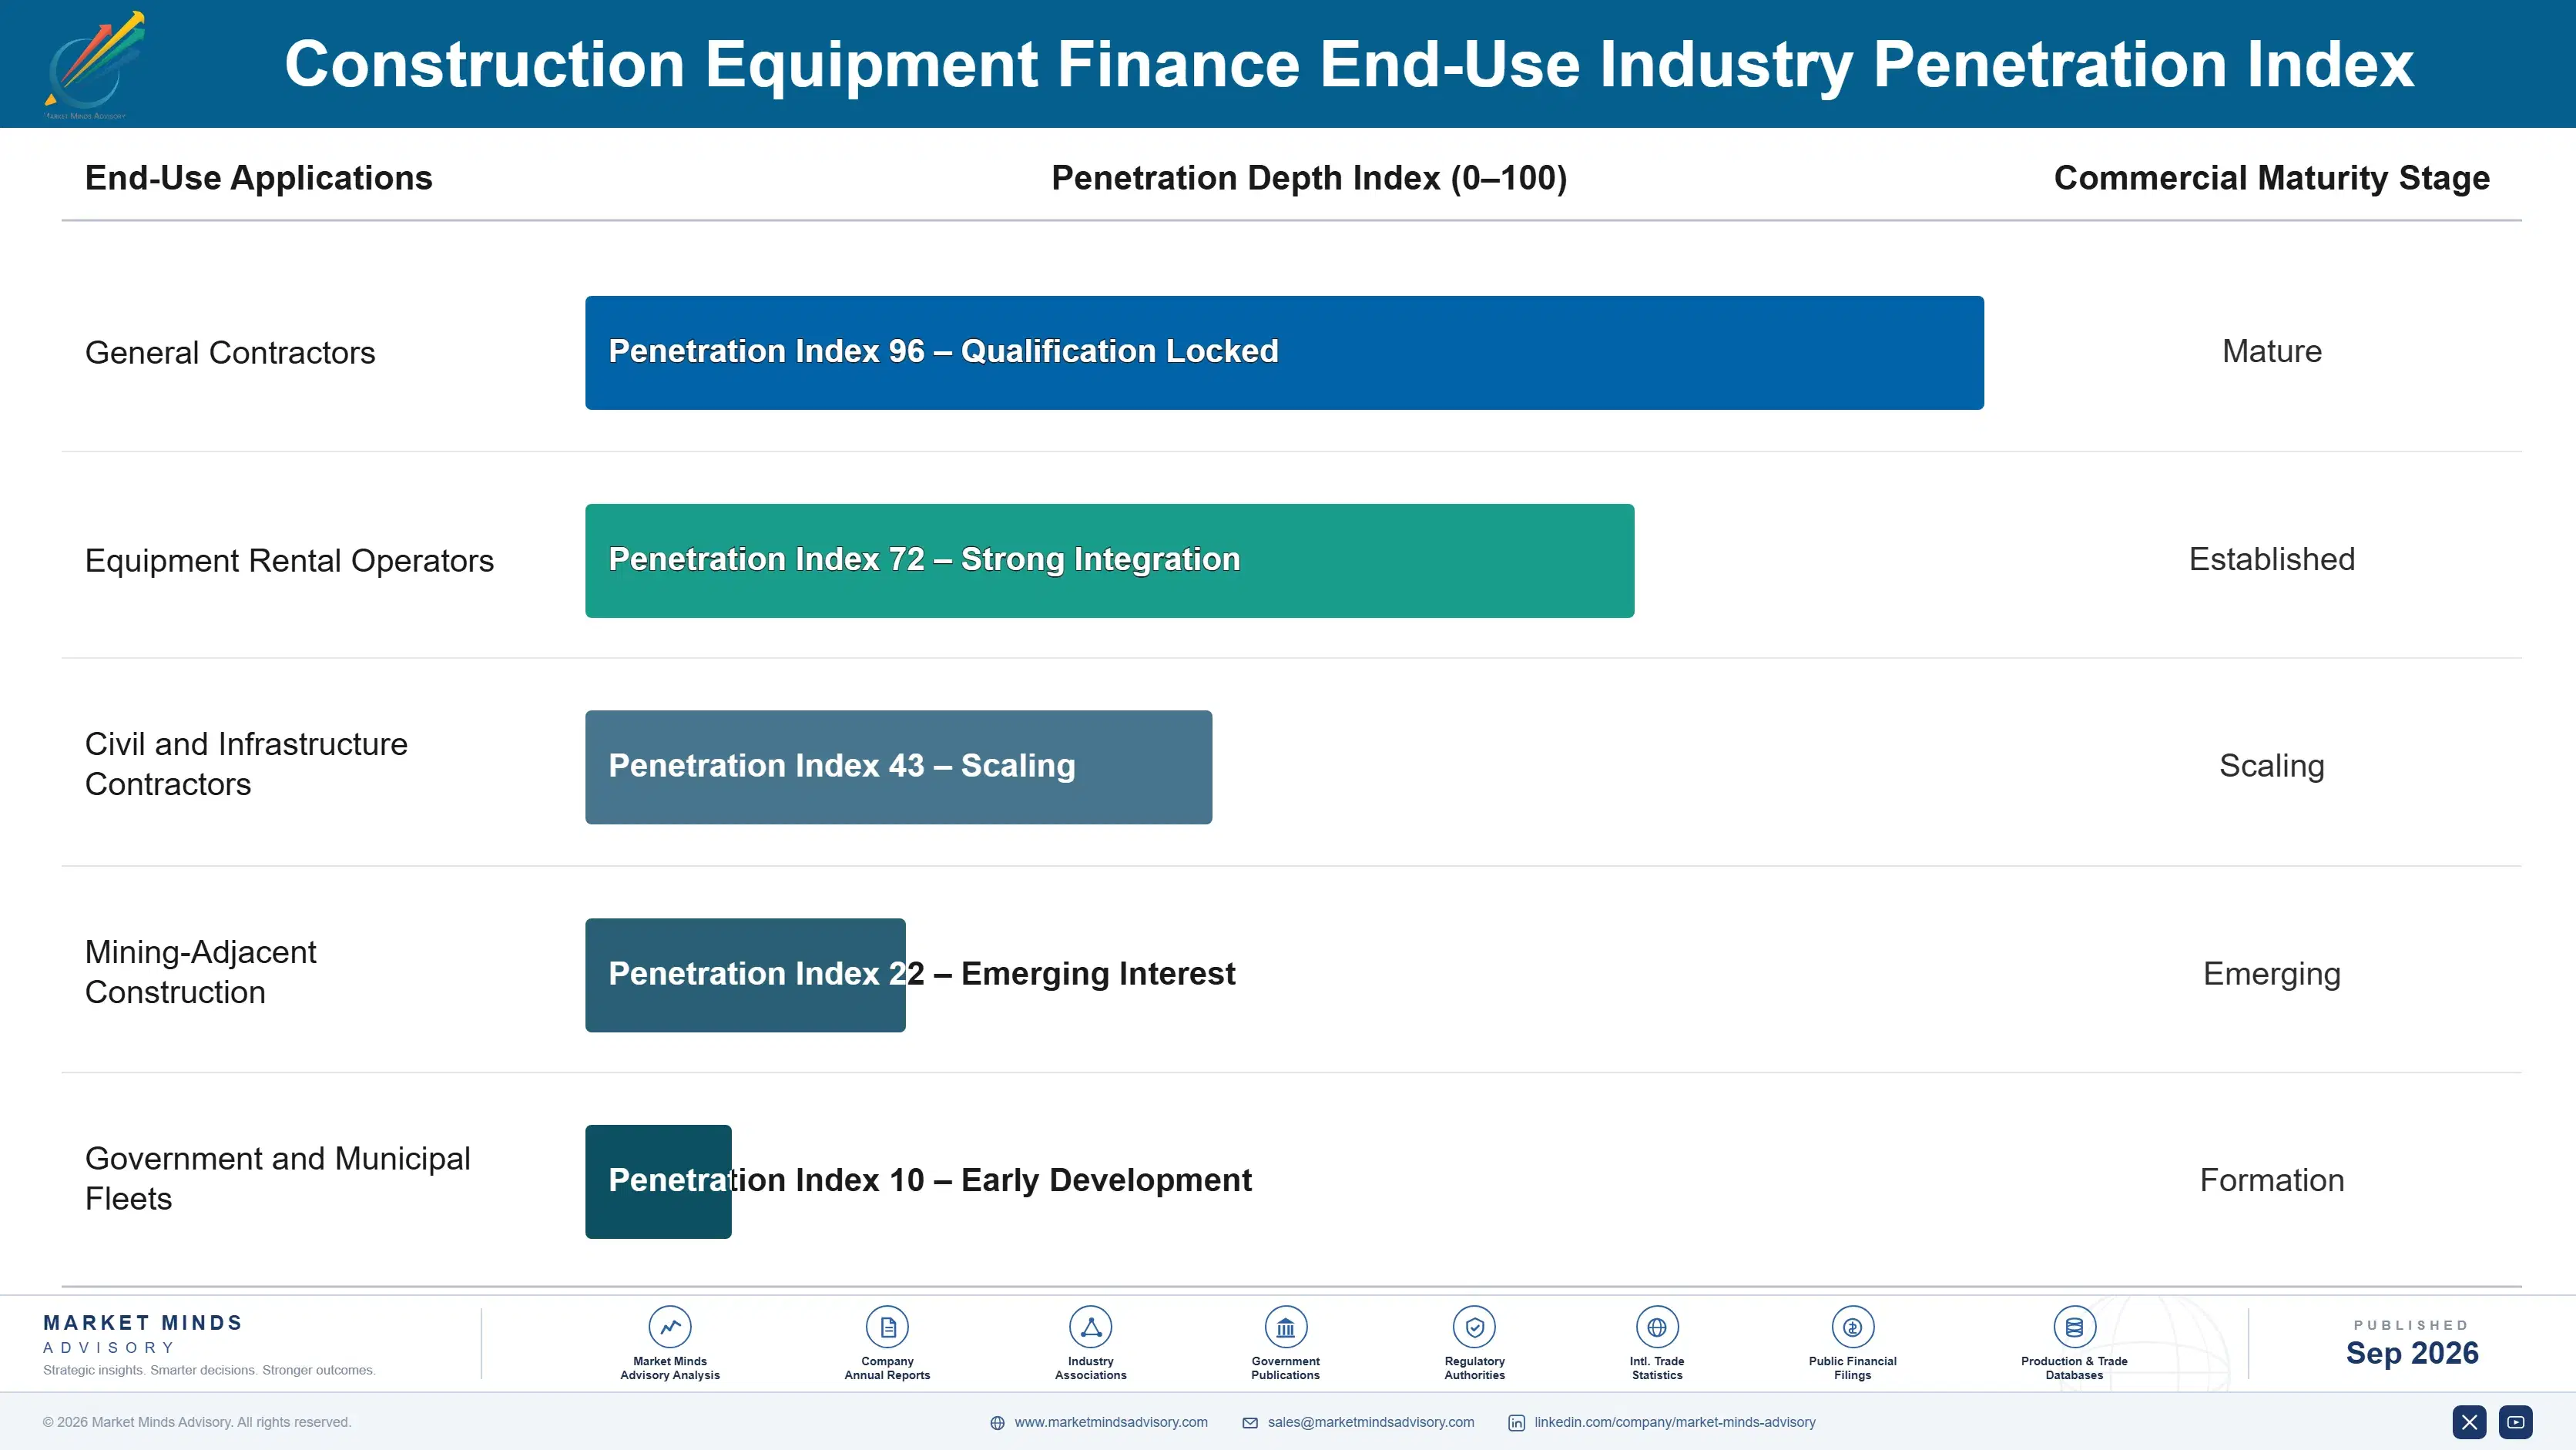
Financing Relationships Persist Across Fleet Cycles

Once a contractor establishes a financing relationship with a lender, including negotiated rate tiers and simplified documentation processes, switching lenders for future equipment purchases requires rebuilding that underwriting relationship from scratch, a friction most contractors avoid unless the incumbent lender genuinely underperforms on rate or approval speed. This creates annuity-like recurring origination revenue that persists across years of stable contractor relationships and predictable fleet renewal cycles.
Adoption stickiness varies by end-use vertical: large enterprise contractors with dedicated finance staff show more willingness to shop rates across multiple lenders for each major purchase, while smaller contractors with thin back-office capacity show the deepest lock-in since they lack internal resources to manage a competitive financing search each time. Rental fleet operators sit closer to the enterprise pattern, given their generally larger dedicated finance and treasury staff.

A generational shift in buyer profiles is underway as procurement decisions move from purely relationship-based dealer financing toward digitally informed rate comparison across multiple lenders, reflecting how younger contractor decision-makers treat financing as a negotiable commodity rather than a fixed dealer relationship handled separately. Younger finance leaders increasingly expect lenders to demonstrate competitive rate transparency upfront during initial evaluation rather than presenting a single take-it-or-leave-it offer.
construction-equipment-finance-market-end-use-penetration-index-1788420879800

MMA Verdict on Equipment Finance

These are among the four positions where our research anticipates prominent divergence between winners and laggards over the coming forecast period. Each is grounded in the demand model, the regulatory perimeter, and the announced capacity pipeline.
01 / DIGITAL UNDERWRITING INVESTMENT

Build digital approval workflows immediately

Lenders still relying on manual credit committee review are losing origination volume to competitors offering same-day digital approval decisions, since contractors increasingly select financing partners specifically on speed rather than rate alone in most transactions. Building digital underwriting capability within the next twelve months positions a lender to capture volume before the speed gap with captive competitors becomes permanently unassailable across most equipment categories tracked in this report. Waiting longer risks losing dealer relationships to faster-moving rivals entirely and permanently.
02 / TELEMATICS DATA PARTNERSHIPS

Pursue telematics underwriting partnerships now

Equipment telematics data represents a genuine opportunity for lenders to extend financing to thin-file contractors that traditional credit scoring models exclude from approval entirely, a segment growing steadily as urban infill construction expands nationwide. Lenders who move first to build formal telematics data partnerships with equipment manufacturers position themselves to capture this underserved segment before competitors close the same gap through their own partnerships. This is a genuine near-term window worth pursuing aggressively before it closes for good across the entire category.
03 / RESIDUAL VALUE MODELING

Build genuine residual value expertise for newer equipment

Lessors without genuine residual value modeling capability for newer electrified and computerized equipment remain exposed to mispricing risk that could compress margins meaningfully as this equipment category grows across the broader fleet. Building genuine in-house valuation expertise, or partnering with equipment auction houses that already have this data, positions a lessor to price leases more competitively than rivals still relying on outdated valuation models built for older equipment generations. This is a near-term priority worth addressing seriously and soon across the entire lease portfolio.
04 / FUNDING DIVERSIFICATION STRATEGY

Diversify wholesale funding sources before next rate cycle

Lenders without diversified funding sources remain exposed to the same margin compression that followed the 2023 rate tightening cycle, which forced several smaller independent lenders to tighten underwriting or exit higher-risk equipment categories entirely for multiple quarters. Diversifying funding across commercial paper, securitization, and committed credit facilities now protects margin well before the next plausible rate cycle, while lenders who wait risk repeating the same costly compression that hit competitors only recently. This is a near-term priority worth addressing before the next rate cycle begins.

Engagement Snapshot From the Field

A live engagement with an industry participant carrying material or product regulatory and market exposure ahead of a defining policy shift, showing how our research translates into a defensible multi-year portfolio strategy.
MARKET MINDS ADVISORY · CLIENT ENGAGEMENT SUMMARY
Construction Equipment Finance Producer Strategic Portfolio Review and Transition Roadmap 2026·Investment Scenario on Construction Equipment Finance Exposure Evaluation 2025-26
CLIENT PROFILE
The client is a mid-size regional contractor operating a fleet of roughly 85 pieces of construction equipment across multiple active job sites, generating approximately $210 million in annual revenue (client-reported, unverified by MMA) prior to this engagement. The company had historically financed nearly all equipment purchases through a single regional bank relationship, without ever comparing captive or alternative lender terms.
STRATEGIC CHALLENGE
Rising equipment prices were increasing the client's average financed transaction size substantially, while the incumbent bank's approval process routinely took over a week, occasionally delaying equipment delivery on time-sensitive projects. Leadership needed an objective evaluation of whether diversifying lender relationships could improve both financing cost and approval speed without damaging the existing bank relationship.
MMA APPROACH
MMA conducted structured interviews with the client's finance, procurement, and project management teams alongside a comparative evaluation of four candidate lenders, including two captive OEM finance arms and one telematics-based alternative lender, against rate, approval speed, and terms flexibility. The analysis modeled expected cost and timeline improvement under each lender option relative to the client's current single-bank baseline.
KEY FINDINGS
  1. The incumbent bank's approval process was adding an estimated nine business days of delay to equipment delivery timelines on time-sensitive projects annually.
  2. Two of the four evaluated lenders could deliver approval decisions within 48 hours given existing dealer point-of-sale integration already fully in place.
  3. Diversifying to a captive lender for OEM-branded equipment purchases could reduce the average financing rate by an estimated 0.6 percentage points overall.
  4. A telematics-based alternative lender could extend financing to two additional equipment categories the incumbent bank had previously declined to underwrite at all.
CLIENT PROFILE
The client is a mid-size regional contractor operating a fleet of roughly 85 pieces of construction equipment across multiple active job sites, generating approximately $210 million in annual revenue (client-reported, unverified by MMA) prior to this engagement. The company had historically financed nearly all equipment purchases through a single regional bank relationship, without ever comparing captive or alternative lender terms.
STRATEGIC CHALLENGE
Rising equipment prices were increasing the client's average financed transaction size substantially, while the incumbent bank's approval process routinely took over a week, occasionally delaying equipment delivery on time-sensitive projects. Leadership needed an objective evaluation of whether diversifying lender relationships could improve both financing cost and approval speed without damaging the existing bank relationship.
MMA APPROACH
MMA conducted structured interviews with the client's finance, procurement, and project management teams alongside a comparative evaluation of four candidate lenders, including two captive OEM finance arms and one telematics-based alternative lender, against rate, approval speed, and terms flexibility. The analysis modeled expected cost and timeline improvement under each lender option relative to the client's current single-bank baseline.
KEY FINDINGS
  1. The incumbent bank's approval process was adding an estimated nine business days of delay to equipment delivery timelines on time-sensitive projects annually.
  2. Two of the four evaluated lenders could deliver approval decisions within 48 hours given existing dealer point-of-sale integration already fully in place.
  3. Diversifying to a captive lender for OEM-branded equipment purchases could reduce the average financing rate by an estimated 0.6 percentage points overall.
  4. A telematics-based alternative lender could extend financing to two additional equipment categories the incumbent bank had previously declined to underwrite at all.
RECOMMENDED STRATEGY
Phase 1: Phase one: shift OEM-branded equipment purchases to the relevant captive lender, capturing faster approval and modestly better rate terms immediately. Phase 2: Phase two: qualify with a telematics-based alternative lender over three months to access previously declined equipment categories going forward into next year. Phase 3: Phase three: retain the incumbent bank relationship for working capital and non-equipment lending needs where it remains genuinely most competitive.
OUTCOME
The client diversified its lender relationships within four months, ahead of the original six-month target, reducing average equipment delivery delay from nine days to under two days. Blended financing costs fell by roughly 0.5 percentage points within the first year (client-reported, unverified by MMA), while preserving the core banking relationship for other needs.

Frequently Asked Questions

Foundational context covering the market sizes, CAGR, scope, country, region and competition that inform every finding below. This section is provided to cover basics and most often pre-purchase conversations, answered from the MMA Primary Research Dataset.

What is the current size of the Construction Equipment Finance Market?

The market is valued at $185.0 billion in 2025 on a global origination volume basis. This figure covers loans, leases, and rental-purchase financing for construction equipment.

How large will the Construction Equipment Finance Market be by 2036?

The market is projected to reach $369.83 billion by 2036. Growth is driven primarily by rising equipment prices and expanding captive lender financing programs nationwide.

What is the CAGR for the Construction Equipment Finance Market 2026 to 2036?

The market is expected to grow at a CAGR of 6.5 percent between 2026 and 2036. This reflects steady demand tied to equipment prices and infrastructure spending.

Which segment is growing fastest?

Cranes and Lifting Equipment financing leads at an 8.5 percent CAGR, roughly 1.31 times the overall market rate. Large infrastructure projects drive this segment's outsized growth.

Who are the major companies in the Construction Equipment Finance Market?

Caterpillar Financial Services, John Deere Financial, Wells Fargo Equipment Finance, CNH Industrial Capital, and Volvo Financial Services lead the landscape. Together the top five hold 38 percent of global origination volume.

Which country is growing fastest?

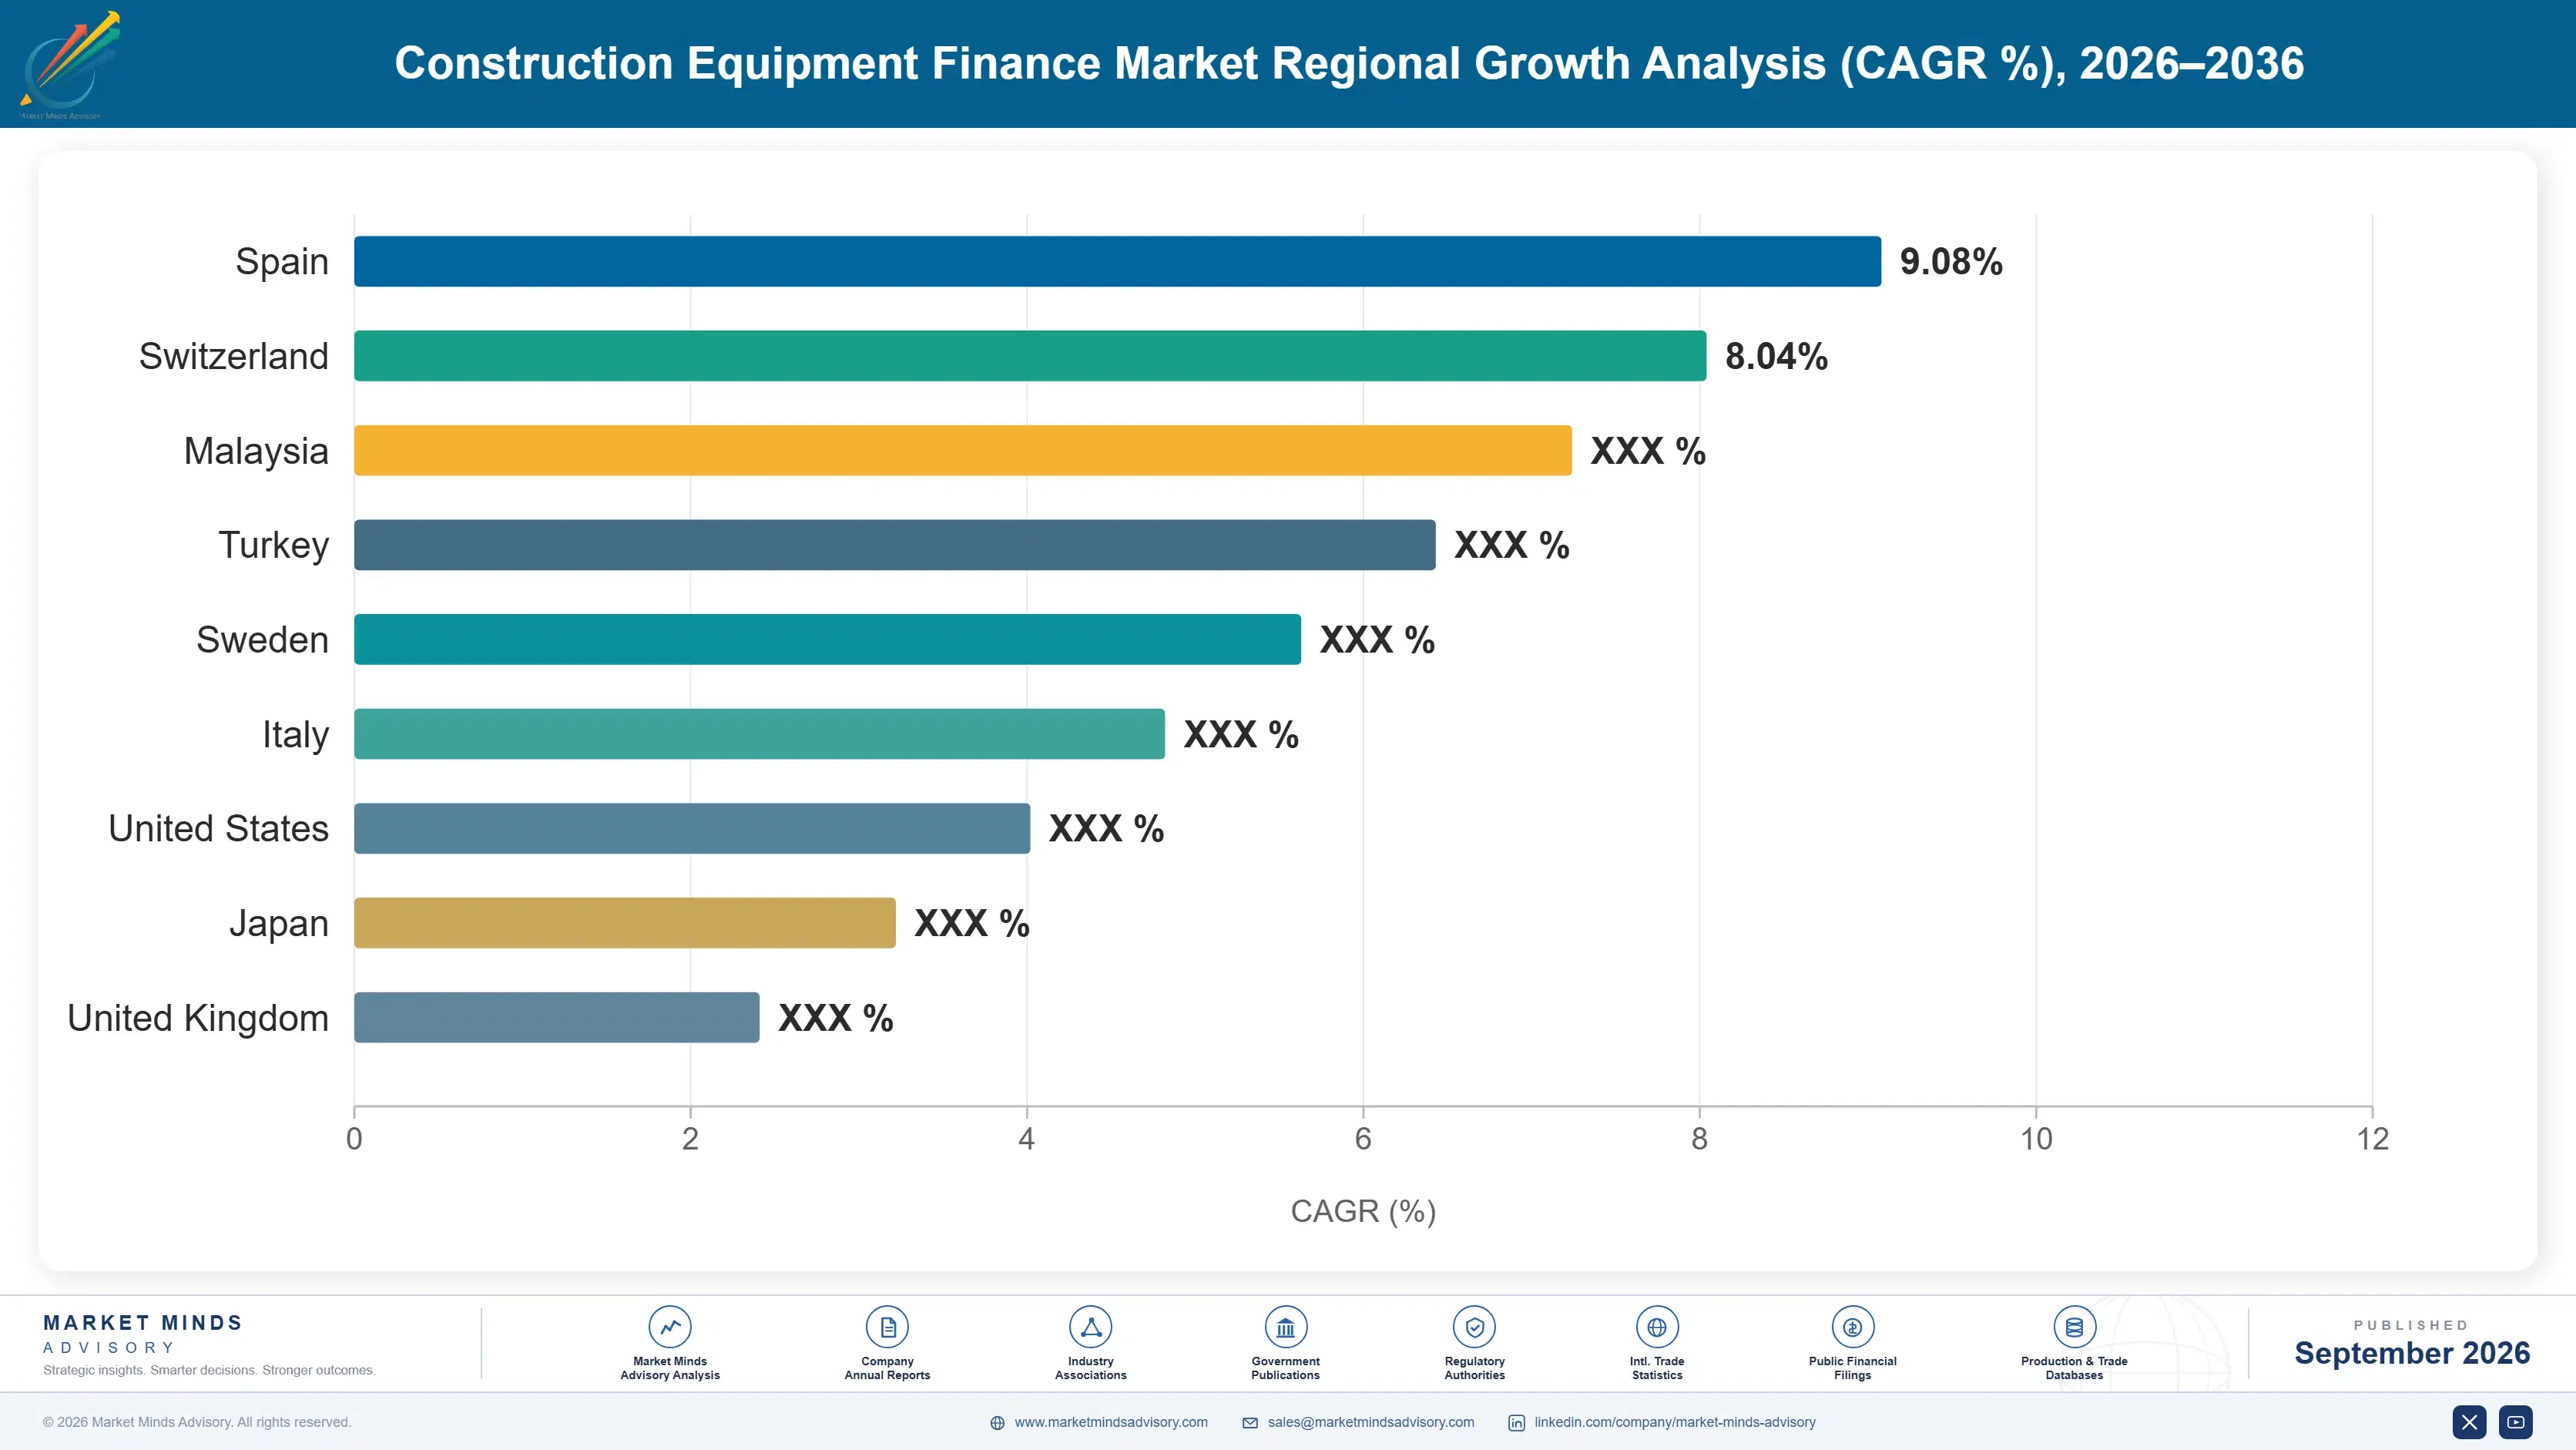
India leads at a 12.5 percent CAGR, driven by massive national infrastructure investment expanding contractor fleet sizes rapidly. This outpaces every other country market tracked in this report.

Report Segmentation Architecture

The full report scope spans multiple orthogonal segmentation dimensions, with cross-tabulated demand data provided for each dimension pair. Coverage extends further to regional breakdowns, trend trajectories, and the competitive detail needed to support segment-level decision-making.

By Primary Market Dimension

  • Earthmoving Equipment Financing
  • Material Handling Equipment Financing
  • Concrete and Road Construction Equipment Financing
  • Cranes and Lifting Equipment Financing
  • Compact and Utility Equipment Financing
  • Specialty and Attachment Equipment Financing

By End-Use Industry

  • General Contractors
  • Equipment Rental Operators
  • Civil and Infrastructure Contractors
  • Mining-Adjacent Construction
  • Government and Municipal Fleets

By Commercial Dimension

  • Captive OEM Financing
  • Bank and Money-Center Lending
  • Independent Leasing Companies
  • Alternative and Telematics-Based Lenders

By Region

  • North America
  • Western Europe
  • East Asia
  • South Asia and Pacific
  • Latin America
  • Middle East and Africa
  • Eastern Europe

Scope, Methodology, and Coverage

Every figure in this report is reproducible from documented input assumptions. The scope below maps the historical period, the forecast horizon, the segmentation dimensions, and the countries covered, alongside the underlying primary and qualitative methodology.
Historical Period
2020 to 2025
Forecast Period
2026 to 2036
Base Year
2025 (USD billions; MMA Primary Research Dataset, September 2026)
Market Definition
This report covers loan, lease, and rental-purchase financing products used to acquire construction equipment, provided by captive OEM finance arms, banks, and independent leasing companies, measured on a global origination volume basis. It excludes equipment rental revenue itself and general working capital lending not tied to a specific equipment purchase.
Quantitative Units
USD billions, origination volume basis
Segmentation Dimensions
Equipment class financed (earthmoving, material handling, concrete and road, cranes and lifting, compact and utility, specialty and attachment)
Regions Covered
North America, Western Europe, East Asia, South Asia and Pacific, Latin America, Middle East and Africa, Eastern Europe
Countries Covered
United States, Canada, China, Germany, United Kingdom, India, Brazil, and 18 additional countries across all seven regions
Key Companies Profiled
Caterpillar Financial Services, John Deere Financial, Wells Fargo Equipment Finance, CNH Industrial Capital, Volvo Financial Services, and 15 additional named lenders
Quantitative Methodology
Primary survey, n=3,800 respondents, Q4 2025, six countries; demand-side model with trade association cross-validation
Qualitative Methodology
47 expert interviews, Q4 2025; applied to validate demand model assumptions, identify emerging dynamics, and assess competitive positioning
Report Format
PDF and XLSX data workbook (Word format preview document)
Publisher
Market Minds Advisory
Report Code
MMA-2026-CON-653
Published
September 2026
Contact
sales@marketmindsadvisory.com | www.marketmindsadvisory.com

Purchase the full Construction Equipment Finance Market Report (2026 to 2036).

This report delivers a comprehensive analysis of the global construction equipment finance market through 2036. It combines primary survey data from 3,800 respondents across six countries with 47 expert interviews conducted in Q4 2025, alongside company disclosures and public interest rate data. Coverage spans market sizing, segmentation by equipment class, regional dynamics across all seven regions, competitive positioning among twenty named lenders, cost-to-serve exposure, and forward-looking strategic verdicts. The analysis is designed for procurement, treasury, and investment decision-makers evaluating this large and steadily evolving lending category.
Full 2020-2036 historical and forecast data
Detailed segmentation by equipment class financed
All seven regional market breakdowns included
Competitive profiles of twenty named lenders
Cost-to-serve and funding cost exposure analysis
Strategic revenue lever and verdict recommendations

Built For The People Who Decide

From boardroom strategy to bench-side execution, this report is read cover-to-cover by leaders shaping the next decade of their industry, turning demand scenarios, market dynamics and valuation benchmarks into decisions.
CXOs/ Presidents/ VPs/ Managers
M&A and Corporate Development
Strategy Teams and R&D Heads
Procurement and Product Directors
Regulatory and Compliance Leaders
Investor Relations and Equity Analysts