Market Minds Advisory
Construction Chemicals Market

Construction Chemicals Market: Repair And Waterproofing Now Outgrow New-Build Admixture Demand

A commercial reading of construction chemicals, where infrastructure repair and climate-driven waterproofing now grow faster than new-build admixture volume, and formulator consolidation has concentrated technical service capability among fewer global suppliers.

Lead Analyst

Bilal Shaikh

Published

September 2026

Make Smarter Decisions with Customized Research Insights

Request a free sample report and evaluate market opportunities, growth trends, and competitive dynamics relevant to your business needs.

2025 MARKET VALUE$48.6BMarket Size 2025
2036 FORECAST VALUE$96.2BBase Case , 2026 to 2036
CAGR 2026 TO 20366.4 %Bull 7.7% / Bear 5.1%
INCREMENTAL OPPORTUNITY$44.5BNet 10- year value creation
EXPANSION MULTIPLE1.86x2036 value over 2026 base
Strategic Levers
M&A Pipeline
Regional Outlook
Country Rankings
Competitive Intelligence
Segmental Deep-dive
Call-Us : 91 93563 13602

Executive Snapshot and Market Trajectory

Repairing what already stands now grows faster than building what comes next. Waterproofing and rehabilitation chemistry are pulling ahead of new-build concrete admixtures, as owners facing flood exposure and decades-old infrastructure choose treatment over replacement almost everywhere the arithmetic allows it.
The market stands at USD 48.6 billion in 2025 and reaches USD 96.16 billion by 2036 at a 6.4% CAGR. Waterproofing compounds grow fastest at 9.8%, about 1.53 times the overall rate, as extreme weather exposure and building envelope failure push owners toward preventive treatment instead of deferred repair. East Asia holds the largest share at 29% on continued Chinese construction volume, while India posts the quickest national growth at 10.8% on infrastructure pipeline spending.
Concentration sits at a moderate CR5 of 42%, following Sika's acquisition of MBCC Group, which reset the competitive order and left a fragmented tail of regional formulators below the consolidated leaders. Two forces now reshape the field. Formulator consolidation is concentrating technical service capability, the applicator training and jobsite support that differentiates chemistry sold at similar prices, and rehabilitation demand is growing steadily and independently of new construction cycles entirely.
Market Definition
The construction chemicals market covers specialty chemical formulations used in concrete production, waterproofing, sealing, bonding, coating, and structural repair across building and infrastructure construction, including concrete admixtures, waterproofing compounds, sealants and adhesives, protective and flooring coatings, repair mortars, and grouts. General-purpose paints, cement and aggregate themselves, and construction equipment are excluded.
Base Year Value
$48.6B in 2025 (MMA Primary Research Dataset, August 2026)
Forecast Period
2026 to 2036, eleven discrete annual values
CAGR
6.4% base case. Bull 7.7%. Bear 5.1%.
Fastest Growth Segment
Waterproofing Compounds: 9.8% CAGR
Fastest Growth Country
India: 10.8% CAGR
Fastest Growth Region
South Asia and Pacific: 8.6% CAGR
Largest Region
East Asia: 29% of 2025 global value
Market Leaders
Sika, Mapei, Saint-Gobain, RPM International, Pidilite Industries. Source: MMA Analysis based on company annual reports.
Primary Survey
n=3,800 procurement and R&D decision-makers, Q4 2025, six countries
Methodology
Demand-side build-up, cross-validated against public data, 47 expert interviews

Construction Chemicals Market Forecast Scenarios

construction-chemicals-market-size-forecast-scenario-1787324258517
Growth from 2020 to 2025 compounded near 5.4%, held back early by pandemic construction shutdowns before infrastructure stimulus programmes across multiple regions restored volume from 2022 onward. Sika's acquisition of MBCC Group in 2023 reshaped the competitive landscape mid-period, consolidating technical service capability across two of the industry's largest formulators that smaller regional players could not easily replicate.
Three mechanisms carry the base case to 6.4%. First, infrastructure rehabilitation: aging bridges, tunnels, and water infrastructure across developed markets require repair chemistry regardless of new construction activity. Second, climate-driven waterproofing, as flood exposure and building envelope failure push owners toward preventive treatment well ahead of visible structural damage. Third, emerging market infrastructure buildout, where India and Southeast Asia are constructing new roads, rail, and water systems at a pace developed markets have not matched in decades.
The bull case at 7.7% assumes infrastructure rehabilitation spending accelerates across developed markets and emerging market construction volume holds through the coming decade. The bear case at 5.1% assumes new construction activity slows meaningfully in China and other major markets, and that rehabilitation spending remains constrained by public budget limits even as the physical need for it continues growing.

Why Repair Chemistry Now Outgrows New-Build Demand

Three forces set demand today. New construction activity provides a shrinking share of the base, since concrete admixture volume tracks building starts that have slowed considerably in several major markets. Infrastructure rehabilitation provides a growing layer, as bridges, tunnels, and water systems built decades ago require repair regardless of new construction cycles. Climate exposure provides the third layer, pushing waterproofing ahead of schedule as flood and moisture damage costs continu
MARKET CONCENTRATIONCR5: 42%Moderately concentrated following recent large formulator consolidation activity
REHABILITATION REVENUE SHAREAbout 34%Total revenue tied to repair rather than new construction
TECHNICAL SERVICE COST SHARE8 to 14%Applicator training and jobsite support within total cost
RAW MATERIAL COST SHARE45 to 58%Polymer and specialty ingredient cost within total build cost
TOP PRODUCING COUNTRY SHAREChina: about 24%Global construction chemical manufacturing output concentrated in one region
PRODUCT LIFE BEFORE REAPPLICATION8 to 15 yearsTypical service life before waterproofing or coating renewal
The commercial character is decided by technical service as much as by chemistry itself. A waterproofing membrane or repair mortar specified incorrectly for a jobsite fails expensively, so applicator training and on-site technical support increasingly decide which supplier actually wins specification. That is why formulators with large field service organisations defend share that pure chemistry competitors struggle to match on price alone consistently.
The next decade turns on two things. Whether public infrastructure budgets fund rehabilitation at the pace physical deterioration actually requires, since documented need has consistently outpaced spending in most developed markets. And whether emerging market construction volume, concentrated heavily in India and Southeast Asia, continues at its current pace or slows meaningfully as those economies mature further.
"Everyone still models this market off cement volume. Cement volume tells you almost nothing about waterproofing demand anymore, because a flooded basement doesn't care whether anyone poured new concrete that year."
Director, Construction Materials Practice · MMA Chemicals and Materials / Constr

Market Trends

Formulator Consolidation Concentrates Technical Service Capability

Sika's 2023 acquisition of MBCC Group combined two of the industry's largest technical service organisations, concentrating the applicator training and jobsite support infrastructure that increasingly decides specification wins over chemistry alone. The deal reset competitive rankings across admixtures, waterproofing, and repair mortars simultaneously, leaving regional formulators to compete against a materially larger combined service footprint. Smaller players are responding through distribution partnerships and narrower technical specialisation in categories where large-scale field service matters less. The consolidation also concentrated raw material purchasing power, giving the combined entity input cost advantages that independent formulators cannot access at comparable scale.
Market Impact: Repair demand grows near 8.6% yearl
Rehabilitation Demand Decouples From New Construction Cycles

Repair and rehabilitation chemistry now generates roughly 34% of total category revenue, growing independently of new construction starts because aging bridges, tunnels, and water infrastructure require attention regardless of how much new building occurs in a given year. This decoupling gives rehabilitation-focused formulators a demand base considerably more stable than admixture suppliers tied directly to construction cycles. Public infrastructure funding, rather than private construction investment, increasingly determines rehabilitation category growth. Formulators positioning around infrastructure asset owners rather than general contractors are capturing share as this shift continues across developed markets specifically.
Market Impact: Waterproofing grows fastest at 9.8%

Market Opportunities and Growth Drivers

Aging Infrastructure Requires Repair Regardless Of New Build Cycles

Bridges, tunnels, and water infrastructure built across the mid-twentieth century in North America and Western Europe are reaching the end of their designed service life simultaneously, creating repair demand that construction cycle slowdowns cannot suppress. Public infrastructure assessments across multiple developed markets have documented that a substantial share of bridge and water infrastructure requires structural attention within the coming decade. This demand is inelastic to broader construction activity, since deferred maintenance eventually becomes mandatory replacement at far greater cost. Formulators supplying repair mortars, corrosion protection, and structural strengthening chemistry are consequently less exposed to construction cycle volatility than admixture suppliers.
Market Impact: Funding gaps span 5 years

Climate Exposure Pulls Waterproofing Investment Forward

Rising flood frequency and building envelope failure costs are pushing property owners and infrastructure managers to treat waterproofing as preventive investment rather than deferred maintenance, accelerating replacement cycles ahead of scheduled reapplication timing. Insurance underwriting increasingly reflects waterproofing condition in commercial property risk assessment, creating a direct financial incentive that did not previously exist at this scale. This shift benefits formulators with proven long-service waterproofing chemistry over lower-cost alternatives, since insurers and asset managers increasingly specify products with documented performance history. Demand growth concentrates in flood-exposed coastal and urban markets specifically.
Market Impact: Margin compression reaches 7 points

Market Restraints and Challenges

Public Infrastructure Budgets Lag Physical Deterioration Rates

Rehabilitation demand consistently outpaces the public funding available to address it, since infrastructure budgets compete against other government spending priorities that often win in annual allocation decisions. The root cause is that deterioration is gradual and rarely creates the visible urgency that drives emergency funding, so routine rehabilitation gets deferred until failure forces attention at far higher cost. Commercially this means demonstrated need does not translate reliably into near-term revenue, complicating capacity planning for rehabilitation-focused formulators. Companies respond by working directly with infrastructure asset owners on multi-year rehabilitation programming and by developing lower-cost formulations suited to constrained budget environments.
Market Impact: CR5 concentration reaches 42% now

Raw Material Volatility Compresses Formulator Margin

Specialty polymers and performance additives, the ingredients that differentiate premium construction chemistry from commodity alternatives, are subject to petrochemical feedstock volatility that formulators cannot fully pass through to price-sensitive contractors. The root cause is that construction chemical pricing typically resets annually while raw material costs move continuously, creating a persistent lag between cost inflation and price recovery. Commercially this compresses margin during volatile periods regardless of underlying demand strength. Formulators respond with index-linked contracts on large infrastructure programmes, broader raw material sourcing, and reformulation toward less volatile feedstock chemistry where performance allows it.
Market Impact: Rehabilitation reaches 34% of reven
3 additional market trends, 4 additional growth drivers, and 3 additional restraints and challenges are covered in the full report. Contact sales@marketmindsadvisory.com to access the complete intelligence.

Segment CAGR and Growth Architecture

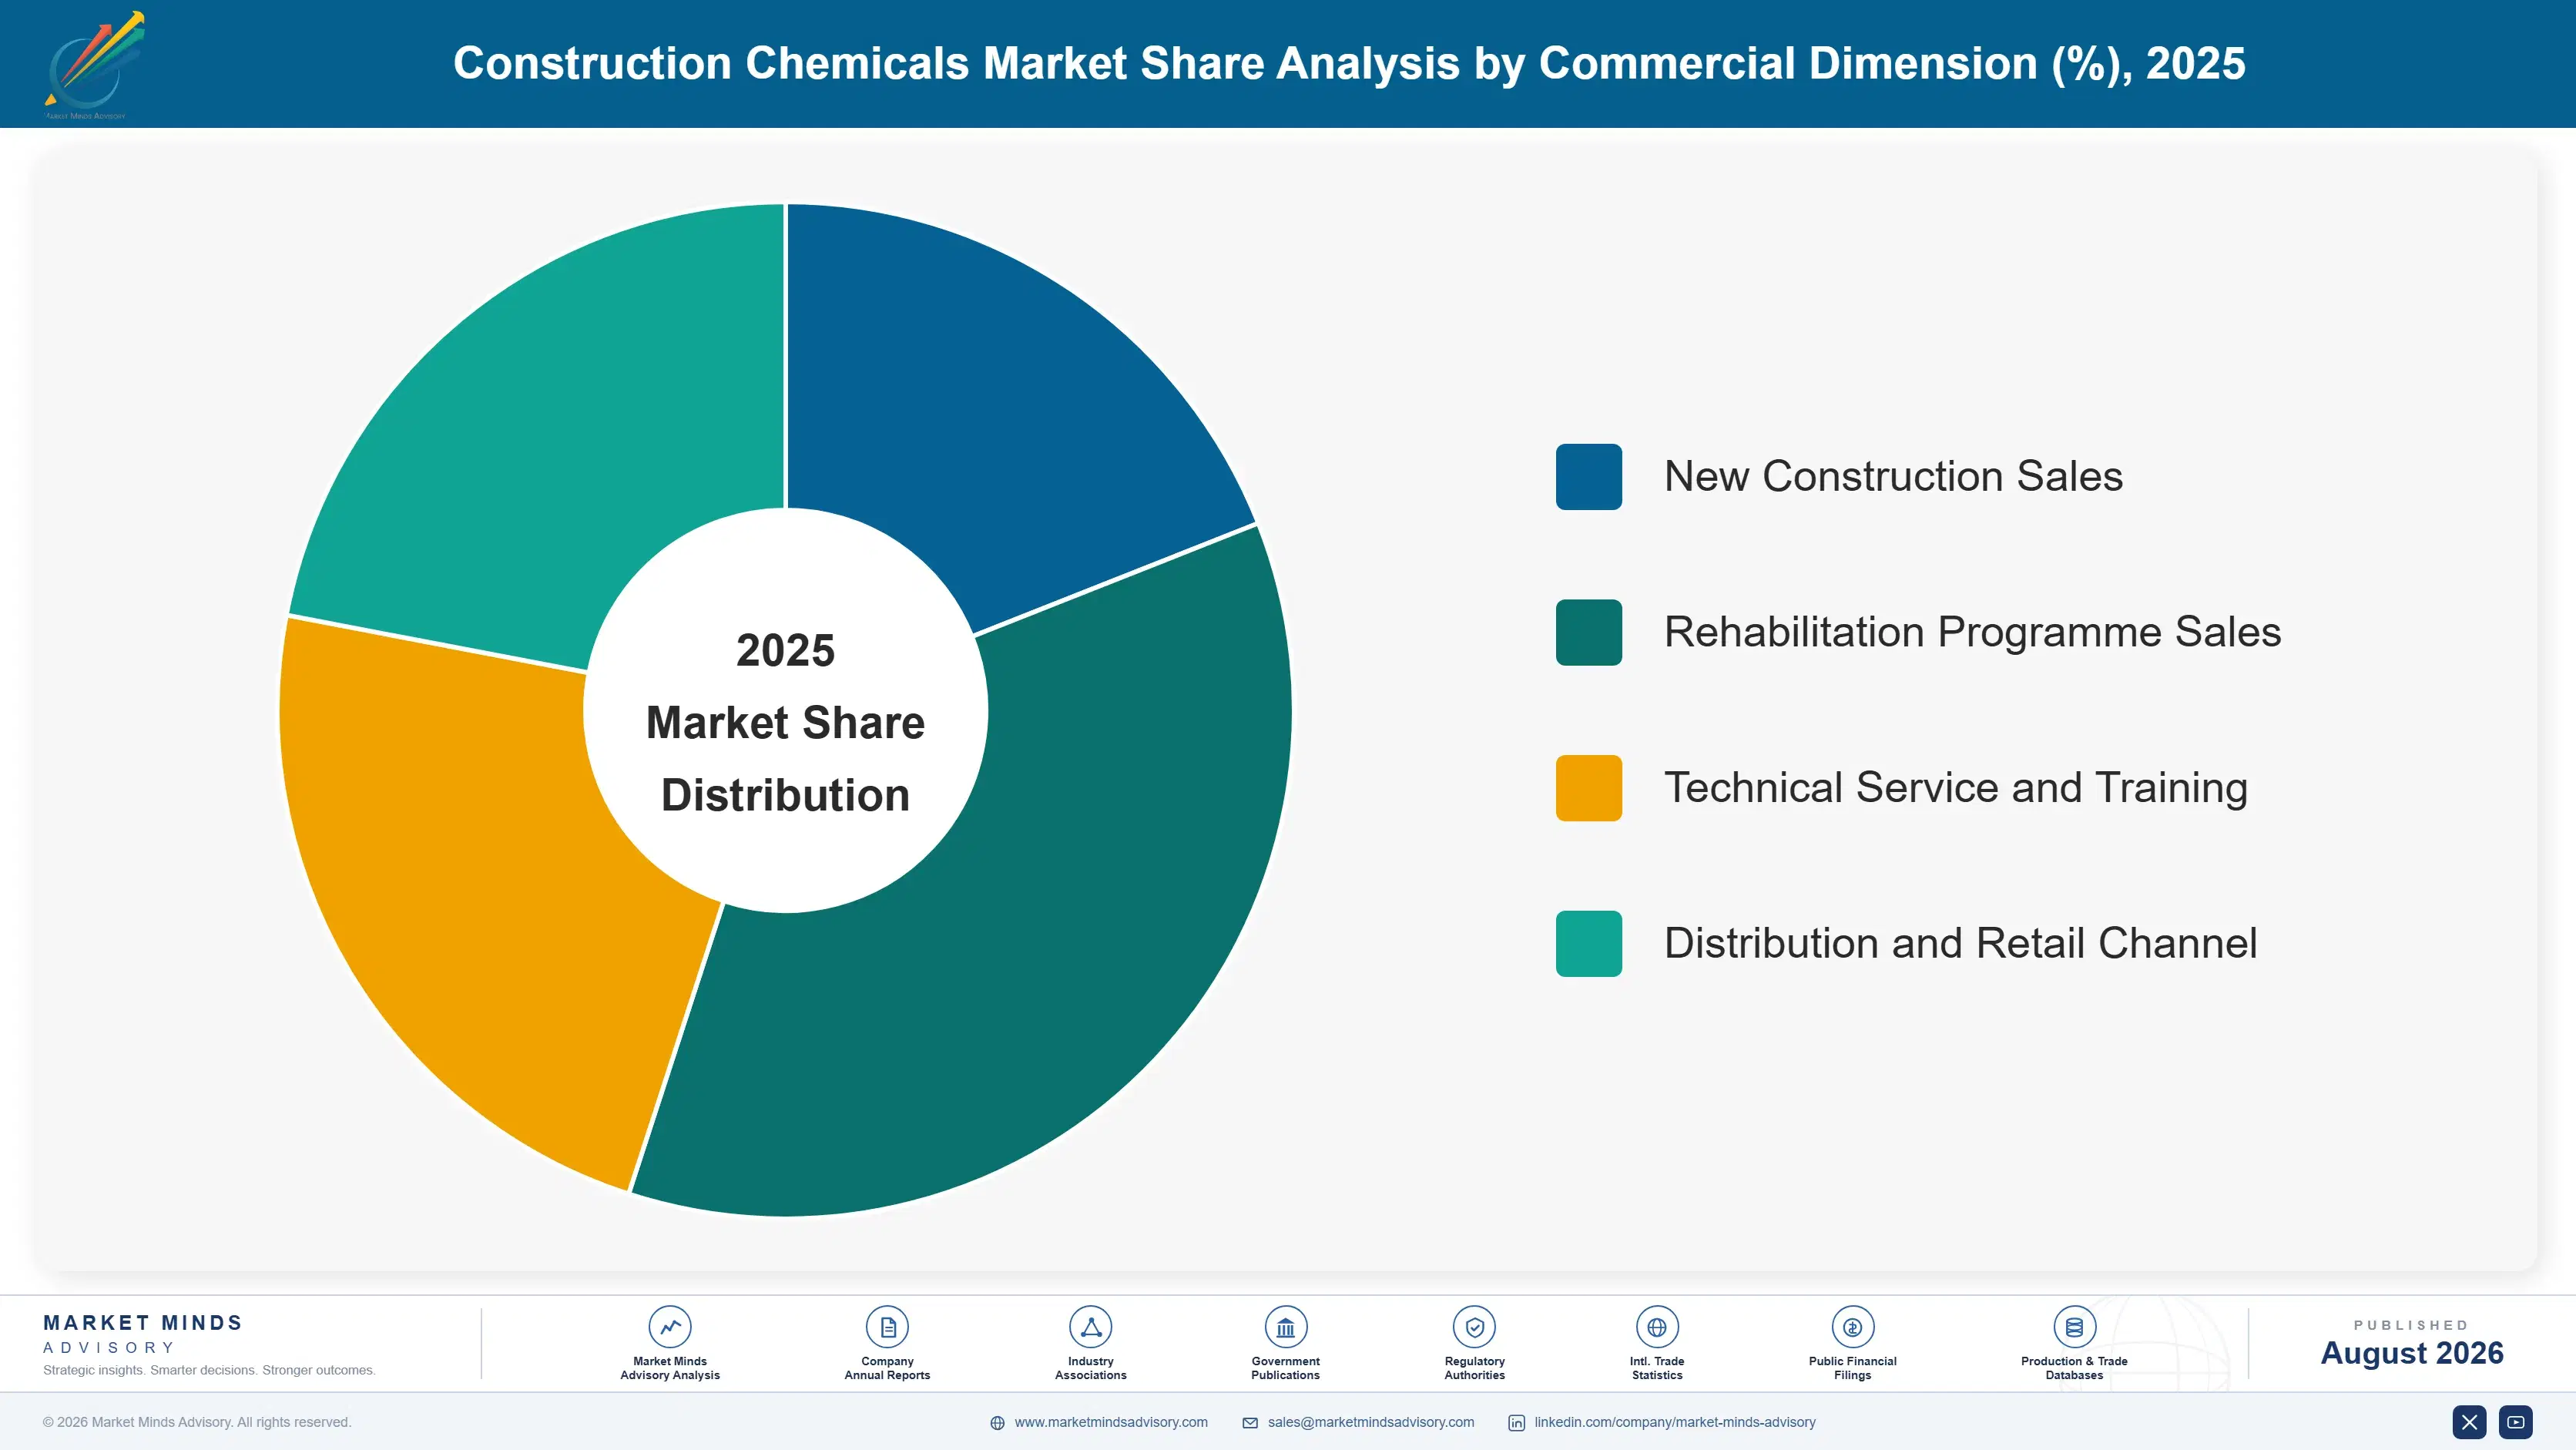
Segmentation follows product and chemistry type, a single formulation logic describing what function the chemical performs on a jobsite. Application method and end-use construction type sit separately within the framework, since the same waterproofing chemistry serves both residential and infrastructure projects through entirely different commercial channels, specification processes, technical service requirements, and typical project scale.
construction-chemicals-market-market-share-analysis-1787324259079

Waterproofing Compounds

Waterproofing compounds grow fastest at 9.8%, about 1.53 times the overall 6.4% rate, covering membrane systems, liquid-applied coatings, and crystalline admixtures that prevent water ingress in below-grade structures, roofing, and building envelopes. Rising flood frequency and building envelope failure costs are pushing owners toward preventive treatment ahead of scheduled reapplication timing, and insurance underwriting increasingly reflects waterproofing condition in commercial property risk assessment. That creates a direct financial incentive that favours formulators with proven long-service chemistry over lower-cost alternatives lacking documented performance history. Sika, BASF, and Saint-Gobain hold strong positions, though regional specialists compete effectively in below-grade and roofing applications where local building code familiarity matters considerably. Demand concentrates in flood-exposed coastal and urban markets specifically.
CAGR 9.8%

Repair and Rehabilitation Mortars

Repair and rehabilitation mortars grow at 8.6%, the second-fastest category, as aging bridges, tunnels, and water infrastructure across developed markets require structural attention regardless of new construction activity. This demand is largely inelastic to construction cycles, since deferred maintenance eventually becomes mandatory replacement at far greater cost than timely repair. Public infrastructure asset owners, rather than private developers, increasingly drive category growth through multi-year rehabilitation programming that gives formulators demand visibility construction-linked categories rarely offer at comparable scale. Sika, RPM International, and Mapei lead on infrastructure-scale rehabilitation projects, while smaller specialists compete in commercial building repair where project scale and technical service requirements differ considerably from major infrastructure rehabilitation work overall.
CAGR 8.6%
Full segment breakdown across 6 segments available in the complete report.

Regional Architecture and Country Demand Map

Construction volume and infrastructure age together set this distribution, with fast-growing economies pulling new-build demand while developed markets generate rehabilitation-driven growth instead. East Asia leads on Chinese construction scale, while the fastest growth sits in South Asia and Pacific on Indian infrastructure investment specifically now.

North America

Aging infrastructure defines this 24% share more than new construction volume does. United States federal infrastructure funding has directed substantial capital toward bridge, tunnel, and water system rehabilitation, creating a demand base considerably more stable than residential and commercial construction alone would provide. Canadian markets follow a similar pattern, with cold-climate freeze-thaw damage adding a rehabilitation driver distinct from American conditions. Formulators with established infrastructure asset owner relationships, rather than only contractor relationships, are capturing disproportionate share of this funding as programmes scale. Growth of 6.8% reflects rehabilitation spending offsetting a construction cycle that has slowed from its recent peak. Public funding timing, not private construction activity, increasingly sets the pace here.
Share: 24% | CAGR: 6.8% (2026 to 2036)

Western Europe

Regulatory building performance standards shape this market as much as construction volume does. Western Europe holds 19% of value, with EU building energy performance and waterproofing standards pushing renovation-driven demand across an aging building stock that new construction alone would never generate. German and French infrastructure rehabilitation programmes are substantial, though public procurement processes move slower than in North America. Nordic markets favour premium waterproofing and coating chemistry suited to extreme freeze-thaw cycling. Growth of 4.9% is the slowest of the seven, reflecting mature construction volume and rehabilitation spending constrained by broader public budget pressure across the region. Renovation regulation increasingly substitutes for the new-build demand this market has lost.
Share: 19% | CAGR: 4.9% (2026 to 2036)
Regional intelligence for 5 additional markets available in the complete report: East Asia, South Asia and Pacific, Latin America, Middle East and Africa, Eastern Europe. Contact sales@marketmindsadvisory.com.
construction-chemicals-market-country-cagr-analysis-1787324259586

Where Construction Chemical Suppliers Actually Capture Value

Competing on formulation alone means competing against commodity chemistry that specification increasingly commoditises considerably across nearly every product line and region. The four moves below shift value toward positions a pure chemistry competitor cannot simply match: technical service depth, infrastructure asset owner relationships, rehabilitation programme positioning, and documented climate-specific performance data built over time.

Build Technical Service Into A Specification Moat

Waterproofing membranes and repair mortars specified incorrectly for jobsite conditions fail expensively, which means applicator training and on-site technical support increasingly decide specification wins independent of chemistry price. Formulators that invest in field service organisations, rather than treating support as a cost centre, defend share pure chemistry competitors struggle to match on price alone. This advantage compounds over time, since applicators trained on one supplier's systems default to specifying that supplier again. Sika's scale following the MBCC acquisition, which pushed technical service spend to 8% to 14% of project cost, shows how large an advantage consolidation builds.
Market Impact: Technical service now runs 8 to 14%

Position Directly With Infrastructure Asset Owners

Rehabilitation demand increasingly flows through infrastructure asset owners planning multi-year programmes rather than through general contractors bidding individual projects, and formulators building direct relationships with those owners gain demand visibility competitors bidding project by project never achieve. This positioning also insulates revenue from construction cycle volatility, since rehabilitation programming continues regardless of new-build activity. Companies should treat asset owner relationship building as a distinct commercial function from contractor sales, since the sales cycle, decision criteria, and relationship depth required differ considerably, and rehabilitation-linked accounts already represent roughly 34% of category revenue industry-wide.
Market Impact: Rehabilitation already reaches 34%

Develop Climate-Specific Performance Data By Region

Generic waterproofing and coating chemistry increasingly loses specification to formulations with documented performance data for specific climate conditions, whether extreme heat in Gulf markets or freeze-thaw cycling in Nordic and Canadian conditions. Insurers and infrastructure asset owners increasingly require this documentation before specifying a product for critical applications, which raises the bar competitors without regional testing history cannot clear quickly. Formulators investing in climate-specific field testing years ahead of demand build a data advantage, often requiring 3 to 5 years of accumulated performance history before a rival can match established specification credibility in a given region.
Market Impact: Waterproofing demand grows fastest

Index Pricing To Raw Material Cost Movement

Specialty polymer and additive costs move continuously while construction chemical pricing typically resets only annually, creating margin compression during volatile input cost periods that formulators absorb rather than pass through. Suppliers that negotiate index-linked pricing on large infrastructure programmes protect margin through volatility that competitors on fixed annual pricing cannot match at any comparable scale. This requires customer education, since asset owners accustomed to fixed pricing initially resist index mechanisms, but the alternative is margin erosion of up to 7 points that compounds across every volatile cycle a formulator absorbs without recovery.
Market Impact: Margin compression reaches 4 to 7 p

Who Controls the Margin Pool

Concentration sits at a moderate CR5 of 42%, with Sika, Mapei, Saint-Gobain, RPM International, and Pidilite Industries holding leading positions following Sika's 2023 acquisition of MBCC Group. The gap between these leaders and the fragmented regional tail rests on technical service scale and raw material purchasing power rather than on formulation secrecy alone. All participants are assessed on one basis, annual revenue from construction chemical products, excluding general-purpose paint and c
Competition runs along three dimensions. First, technical service and applicator training depth, which increasingly decides specification wins on complex jobsites. Second, infrastructure asset owner relationships, which provide rehabilitation demand visibility contractor-only relationships cannot match. Third, climate-specific performance data, particularly for waterproofing and coating chemistry sold into extreme environments.

Pressure is building from regional formulators in China and India who compete on price and local building code familiarity that multinational suppliers cannot easily replicate. Meanwhile diversified competitors including Sherwin-Williams and PPG Industries are expanding construction chemical portfolios adjacent to their core coatings business. Rankings should favour companies with proven infrastructure rehabilitation track records and regional technical service depth over those competing purely on formulation breadth.
construction-chemicals-market-company-positioning-matrix-1787324260105

Competitive Moat and Risk Dimensions

SIKA

Moat: Combined technical service scale

Sika's acquisition of MBCC Group combined two of the industry's largest technical service organisations, giving it applicator training and jobsite support infrastructure that smaller competitors cannot replicate quickly. Its product breadth spans admixtures, waterproofing, and repair chemistry, making it a single-source supplier for large infrastructure programmes. Global manufacturing scale supports raw material purchasing power that independent formulators lack.
SIKA

Risk: Integration and antitrust exposure

Integrating MBCC Group's operations and culture across multiple countries carries execution risk that could slow the technical service advantage the deal was meant to build. Regulatory scrutiny of the combined entity's market position in specific product categories and countries remains an ongoing exposure. Regional formulators are using the integration period to win customers wary of supplier concentration.
MAPEI

Moat: Independent ownership and specialisation

Mapei's continued private ownership allows longer-term investment in technical service and product development without the quarterly pressure public competitors face. Its deep specialisation in flooring and tile-setting chemistry gives it a technical reputation that broader-line competitors struggle to match in that specific category. Strong presence across both developed and emerging markets diversifies its exposure to any single region's construction cycle.
MAPEI

Risk: Scale gap versus consolidated leader

Mapei's scale, while substantial, now trails Sika's combined post-acquisition footprint in several product categories and regions, limiting its raw material purchasing leverage by comparison. Family ownership structure limits the capital available for further large-scale acquisition relative to publicly funded competitors. Rehabilitation-focused infrastructure programmes increasingly favour suppliers with the broadest single-source product range.

Players Tracked

Prominent Players

Sika
Mapei
Saint-Gobain
RPM International
Pidilite Industries

Other Key Players

Arkema
Dow
Fosroc
Sherwin-Williams
PPG Industries
Ardex Group
Cico Technologies
Berger Paints
Asian Paints
Soprema
Kerakoll
Laticrete International
Chryso
Conmix
MC-Bauchemie

Recent Developments

MARCH 2025

Sika completes technical service integration across MBCC regions

Sika announced completion of technical service and applicator training integration across the majority of former MBCC Group regions, consolidating field support infrastructure under a single organisational structure. This was an internal integration milestone rather than any new acquisition, marking the practical completion of commercial integration following the 2023 transaction.
Signal: Integration milestones matter as much as t
OCTOBER 2024

RPM International acquires waterproofing membrane manufacturer

RPM International completed the acquisition of a specialist waterproofing membrane manufacturer, adding manufacturing capacity and product range in a category the company had previously supplied partly through third-party sourcing. This was a full acquisition bringing manufacturing and formulation capability in-house, not a distribution or licensing arrangement.
Signal: Bringing waterproofing manufacturing in-ho
JUNE 2025

Pidilite Industries expands infrastructure rehabilitation product line

Pidilite Industries launched an expanded range of structural repair and rehabilitation products targeting Indian infrastructure asset owners directly rather than through its traditional contractor and retail channels. This was an organic product line expansion rather than an acquisition, aligning with India's accelerating infrastructure investment pipeline.
Signal: Domestic Indian formulators are moving upm

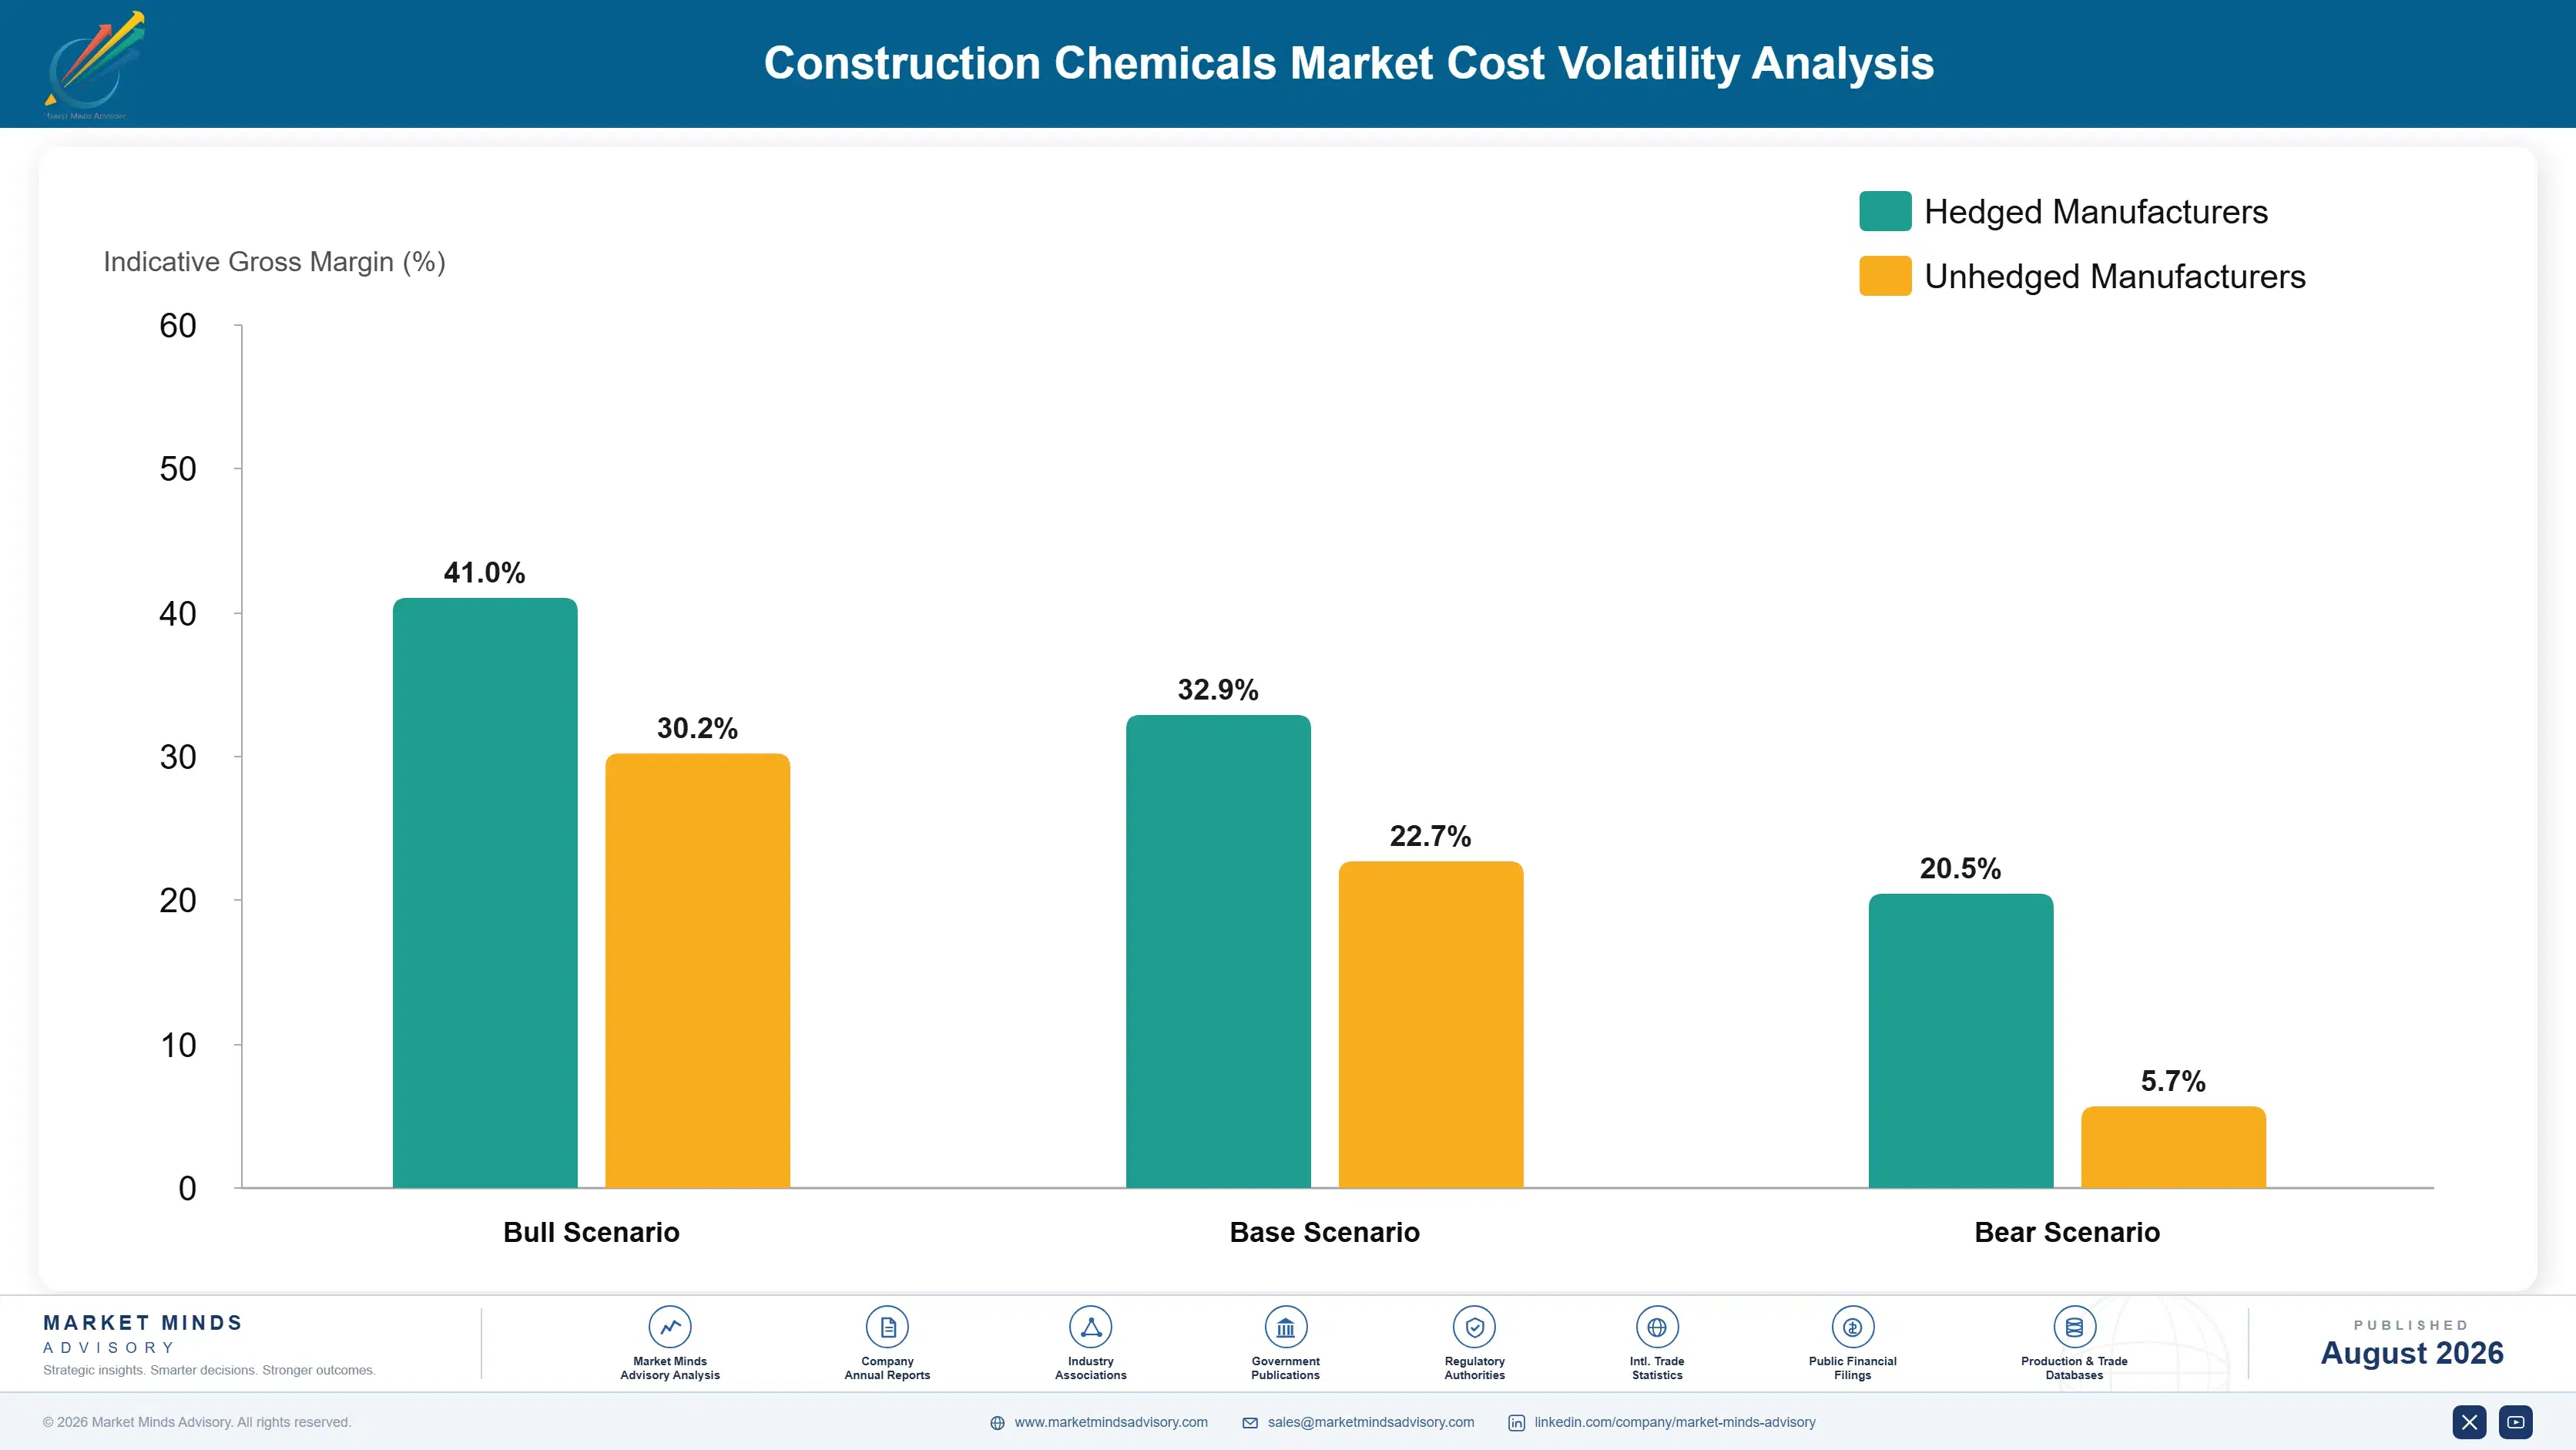
Specialty Polymers And Petrochemical Feedstock Exposure

Specialty polymers and performance additives dominate cost in this category. Polymer resins, superplasticizers, and specialty additives account for roughly 45% to 58% of cost of goods sold, reflecting the performance chemistry that differentiates premium formulations from commodity alternatives. Packaging and logistics add a further 10% to 15%, while technical service and applicator support account for 8% to 14% and rising as specification complexity increases.
Petrochemical feedstock volatility has been the sharpest recent pressure. Polymer and additive input prices moved considerably through 2021 and 2022 as feedstock costs spiked globally, before easing through 2023 and 2024 as petrochemical supply normalised, according to IEA petrochemical market reporting. Formulators absorbed meaningful margin pressure during the spike period since annual pricing contracts could not adjust as quickly as input costs moved across most major producing regions.

Exposure separates by formulation complexity and contract structure. A formulator dependent on specialty polymers with few alternative suppliers faces cost and availability risk that a commodity-focused competitor simply does not carry, while one with index-linked pricing on large programmes protects margin through volatility that fixed-price competitors absorb entirely themselves. Companies with broader raw material sourcing options weather feedstock spikes considerably better than narrowly sourced specialists.
construction-chemicals-market-cost-volatility-analysis-1787324260300

Negotiate index-linked pricing on large programmes

Fixed annual pricing exposes formulators to the gap between contract price and continuously moving input costs, absorbing volatility index-linked contracts would instead pass through. Large infrastructure programmes are the easiest place to introduce this mechanism, since asset owners value supply security enough to accept the tradeoff. Formulators that started this practice early protect margin better than competitors on fixed terms.

Diversify specialty polymer sourcing across suppliers

Relying on a narrow supplier base for specialty polymers concentrates both price and availability risk exactly when demand is strong and supply tightest. Qualifying multiple suppliers across regions preserves negotiating leverage and supply continuity during feedstock disruption. The qualification process takes time, which is why formulators that started diversifying early hold a genuine advantage now.

Reformulate toward less volatile feedstock chemistry

Where performance requirements allow it, shifting formulations toward less volatile feedstock inputs reduces exposure to the petrochemical cycles that drive periodic margin compression. This requires sustained research investment and careful performance validation, since reformulation cannot compromise the technical properties that justify premium pricing. Companies pursuing this path steadily are building cost structures more resilient than competitors reliant on legacy formulations.

Portfolio Architecture for Margin Defence

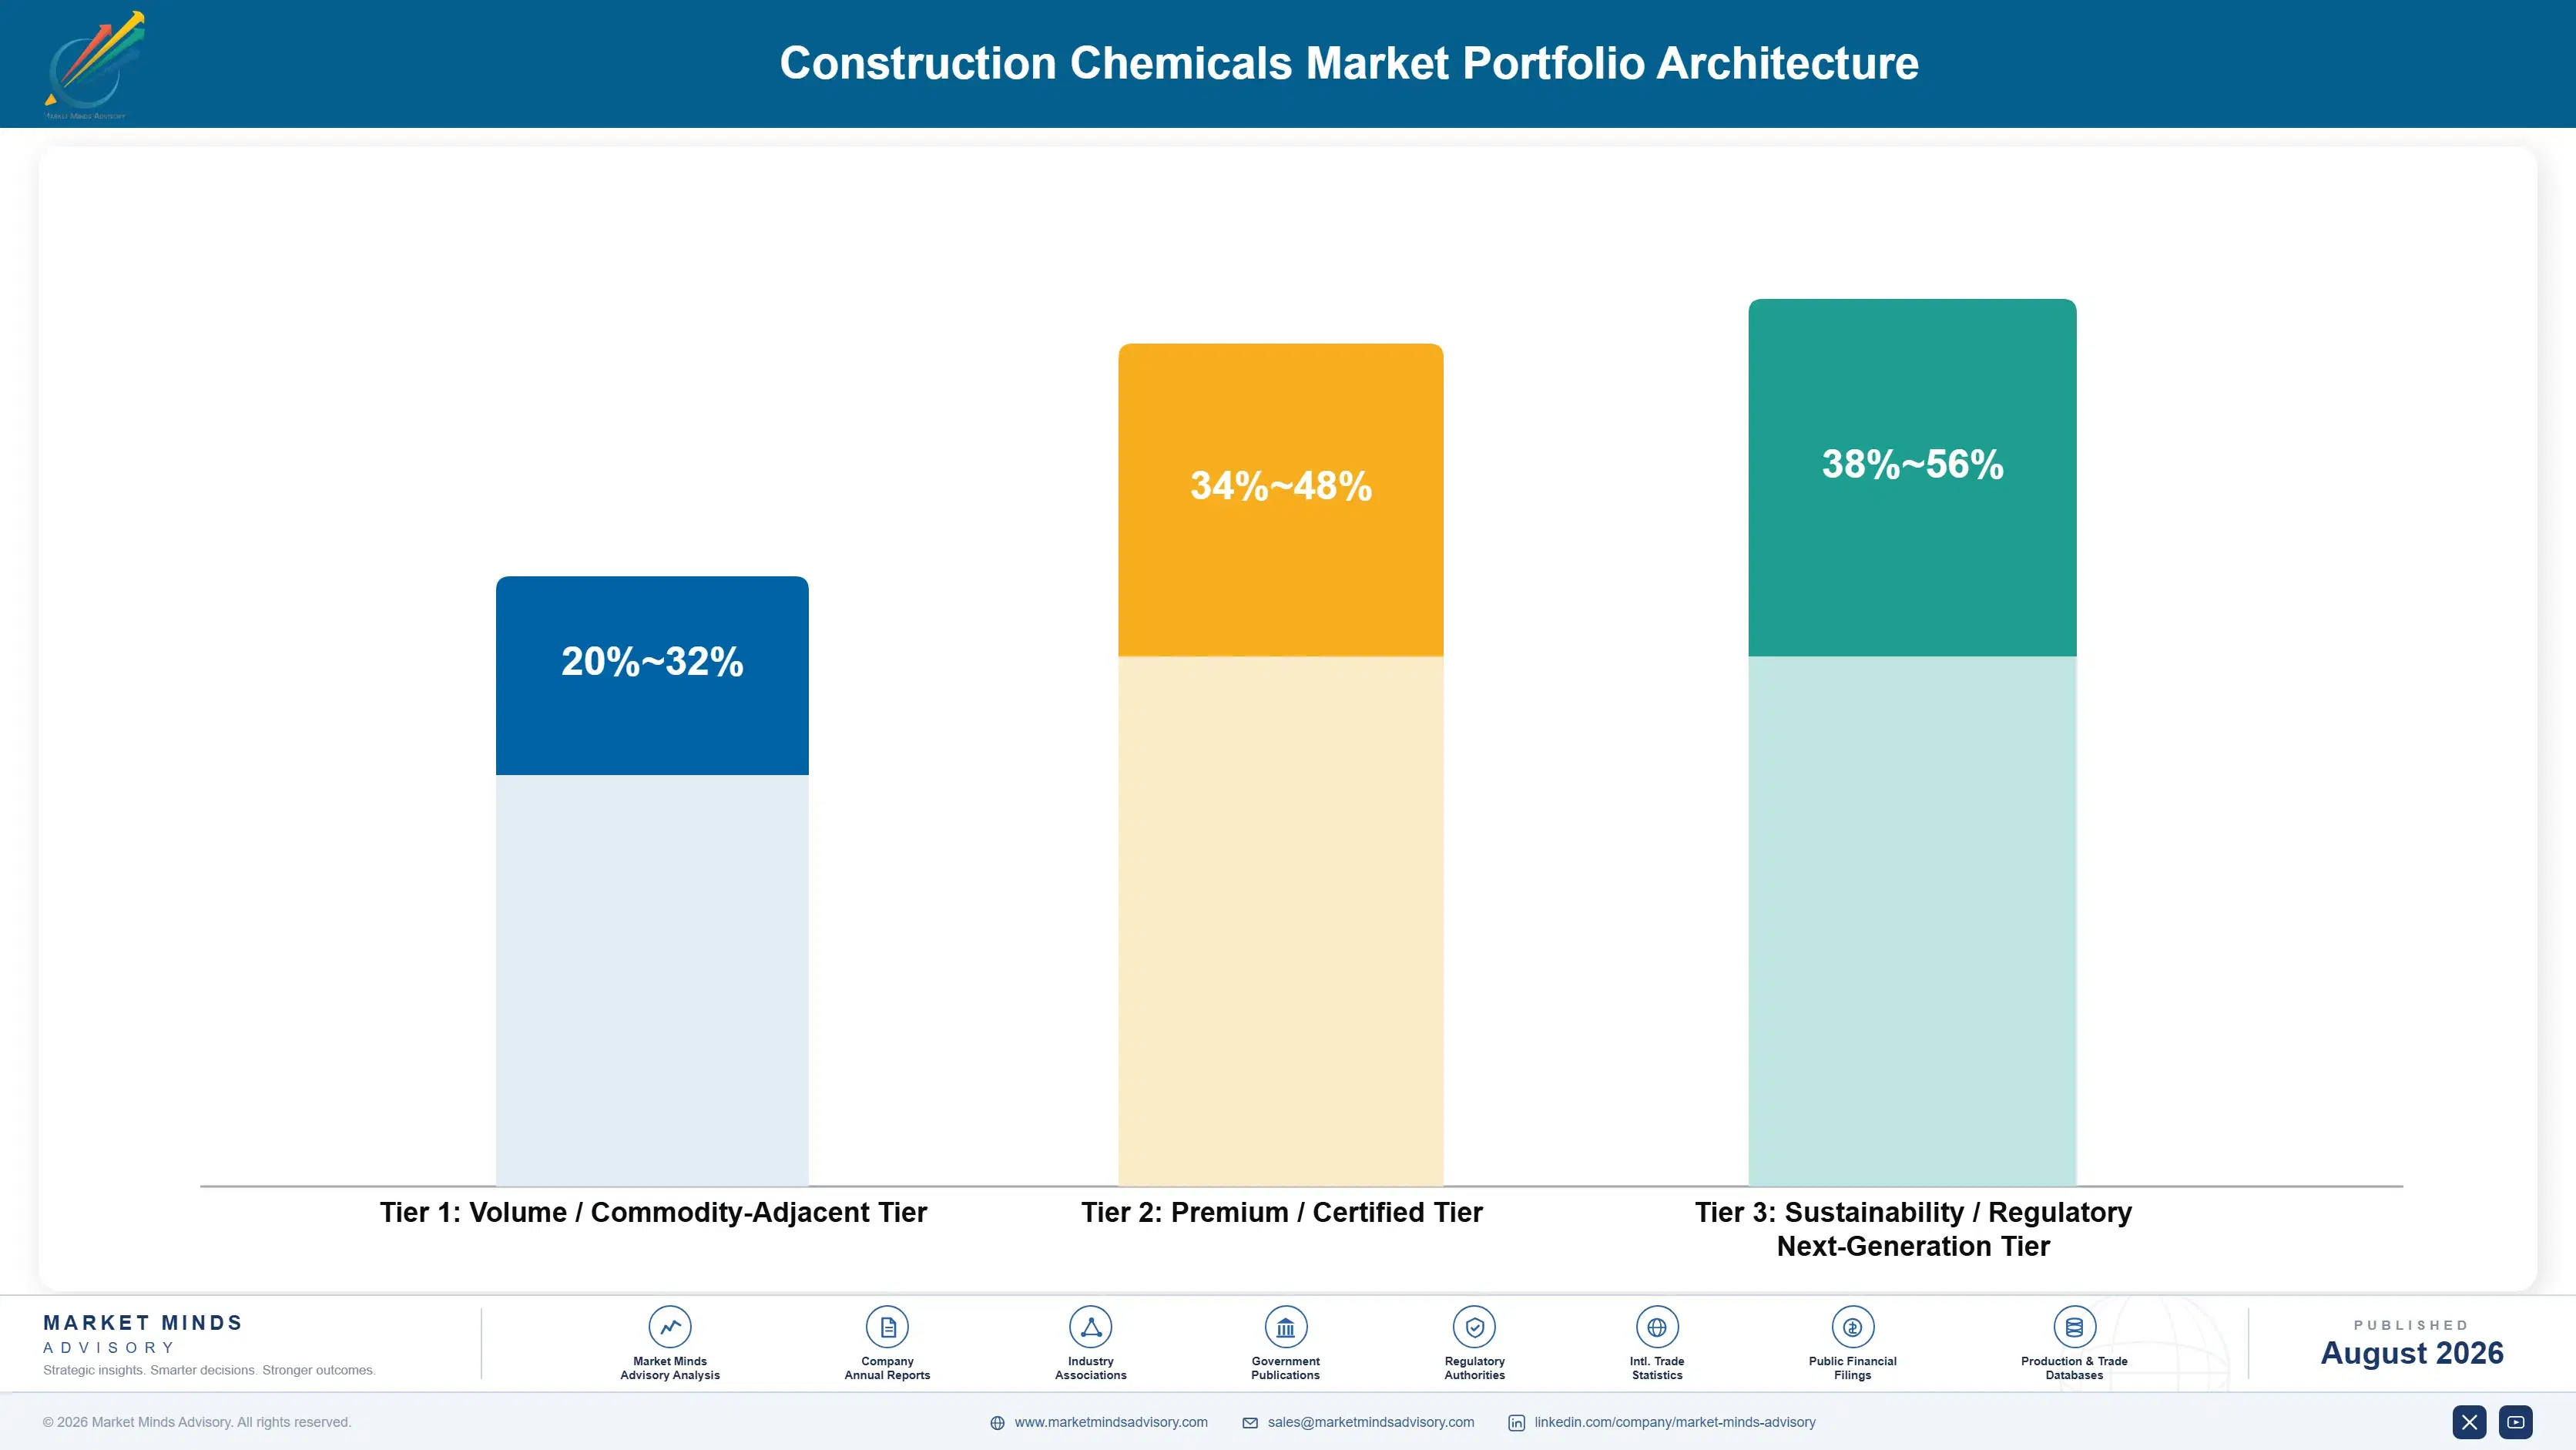
The portfolio splits into three tiers with distinct economics. Commodity concrete admixtures and general-purpose sealants form the volume tier, competing on price against a large field of regional and multinational suppliers. Technical waterproofing and rehabilitation chemistry earn considerably more, since specification complexity and technical service requirements both resist commoditisation. Climate-specific and infrastructure-grade formulations sit differently again, priced against performan
The tension runs between defending commodity admixture volume, which still funds much of the business today, and investing in rehabilitation and waterproofing chemistry that increasingly drives growth. Formulators over-indexed on new-build admixtures risk missing rehabilitation demand that grows independently of construction cycles. Yet building technical service and asset owner relationships for rehabilitation chemistry requires sustained investment that commodity admixture margins alone rarely fund comfortably.

High-value pools concentrate where technical service, climate-specific data, or asset owner relationships limit competition: infrastructure rehabilitation programmes with multi-year visibility, waterproofing chemistry with documented climate performance, and specification-critical repair mortars sold with bundled applicator training. All three resist the price competition that commodity admixtures increasingly face from regional formulators. Standardised sealants sold on price alone sit at the other end of that spectrum entirely.

Volume / Commodity-Adjacent Tier

Standard concrete admixtures and general-purpose sealants sold largely on price and delivery against a broad field of regional and multinational suppliers competing closely on cost, with limited differentiation beyond consistent quality and reliable jobsite delivery timing.
Gross Margin: 20-32%

Premium / Certified Tier

Technical waterproofing membranes and structural repair mortars with proven specification track records, where applicator training and jobsite support command sustained pricing power that pure commodity chemistry competitors cannot replicate without comparable field service investment.
Gross Margin: 34-48%

Sustainability / Regulatory / Next-Generation Tier

Climate-specific waterproofing chemistry and infrastructure-grade rehabilitation products sold with documented performance data and bundled technical service to asset owners, priced against specification credibility and long-term performance history rather than any directly competing formulation.
Gross Margin: 38-56%
construction-chemicals-market-portfolio-architecture-1787324260793

High-value Sub-segments and Strategic Watch-out

Waterproofing Compounds

High value and high growth at 9.8%, the fastest category, as flood exposure and building envelope failure push owners toward preventive treatment well ahead of scheduled reapplication timing. Insurance underwriting increasingly rewards documented long-service performance over lower-cost alternatives lacking comparable history across most major markets.
Gross Margin: 38-56%

Repair and Rehabilitation Mortars

High value with strong growth at 8.6% as aging infrastructure requires structural attention regardless of new construction cycles across most developed markets currently under sustained public budget pressure. Public asset owner relationships increasingly decide which formulators capture multi-year rehabilitation programme demand at meaningful scale going forward.
Gross Margin: 36-52%

Concrete Admixtures

The volume core by revenue, growing moderately as construction cycles in mature markets slow while emerging market building volume continues expanding steadily across several fast-growing economies still meaningfully under-served by established multinational suppliers today. Regional competition on price is most intense in this category specifically.
Gross Margin: 22-34%

Grouts and Anchoring Systems

The strategic watch-out, growing slowest as specification increasingly shifts toward integrated structural repair systems that bundle grouting within broader rehabilitation packages sold directly to infrastructure asset owners rather than individual contractors handling smaller routine jobs. Standalone grout sales face growing substitution from these bundled offerings.
Gross Margin: 24-36%

How Specification Relationships Actually Persist

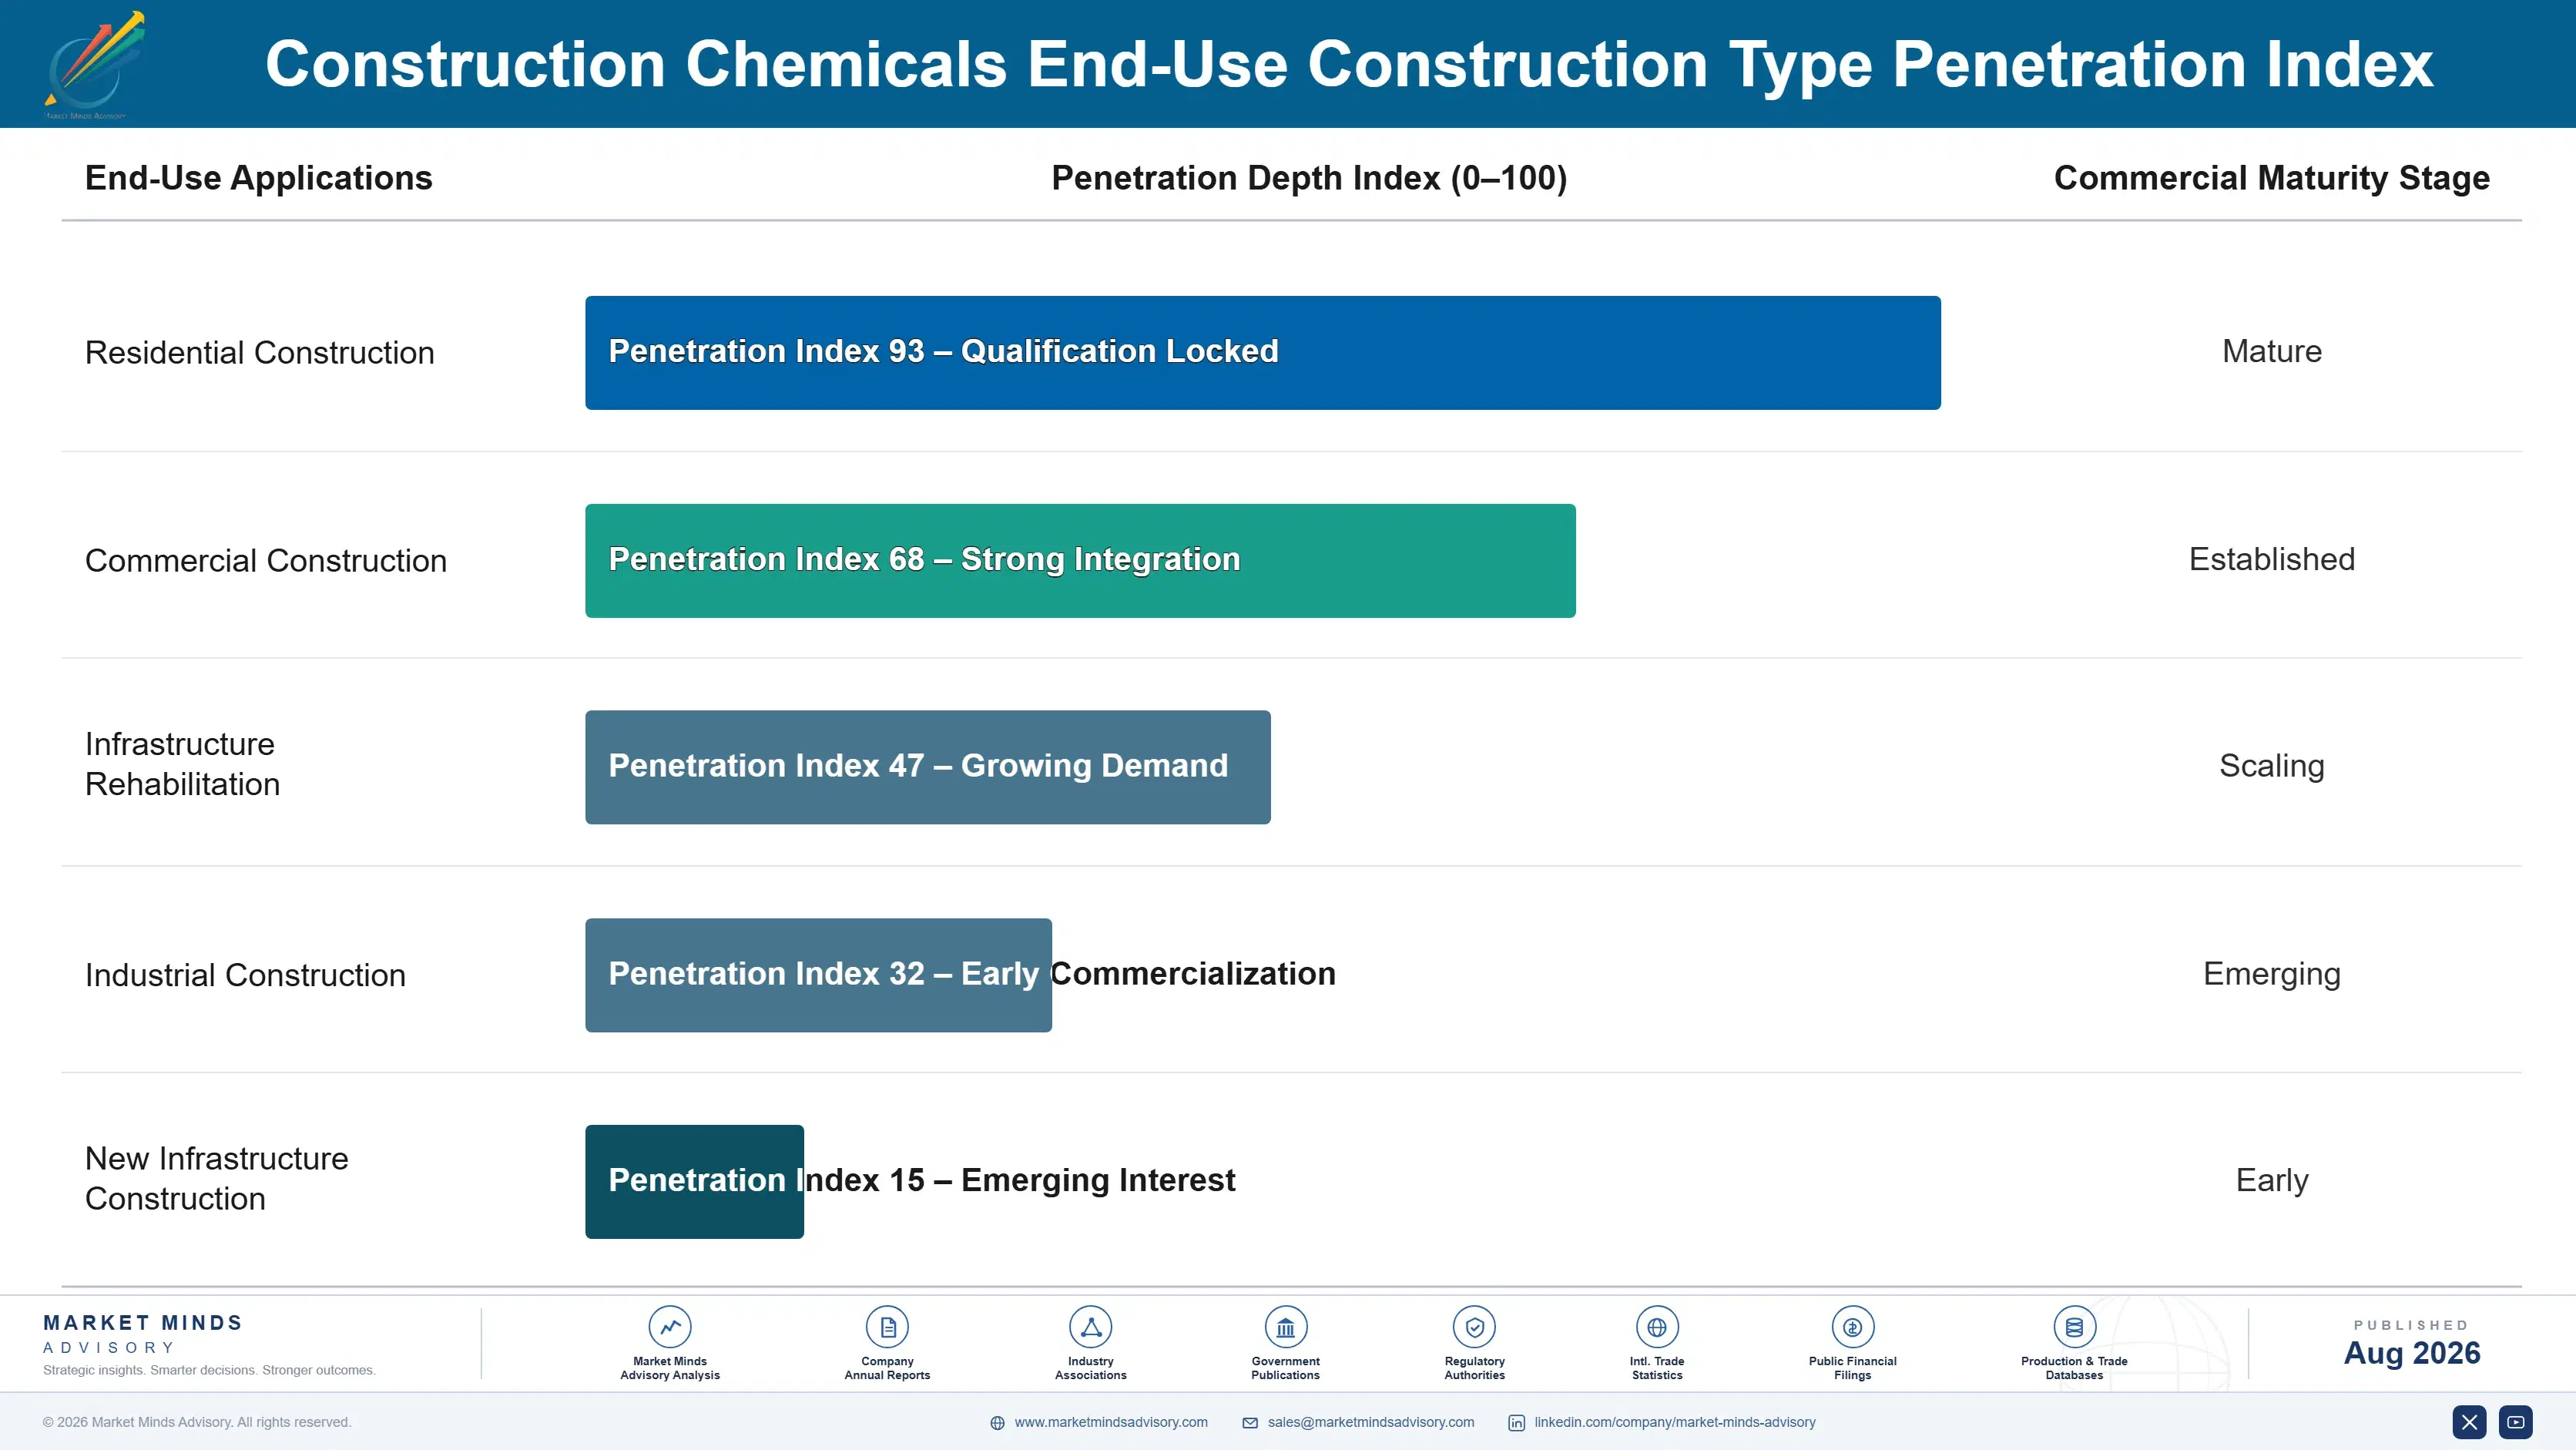
Revenue depends on specification relationships persisting across a project's design and construction phases, and once an engineer or asset owner specifies a formulator's system for a project, switching mid-programme carries requalification cost that protects the incumbent through completion. Rehabilitation programme relationships, tied to infrastructure asset owners rather than individual projects, generate demand across multi-year programming rather than one-time sales. A small number of large
Adoption depth varies sharply by application. Infrastructure rehabilitation adopts deepest, since asset owners build long-term formulator relationships around documented performance history and technical support. Commercial construction adopts more selectively, balancing specification quality against project cost pressure. Residential and smaller commercial projects adopt most price-sensitively, with specification decisions often made by contractors rather than engineers with long-term performance considerations in mind.

Buyer profiles have shifted from individual contractors toward infrastructure asset owners and specification engineers who evaluate formulator relationships against multi-year rehabilitation programming rather than single-project economics. Procurement increasingly runs through framework agreements that lock in suppliers across multiple projects rather than individual tenders. Younger specification engineers also weight documented climate performance data more heavily than prior generations, who often specified primarily on established brand reputation.
construction-chemicals-market-end-use-penetration-index-1787324261280

Our Call On Construction Chemicals

These are among the four positions where our research anticipates prominent divergence between winners and laggards over the coming forecast period. Each is grounded in the demand model, the regulatory perimeter, and the announced capacity pipeline.
01 / REHABILITATION BEATS NEW BUILD

Repair demand now grows independent of construction cycles

Rehabilitation chemistry already generates roughly 34% of category revenue and grows independently of new construction starts, because aging bridges, tunnels, and water infrastructure require attention regardless of how much new building occurs in any given year. This decoupling gives rehabilitation-focused formulators a demand base considerably more stable than admixture suppliers tied directly to construction cycles. Formulators should build direct infrastructure asset owner relationships now, because rehabilitation programming provides multi-year demand visibility that contractor-only relationships simply cannot match at any comparable scale.
02 / TECHNICAL SERVICE AS MOAT

Applicator support now decides specification more than price

Waterproofing membranes and repair mortars specified incorrectly for jobsite conditions fail expensively, which means applicator training and hands-on technical support increasingly decide specification wins independent of chemistry price alone. Sika's scale following the MBCC Group acquisition demonstrates just how large a technical service advantage rapid, well-executed consolidation can build across an entire product portfolio. Formulators without comparable field service scale should specialise narrowly in categories where large-scale technical support matters less, rather than attempting to compete broadly against consolidated technical service leaders directly.
03 / CLIMATE DATA GATES SPECIFICATION

Documented regional performance beats generic formulation claims

Insurers and infrastructure asset owners increasingly require documented climate-specific performance data before specifying waterproofing or coating chemistry for critical applications, raising the bar that competitors without regional testing history cannot clear quickly. This dynamic favours formulators who invested in field testing years ahead of demand over those responding only once specification requirements tighten. Companies should treat climate-specific testing as a strategic investment rather than a compliance cost, since the resulting data becomes a durable competitive asset difficult for rivals to replicate quickly.
04 / RAW MATERIAL INDEXING

Fixed pricing absorbs volatility formulators should pass through

Specialty polymer and additive costs move continuously while construction chemical pricing typically resets only annually, creating margin compression during volatile input cost periods that formulators currently absorb rather than transfer entirely to customers. Suppliers negotiating index-linked pricing on large infrastructure programmes protect margin through volatility that fixed-price competitors cannot match under comparable market conditions. Formulators should prioritise index mechanism adoption on new large programmes now, since every additional fixed-price contract signed today compounds exposure to the next inevitable feedstock cycle.

Engagement Snapshot From the Field

A live engagement with an industry participant carrying material or product regulatory and market exposure ahead of a defining policy shift, showing how our research translates into a defensible multi-year portfolio strategy.
MARKET MINDS ADVISORY · CLIENT ENGAGEMENT SUMMARY
Construction Chemicals Producer Strategic Portfolio Review and Transition Roadmap 2026·Investment Scenario on Construction Chemicals Exposure Evaluation 2025-26
CLIENT PROFILE
A regional infrastructure rehabilitation contractor serving bridge and water infrastructure asset owners across three states engaged MMA while evaluating whether to expand its formulator supplier base beyond a long-standing single-source relationship. The client reported annual rehabilitation project revenue near USD 210 million, with roughly 78% of chemistry sourced from one formulator under a legacy relationship (client-reported, unverified by MMA).
STRATEGIC CHALLENGE
Leadership worried that single-source dependence exposed the business to pricing power the formulator could exercise unilaterally following recent industry consolidation, but historical technical service quality made diversification feel commercially risky. Several major asset owner clients had begun asking about formulator diversity as part of their own supply chain risk management requirements. No structured framework existed for evaluating alternative suppliers against the incumbent relationship.
MMA APPROACH
MMA benchmarked the incumbent formulator's post-consolidation pricing trajectory against comparable rehabilitation-focused suppliers, incorporating technical service capability alongside price in the comparison. We assessed qualification timelines and performance risk for introducing a second formulator across specific product categories rather than the full portfolio at once. We then modelled pricing leverage scenarios under continued single-source dependence against a phased diversification approach.
KEY FINDINGS
  1. Post-consolidation pricing from the incumbent formulator had risen faster than comparable rehabilitation chemistry suppliers over the prior eighteen months, exceeding the client's internal budget assumptions considerably.
  2. Qualification of a second formulator for waterproofing and repair mortar categories specifically was achievable within roughly seven months without disrupting active infrastructure programmes.
  3. Client asset owners viewed formulator diversification favourably, with two explicitly indicating it would strengthen future contract renewal discussions (client-reported, unverified by MMA).
  4. Full portfolio diversification across all chemistry categories simultaneously carried meaningfully higher execution risk than a phased, category-by-category approach the client ultimately chose to pursue instead.
CLIENT PROFILE
A regional infrastructure rehabilitation contractor serving bridge and water infrastructure asset owners across three states engaged MMA while evaluating whether to expand its formulator supplier base beyond a long-standing single-source relationship. The client reported annual rehabilitation project revenue near USD 210 million, with roughly 78% of chemistry sourced from one formulator under a legacy relationship (client-reported, unverified by MMA).
STRATEGIC CHALLENGE
Leadership worried that single-source dependence exposed the business to pricing power the formulator could exercise unilaterally following recent industry consolidation, but historical technical service quality made diversification feel commercially risky. Several major asset owner clients had begun asking about formulator diversity as part of their own supply chain risk management requirements. No structured framework existed for evaluating alternative suppliers against the incumbent relationship.
MMA APPROACH
MMA benchmarked the incumbent formulator's post-consolidation pricing trajectory against comparable rehabilitation-focused suppliers, incorporating technical service capability alongside price in the comparison. We assessed qualification timelines and performance risk for introducing a second formulator across specific product categories rather than the full portfolio at once. We then modelled pricing leverage scenarios under continued single-source dependence against a phased diversification approach.
KEY FINDINGS
  1. Post-consolidation pricing from the incumbent formulator had risen faster than comparable rehabilitation chemistry suppliers over the prior eighteen months, exceeding the client's internal budget assumptions considerably.
  2. Qualification of a second formulator for waterproofing and repair mortar categories specifically was achievable within roughly seven months without disrupting active infrastructure programmes.
  3. Client asset owners viewed formulator diversification favourably, with two explicitly indicating it would strengthen future contract renewal discussions (client-reported, unverified by MMA).
  4. Full portfolio diversification across all chemistry categories simultaneously carried meaningfully higher execution risk than a phased, category-by-category approach the client ultimately chose to pursue instead.
RECOMMENDED STRATEGY
Phase 1: Phase 1 (0 to 7 months): Qualify a second formulator for waterproofing and repair mortar categories on active but lower-risk programmes. Phase 2: Phase 2 (7 to 16 months): Expand the second formulator relationship across additional categories based on qualification performance and results. Phase 3: Phase 3 (16 to 24 months): Rebalance category-level sourcing to establish sustained negotiating leverage across both qualified formulators going forward.
OUTCOME
The client began phased qualification of a second formulator for waterproofing and repair mortar categories, avoiding disruption to active infrastructure programmes while building negotiating leverage the single-source relationship had not provided. Early client asset owner feedback on diversification was positive, and pricing discussions with the incumbent formulator improved measurably once qualification began (client-reported, unverified by MMA).

Frequently Asked Questions

Foundational context covering the market sizes, CAGR, scope, country, region and competition that inform every finding below. This section is provided to cover basics and most often pre-purchase conversations, answered from the MMA Primary Research Dataset.

What is the current size of the Construction Chemicals Market?

The global construction chemicals market is valued at USD 48.6 billion in 2025, covering concrete admixtures, waterproofing compounds, sealants, coatings, repair mortars, and grouts. General-purpose paint and cement itself are excluded.

How large will the Construction Chemicals Market be by 2036?

The market is forecast to reach USD 96.16 billion by 2036 in the base case, about 1.86 times the 2026 level. That represents incremental value of roughly USD 44.45 billion across the decade.

What is the CAGR for the Construction Chemicals Market 2026 to 2036?

The market grows at a 6.4% CAGR in the base case, with bull and bear scenarios at 7.7% and 5.1%. The spread turns mainly on infrastructure rehabilitation funding and emerging market construction volume.

Which segment is growing fastest?

Waterproofing compounds grow fastest at 9.8%, about 1.53 times the overall rate, as climate exposure pushes owners toward preventive treatment. Repair and rehabilitation mortars follow at 8.6%.

Who are the major companies in the Construction Chemicals Market?

Leading companies include Sika, Mapei, Saint-Gobain, RPM International, and Pidilite Industries. Concentration sits at a moderate CR5 of 42%, following Sika's 2023 acquisition of MBCC Group.

Which country is growing fastest?

India grows fastest at a 10.8% CAGR, as national infrastructure pipeline spending drives road, rail, and water infrastructure construction. China follows on continued construction volume despite property market softening.

Report Segmentation Architecture

The full report scope spans multiple orthogonal segmentation dimensions, with cross-tabulated demand data provided for each dimension pair. Coverage extends further to regional breakdowns, trend trajectories, and the competitive detail needed to support segment-level decision-making.

By Product and Chemistry Type

  • Concrete Admixtures
  • Waterproofing Compounds
  • Sealants and Adhesives
  • Protective and Flooring Coatings
  • Repair and Rehabilitation Mortars
  • Grouts and Anchoring Systems

By End-Use Construction Type

  • Residential Construction
  • Commercial Construction
  • Infrastructure Rehabilitation
  • Industrial Construction
  • New Infrastructure Construction

By Commercial Dimension

  • New Construction Sales
  • Rehabilitation Programme Sales
  • Technical Service and Training
  • Distribution and Retail Channel

By Region

  • North America
  • Western Europe
  • East Asia
  • South Asia and Pacific
  • Latin America
  • Middle East and Africa
  • Eastern Europe

Scope, Methodology, and Coverage

Every figure in this report is reproducible from documented input assumptions. The scope below maps the historical period, the forecast horizon, the segmentation dimensions, and the countries covered, alongside the underlying primary and qualitative methodology.
Historical Period
2020 to 2025
Forecast Period
2026 to 2036
Base Year
2025 (USD billions; MMA Primary Research Dataset, August 2026)
Market Definition
The construction chemicals market comprises specialty chemical formulations used in concrete production, waterproofing, sealing, bonding, coating, and structural repair across building and infrastructure construction, valued at manufacturer revenue from products and directly attached technical service. It spans concrete admixtures, waterproofing compounds, sealants and adhesives, protective and flooring coatings, repair and rehabilitation mortars, and grouts and anchoring systems. General-purpose architectural and industrial paint, cement and aggregate themselves, and construction equipment and machinery are excluded.
Quantitative Units
USD billions (current prices); treated construction area where applicable
Segmentation Dimensions
By Product and Chemistry Type; By End-Use Construction Type; By Commercial Dimension; By Region
Regions Covered
North America, Western Europe, East Asia, South Asia and Pacific, Latin America, Middle East and Africa, Eastern Europe
Countries Covered
USA, China, Germany, France, UK, Japan, South Korea, India, Australia, Canada, Brazil, Mexico, Indonesia, Vietnam, Thailand, Malaysia, UAE, Saudi Arabia, South Africa, Nigeria, Turkey, Poland, Netherlands, Italy, Spain, Sweden, Switzerland, Argentina, Colombia, Singapore, and additional markets relevant to this sector
Key Companies Profiled
Sika, Mapei, Saint-Gobain, RPM International, Pidilite Industries, Arkema, Dow, Fosroc, Sherwin-Williams, PPG Industries, Ardex Group, Cico Technologies, Berger Paints, Asian Paints, Soprema, Kerakoll, Laticrete International, Chryso, Conmix, MC-Bauchemie
Quantitative Methodology
Primary survey, n=3,800 respondents, Q4 2025, six countries; demand-side model with trade association cross-validation
Qualitative Methodology
47 expert interviews, Q4 2025; applied to validate demand model assumptions, identify emerging dynamics, and assess competitive positioning
Report Format
PDF and XLSX data workbook (Word format preview document)
Publisher
Market Minds Advisory
Report Code
MMA-2026-CHM-312
Published
August 2026
Contact
sales@marketmindsadvisory.com | www.marketmindsadvisory.com

Purchase the full Construction Chemicals Market Report (2026 to 2036).

The full MMA Construction Chemicals report sizes the market across six product categories, five end-use construction types, four commercial dimensions, and seven regions through 2036. It profiles 20 companies on a consistent construction chemical revenue basis, scoring each on technical service scale, infrastructure asset owner relationships, and climate-specific performance data. Scenario models quantify how infrastructure rehabilitation funding, climate-driven waterproofing demand, and emerging market construction volume move both category demand and achievable margin. The report also includes rehabilitation programme funding tracking, raw material cost pass-through analysis, and formulator consolidation impact assessment for commercial and product strategy teams.
Six-category and four-dimension market sizing to 2036
Twenty-company benchmark on construction chemical revenue basis
Infrastructure rehabilitation programme funding tracking by region
Raw material cost pass-through and margin impact analysis
Climate-specific waterproofing performance data benchmarking by region
Formulator consolidation impact assessment by product category

Built For The People Who Decide

From boardroom strategy to bench-side execution, this report is read cover-to-cover by leaders shaping the next decade of their industry, turning demand scenarios, market dynamics and valuation benchmarks into decisions.
CXOs/ Presidents/ VPs/ Managers
M&A and Corporate Development
Strategy Teams and R&D Heads
Procurement and Product Directors
Regulatory and Compliance Leaders
Investor Relations and Equity Analysts