Market Minds Advisory
United States Construction Anchor Market

United States Construction Anchor Market: Evaluation Reports, Seismic Categories, And Installation Nobody Watches

A two dollar anchor holds a building together and its capacity is now calculated rather than assumed. What decides the specification is an evaluation report costing millions and taking years to earn.

Lead Analyst

David Horsley

Published

September 2026

Make Smarter Decisions with Customized Research Insights

Request a free sample report and evaluate market opportunities, growth trends, and competitive dynamics relevant to your business needs.

2025 MARKET VALUE$2.4BMarket Size 2025
2036 FORECAST VALUE$4.4BBase Case , 2026 to 2036
CAGR 2026 TO 20365.6 %Bull 6.8% / Bear 4.4%
INCREMENTAL OPPORTUNITY$1.8BNet 10- year value creation
EXPANSION MULTIPLE1.72x2036 value over 2026 base
Strategic Levers
M&A Pipeline
Regional Outlook
Country Rankings
Competitive Intelligence
Segmental Deep-dive
Call-Us : 91 93563 13602

Executive Snapshot and Market Trajectory

Since anchorage design became a calculation rather than an assumption, an anchor without a current evaluation report on the right substrate cannot be specified at all. The barrier is paperwork costing millions. The market reaches USD 2.4 billion in 2025 and grows at 5.6%.
Adhesive and chemical anchors grow fastest at 8.4%, exactly 1.50 times the market rate, because they carry higher loads in cracked concrete and handle post-installed reinforcing connections that mechanical anchors cannot reach. North America holds 87% of value, far outside the band this framework applies, since the market is scoped to the United States. Seismic categories govern 44% of installations. Report coverage rather than manufacturing decides who takes part.
Concentration runs at 58%, held up by evaluation report portfolios rather than by manufacturing capability, since almost anybody can make a wedge anchor. Competition turns on which substrates and categories a report covers and how tolerant a product is of poor installation. Over 70% of anchor failures trace to installation rather than product. Field tolerance now matters more than published capacity, and specifiers barely price it. Nobody watches the installation that determines the outcome.
Market Definition
The United States construction anchor market covers products transferring load into concrete and masonry, whether installed after the pour or cast in place. It spans adhesive and chemical anchors, screw anchors, expansion and wedge anchors, cast-in anchor channels and headed studs, and powder-actuated direct fastening. Demand is domestic, with export supply from United States manufacturing included. General fasteners, high-strength steel bolting, geotechnical ground anchors, reinforcing bar, and standalone installation tools are excluded.
Base Year Value
$2.4B in 2025 (MMA Primary Research Dataset, August 2026)
Forecast Period
2026 to 2036, eleven discrete annual values
CAGR
5.6% base case. Bull 6.8%. Bear 4.4%.
Fastest Growth Segment
Adhesive and Chemical Anchors: 8.4% CAGR
Fastest Growth Country
Mexico: 6.4% CAGR
Fastest Growth Region
South Asia and Pacific: 7.6% CAGR
Largest Region
North America: 87% of 2025 global value
Market Leaders
Hilti, Simpson Strong-Tie, Stanley Black and Decker, Illinois Tool Works, fischer Group. Source: MMA Primary Research Dataset, July 2026.
Primary Survey
n=3,800 procurement and R&D decision-makers, Q4 2025, six countries
Methodology
Demand-side build-up, cross-validated against public data, 47 expert interviews

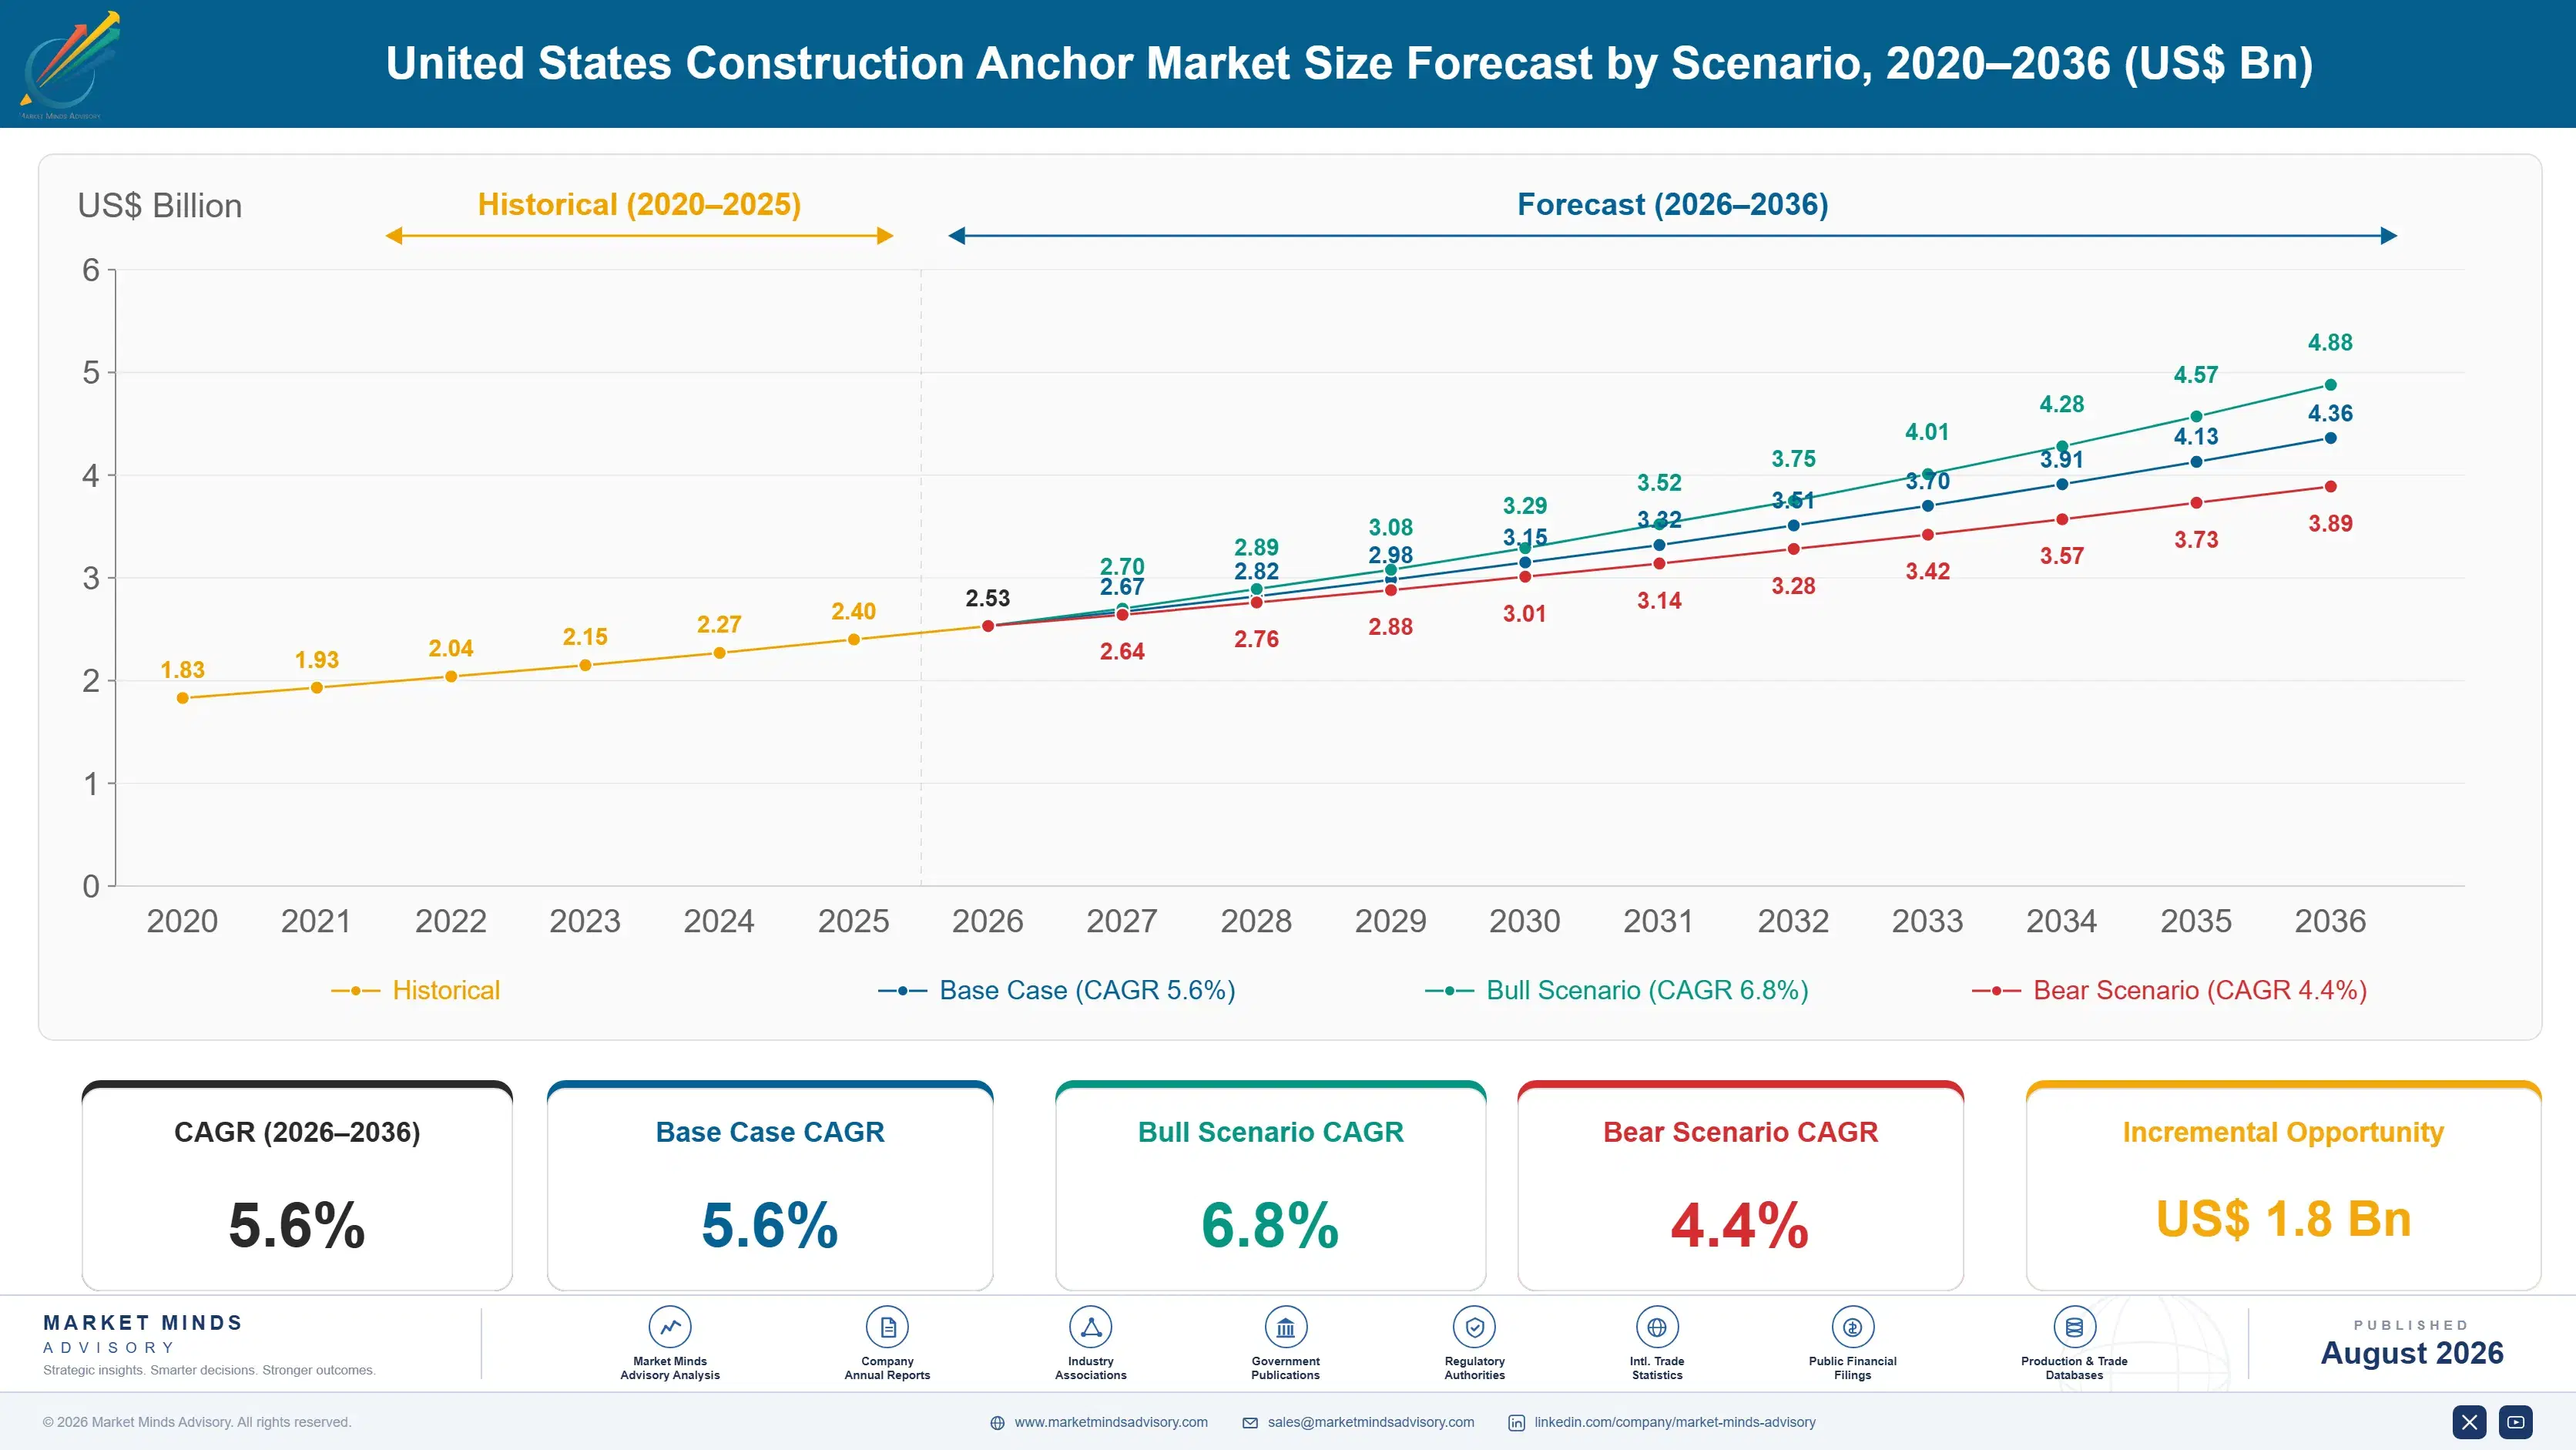
United States Construction Anchor Market Forecast Scenarios

construction-anchor-market-united-states-size-forecast-scenario-1787334209499
Between 2020 and 2025 construction volume moved unevenly while anchor value per project rose steadily. Data centre, semiconductor fabrication, and battery plant construction all specify anchorage at levels ordinary commercial building never approached, and federal infrastructure funding added bridge and transit work with demanding seismic requirements. Residential softness pulled the other way. A 4.5% historical CAGR nets those movements against each other.
Three mechanisms carry the 5.6% base case. Code-driven design is the largest, since calculated anchorage requires qualified products and pushes specification toward adhesive systems with the broadest evaluation coverage. Data centre and advanced manufacturing construction is the second, because equipment anchorage in those buildings runs to a density ordinary commercial work never sees. And infrastructure renewal keeps adding bridge, transit, and water projects where seismic categories govern and product choice narrows sharply.
The 6.8% bull case turns on advanced manufacturing construction continuing at the pace announced rather than the pace historically delivered. The 4.4% bear case is a commercial construction downturn reaching anchor demand within two quarters, which it always does. Neither scenario concerns the product, and both are decided by people who have never heard of an evaluation report.

A Two Dollar Part With A Million Dollar Barrier

Anchorage stopped being a hardware decision when the code required it to be calculated. A designer now sizes an anchor against cracked concrete, edge distance, spacing, and seismic category, and that calculation only works with published values from a current evaluation report. A product without one is not compared on price. It is not compared at all.
TOP FIVE CONCENTRATION58%Evaluation report portfolios limit who can be specified at all
AVERAGE ANCHOR PRICEUSD 2.40Blended across mechanical, adhesive, and cast-in anchor types
EVALUATION REPORT COSTUSD 1.4 millionTypical cost of qualifying one anchor family for code use
SEISMIC CATEGORY SHARE44%Portion installed where seismic design categories govern the specification
INSTALLATION FAILURE SHAREOver 70 percentShare of anchor failures traced to installation rather than product
DISTRIBUTOR CHANNEL SHARE66%Volume reaching contractors through construction supply distribution intermediaries
Earning a report costs around USD 1.4 million per anchor family and takes years of testing, which is why 58% of the market sits with five suppliers in a category where the manufacturing is unremarkable. The barrier is documentation, it renews on a cycle, and it has to be maintained across every substrate and condition a specifier might encounter.
The uncomfortable part is what happens on site. Over 70% of anchor failures trace to installation rather than product, usually an uncleaned hole, wrong embedment, or the wrong bit diameter. All the published capacity in the world assumes an installation nobody watched. Products tolerating a dirty hole outperform their datasheets in the field, and specifiers are only beginning to price that in. That gap between calculated capacity and delivered capacity is the real product question.
"An engineer spends a week calculating an anchorage to three decimal places, and then a labourer drills the hole, blows it out twice instead of four times, and installs it. The gap between those two activities is where this entire product category actually lives."
Director, Building Products Practice · MMA Construction and Industrial Equipment

Market Trends

Adhesive Systems Take Load Cases Mechanical Anchors Cannot

An adhesive anchor develops bond along the full embedment rather than relying on expansion force at one point, which lets it carry higher tension in cracked concrete, sit closer to an edge, and handle post-installed reinforcing connections that mechanical anchors cannot address at all. Retrofit and strengthening work depends on that capability entirely. Sustained load qualification became mandatory after a fatal ceiling collapse traced to adhesive creep, and the products carrying that qualification now hold a position competitors cannot enter without repeating the testing. The segment grows at 8.4% against a market at 5.6%.
Market Impact: Anchor density runs 4 times higher

Hole Cleaning Tolerance Becomes A Specification Argument

Adhesive anchor capacity collapses when drilling dust remains in the hole, and the prescribed cleaning routine of blowing, brushing, and blowing again is skipped on site more often than any manufacturer admits publicly. Hollow drill bits with integrated dust extraction remove the step entirely rather than relying on a labourer to perform it, and systems qualified for use with them are being specified on that basis. A product with lower published capacity that actually achieves it beats one with higher published capacity that rarely does. Specifiers who have investigated a failure understand this immediately.
Market Impact: Seismic categories govern 44% of in

Market Opportunities and Growth Drivers

Advanced Manufacturing Construction Demands Unusual Anchor Density

A data centre, semiconductor fabrication plant, or battery factory anchors equipment, cable trays, ductwork, seismic bracing, and process piping at a density ordinary commercial buildings never approach, frequently several times the anchors per square foot of an office building. Those projects also carry seismic bracing requirements for attached equipment and services that add further volume. Announced investment across these categories is substantial and the buildings are anchor-intensive in a way construction forecasts based on square footage badly understate. The specification is written by engineers who read evaluation reports carefully. Square footage forecasts miss this entirely.
Market Impact: Over 70% of failures are installati

Seismic Design Categories Narrow The Qualified Product Field

Anchors installed where seismic design categories C through F govern must carry specific seismic qualification, which involves simulated cracking and cyclic load testing beyond ordinary evaluation. Roughly 44% of installations fall under those categories once the West Coast, the Intermountain region, and parts of the Midwest and East are counted. A manufacturer without seismic qualification on a given anchor family is excluded from nearly half the market regardless of price or availability. The testing is expensive, slow, and precisely the sort of barrier that consolidates a category. It is exactly the sort of barrier that consolidates.
Market Impact: Demand falls within 2 quarters

Market Restraints and Challenges

Installation Quality Undermines Every Published Capacity

Over 70% of anchor failures trace to installation rather than to the product, and the most common causes are uncleaned holes, incorrect embedment depth, and the wrong drill bit diameter. The root cause is that the person installing is not the person who calculated, and no inspection regime reaches most installations. Commercially this creates liability exposure manufacturers cannot control and undermines the value of the qualification they paid for. Suppliers are mitigating with dust extraction systems, self-verifying installation tools, contractor training programmes, and adhesive chemistries less sensitive to hole condition.
Market Impact: Adhesive grows 8.4% against 5.6%

Commercial Construction Cycles Reach Anchor Demand Immediately

Anchors are consumed during construction rather than specified years ahead, so a project cancelled or deferred removes the demand entirely within a quarter or two. The root cause is position in the build sequence combined with no meaningful lead time or inventory buffer anywhere in the chain. Commercially this makes revenue considerably more volatile than the engineered nature of the product suggests and complicates capacity planning. Suppliers are mitigating through infrastructure and industrial exposure, which follows different cycles, and through renovation and retrofit demand that holds up better in downturns.
Market Impact: Cleaning skipped on 60% of installs
3 additional market trends, 4 additional growth drivers, and 2 additional restraints and challenges are covered in the full report. Contact sales@marketmindsadvisory.com to access the complete intelligence.

Segment CAGR and Growth Architecture

Segmentation follows anchoring mechanism, meaning how the product transfers load into the base material, because that determines the qualification testing required, the substrates it can serve, the installation sensitivity, and the load cases a designer can use it for. Base material, end-use application, and channel are handled in the framework and commentary instead. Nothing else separates this market usefully.
construction-anchor-market-united-states-market-share-analysis-1787334210032

Adhesive and Chemical Anchors

Adhesive anchors grow fastest at 8.4%, exactly 1.50 times the market rate, because bond along the full embedment reaches load cases expansion mechanisms cannot. Higher tension in cracked concrete, shorter edge distances, tighter spacing, and post-installed reinforcing connections all become possible, which is why retrofit and strengthening work depends on the technology almost entirely. Sustained load qualification became mandatory after a fatal ceiling collapse traced to adhesive creep, and the testing burden that created now protects the products which carry it. Installation sensitivity is the weakness, since capacity collapses when drilling dust remains in the hole and the cleaning routine is skipped more often than anybody admits. Field performance and datasheet performance diverge here more than anywhere.
CAGR 8.4%

Screw Anchors

Screw anchors grow at 7.2% by removing installation steps rather than by carrying more load. The anchor cuts its own thread into a drilled hole, needs no expansion force, no torque specification, and no curing time, and it can be removed and reinstalled where an expansion anchor cannot. That combination suits mechanical, electrical, and plumbing contractors installing hangers and supports at volume, which is where most anchors by unit count actually go. Load capacities have risen enough that the product now reaches applications previously reserved for wedge anchors. Speed of installation rather than published capacity is what wins the work, and contractors decide it rather than engineers. Contractors decide it rather than engineers, which changes the sale entirely.
CAGR 7.2%
Full segment breakdown across 7 segments available in the complete report.

Regional Architecture and Country Demand Map

This market is scoped to the United States, so the seven-region table concentrates almost entirely in one place and every figure sits outside the bands this framework applies by default. Small residual shares represent export supply from American manufacturing into adjacent markets. Every figure below carries its own explanation.

North America

North America holds 87% of value, far above the 32% ceiling this framework applies, which follows entirely from a market defined as the United States. Demand concentrates where construction is heaviest and codes are strictest at the same time: California and the Pacific Northwest under high seismic categories, Texas and the Southeast on volume, and the data centre corridors of Virginia, Arizona, and Ohio on anchor density. Federal infrastructure funding has added bridge, transit, and water treatment work with demanding qualification requirements attached. Canadian demand follows American codes closely and is served from the same manufacturing base. Growth at 5.6% is the headline rate, carried by advanced manufacturing construction and infrastructure renewal rather than by commercial building volume.
Share: 87% | CAGR: 5.6% (2026 to 2036)

Latin America

Latin America records 4% of value, below the 5% floor this framework applies, and it represents export supply from American plants rather than any domestic scope. Mexican industrial and commercial construction buys American anchor systems where a United States engineering firm or corporate parent writes the specification, which happens frequently in automotive, aerospace, and electronics facilities near the border. Central American and Caribbean projects funded through American development channels follow the same pattern. Brazilian and Argentine demand is served largely from European and domestic sources instead. Growth at 6.0% runs above the headline rate on nearshoring investment into northern Mexico, which specifies to American codes almost by default. American codes travel with the engineering firm.
Share: 4% | CAGR: 6.0% (2026 to 2036)
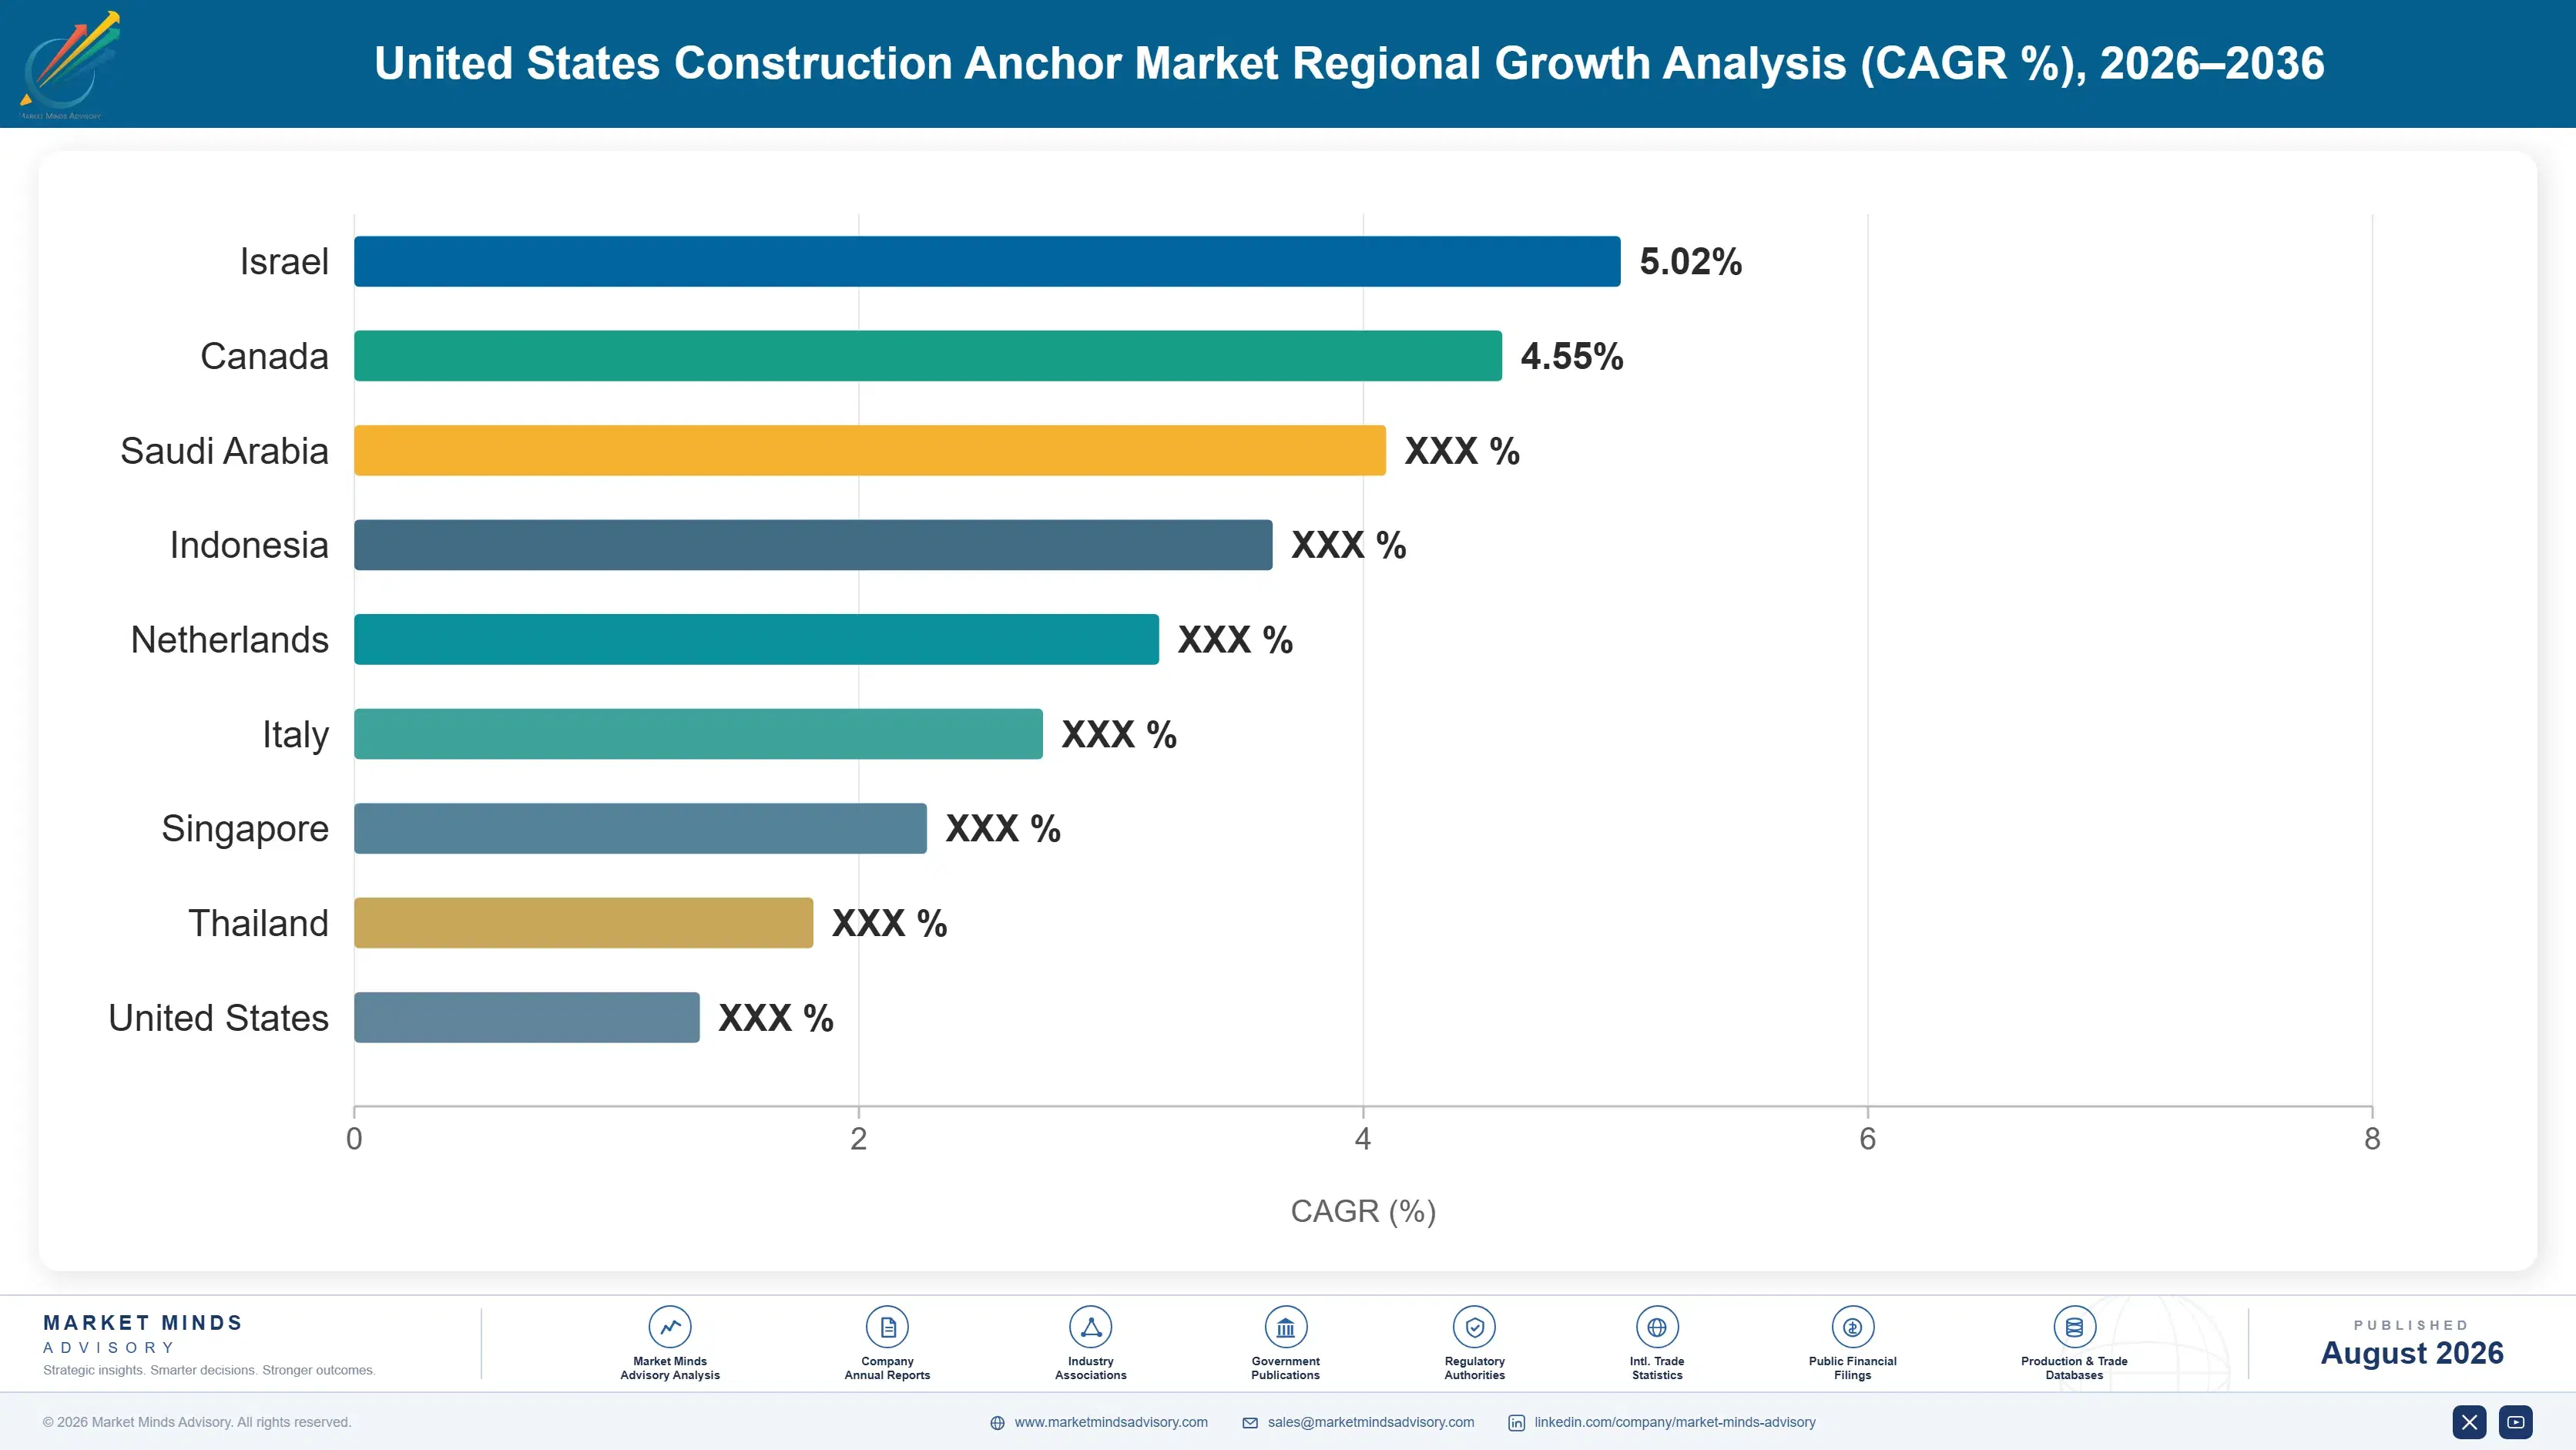
Regional intelligence for 5 additional markets available in the complete report: Western Europe, East Asia, South Asia and Pacific, Middle East and Africa, Eastern Europe. Contact sales@marketmindsadvisory.com.
construction-anchor-market-united-states-country-cagr-analysis-1787334210550

Where Anchor Margin Actually Comes From

Four levers matter here, and product engineering is barely among them. Evaluation report coverage, installation tolerance, specifier relationships, and distributor position decide outcomes, because a wedge anchor is a wedge anchor and everybody knows it. A manufacturer competing on published capacity against a competitor with wider report coverage is losing before the comparison starts.

Widen Report Coverage Before Chasing New Products

An evaluation report costs around USD 1.4 million per anchor family and covers specific substrates, embedments, seismic categories, and conditions. A gap anywhere in that matrix is a project a manufacturer cannot bid, and specifiers discover the gap rather than asking about it. Widening coverage on existing families reaches more projects than launching a new product does, at lower cost and with no market education required. Most manufacturers fund new product development because it is more interesting than testing, and then wonder why specification share does not move. Testing is less interesting than product work and pays better.
Market Impact: Evaluation reports cost USD 1.4 mil

Engineer For The Hole Nobody Cleaned

Over 70% of anchor failures are installation failures, and the most common single cause is drilling dust left in the hole before an adhesive anchor is set. A system that performs at published capacity in a poorly cleaned hole delivers more real capacity than a competitor with better datasheet numbers and less tolerance. Hollow bits with integrated extraction remove the step rather than relying on it being done. Manufacturers who test and publish performance under realistic site conditions rather than laboratory ones win specifications from engineers who have investigated a failure.
Market Impact: Over 70% of failures begin on the s

Reach The Specifying Engineer, Not The Contractor

An anchor gets named in a construction document by a design engineer months before any contractor buys anything, and once named it is difficult to substitute because the substitution requires recalculating the anchorage. Design software, published calculation tools, and technical support to engineering firms are how that naming happens, and they cost a technical team rather than a sales force. Manufacturers selling to contractors are competing for orders on products somebody else specified. The engineering firms making these decisions number in the hundreds rather than the thousands. Roughly 8 months separate the naming from the purchase.
Market Impact: Specification precedes any purchase

Hold Distributor Shelf Position Against Substitution

Around 66% of volume reaches contractors through construction supply distribution, and a contractor holding a specification will still accept an equivalent product if the specified one is not on the shelf that morning. Stocking depth, counter familiarity, and same-day availability therefore protect specifications a manufacturer already won. That is inventory investment defending revenue rather than generating it, which makes it perpetually difficult to justify internally. Manufacturers who lose that argument watch specifications convert into competitor sales without ever seeing it happen. Losing there is invisible, which is why it keeps happening.
Market Impact: Distributors carry 66% of all categ

Who Controls the Margin Pool

Concentration sits at 58% for the top five, high for a category where the manufacturing is unremarkable, because evaluation report portfolios rather than production capability decide who can be specified. The gap between leaders and challengers is report coverage breadth and specifier relationships rather than product performance. All participants here are assessed on one basis, revenue from post-installed and cast-in concrete anchoring products. Documentation rather than production is what a co
Competition runs on four lines. Report coverage decides which projects a manufacturer can even be named on. Installation tolerance decides whether published capacity is achieved in the field. Specifier relationships decide the naming itself, months before anybody buys. Price decides substitution at the distributor counter, which is where a specification quietly gets lost.

Two pressures will move positions. Screw anchors keep taking mechanical and electrical contractor volume from wedge anchors on installation speed rather than on any engineering argument. Meanwhile adhesive systems with dust extraction qualification are separating from those without on real rather than published performance. Positions favour whoever holds wide report coverage alongside installation-tolerant chemistry, and few manufacturers hold both. Very few manufacturers currently hold that combination together.
construction-anchor-market-united-states-company-positioning-matrix-1787334211071

Competitive Moat and Risk Dimensions

HILTI

Moat: Report breadth and direct engineering

Hilti carries evaluation report coverage across substrates, categories, and conditions that no competitor matches, which means it can be specified on projects where others simply cannot. A direct sales model reaching engineers and contractors rather than selling through distribution gives it the specification conversation and the installation feedback together. Design software adoption among engineering firms compounds both advantages.
HILTI

Risk: Direct model carries heavy cost

A direct sales and service organisation is expensive to run and difficult to flex when construction volume falls within two quarters, which it periodically does. Premium pricing invites substitution at the point of purchase where a distributor stocks an alternative. Competitors with adequate coverage and lower cost bases reach contractor volume the model never served.
SIMPSON STRONG-TIE

Moat: Code engagement and dealer depth

Simpson holds deep engagement with code bodies, testing agencies, and the engineering community built across decades, which produces both report coverage and credibility that competitors find slow to replicate. Distribution reach into lumber and construction supply is dense, so a specified product is usually on the shelf. Wood construction adjacency reaches specifiers through several product families at once.
SIMPSON STRONG-TIE

Risk: Residential exposure and cycle risk

A substantial share of demand comes from residential and light commercial construction, which moves faster and further than the industrial and infrastructure work carrying most current growth. Concrete anchoring competes against specialists whose entire business is that category. Distribution dependence also means limited visibility of why a specification was written and whether it survived to purchase.

Players Tracked

Prominent Players

Hilti
Simpson Strong-Tie
Stanley Black and Decker
Illinois Tool Works
fischer Group

Other Key Players

Würth Group
MKT Fastening
Rawlplug
Leviat
Sika
MAPEI
Master Builders Solutions
Adhesives Technology Corporation
Wej-It Anchor Products
Triangle Fastener Corporation
Concrete Fastening Systems
Elco Construction Products
Confast
Bosch
Grabber Construction Products

Recent Developments

JANUARY 2025

Post-installed reinforcing bar provisions widen in code guidance

Code guidance covering post-installed reinforcing bar connections was extended, addressing design and qualification for adhesive systems used to develop bar into existing concrete. These were code developments rather than commercial events, and they open retrofit and strengthening applications to any product carrying the necessary qualification.
Signal: A code provision creates demand for a qual
AUGUST 2024

Dust extraction drilling adoption spreads across adhesive installation

Contractors and specifiers increased adoption of hollow drill bits with integrated dust extraction for adhesive anchor installation, removing the manual hole cleaning routine rather than relying on it being performed. These were practice changes rather than transactions, and they alter the real capacity achieved against published values.
Signal: Removing a step a labourer skips is worth
MAY 2024

Advanced manufacturing projects lift anchor density specifications

Semiconductor, battery, and data centre construction programmes specified equipment and seismic bracing anchorage at densities well above ordinary commercial building, driven by process equipment loads and attached services bracing requirements. These were project specifications rather than corporate transactions, and they favour manufacturers with broad seismic qualification.
Signal: Anchor demand from these buildings runs fa

Steel, Resin, Zinc, And Testing

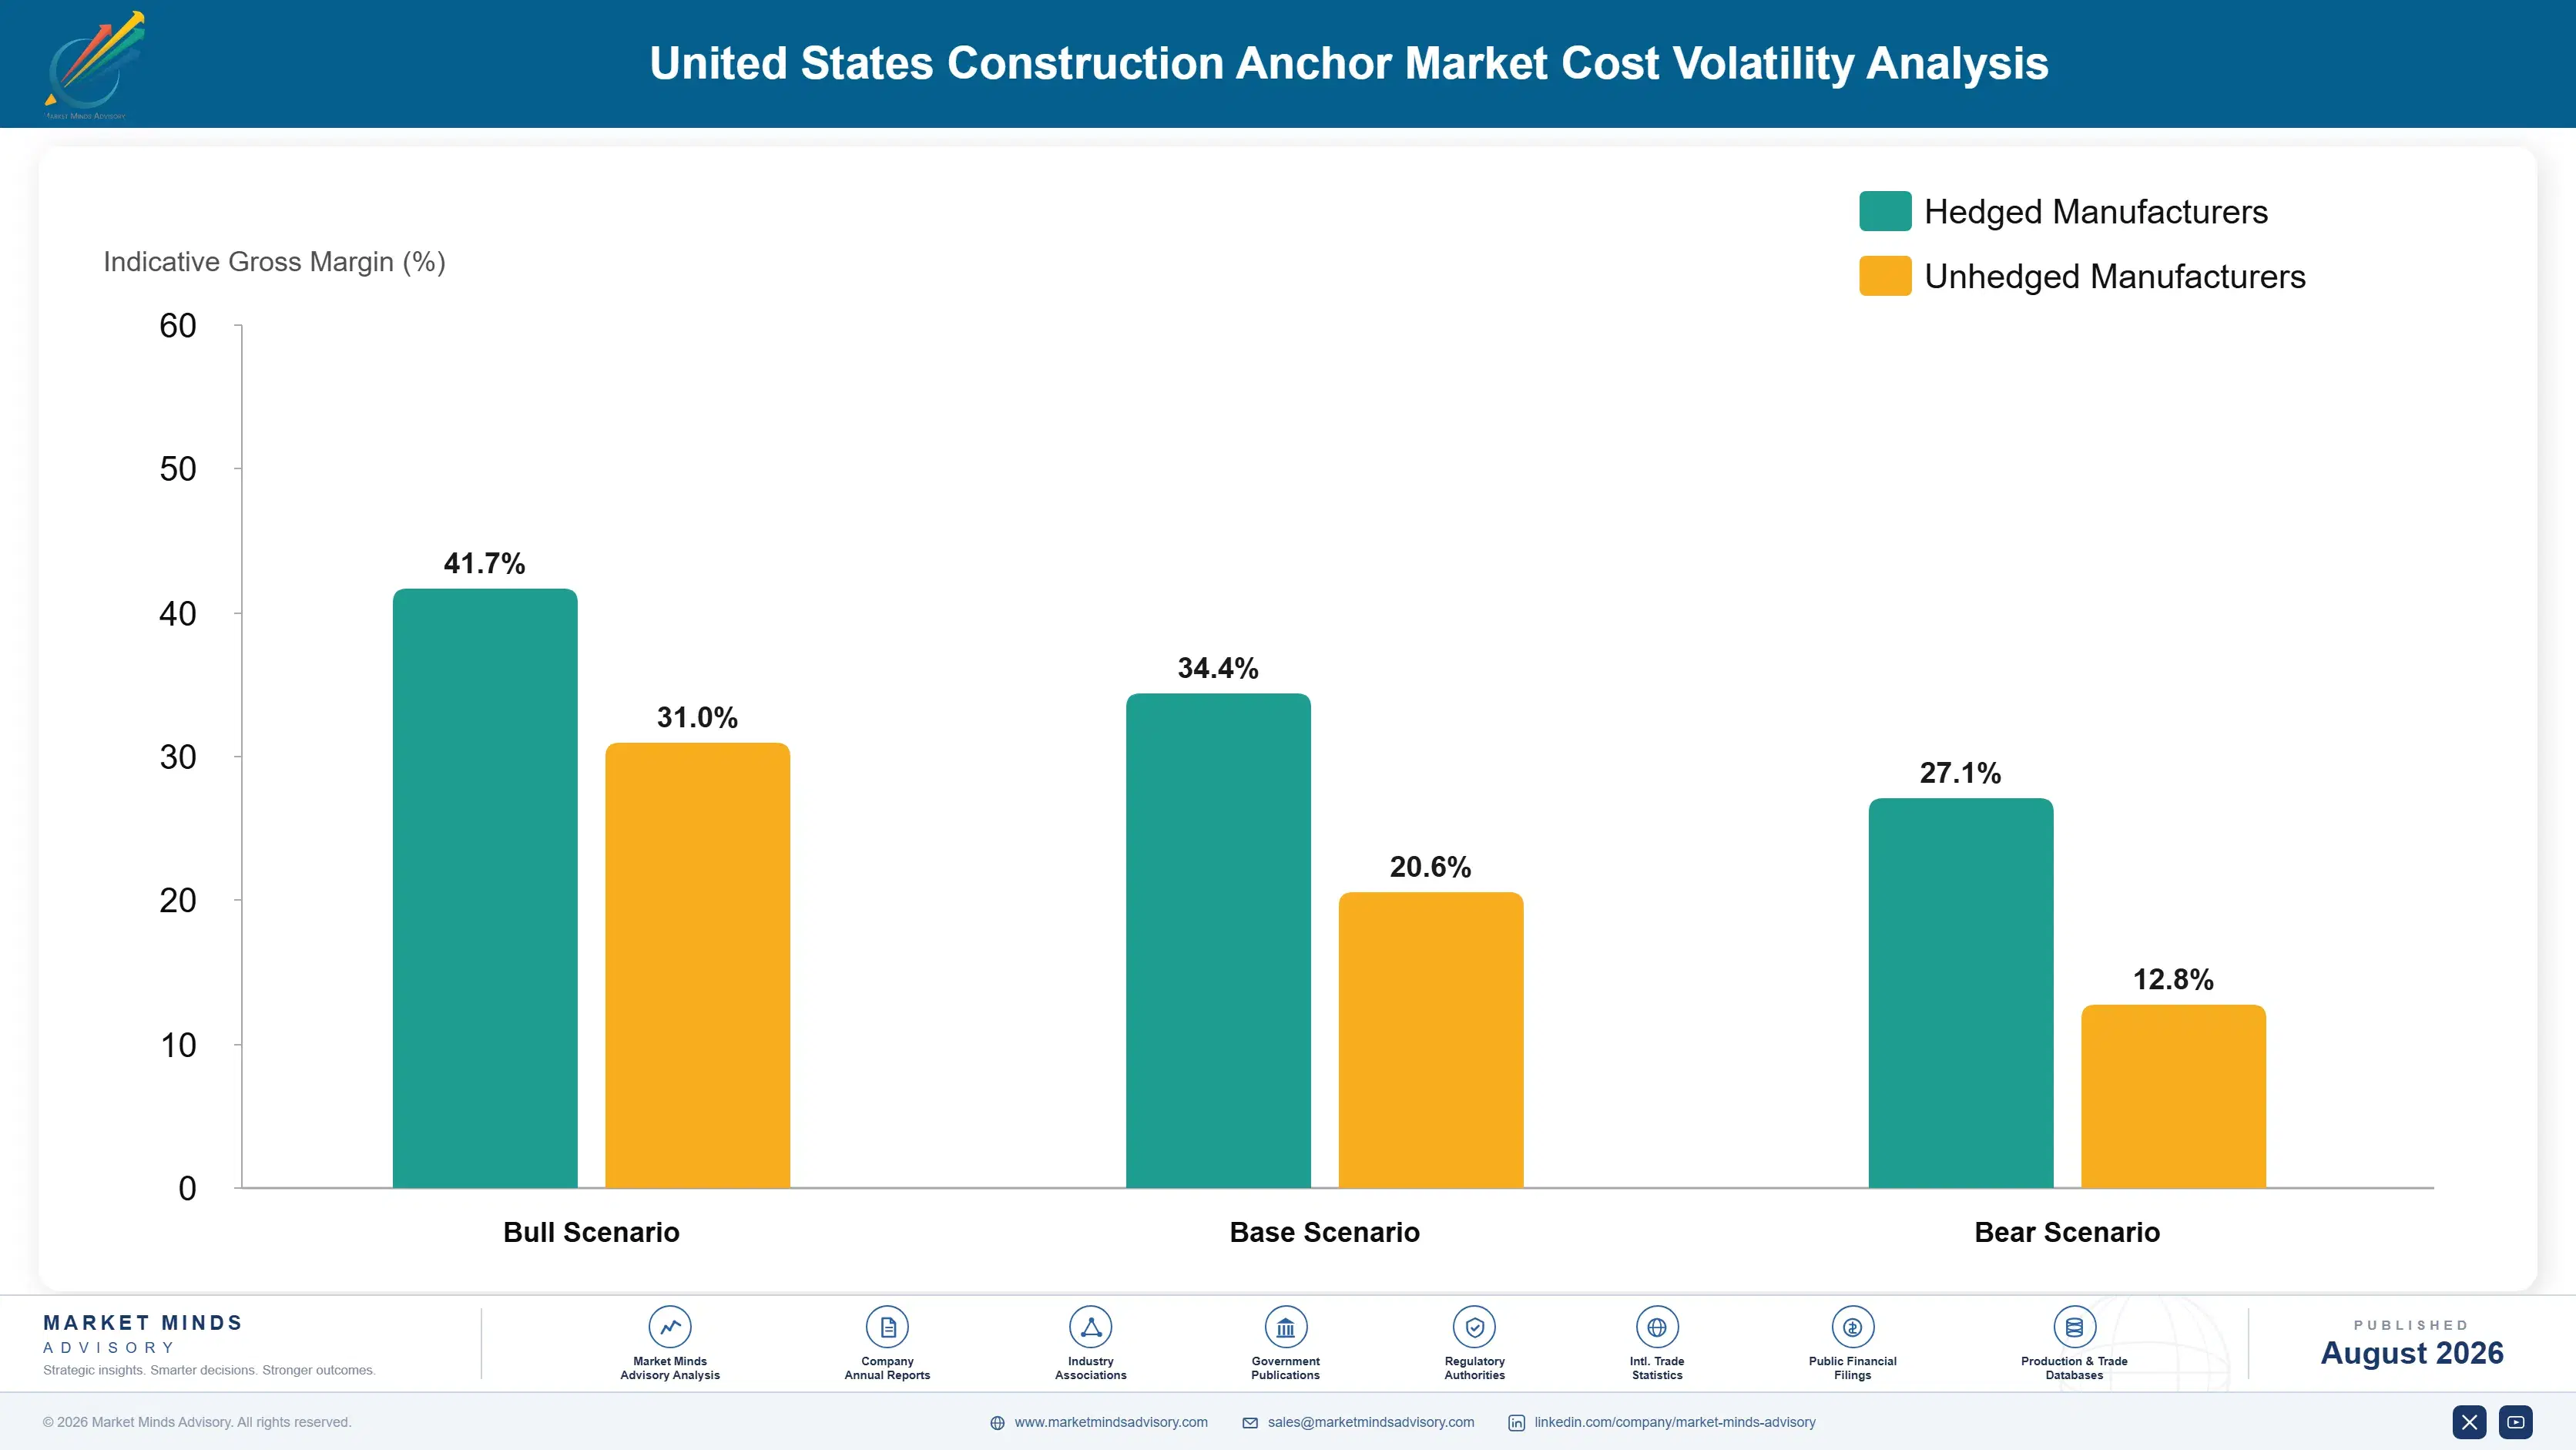
Cost structure divides sharply between mechanical and adhesive products. Carbon and stainless bar carries 44% to 58% of a mechanical anchor cost, priced against regional benchmarks. Epoxy and vinylester resin systems run 38% to 52% of an adhesive cartridge, from a narrow set of chemical suppliers. Zinc and coating add 8% to 14% on mechanical products. Testing and certification maintenance sits across both as a fixed annual burden.
American steel and zinc prices moved sharply through 2021 and 2022 under trade measures, and epoxy resin availability tightened when producers declared force majeure. The IEA documented the underlying industrial energy constraint across the period. Stanley Black and Decker and Illinois Tool Works both disclosed input cost pressure across those years. Manufacturers holding distributor price lists could not reprice quickly and absorbed most of it.

Each range above exceeds three points because a wedge anchor and an adhesive cartridge share nothing beyond the carton. Exposure separates by product mix. A mechanical anchor maker carries steel and zinc risk with several suppliers available. An adhesive maker carries resin exposure to a narrow chemical base and cannot substitute without repeating qualification testing. Asian manufacturing reaches mechanical anchors on cost and adhesives barely at all.
construction-anchor-market-united-states-cost-volatility-analysis-1787334211266

Reprice distributor lists on a published steel surcharge

Steel carries up to 58% of a mechanical anchor's cost and moves on benchmarks published monthly, while construction distribution price lists traditionally change once a year. That mismatch is an unintended commodity position. A surcharge mechanism agreed with distributors ahead of time costs one negotiation and removes the exposure permanently, which several suppliers in adjacent categories already do routinely.

Qualify a second resin supplier before availability tightens

Epoxy and vinylester systems come from a narrow chemical supplier base, and changing formulation means repeating the qualification testing the whole product proposition rests on. That work costs money and years rather than weeks. Starting while supply is comfortable costs testing time only. The alternative is an adhesive line unable to ship while its report stays valid but unusable.

Amortise testing across families, not individual products

Evaluation report testing behaves as a fixed cost rather than a per-unit one, and qualifying a family across substrates and categories costs far less per product than qualifying items individually. Most manufacturers test reactively as customers ask, which fragments the spend and produces gaps in coverage that lose projects nobody knew existed. One coordinated programme costs less and covers more.

Portfolio Architecture for Margin Defence

Three tiers sit inside this category and qualification draws the lines. Commodity mechanical anchors form the volume tier, sold on price through distribution where the design is unprotectable and imports compete freely. Code-qualified products with current evaluation reports earn more, because the report rather than the product is what a competitor must replicate. Adhesive systems, seismic-qualified families, and post-installed reinforcing solutions price highest of all.
The tension is between distribution volume that holds counter position and specification work that earns money. A contractor buys what is on the shelf, so breadth and stocking depth protect revenue. Yet the specification that created the demand was written months earlier by an engineer the manufacturer may never have met. Suppliers who resolve this fund both, and the ones who fund only distribution find their specification share quietly eroding.

High-value pools concentrate where qualification limits competition: adhesive systems with sustained load and seismic coverage, post-installed reinforcing connections, anchors qualified for use with dust extraction drilling, and families covering substrate and category combinations competitors have gaps in. The commodity end is plain wedge and sleeve anchors sold on price, where imports set the level and no brand defends anything.

Volume / Commodity-Adjacent Tier

Plain wedge, sleeve, and drop-in anchors sold on price through construction supply distribution. The range is wide because imported product and domestic manufacturing carry entirely different cost structures on physically identical items.
Gross Margin: 22-36%

Premium / Certified Tier

Anchor families carrying current evaluation reports across substrates, embedments, and seismic categories. The range is wide because coverage breadth decides how many projects a product reaches, and gaps in the matrix are invisible until a specification is lost.
Gross Margin: 38-54%

Sustainability / Regulatory / Next-Generation Tier

Adhesive systems with sustained load and seismic qualification, post-installed reinforcing solutions, and dust extraction qualified packages. The range is wide because resin cost varies while qualification scarcity supports pricing that mechanical products never command.
Gross Margin: 46-64%
construction-anchor-market-united-states-portfolio-architecture-1787334211765

High-value Sub-segments and Strategic Watch-out

Adhesive and Chemical Anchors

High value and high growth at 8.4%, exactly 1.50 times the market rate, because bond along the full embedment reaches load cases expansion mechanisms cannot approach. Installation sensitivity remains the weakness, and products tolerating a poorly cleaned hole outperform their datasheets where it matters. Tolerance beats capacity.
Gross Margin: 46-64%

Screw Anchors

High value with strong growth at 7.2%, winning mechanical and electrical contractor volume by removing installation steps rather than by carrying more load. No torque specification, no curing time, and removable installation are what decide it, and contractors rather than engineers make that call. Speed decides this one.
Gross Margin: 38-54%

Expansion and Wedge Anchors

The volume core by units at 3.3%, still the default for a great many applications and the product every manufacturer builds competently. Design content is minimal, imports compete freely, and price is essentially the only variable anybody discusses at the counter. Imports set the price and always have.
Gross Margin: 22-36%

Powder-Actuated and Direct Fastening

The strategic watch-out at 3.8%, holding light duty attachment work where speed matters and load requirements are modest. Screw anchors and adhesive systems keep taking applications from it, and operator licensing requirements add friction competitors do not carry. Licensing friction adds to the problem, and adoption keeps drifting away.
Gross Margin: 22-36%

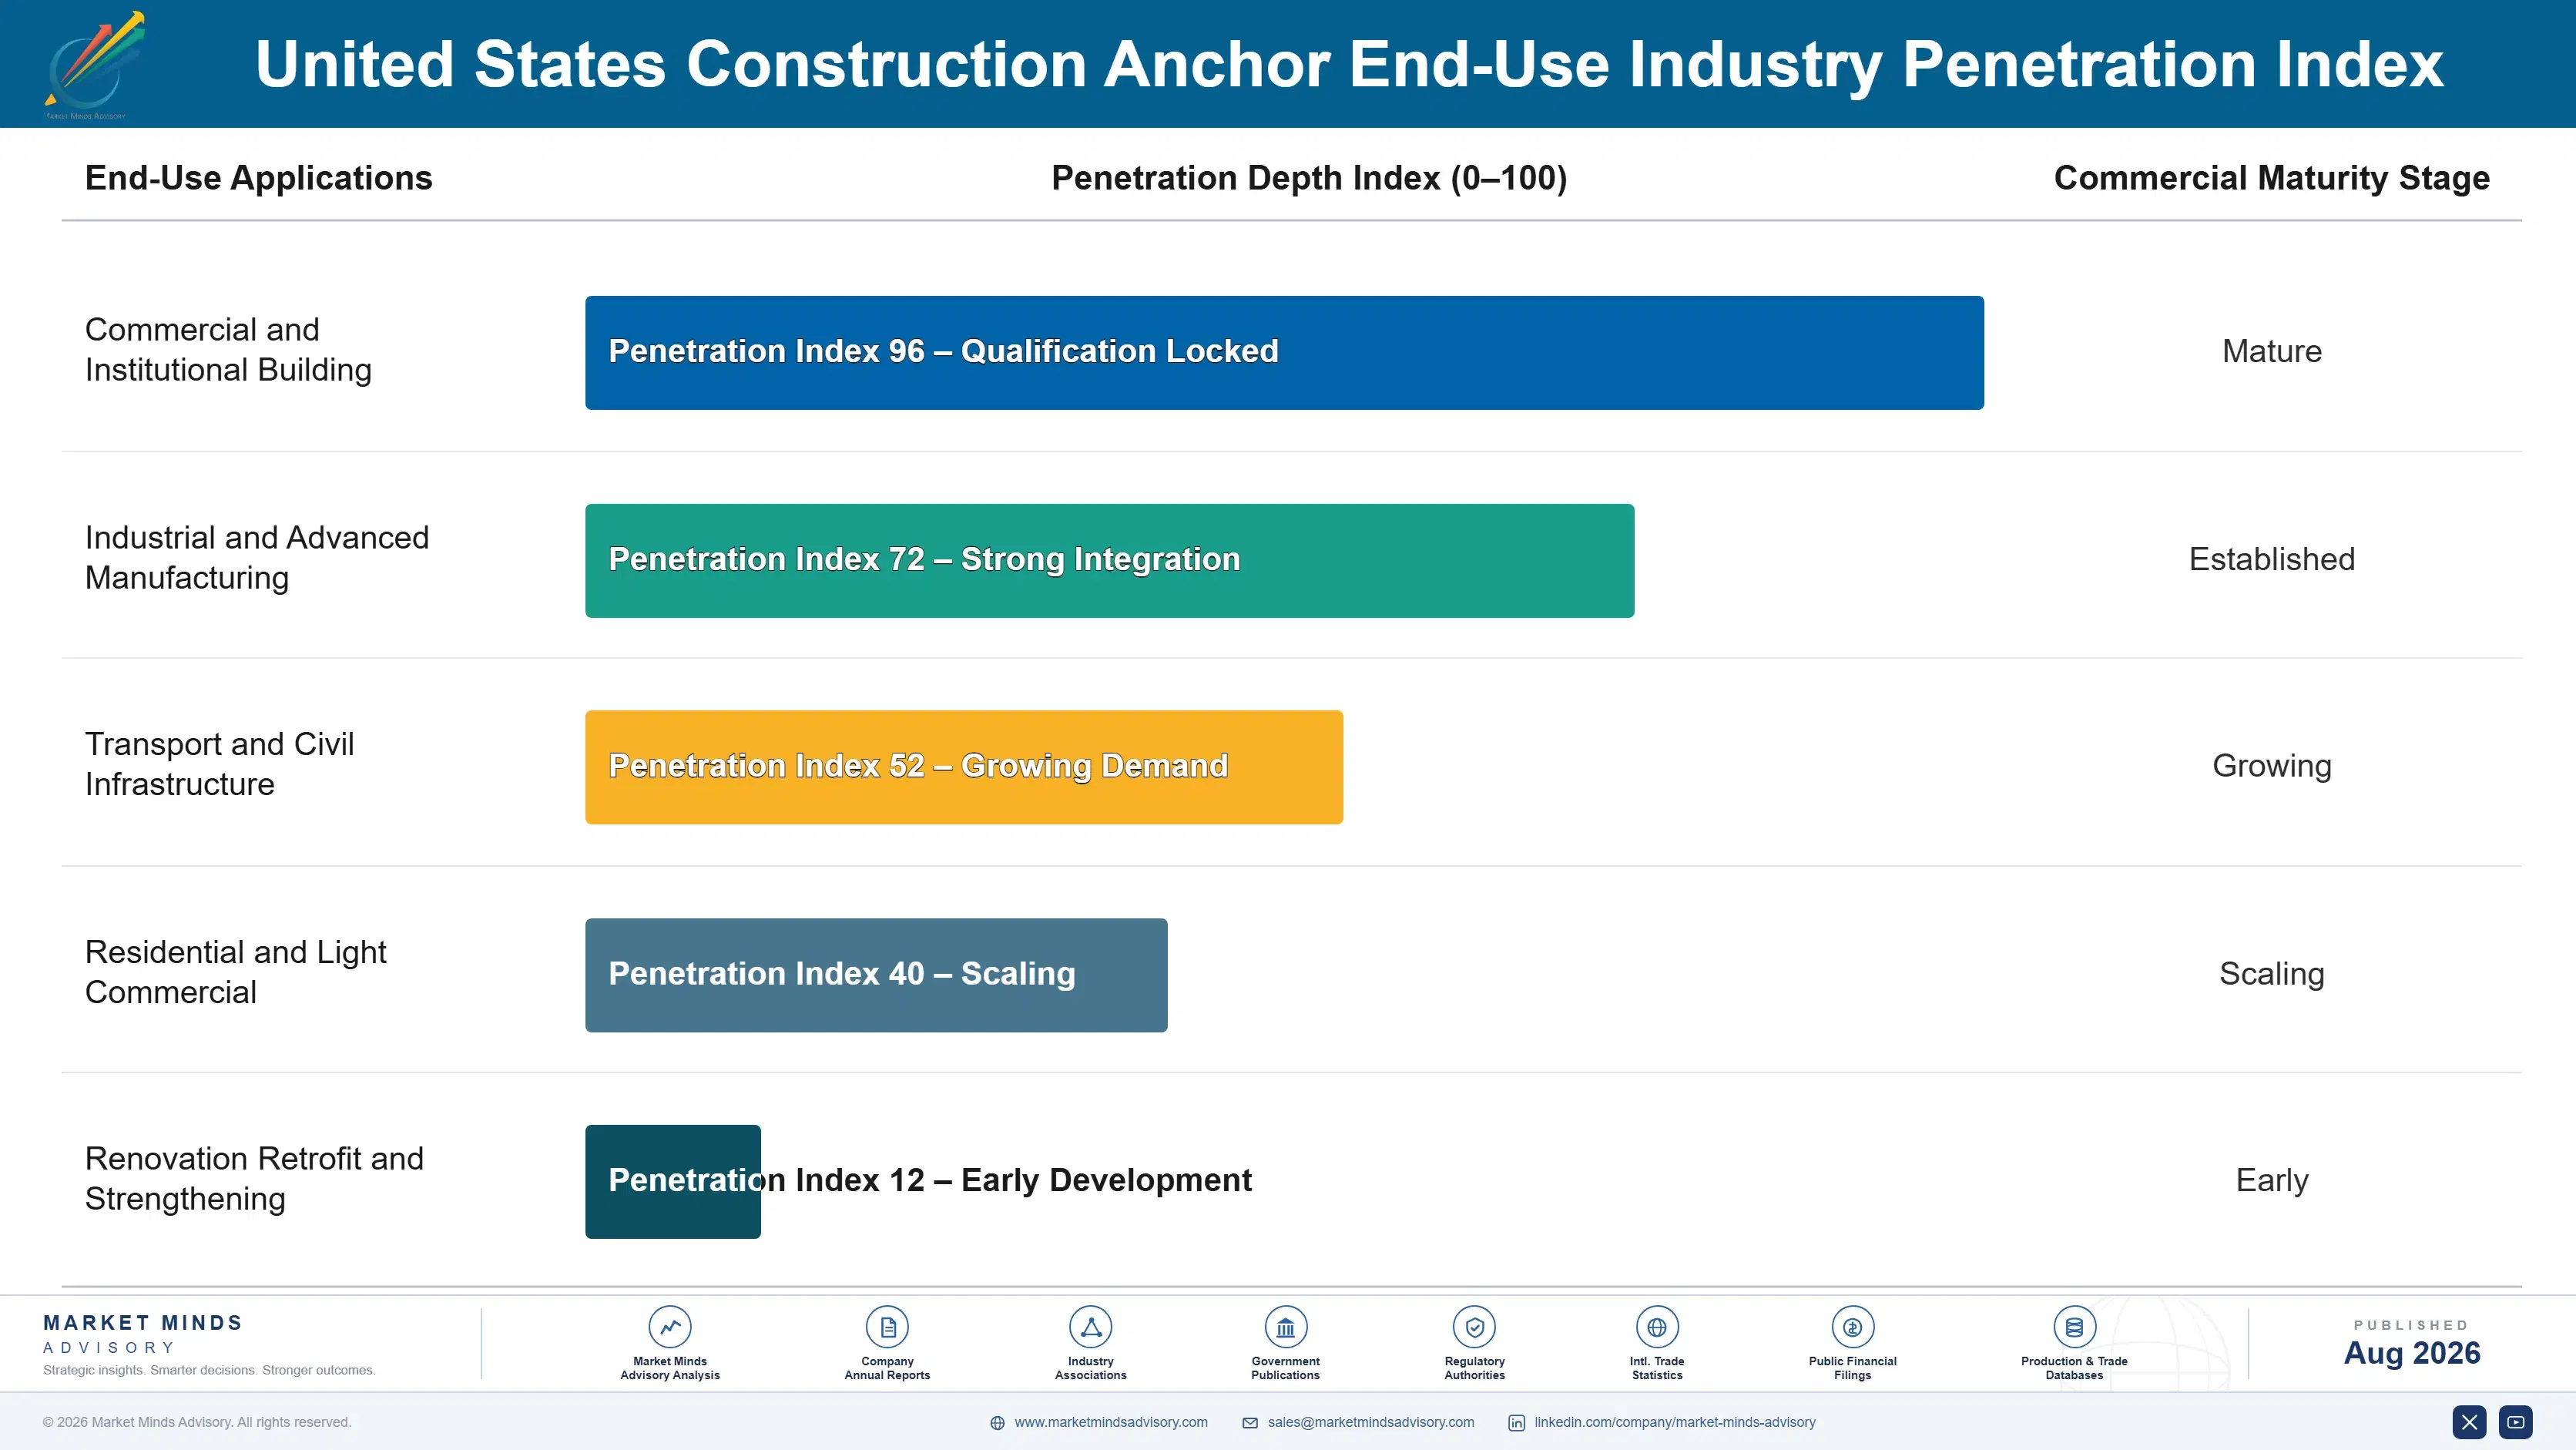
How Anchor Demand Gets Decided

Demand commits at specification, months before any product is bought, and repeats project after project once an engineering firm standardises on a manufacturer. An anchor named in a construction document is difficult to substitute because substitution means recalculating the anchorage, which nobody wants to do at the point of installation. That gives specification an unusual durability for a two dollar item. The competitive moments are a standard detail revision and a project where the incumbent
Stickiness varies with who is deciding. Engineering firms with standard details stick hardest, since changing one means revalidating every project using it. Industrial and infrastructure owners with corporate standards stick nearly as hard. General contractors stick moderately, buying what is specified when it is available. Mechanical and electrical subcontractors stick least, choosing on installation speed and whatever the counter has that morning.

The buyer has split in two rather than changed. An engineer specifies and a contractor purchases, and those two people frequently never speak. Twenty years ago the same decision often sat with one party. Manufacturers now win a specification and then defend it at a counter against substitution, two different activities competing for one budget.
construction-anchor-market-united-states-end-use-penetration-index-1787334212253

Our Call On Construction Anchors

These are among the four positions where our research anticipates prominent divergence between winners and laggards over the coming forecast period. Each is grounded in the demand model, the regulatory perimeter, and the announced capacity pipeline.
01 / REPORT COVERAGE PRIORITY

Test the matrix before building new products

An evaluation report costs around USD 1.4 million per anchor family and covers specific substrates, embedments, seismic categories, and installation conditions, and a gap anywhere in that matrix is a project the manufacturer cannot be named on. Specifiers find the gap rather than asking about it, so the loss is silent and never appears in any sales report. Widening coverage on existing families reaches more projects at lower cost than launching new products, which is precisely the opposite of how most development budgets in this category get allocated.
02 / INSTALLATION TOLERANCE DESIGN

Engineer for the hole nobody actually cleaned

More than 70% of anchor failures trace to installation rather than product, and the single most common cause is drilling dust left in the hole before an adhesive anchor is set despite a prescribed cleaning routine. A system delivering its published capacity in a realistically imperfect hole provides more actual capacity than a competitor with better laboratory numbers and less tolerance. Manufacturers who test and publish under site conditions rather than ideal ones win specifications from every engineer who has ever investigated a failure.
03 / SPECIFIER RELATIONSHIP FOCUS

The engineer names it, the contractor only buys it

An anchor is written into a construction document by a design engineer roughly eight months before a contractor purchases anything, and once named it resists substitution because changing it means recalculating the anchorage nobody wants to revisit. Design software, published calculation tools, and technical support to engineering firms are how that naming happens, and they require a technical organisation rather than a sales force. Manufacturers selling to contractors compete for orders on products that somebody else already specified for them.
04 / COUNTER POSITION DEFENCE

A specification lost at the counter is still lost

Around 66% of volume reaches contractors through construction supply distribution, and a contractor holding a specification will accept an equivalent product if the specified one is not on the shelf that morning and the crew is waiting. Stocking depth, counter familiarity, and same-day availability therefore defend revenue a manufacturer has already won rather than generating anything new. That makes the investment perpetually hard to justify internally, and the manufacturers who lose that internal argument never once see the sales they lose.

Engagement Snapshot From the Field

A live engagement with an industry participant carrying material or product regulatory and market exposure ahead of a defining policy shift, showing how our research translates into a defensible multi-year portfolio strategy.
MARKET MINDS ADVISORY · CLIENT ENGAGEMENT SUMMARY
United States Construction Anchor Producer Strategic Portfolio Review and Transition Roadmap 2026·Investment Scenario on United States Construction Anchor Exposure Evaluation 2025-26
CLIENT PROFILE
An American construction anchor manufacturer with roughly USD 165 million in annual revenue engaged MMA after specification share fell for three consecutive years despite competitive products and stable distributor relationships (client-reported, unverified by MMA). Management believed the problem was brand awareness among engineers and had funded two marketing programmes aimed at design firms without measurable effect.
STRATEGIC CHALLENGE
Marketing wanted a larger engineer-facing campaign. Product development wanted to launch a new adhesive system. Nobody had audited which substrate and seismic combinations the existing evaluation reports actually covered, or compared that matrix against what recent projects had required. The board needed a capital allocation decision before the next testing cycle began.
MMA APPROACH
MMA audited the client's evaluation report coverage against the anchorage requirements written into sixty recent commercial and industrial projects in its core regions. We interviewed 35 specifying engineers on how anchor selection actually happens and what removes a manufacturer from consideration. We then modelled three routes: an engineer-facing campaign, a new adhesive product, and a coverage extension programme across existing families.
KEY FINDINGS
  1. The client was ineligible for specification on 37% of audited projects because of report coverage gaps, mostly in higher seismic categories and hollow masonry substrates (client-reported, unverified by MMA).
  2. Specifying engineers reported checking coverage first and eliminating manufacturers before any evaluation of product merit, which made the client awareness campaigns entirely irrelevant to the outcome.
  3. Extending coverage across three existing families cost substantially less than qualifying the proposed new adhesive system and reached considerably more projects across the audited sample.
  4. Roughly a quarter of specifications the client did win were substituted at the distributor counter without anybody at the company knowing it had happened.
CLIENT PROFILE
An American construction anchor manufacturer with roughly USD 165 million in annual revenue engaged MMA after specification share fell for three consecutive years despite competitive products and stable distributor relationships (client-reported, unverified by MMA). Management believed the problem was brand awareness among engineers and had funded two marketing programmes aimed at design firms without measurable effect.
STRATEGIC CHALLENGE
Marketing wanted a larger engineer-facing campaign. Product development wanted to launch a new adhesive system. Nobody had audited which substrate and seismic combinations the existing evaluation reports actually covered, or compared that matrix against what recent projects had required. The board needed a capital allocation decision before the next testing cycle began.
MMA APPROACH
MMA audited the client's evaluation report coverage against the anchorage requirements written into sixty recent commercial and industrial projects in its core regions. We interviewed 35 specifying engineers on how anchor selection actually happens and what removes a manufacturer from consideration. We then modelled three routes: an engineer-facing campaign, a new adhesive product, and a coverage extension programme across existing families.
KEY FINDINGS
  1. The client was ineligible for specification on 37% of audited projects because of report coverage gaps, mostly in higher seismic categories and hollow masonry substrates (client-reported, unverified by MMA).
  2. Specifying engineers reported checking coverage first and eliminating manufacturers before any evaluation of product merit, which made the client awareness campaigns entirely irrelevant to the outcome.
  3. Extending coverage across three existing families cost substantially less than qualifying the proposed new adhesive system and reached considerably more projects across the audited sample.
  4. Roughly a quarter of specifications the client did win were substituted at the distributor counter without anybody at the company knowing it had happened.
RECOMMENDED STRATEGY
Phase 1: Phase 1 (0 to 10 months): Stop the marketing programme and begin coverage extension testing on the three highest-gap anchor families. Phase 2: Phase 2 (10 to 24 months): Build specification tracking from named projects through to distributor sell-through to see substitution. Substitution is invisible otherwise. Phase 3: Phase 3 (24 to 40 months): Fund the new adhesive system only once coverage gaps on existing families are closed.
OUTCOME
The board halted the marketing spend and funded coverage testing, which the marketing director opposed and later accepted. Project eligibility rose materially within four quarters and specification tracking revealed substitution running higher than anybody had assumed (client-reported, unverified by MMA). The new adhesive system remains deferred pending completion of the coverage programme.

Frequently Asked Questions

Foundational context covering the market sizes, CAGR, scope, country, region and competition that inform every finding below. This section is provided to cover basics and most often pre-purchase conversations, answered from the MMA Primary Research Dataset.

What is the current size of the United States Construction Anchor Market?

The market is valued at USD 2.4 billion in 2025, covering adhesive, screw, expansion, cast-in, and powder-actuated anchoring into concrete and masonry. General fasteners and geotechnical ground anchors are excluded.

How large will the United States Construction Anchor Market be by 2036?

The market is forecast to reach USD 4.36 billion by 2036 in the base case, about 1.72 times the 2026 level. That represents incremental value of roughly USD 1.83 billion.

What is the CAGR for the United States Construction Anchor Market 2026 to 2036?

The market grows at a 5.6% CAGR in the base case, with bull and bear scenarios at 6.8% and 4.4%. The spread turns on advanced manufacturing construction and on commercial building cycles.

Which segment is growing fastest?

Adhesive and chemical anchors grow fastest at 8.4%, exactly 1.50 times the overall rate, because bond along the full embedment reaches load cases mechanical anchors cannot. Screw anchors follow at 7.2%.

Who are the major companies in the United States Construction Anchor Market?

Leading participants include Hilti, Simpson Strong-Tie, Stanley Black and Decker, Illinois Tool Works, and fischer Group. Concentration sits at roughly 58%, held there by evaluation report portfolios rather than manufacturing capability.

Which country is growing fastest?

Within this United States scoped market, export supply into Mexico grows fastest at a 6.4% CAGR on nearshoring investment specified to American codes. Domestic demand grows at 5.6%.

Report Segmentation Architecture

The full report scope spans multiple orthogonal segmentation dimensions, with cross-tabulated demand data provided for each dimension pair. Coverage extends further to regional breakdowns, trend trajectories, and the competitive detail needed to support segment-level decision-making.

By Anchoring Mechanism

  • Adhesive and Chemical Anchors
  • Screw Anchors
  • Expansion and Wedge Anchors
  • Cast-In Anchor Channels and Studs
  • Powder-Actuated and Direct Fastening

By End-Use Industry

  • Commercial and Institutional Building
  • Industrial and Advanced Manufacturing
  • Transport and Civil Infrastructure
  • Residential and Light Commercial
  • Renovation Retrofit and Strengthening

By Distribution Channel

  • Construction Supply Distribution
  • Direct Sale to Contractor
  • Specialty Fastener Distribution
  • Home Improvement and Retail

By Region

  • North America
  • Latin America
  • Western Europe
  • East Asia
  • South Asia and Pacific
  • Middle East and Africa
  • Eastern Europe

Scope, Methodology, and Coverage

Every figure in this report is reproducible from documented input assumptions. The scope below maps the historical period, the forecast horizon, the segmentation dimensions, and the countries covered, alongside the underlying primary and qualitative methodology.
Historical Period
2020 to 2025
Forecast Period
2026 to 2036
Base Year
2025 (USD billions; MMA Primary Research Dataset, August 2026)
Market Definition
The United States construction anchor market comprises the manufacture and sale of products transferring load into concrete, masonry, and related base materials, valued at manufacturer selling prices to construction supply distributors, specialty fastener distributors, contractors, and retail channels. It spans post-installed adhesive and chemical anchors in epoxy, vinylester, and hybrid chemistries with their dispensing cartridges and mixing nozzles, screw anchors, expansion, wedge, sleeve and drop-in anchors, cast-in anchor channels, headed studs and embed plates, post-installed reinforcing bar connection systems, and powder-actuated and gas-actuated direct fastening consumables, together with the evaluation report qualification and design software supporting their specified use. Demand is United States, and export supply from American manufacturing into adjacent markets is included. General threaded fasteners, screws and nails not used for concrete anchorage, high-strength steel-to-steel bolting assemblies, geotechnical rock, soil, and tieback ground anchors, reinforcing bar and mesh, adhesives and sealants not used for anchorage, and standalone drilling and setting tools sold as equipment are excluded. Anchor installation, testing, and inspection services sold independently sit outside scope.
Quantitative Units
USD billions (current prices); volume in billions of anchor units shipped
Segmentation Dimensions
By Anchoring Mechanism; By End-Use Industry; By Distribution Channel; By Region
Regions Covered
North America, Latin America, Western Europe, East Asia, South Asia and Pacific, Middle East and Africa, Eastern Europe
Countries Covered
USA across all census regions, Canada, Mexico, Costa Rica, Panama, Dominican Republic, Germany, United Kingdom, Ireland, Netherlands, Japan, South Korea, Taiwan, Singapore, Australia, Saudi Arabia, United Arab Emirates, Qatar, Poland, Czechia, Hungary, and additional markets relevant to this sector
Key Companies Profiled
Hilti, Simpson Strong-Tie, Stanley Black and Decker, Illinois Tool Works, fischer Group, Würth Group, MKT Fastening, Rawlplug, Leviat, Sika, MAPEI, Master Builders Solutions, Adhesives Technology Corporation, Wej-It Anchor Products, Triangle Fastener Corporation, Concrete Fastening Systems, Elco Construction Products, Confast, Bosch, Grabber Construction Products
Quantitative Methodology
Primary survey, n=3,800 respondents, Q4 2025, six countries; demand-side model with trade association cross-validation
Qualitative Methodology
47 expert interviews, Q4 2025; applied to validate demand model assumptions, identify emerging dynamics, and assess competitive positioning
Report Format
PDF and XLSX data workbook (Word format preview document)
Publisher
Market Minds Advisory
Report Code
MMA-2026-CON-512
Published
August 2026
Contact
sales@marketmindsadvisory.com | www.marketmindsadvisory.com

Purchase the full United States Construction Anchor Market Report (2026 to 2036).

The full MMA United States Construction Anchor report sizes the market across five anchoring mechanisms, five end-use segments, four distribution channels, and seven regions through 2036. It profiles 20 participants on a consistent basis of concrete anchoring product revenue, scoring each on evaluation report coverage, seismic qualification breadth, installation tolerance, and distributor position. Scenario models quantify how advanced manufacturing construction, infrastructure funding, and commercial building cycles move both volume and achievable margin. The report also includes evaluation report coverage mapping by manufacturer and substrate, seismic category demand analysis by region, installation failure mode assessment, and specification-to-purchase substitution tracking.
Five-mechanism and four-channel market sizing to 2036
Twenty-participant benchmark on concrete anchoring revenue
Evaluation report coverage mapping by manufacturer and substrate
Seismic category demand analysis by region and building type
Installation failure mode assessment across anchor mechanisms
Specification to purchase substitution tracking through distribution

Built For The People Who Decide

From boardroom strategy to bench-side execution, this report is read cover-to-cover by leaders shaping the next decade of their industry, turning demand scenarios, market dynamics and valuation benchmarks into decisions.
CXOs/ Presidents/ VPs/ Managers
M&A and Corporate Development
Strategy Teams and R&D Heads
Procurement and Product Directors
Regulatory and Compliance Leaders
Investor Relations and Equity Analysts