Market Minds Advisory
Construction 4.0 Market

Construction 4.0 Market: Construction 4.0: Contractual Barriers, Split Incentives and the Technologies That Work Anyway

Construction productivity has been flat for decades for contractual rather than technical reasons, and the technologies that actually succeed are the ones requiring nobody else on the project to cooperate.

Lead Analyst

Published

September 2026

Make Smarter Decisions with Customized Research Insights

Request a free sample report and evaluate market opportunities, growth trends, and competitive dynamics relevant to your business needs.

2025 MARKET VALUE$18.4BMarket Size 2025
2036 FORECAST VALUE$65.2BBase Case , 2026 to 2036
CAGR 2026 TO 203612.2 %Bull 13.4% / Bear 11.0%
INCREMENTAL OPPORTUNITY$44.6BNet 10- year value creation
EXPANSION MULTIPLE3.16x2036 value over 2026 base
Strategic Levers
M&A Pipeline
Regional Outlook
Country Rankings
Competitive Intelligence
Segmental Deep-dive
Call-Us : 91 93563 13602

Executive Snapshot and Market Trajectory.

Around 72% of project value is delivered by parties the main contractor does not employ, on margins near 2.8%, under contracts that penalise sharing information early. That structure, not any shortage of technology, is why construction productivity has barely moved. Nothing about that is a technology question.
The technologies that succeed are the ones requiring nobody else to cooperate. Reality capture for progress verification grows at 18.3%, half again the market rate of 12.2%, because a contractor can deploy it alone and use the output in a payment application. Machine control has reached 61% of earthmoving fleets without anyone calling it transformation. East Asia takes 33% on labour shortage and mandated practice. Nobody calls that transformation. Two decades of it.
Concentration is extremely low at roughly 19% across the top five on measured software, equipment and services revenue, which reflects a market with no agreed boundary and a customer base of thousands of firms. Only about 23% of pilots become standard practice, and the failures are contractual far more often than they are technical. Vendors keep prescribing training for what is plainly a contract problem. Failures are commercial.
Market Definition
This market covers digital and automation technologies applied to construction delivery, spanning building information modelling and design coordination, reality capture and progress verification, machine control and automated equipment, offsite manufacturing and modular systems, connected assets and site sensing, and project data and common data environments. Revenue is measured as software subscription, technology-attributable equipment value and services at supplier level. Conventional construction equipment without digital control, materials, architectural and engineering design services, and property development activity are excluded.
Base Year Value
$18.4B in 2025 (MMA Primary Research Dataset, September 2026)
Forecast Period
2026 to 2036, eleven discrete annual values
CAGR
12.2% base case. Bull 13.4%. Bear 11.0%.
Fastest Growth Segment
Reality Capture and Progress Verification: 18.3% CAGR
Fastest Growth Country
Saudi Arabia: 17.8% CAGR
Fastest Growth Region
South Asia and Pacific: 14.2% CAGR
Largest Region
East Asia: 33% of 2025 global value
Market Leaders
Autodesk, Trimble, Procore, Hexagon and Bentley Systems lead on measured construction technology software, equipment and services revenue. Source: MMA Primary Research Dataset, July 2026.
Primary Survey
n=3,800 procurement and R&D decision-makers, Q4 2025, six countries
Methodology
Demand-side build-up, cross-validated against public data, 47 expert interviews

Construction 4.0 Market Forecast Scenarios

construction-40-market-size-forecast-scenario-1788423712351
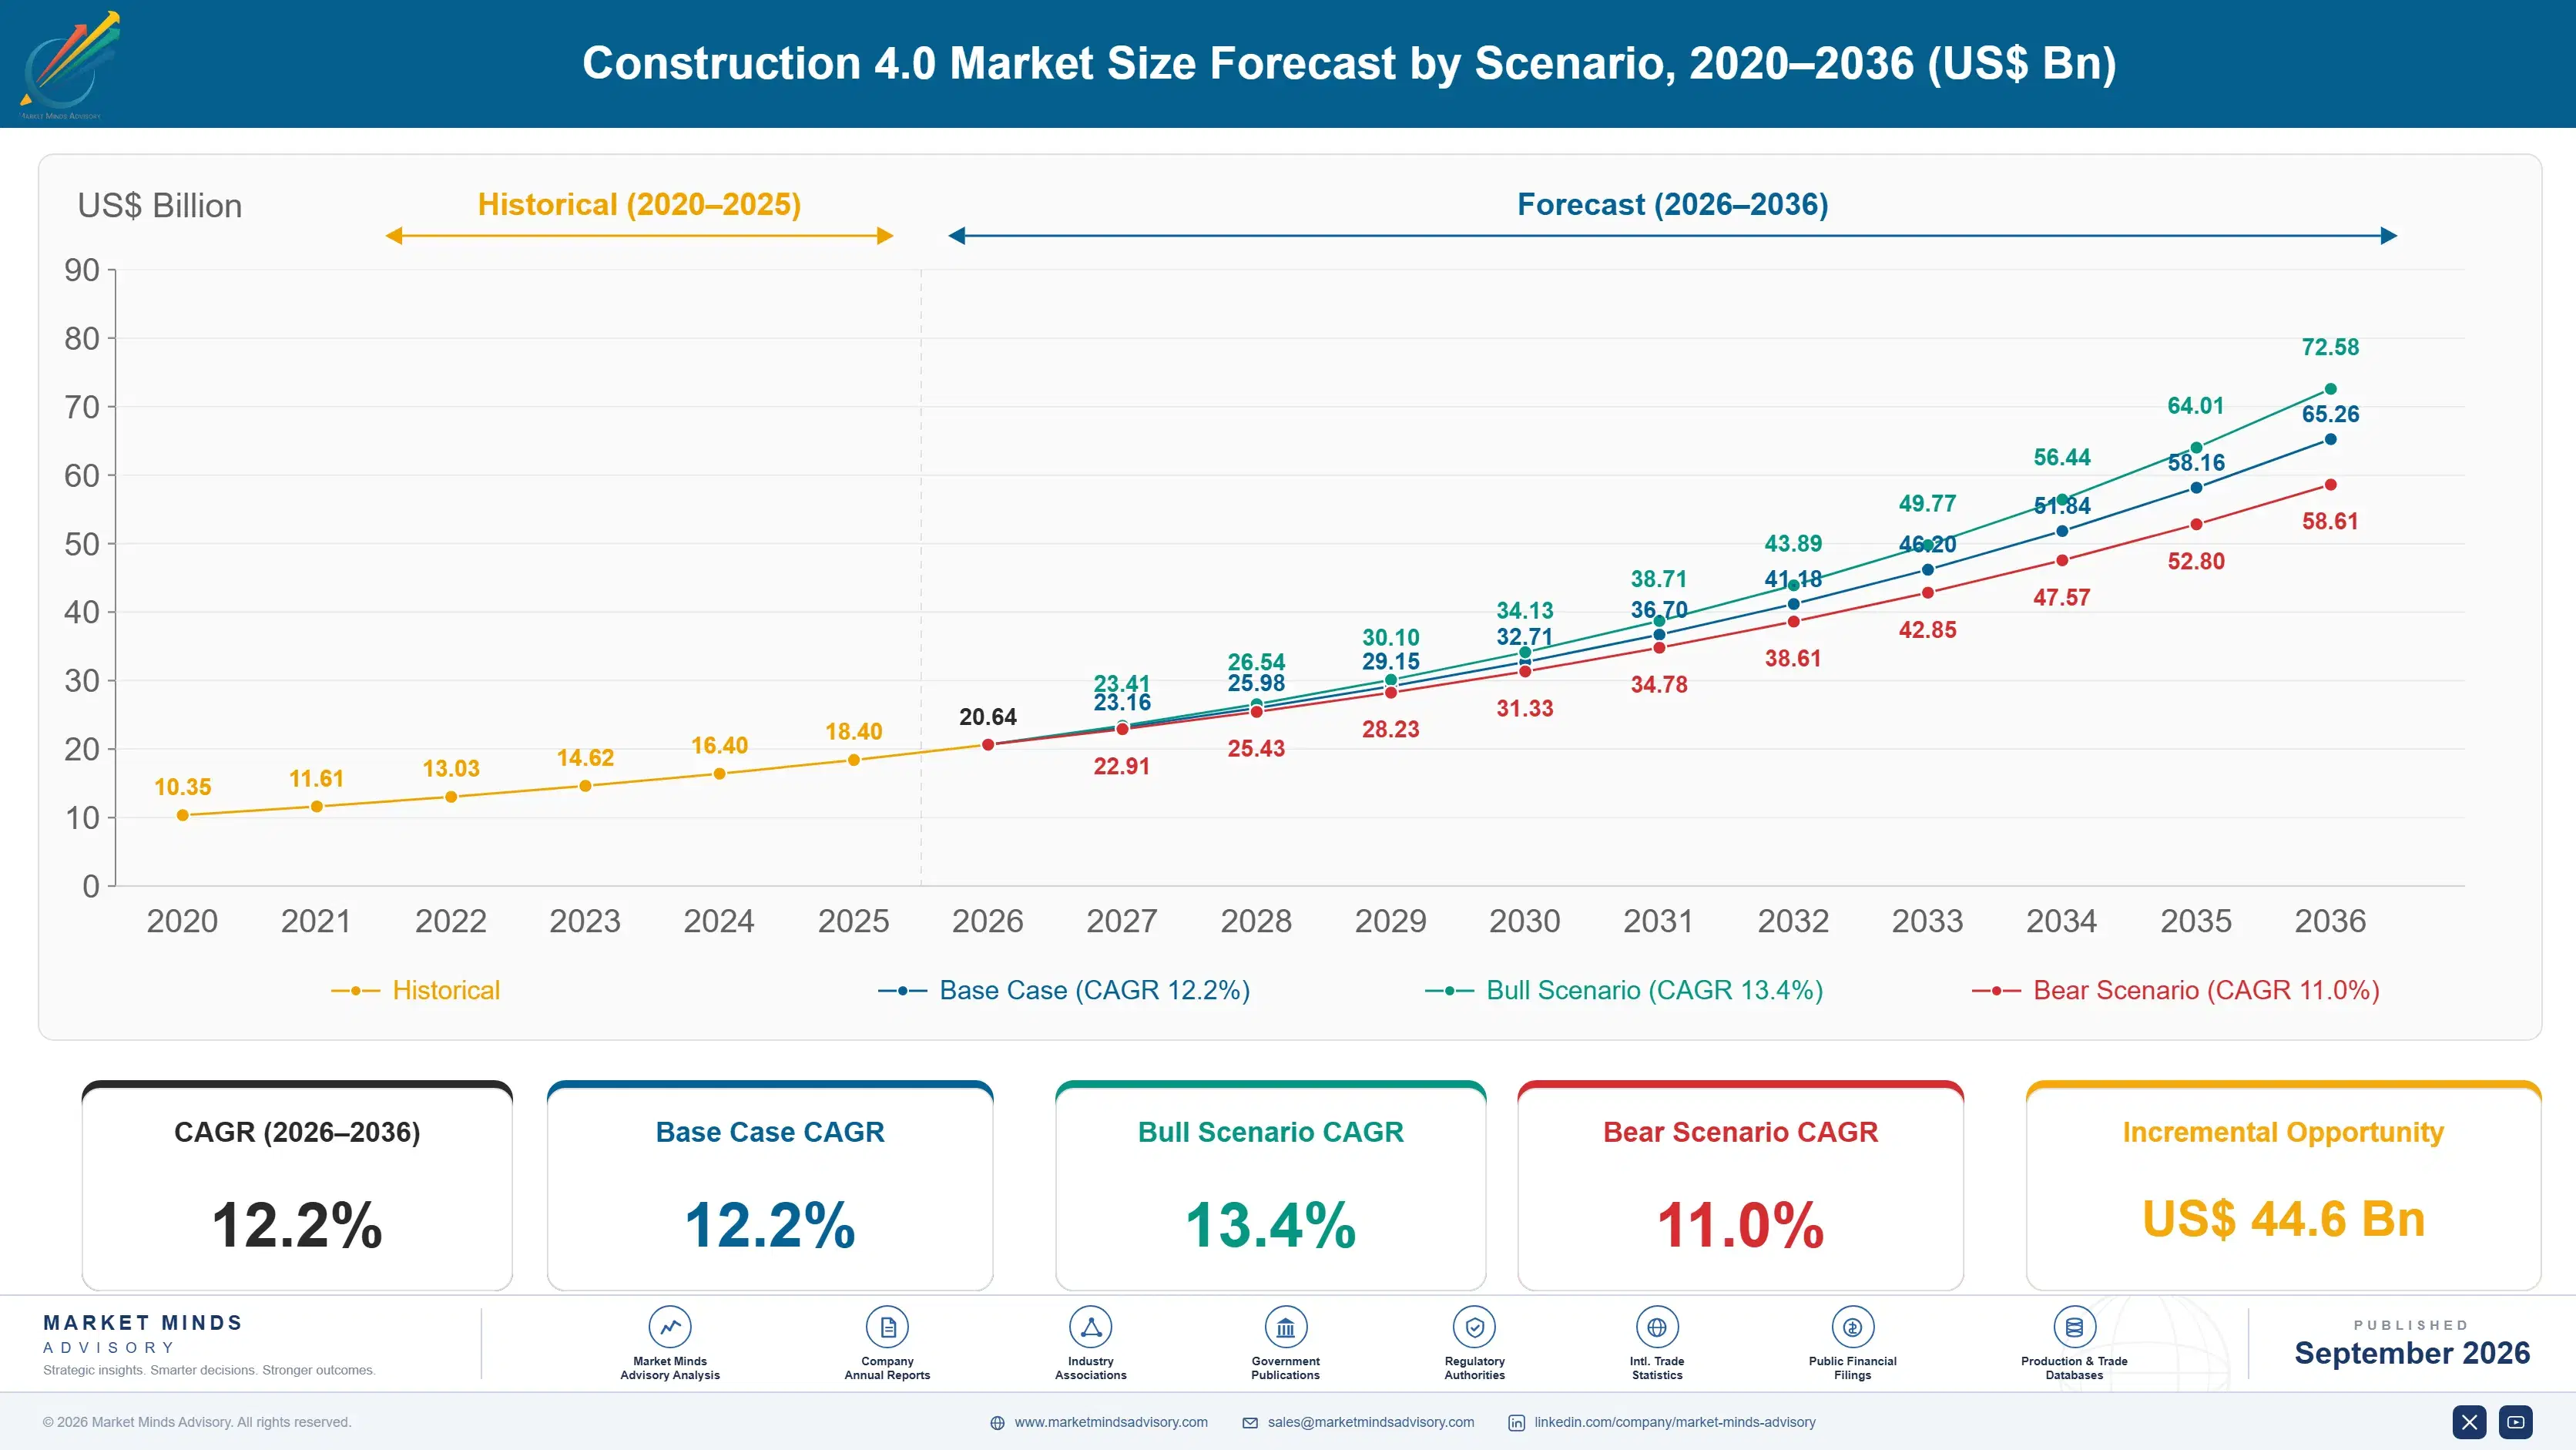
Growth ran at 11.2% from 2020 to 2025 and it was concentrated in a narrower set of applications than the category name implies. Site access restrictions pushed reality capture and remote progress review into contractors who had resisted both, and it held because it proved useful for payment applications. Coordination technologies requiring supply chain participation grew far more slowly.
The base case at 12.2% rests on three mechanisms rather than on any change in how construction is contracted. Reality capture produces evidence a contractor uses in its own commercial position, which is why it is adopted without anybody else agreeing. Skilled labour shortages across Japan, Korea, Germany and North America make automation an availability question rather than a cost one. Third, large owners on megaprojects are mandating digital delivery, which imposes the collaboration that contracts otherwise discourage.
The bull case at 13.4% assumes collaborative contracting spreads beyond the megaproject clients currently mandating it, which would remove the barrier holding this category back for two decades. The bear case at 11.0% is that contractor margins near 2.8% keep discretionary technology investment suppressed and adoption stays confined to what an individual firm can deploy alone. The second describes current conditions accurately.

The Barrier Was Never the Technology

Construction has absorbed forty years of technology and produced almost no measurable productivity improvement, which is usually blamed on conservatism. The more honest explanation is contractual. Around 72% of project value flows through subcontractors the main contractor does not employ, tendering rewards lowest price over best method, and risk allocation makes early disclosure a liability. Nobody is rewarded for collaborating.
TOP FIVE CONCENTRATION19%Extremely fragmented across software, equipment and specialist vendors
PILOT CONVERSION RATE23%Trials reaching standard practice across a contractor's projects
SUBCONTRACTED WORK SHARE72%Project value delivered by parties the contractor does not employ
MACHINE CONTROL ADOPTION61%Earthmoving fleets running guidance systems as standard equipment
CONTRACTOR OPERATING MARGIN2.8%Typical margin available to fund any technology investment
MODEL DATA REUSE RATE14%Design information carried through into construction without rework
The technologies that have succeeded share a characteristic worth noticing: none of them requires anybody else to change. Reality capture is deployed by a contractor, produces evidence that contractor uses in payment applications and disputes, and needs no agreement from designers or subcontractors. Machine control sits on the contractor's own excavator and has reached 61% of earthmoving fleets over two decades without being called a transformation.
What consistently fails is anything requiring the supply chain to work from shared information. Only about 14% of design model data survives into construction without rework, because the parties who would benefit from reusing it are not the parties who created it and have no contractual reason to trust it. Pilot conversion at 23% reflects that directly, and the failures are almost never technical.
"Every failed construction technology programme I have reviewed died at the point where somebody would have had to share information that protected their claim position. Until the contract changes, the software cannot, and no amount of user training addresses that."
Director, Construction Technology and Project Delivery Practice · MMA Construction and Industrial Equipment Practice · September 2026

Market Trends

Single-Party Technologies Succeed Where Collaborative Ones Fail

A clear pattern separates what gets adopted from what gets piloted. Reality capture, machine control and site sensing can be deployed by one firm, produce value that firm captures directly, and require no agreement from anybody else on the project. Coordination platforms, shared models and common data environments require the supply chain to participate, which contracts actively discourage. Pilot conversion runs near 23% overall and considerably higher for single-party tools. Vendors positioning collaborative capability as the headline consistently sell the part that fails and give away the part that works.
Market Impact: Fastest segment at 18.3% growth
Owners Rather Than Contractors Impose Digital Delivery

The party that benefits most from better project information is the asset owner, who receives a building they will operate for decades, and the party asked to produce it is a contractor on 2.8% margin with no claim on that value. Where digital delivery has genuinely taken hold, an owner has mandated it as a condition of the contract and paid for it explicitly. Public infrastructure clients in several countries have done exactly that. Where owners have merely encouraged it, contractors have complied to the letter of the specification and no further.
Market Impact: Reaches 61% of earthmoving fleets

Market Opportunities and Growth Drivers

Progress Evidence Serves the Contractor's Own Commercial Position

Reality capture produces a dated record of what was built, which a contractor uses to support payment applications, defend against delay claims and settle variations without argument. That value accrues to the firm deploying it rather than being shared across a project, which is why adoption required no contractual change and grew at 18.3%. It is being bought by commercial and quantity surveying teams rather than by digital or innovation functions, and the business case is measured in disputes avoided rather than in productivity gained. Innovation teams were never really involved in it.
Market Impact: Only 14% of data survives

Skilled Labour Shortage Makes Automation an Availability Question

Construction workforces are ageing faster than they are being replaced across Japan, Korea, Germany and North America, and in several trades the constraint is finding anybody rather than affording them. That reframes automation from a cost saving into a capacity question, which is a far easier argument on a low margin project. Japanese contractors have deployed automated equipment furthest for exactly this reason, and machine control has reached 61% of earthmoving fleets. Automation adopted this way tends to persist, because the shortage does not resolve. Shortages do not resolve, so adoption persists.
Market Impact: Margins sit near 2.8%

Market Restraints and Challenges

Contract Structure Penalises Sharing Project Information

Competitive tendering, fixed price risk transfer and claim-based dispute resolution together make early disclosure of information a commercial disadvantage, since what a contractor knows about a problem shapes what it can recover later. The root cause is the allocation of risk rather than any attitude toward technology. Commercially this caps every application requiring supply chain participation, and only about 14% of design data survives into construction without rework. Mitigation comes through collaborative contract forms and owner mandates rather than through anything a software vendor can build. Software cannot repair a risk allocation problem.
Market Impact: Conversion stalls near 23% overall

Margins Near Three Percent Leave Nothing Discretionary

Contractor operating margins around 2.8% mean any technology investment competes directly against the profit on a project, and a programme that pays back over three projects is difficult to approve when the next tender is priced without it. The root cause is a tendering model that awards work on price and therefore prices out method investment. Commercially this favours tools with immediate project-level returns over capability building. Suppliers mitigate by pricing per project rather than per enterprise, and by targeting commercial rather than innovation budgets. Immediate project returns beat capability programmes every time.
Market Impact: Margins leave only 2.8% available
3 additional market trends, 4 additional growth drivers, and 2 additional restraints and challenges are covered in the full report. Contact sales@marketmindsadvisory.com to access the complete intelligence.

Segment CAGR and Growth Architecture

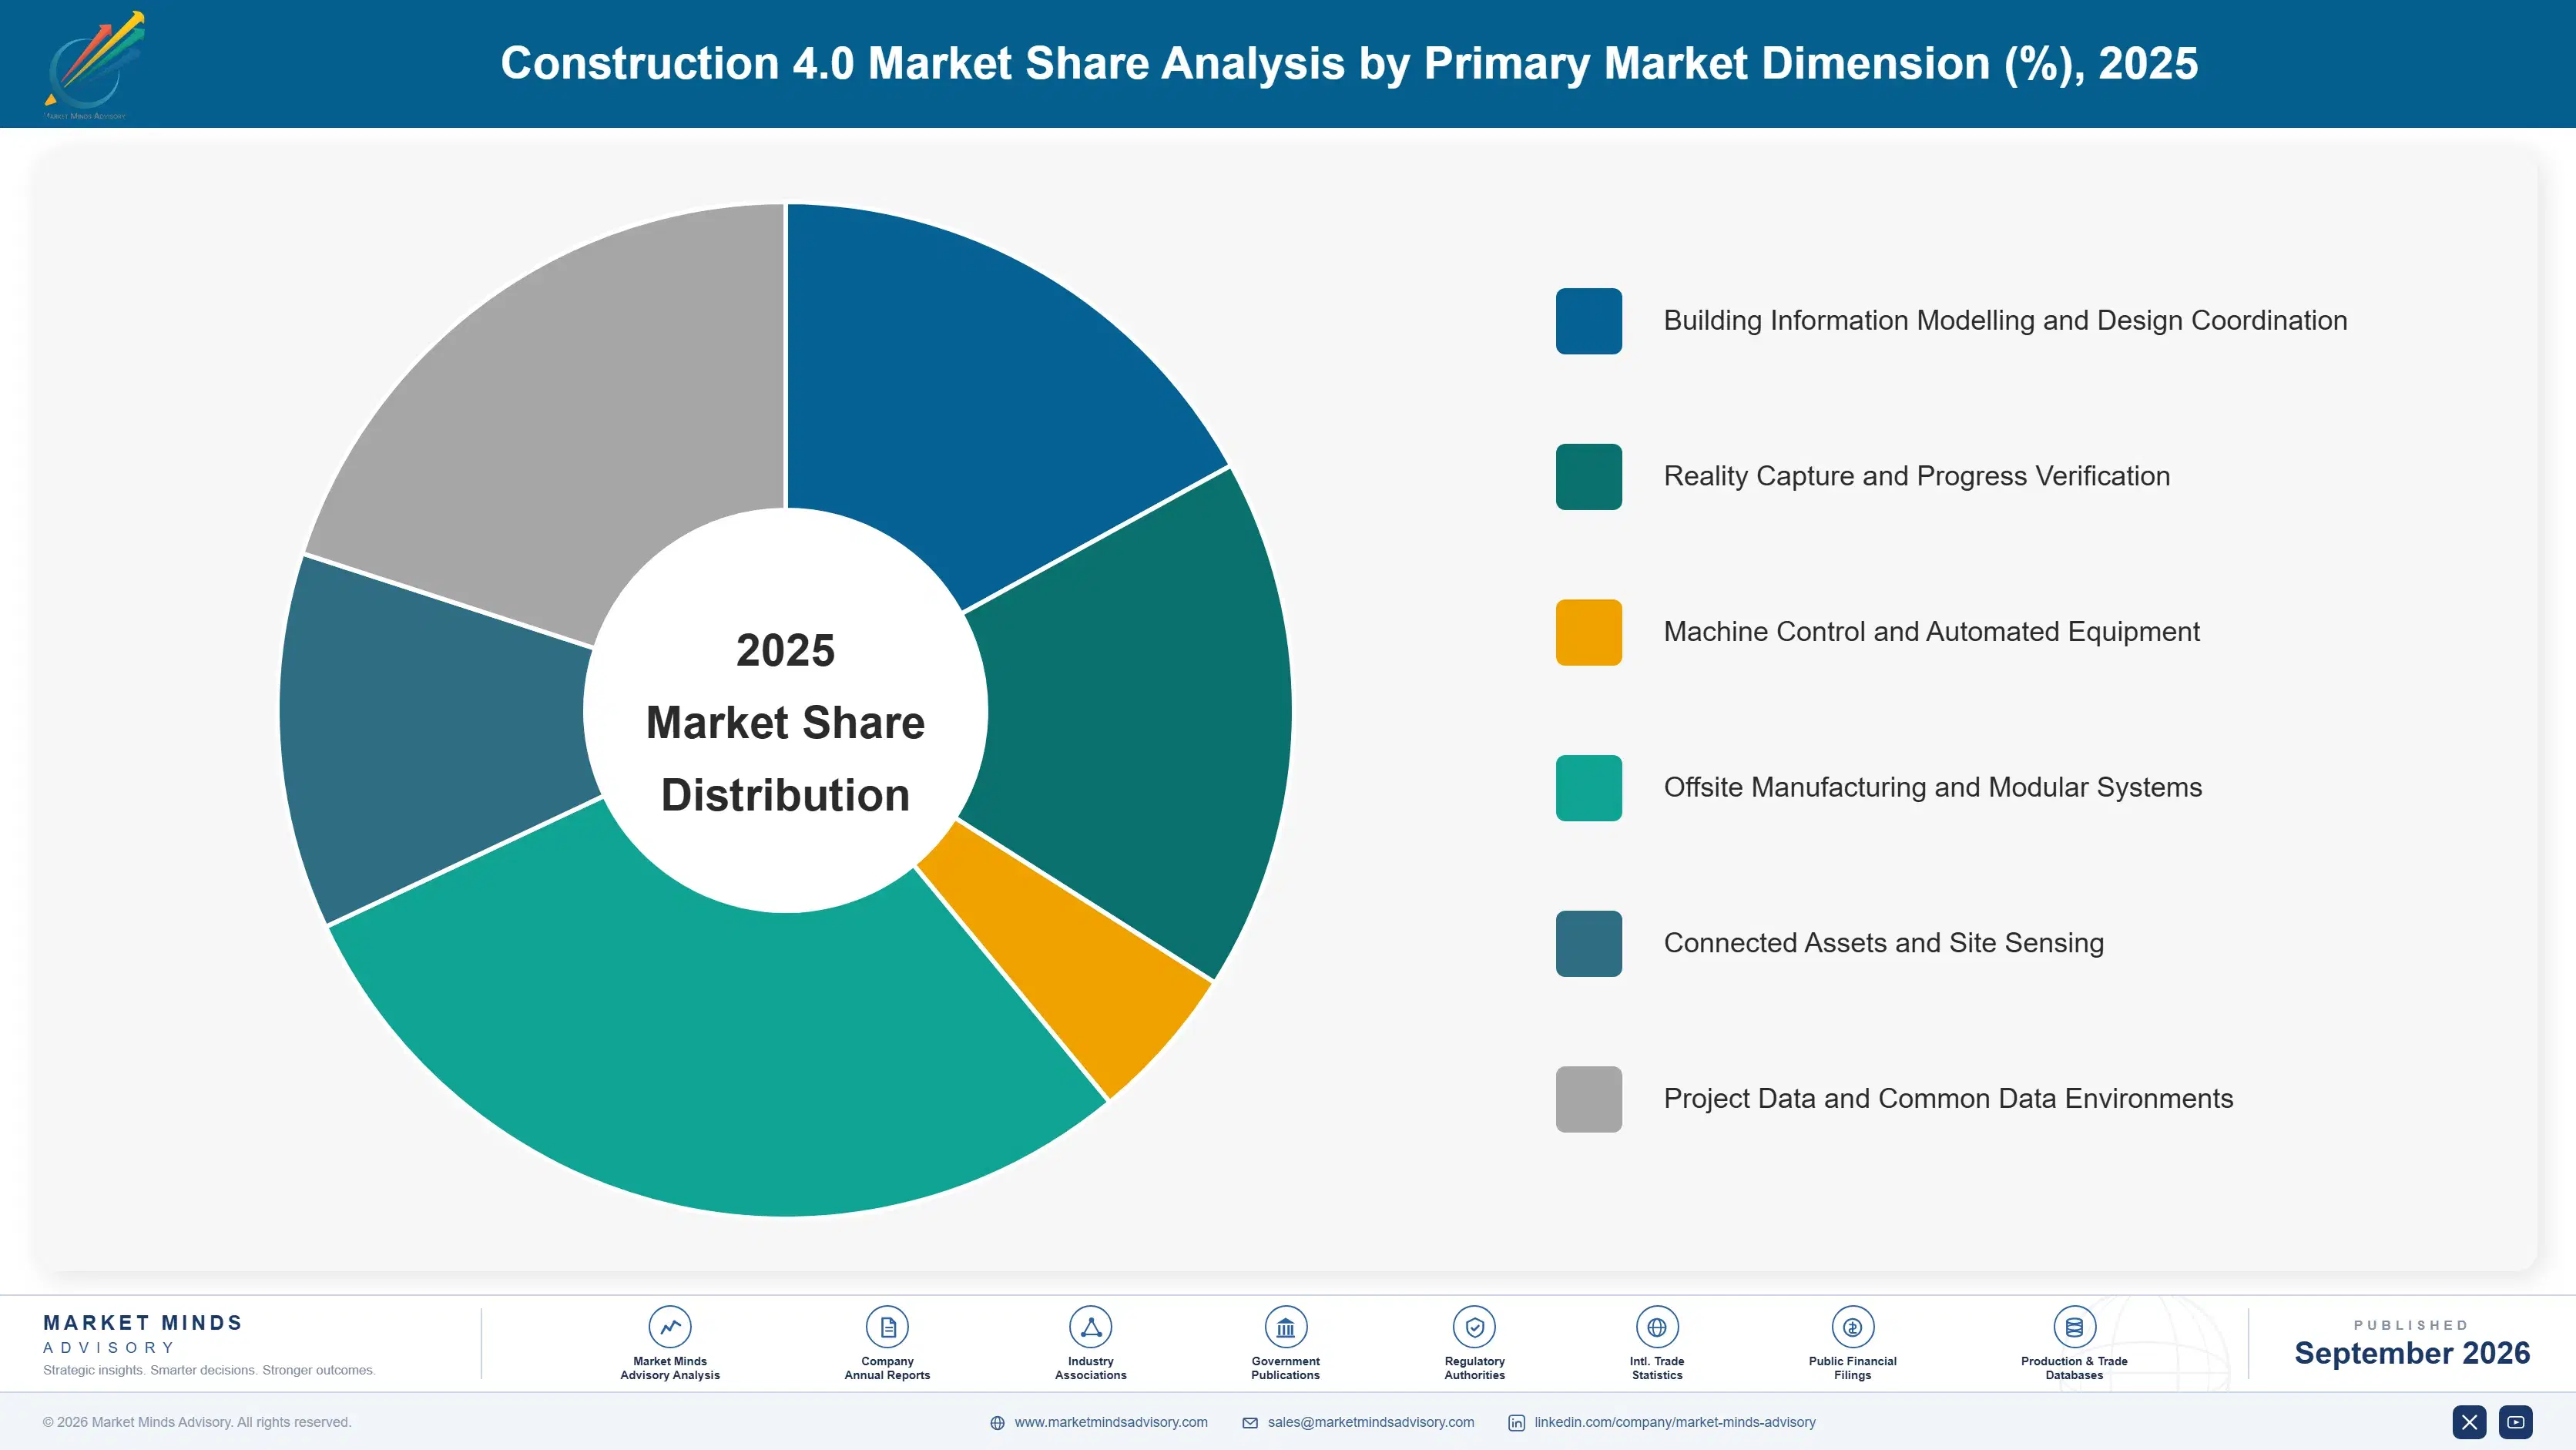
Segmentation follows the technology application, because what matters commercially is whether a contractor can deploy something alone or needs the supply chain to agree first. That single distinction predicts adoption far better than capability, cost or sophistication, and it produces growth differences of more than eight points between otherwise comparable technologies. Deployability predicts everything.
construction-40-market-market-share-analysis-1788423712954

Reality Capture and Progress Verification

Reality capture is the fastest part of this market at 18.3%, half again the market rate of 12.2%, and it succeeds for a commercial reason rather than a technical one. Photographic, laser and video records of site progress produce dated evidence a contractor uses in payment applications, delay defences and variation settlements, and the value accrues entirely to the firm that deployed it. No designer, subcontractor or owner has to agree to anything. The buyer is increasingly a commercial or quantity surveying function rather than a digital team, and the business case is measured in disputes avoided rather than in any productivity claim. Disputes avoided is the metric that matters.
CAGR 18.3%

Connected Assets and Site Sensing

Asset tracking, equipment telematics, environmental sensing and material monitoring grow at 16.2% on the same single-party logic. A contractor equips its own plant, tools and materials, captures utilisation and location data it alone acts on, and reduces losses and idle time without needing anybody's cooperation. Equipment hire firms have driven much of the adoption because their assets move between sites they do not control. The returns are modest per asset and reliable, which suits a low margin business better than a large programme with a payback measured across several projects would. Hire firms drove much of the early adoption because their assets move between sites they do not control, which makes tracking a straightforward commercial argument.
CAGR 16.2%
Full segment breakdown across 6 segments available in the complete report.

Regional Architecture and Country Demand Map

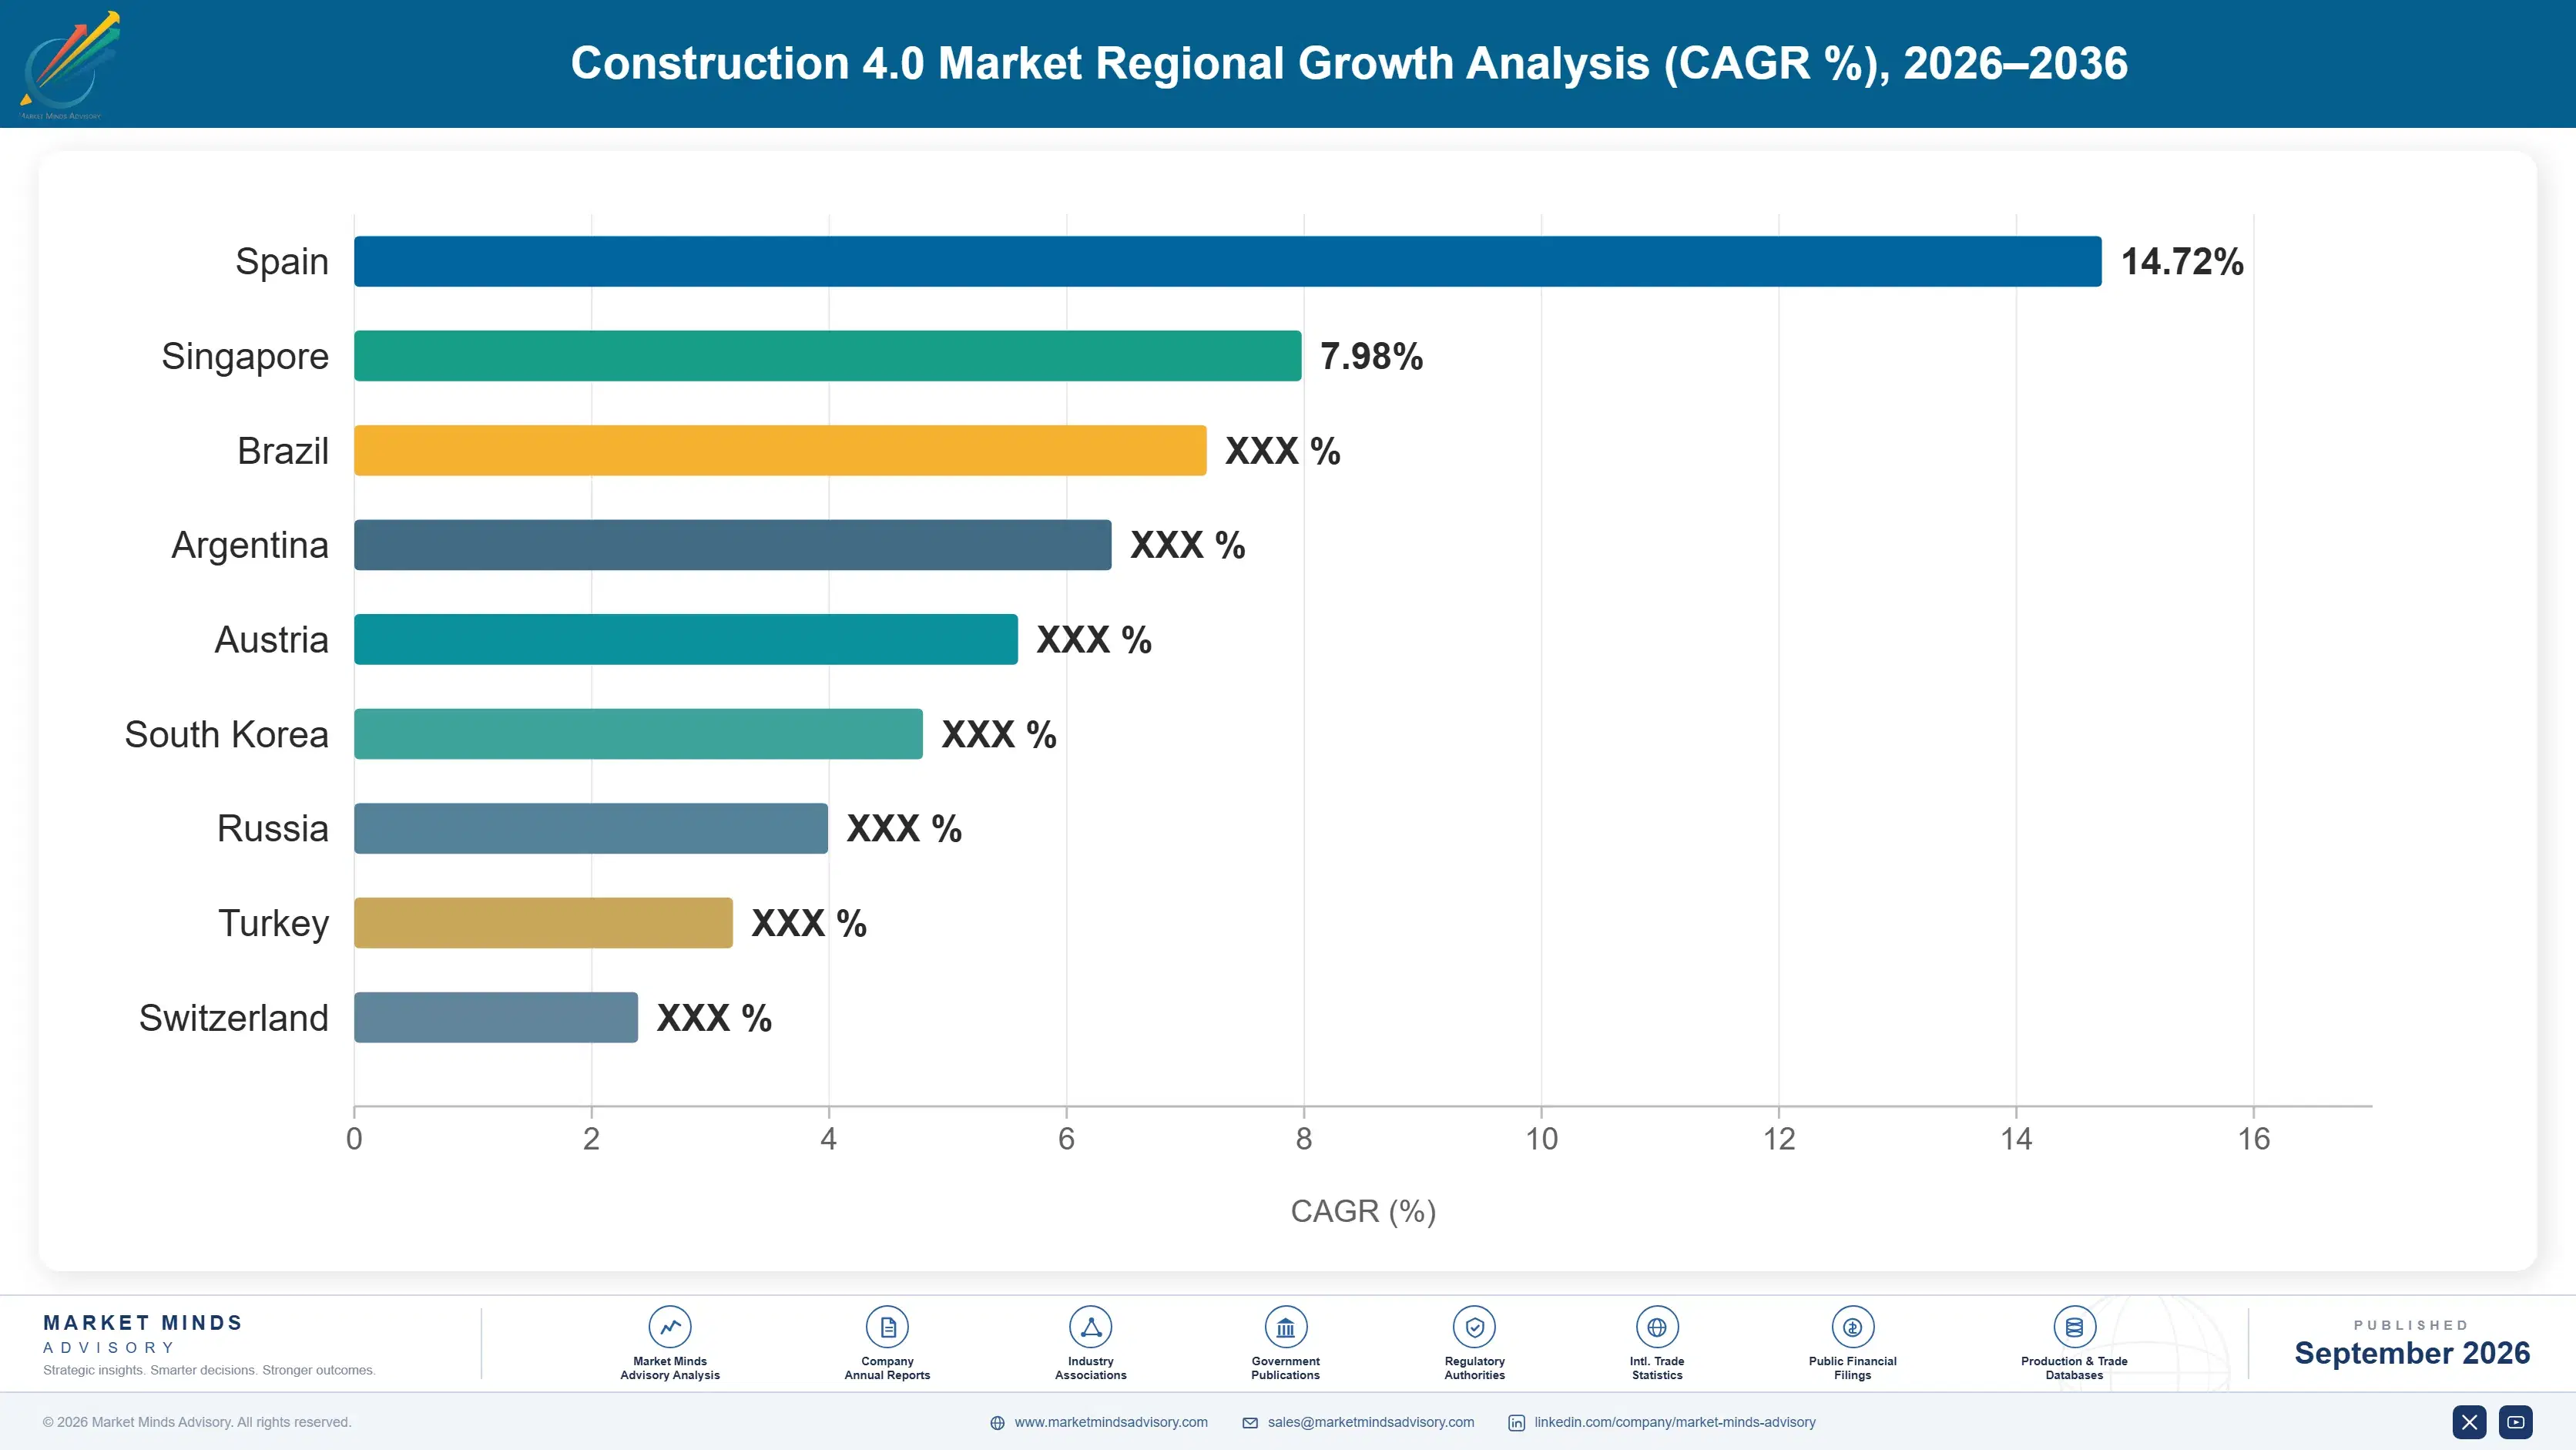
Adoption follows labour scarcity and client mandate rather than construction volume or wealth. Markets where contractors cannot find workers, or where owners specify digital delivery as a contract condition, adopt considerably faster than markets with cheap labour and price-led procurement. Cheap labour removes both arguments entirely.

East Asia

East Asia holds 33%, above the regional band, and the reason is workforce rather than enthusiasm. Japanese construction faces the most severe skilled labour shortage in the developed world, which has made automated equipment, robotic finishing and offsite manufacturing questions of whether work can be done at all rather than how cheaply. Korean contractors have adopted digital delivery under both client mandate and serious accident legislation. Chinese construction volume is enormous and increasingly incorporates prefabrication under national policy targets. Regional growth at 13.2% runs ahead of the market on demographics that will not reverse. Regional growth at 13.2% therefore rests on labour availability rather than on any digital delivery ambition.
Share: 33% | CAGR: 13.2% (2026 to 2036)

North America

American and Canadian adoption is led by reality capture and machine control, both of which a contractor deploys alone and uses commercially without anybody else agreeing. Litigation and claim intensity make dated progress evidence unusually valuable here, which is why that segment took hold faster than anywhere. Public infrastructure funding has attached digital delivery requirements to a growing share of federally supported work. Contractor margins are thin and technology competes directly against project profit, which favours tools with immediate returns over capability programmes that pay back across several jobs. Regional growth at 11.4% reflects single-party adoption rather than any collaborative transformation, and contract structures here are among the most adversarial anywhere.
Share: 25% | CAGR: 11.4% (2026 to 2036)
Regional intelligence for 5 additional markets available in the complete report: Western Europe, South Asia and Pacific, Middle East and Africa, Latin America, Eastern Europe. Contact sales@marketmindsadvisory.com.
construction-40-market-country-cagr-analysis-1788423713478

What Actually Sells in Construction

Anything requiring the supply chain to cooperate fails at a rate no product improvement addresses, because the contract discourages exactly the behaviour the technology assumes. What sells is what one firm can deploy alone, what an owner mandates and funds, and what a commercial team can put into a payment application. Training does not fix a contract.

Sell What One Firm Can Deploy Alone

Technologies requiring designers, subcontractors and owners to participate convert from pilot to standard practice at a fraction of the 23% overall rate, because contracts penalise the information sharing they assume. Single-party tools that a contractor deploys and benefits from directly convert at roughly 3 times that rate. Vendors leading with collaborative capability sell the part that fails and bundle the part that works, which is precisely backwards. Positioning the single-party benefit first and treating collaboration as an eventual option matches how these purchases actually get approved. Approval follows the single-party benefit.
Market Impact: Converts at 3 times the pilot conversion rate

Reach the Commercial Team Not the Innovation Function

Innovation and digital functions hold small discretionary budgets and no authority over project delivery, while commercial and quantity surveying teams control claim positions worth many times any technology spend. Reality capture sold as dispute evidence rather than as progress monitoring reaches that budget and closes considerably faster, at contract values around 4 times what innovation budgets support. It requires speaking about payment applications and variations rather than about productivity. Most vendors in this market are organised entirely around the wrong conversation. Payment applications are the language that works here. Vendors are organised around the wrong buyer.
Market Impact: Reaches commercial budgets around 4 times larger instead

Follow Owner Mandates Onto Major Programmes

Collaborative technology adoption happens reliably in exactly one circumstance, which is when a client makes it a contract condition and funds it. Giga-project and major infrastructure programmes do this, and Saudi Arabia grows at 17.8% almost entirely as a result. Suppliers positioned with those clients reach an entire supply chain through one relationship rather than selling to hundreds of contractors individually. The requirement travels downward because non-compliance means not working, which achieves what a decade of persuasion did not. Non-compliance means not working, which settles the question immediately. Nothing else in this industry does.
Market Impact: Drives 17.8% growth in a single market alone

Price Per Project Rather Than Per Enterprise

Contractor margins near 2.8% make enterprise technology commitments extremely difficult to approve, since the cost lands in overhead while the benefit lands on projects priced without it. Per-project pricing charged into the job budget removes that obstacle entirely and matches how construction firms actually think about cost. Suppliers pricing this way report adoption across roughly 2 times as many projects within the same account. It complicates revenue recognition and forecasting, which is why most software vendors resist a structure their customers plainly prefer. Customers plainly prefer the structure suppliers resist.
Market Impact: Reaches 2 times as many projects per account

Who Controls the Margin Pool

Concentration is extremely low at roughly 19% across the top five on measured software, equipment and services revenue, which reflects a category with no agreed boundary and a customer base of many thousands of firms. Design software vendors, equipment makers, capture specialists and project platforms share a market definition while competing with almost none of each other. The gap between leaders and challengers is one of installed presence rather than capability.
Competition runs on three dimensions. Deployability by a single firm is first, because it determines whether a pilot survives contact with a project. Second is access to the commercial rather than the innovation budget, which is where the money that matters actually sits. Third is presence on owner-mandated programmes, since one client specification reaches an entire supply chain at once.

Two pressures are reshaping positions. Equipment manufacturers are building machine control and telematics into the machines themselves rather than selling them as add-ons, which absorbs a segment specialist vendors created. Meanwhile owner mandates on megaprojects are concentrating collaborative technology decisions with a small number of very large clients. Rankings will move toward suppliers with single-party value propositions and megaproject client relationships rather than the broadest platform coverage.
construction-40-market-company-positioning-matrix-1788423714012

Competitive Moat and Risk Dimensions

TRIMBLE

Moat: Machine control installed position

Trimble holds a deep position in machine control and site positioning, which is the one construction technology adopted at scale because a contractor deploys it alone on its own equipment. Reaching 61% of earthmoving fleets took two decades and produced dealer relationships software vendors cannot replicate. Its hardware, positioning and field software combination spans work competitors address partially.
TRIMBLE

Risk: Equipment maker integration threat

Machine manufacturers are increasingly building guidance and telematics into equipment at the factory rather than leaving it as an aftermarket fit, which reaches the contractor through a channel the company does not control. That absorbs the segment it created. Its project delivery software faces stronger competition without the deployment advantage machine control enjoys.
PROCORE

Moat: Project delivery workflow adoption

Procore reached genuine scale in construction project management by concentrating on workflows a contractor runs internally rather than on collaboration requiring supply chain agreement. That single-party framing produced adoption where coordination platforms stalled. Network effects grow as subcontractors encounter the platform through main contractors, lowering acquisition cost in an otherwise prohibitive market.
PROCORE

Risk: Thin contractor budget exposure

Revenue depends on contractors with operating margins near 2.8% who treat enterprise software as overhead competing directly against project profit. Renewals face scrutiny whenever a firm's workload softens. Expanding beyond project management into areas requiring supply chain participation runs into the same contractual barriers that have defeated every collaborative technology in this industry for two decades.

Players Tracked

Prominent Players

Autodesk
Trimble
Procore
Hexagon
Bentley Systems

Other Key Players

Nemetschek
Topcon Positioning Systems
Caterpillar
Komatsu
Oracle
Dassault Systemes
OpenSpace
Buildots
Doxel
Built Robotics
Hilti
Volvo Construction Equipment
Liebherr
PlanRadar
Kojo

Recent Developments

MAY 2025

Equipment manufacturers extend factory-fitted machine control across model ranges

Major earthmoving equipment makers expanded factory-installed guidance and telematics across additional machine classes rather than leaving them to aftermarket suppliers. The systems were developed internally and shipped as standard fitment on new machines rather than as optional equipment packages. Aftermarket suppliers were not consulted about the change.
Signal: Machine control is becoming a machine feature rather than a technology purchase, which removes an entire specialist segment.
SEPTEMBER 2025

Giga-project clients extend digital delivery mandates through supply chains

Major programme owners in the Gulf extended digital delivery and data handover requirements to subcontractors rather than applying them only to main contractors. Compliance was funded within package pricing rather than left for contractors to absorb from existing project margins. Data handover formats were specified precisely.
Signal: Owner mandate with funding attached is the only mechanism that has ever produced collaborative adoption at scale.
JANUARY 2025

Reality capture adoption shifts to commercial and quantity surveying teams

Contractors increasingly procured site capture services and platforms through commercial functions rather than digital or innovation teams, using the output primarily in payment applications and delay claims. Budgets came from project commercial allowances rather than from technology spending. Digital teams were frequently unaware of the purchases.
Signal: The buyer changed and the value proposition followed it, which is why this segment grew while others stalled.

What Construction Technology Costs to Deliver

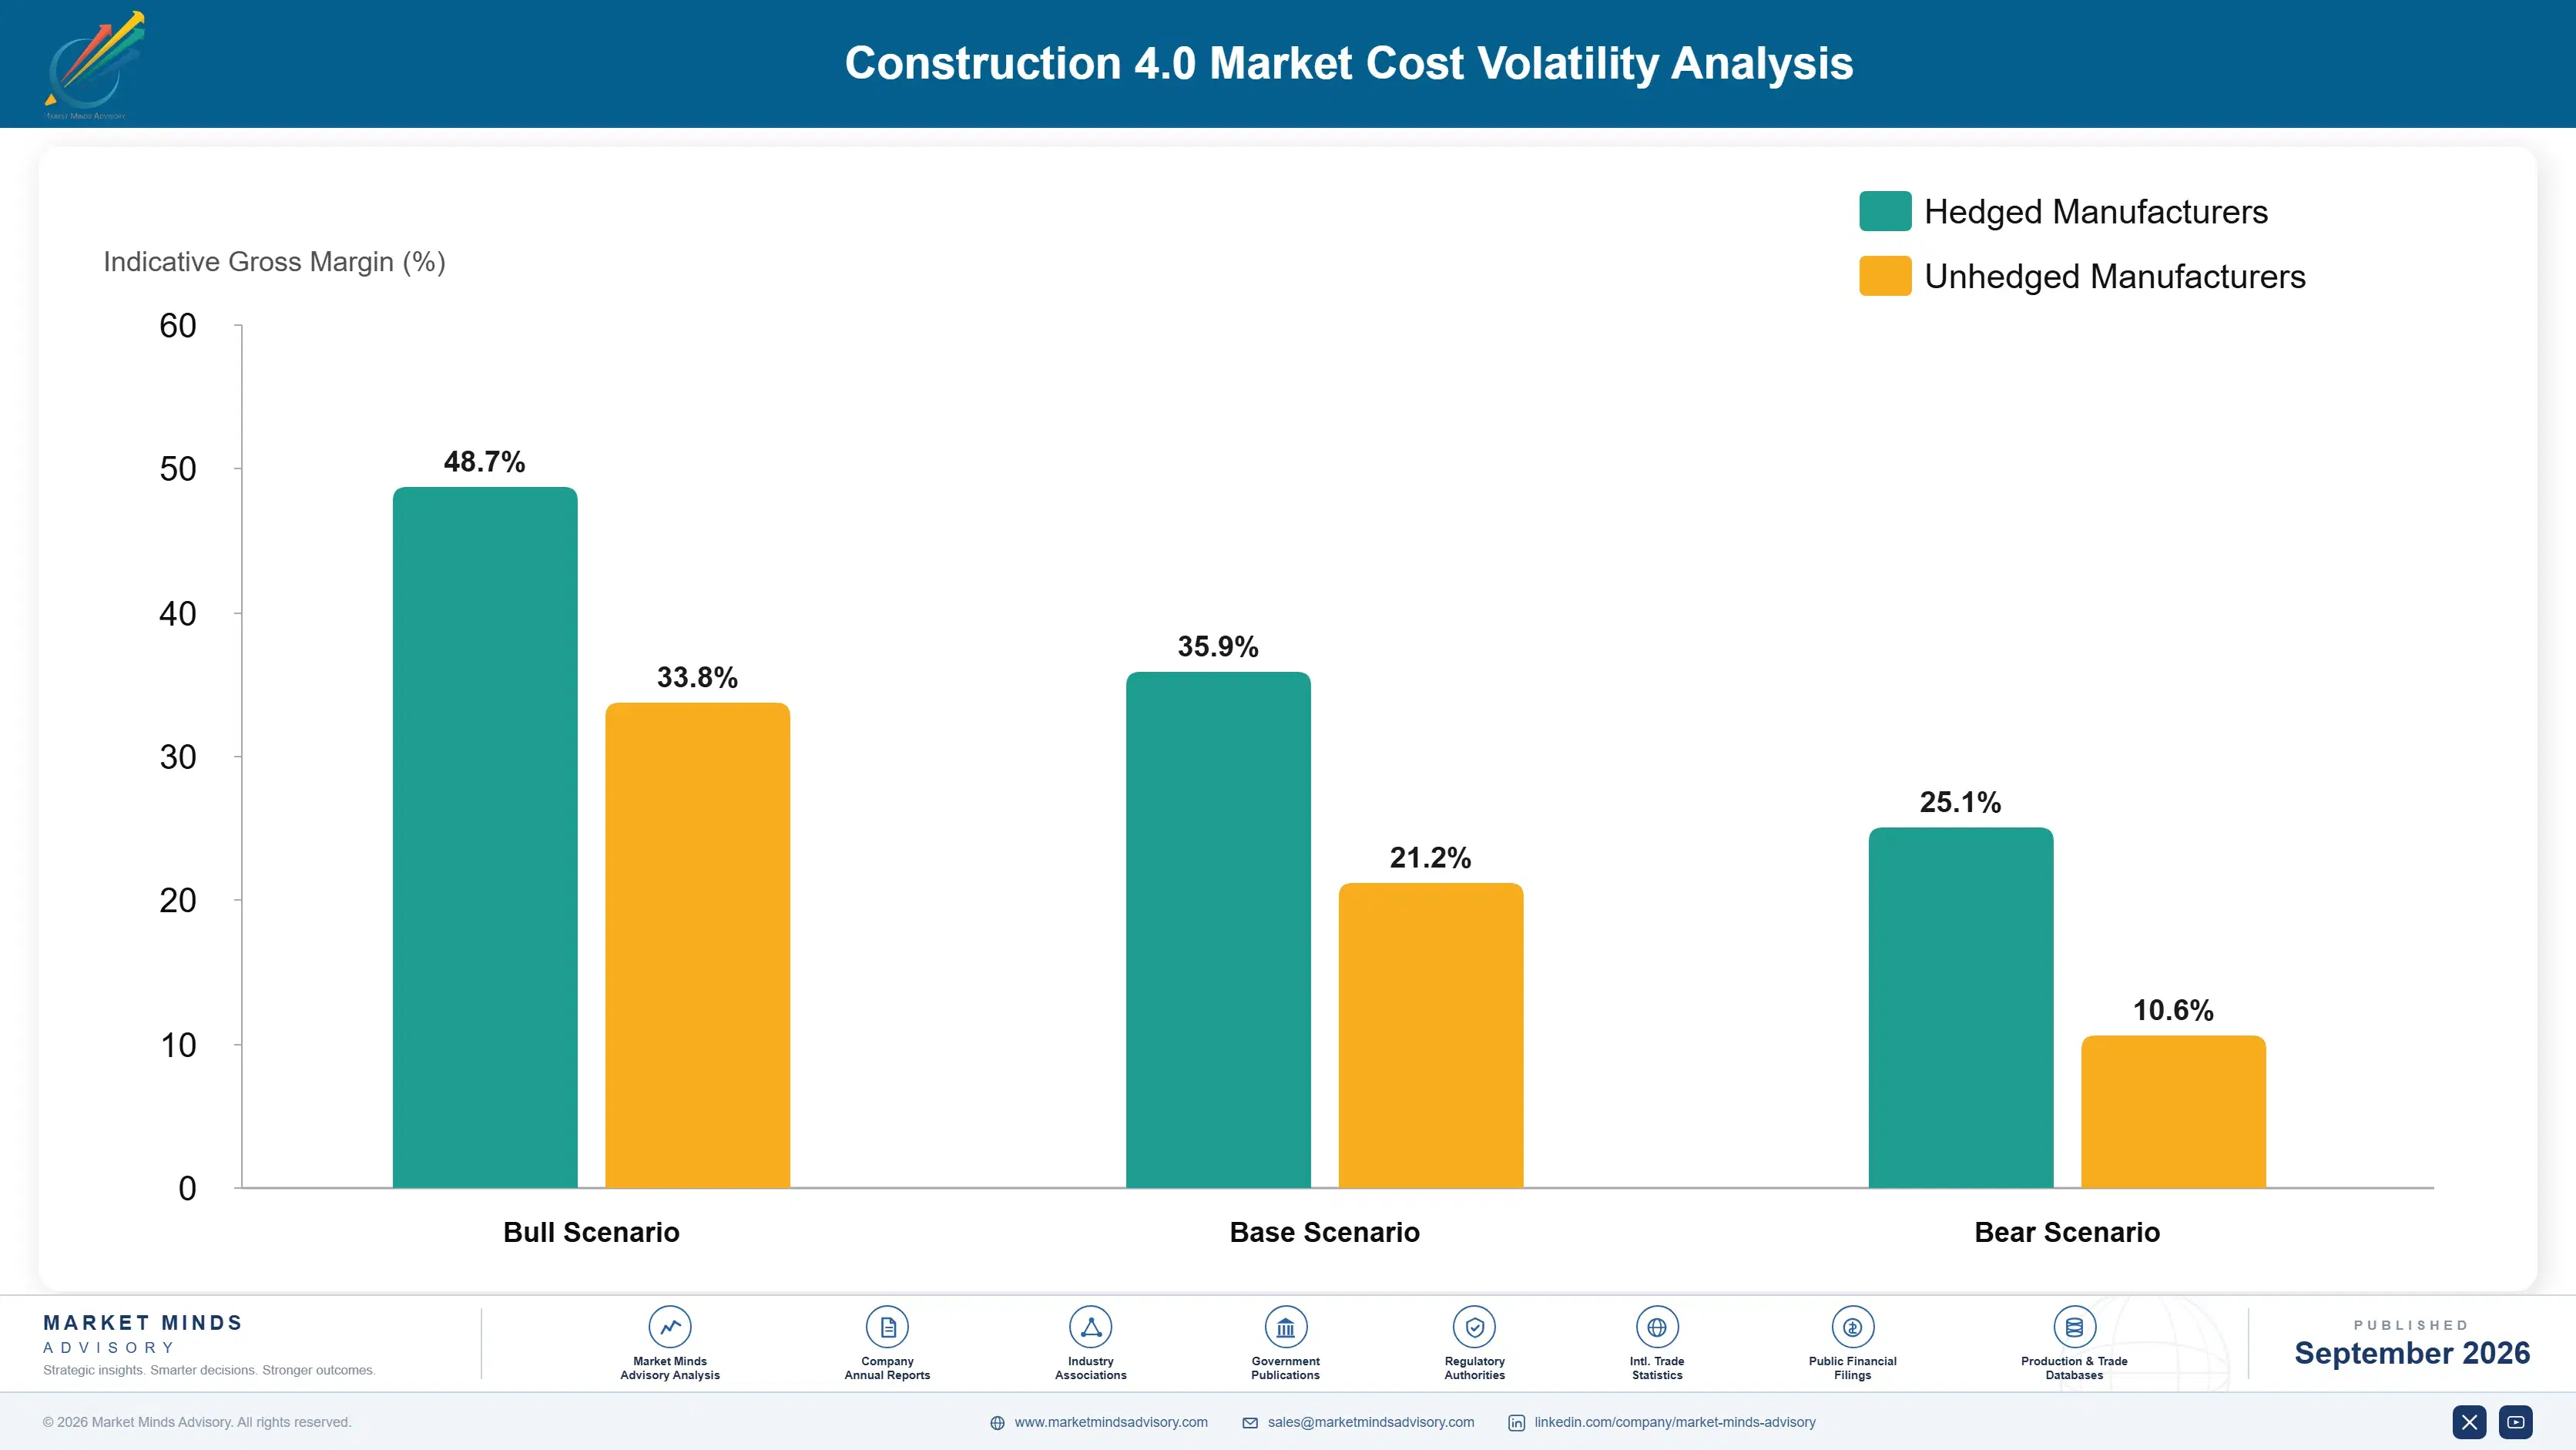
Cost structure divides sharply between software and field-deployed technology. Software delivery runs to engineering, hosting and support at roughly 28% of cost, with implementation and training a further 21%, since construction users need more support than enterprise norms assume. Field technology carries hardware, ruggedisation and site installation at between 44% and 58% of cost. Customer acquisition is expensive across both, given thousands of small firms.
Field support labour has been the sharpest pressure. Technicians able to install and commission positioning and capture equipment on active construction sites are scarce, and wage costs rose faster than general technology labour through 2024 and 2025. Trimble and Autodesk both referenced services and support cost conditions in recent annual reporting. Suppliers with fixed-price deployment commitments absorbed the increase rather than reopening agreements. Travel between dispersed sites compounds it.

Exposure varies by delivery model rather than by scale. Suppliers deploying field hardware carry installation and support labour that scales with site count rather than with revenue. Software-only vendors avoid that and face acquisition cost against thousands of small contractors. Those selling through equipment dealers reach customers cheaply and surrender margin. Small specialists fund field support without the density to make technician deployment efficient anywhere.
construction-40-market-cost-volatility-analysis-1788423714217

Deploy through equipment dealer networks

Selling directly to thousands of contractors is prohibitively expensive and construction equipment dealers already hold those relationships, service infrastructure and technician capacity. Channel deployment cuts acquisition cost by roughly 45% and provides field support that would otherwise require regional presence. Dealer margin is substantial and the alternative is a direct sales cost few suppliers can justify.

Price implementation into project budgets not overhead

Contractors approve project costs far more readily than overhead commitments, because project costs are recovered in the job while overhead competes against a 2.8% margin. Structuring implementation and training as project-charged services rather than an enterprise fee removes the internal obstacle almost entirely. It requires per-project terms that complicate forecasting, a supplier problem rather than a customer one.

Build regional technician density before national coverage

Field installation and commissioning requires technicians within reasonable travel of active sites, and thin national coverage produces long response times and high travel cost on every deployment. Concentrating in fewer regions until density supports efficient scheduling costs coverage claims and improves both economics and service. Suppliers pursuing national coverage early found travel cost quietly consuming installation margin.

Portfolio Architecture for Margin Defence

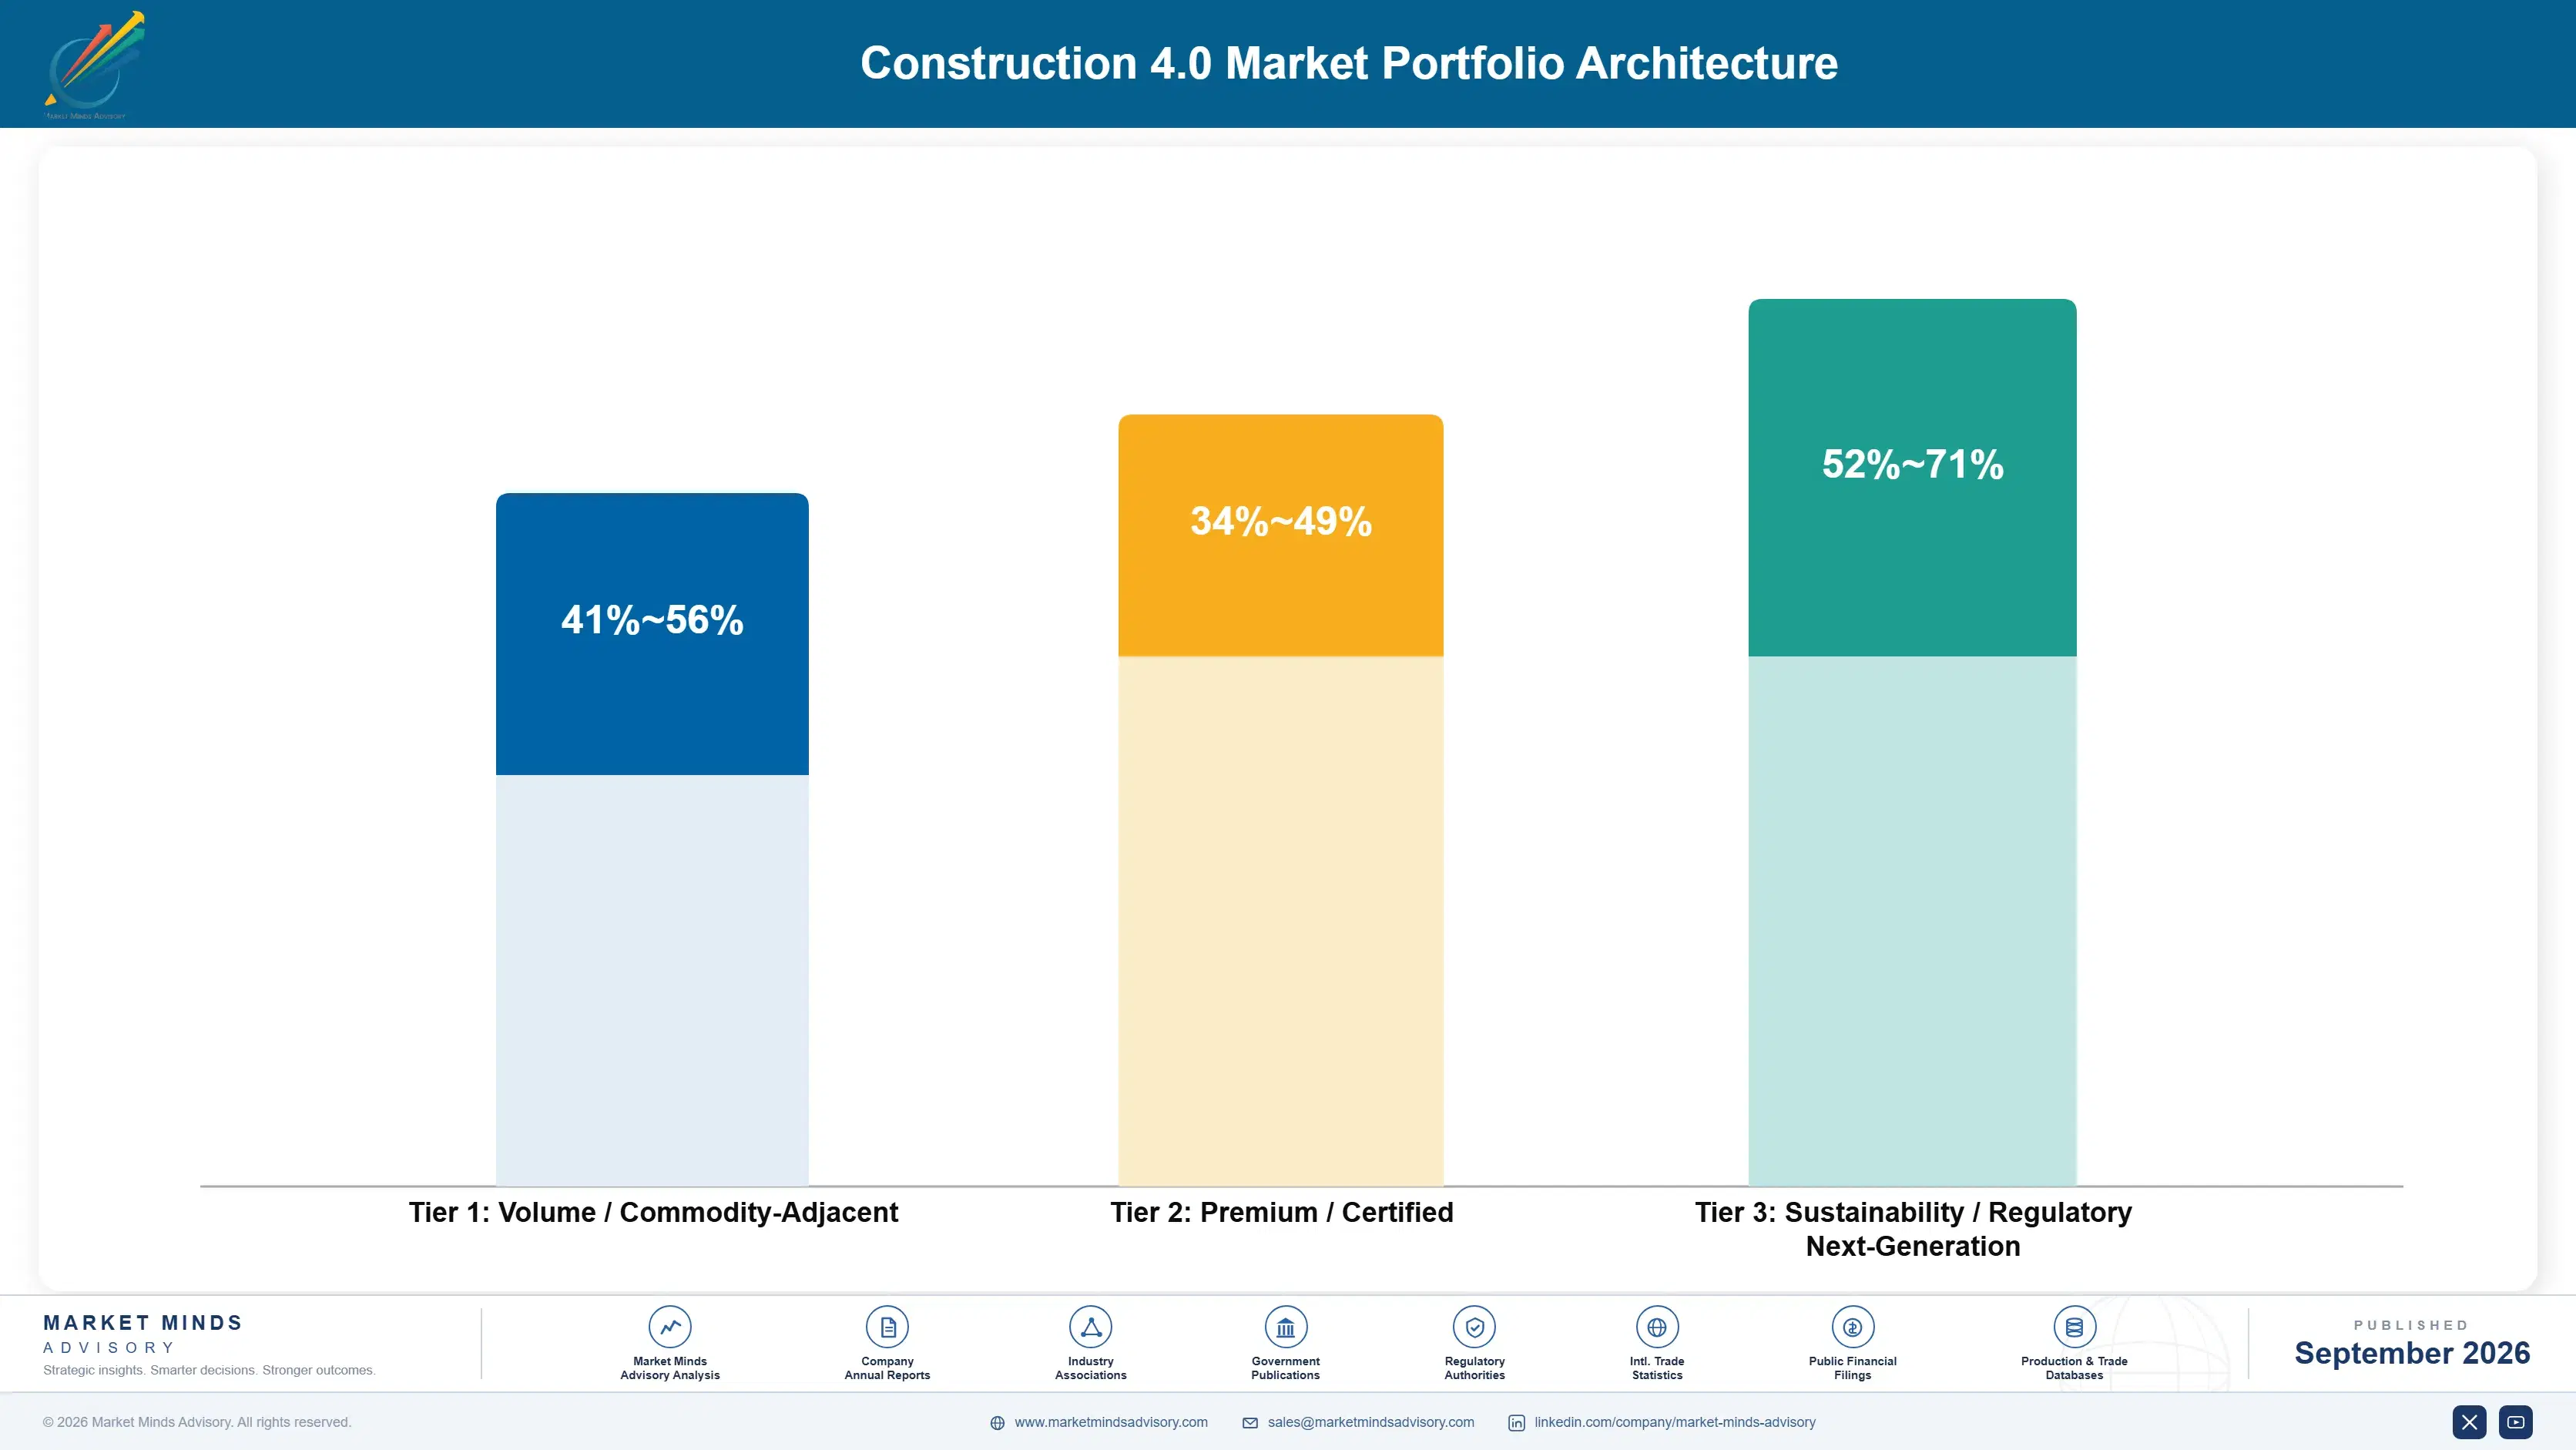
Margin architecture separates on whether a technology needs anybody's cooperation. Single-party tools deploy quickly, convert from pilot reliably and support decent pricing because the buyer captures the benefit directly. Collaborative platforms carry long sales cycles, poor conversion and pricing pressure created by uncertainty about whether anybody will actually use them. Field hardware sits apart again, carrying installation and support cost that software does not.
The volume tension is between contractor breadth and megaproject depth. Thousands of contractors represent a large addressable base and an acquisition cost that has defeated most vendors who attempted it directly. A small number of megaproject owners can impose adoption across entire supply chains through one relationship. Suppliers need both, and those built entirely around volume contractor sales have generally found the economics unforgiving at realistic contract values.

High-value revenue concentrates in reality capture sold to commercial teams and in owner-mandated delivery on major programmes. Both share the property that the buyer has a specific consequence in view, whether a disputed payment or a contract condition. Design and coordination software occupies the volume position, is genuinely well adopted, and generates data that only 14% of the time survives into construction in usable form.

Volume / Commodity-Adjacent

Design, modelling and project management software sold per seat to contractors and consultants. The wide range separates established platforms from newer entrants competing on price. Renewal faces scrutiny whenever workload softens, since it competes against a very thin project margin.
Gross Margin: 41-56%

Premium / Certified

Field-deployed positioning, machine control and capture hardware with installation and support. Margin is constrained by field labour and channel cost rather than by competitive pricing. Equipment maker integration is absorbing the machine control portion of this tier steadily.
Gross Margin: 34-49%

Sustainability / Regulatory / Next-Generation

Reality capture and evidence services sold to commercial teams, and mandated digital delivery on major programmes. The widest range in the portfolio, reflecting service content and programme scale. Highest margin and the least exposed to contractor discretionary budget pressure.
Gross Margin: 52-71%
construction-40-market-portfolio-architecture-1788423714738

High-value Sub-segments and Strategic Watch-out

Progress Evidence Services

High value and high growth together, sold to commercial teams who use dated site records in payment applications and delay defences rather than for any productivity purpose. The margin range reflects capture frequency and analysis content. Nobody else on the project has to agree, which is why it converts.
Gross Margin: 56-71%

Owner Mandated Delivery Programmes

High value with strong growth, reaching an entire supply chain through a single client relationship rather than selling to contractors individually. The range reflects programme scale and data handover requirements. Compliance is funded within package pricing, which removes the margin objection that stops everything else.
Gross Margin: 48-64%

Design and Coordination Software

The volume core of this market and genuinely well adopted, though only 14% of the data it produces survives into construction without rework. It generates the account relationships other products are sold through. Renewal competes directly against a 2.8% project margin every year. That tension has never resolved.
Gross Margin: 39-55%

Equipment Integrated Machine Control

The strategic watch-out, carried at zero because it displaces specialist supplier revenue rather than creating any. Manufacturers are fitting guidance and telematics at the factory as standard. Specialists treating equipment makers as channel partners are misreading who now controls that customer relationship. Factory fitment is now standard.
Gross Margin: 0-0%

How This Spending Repeats

Recurrence in construction technology is unusually weak because the customer's own work is project-shaped. A contractor buys for a job, uses it while the job runs and reconsiders at the next tender. Software that became standard practice across an organisation renews reliably, and roughly 23% of pilots reach that point. Everything else recurs only if somebody specifies it again, which competitive tendering rarely produces.
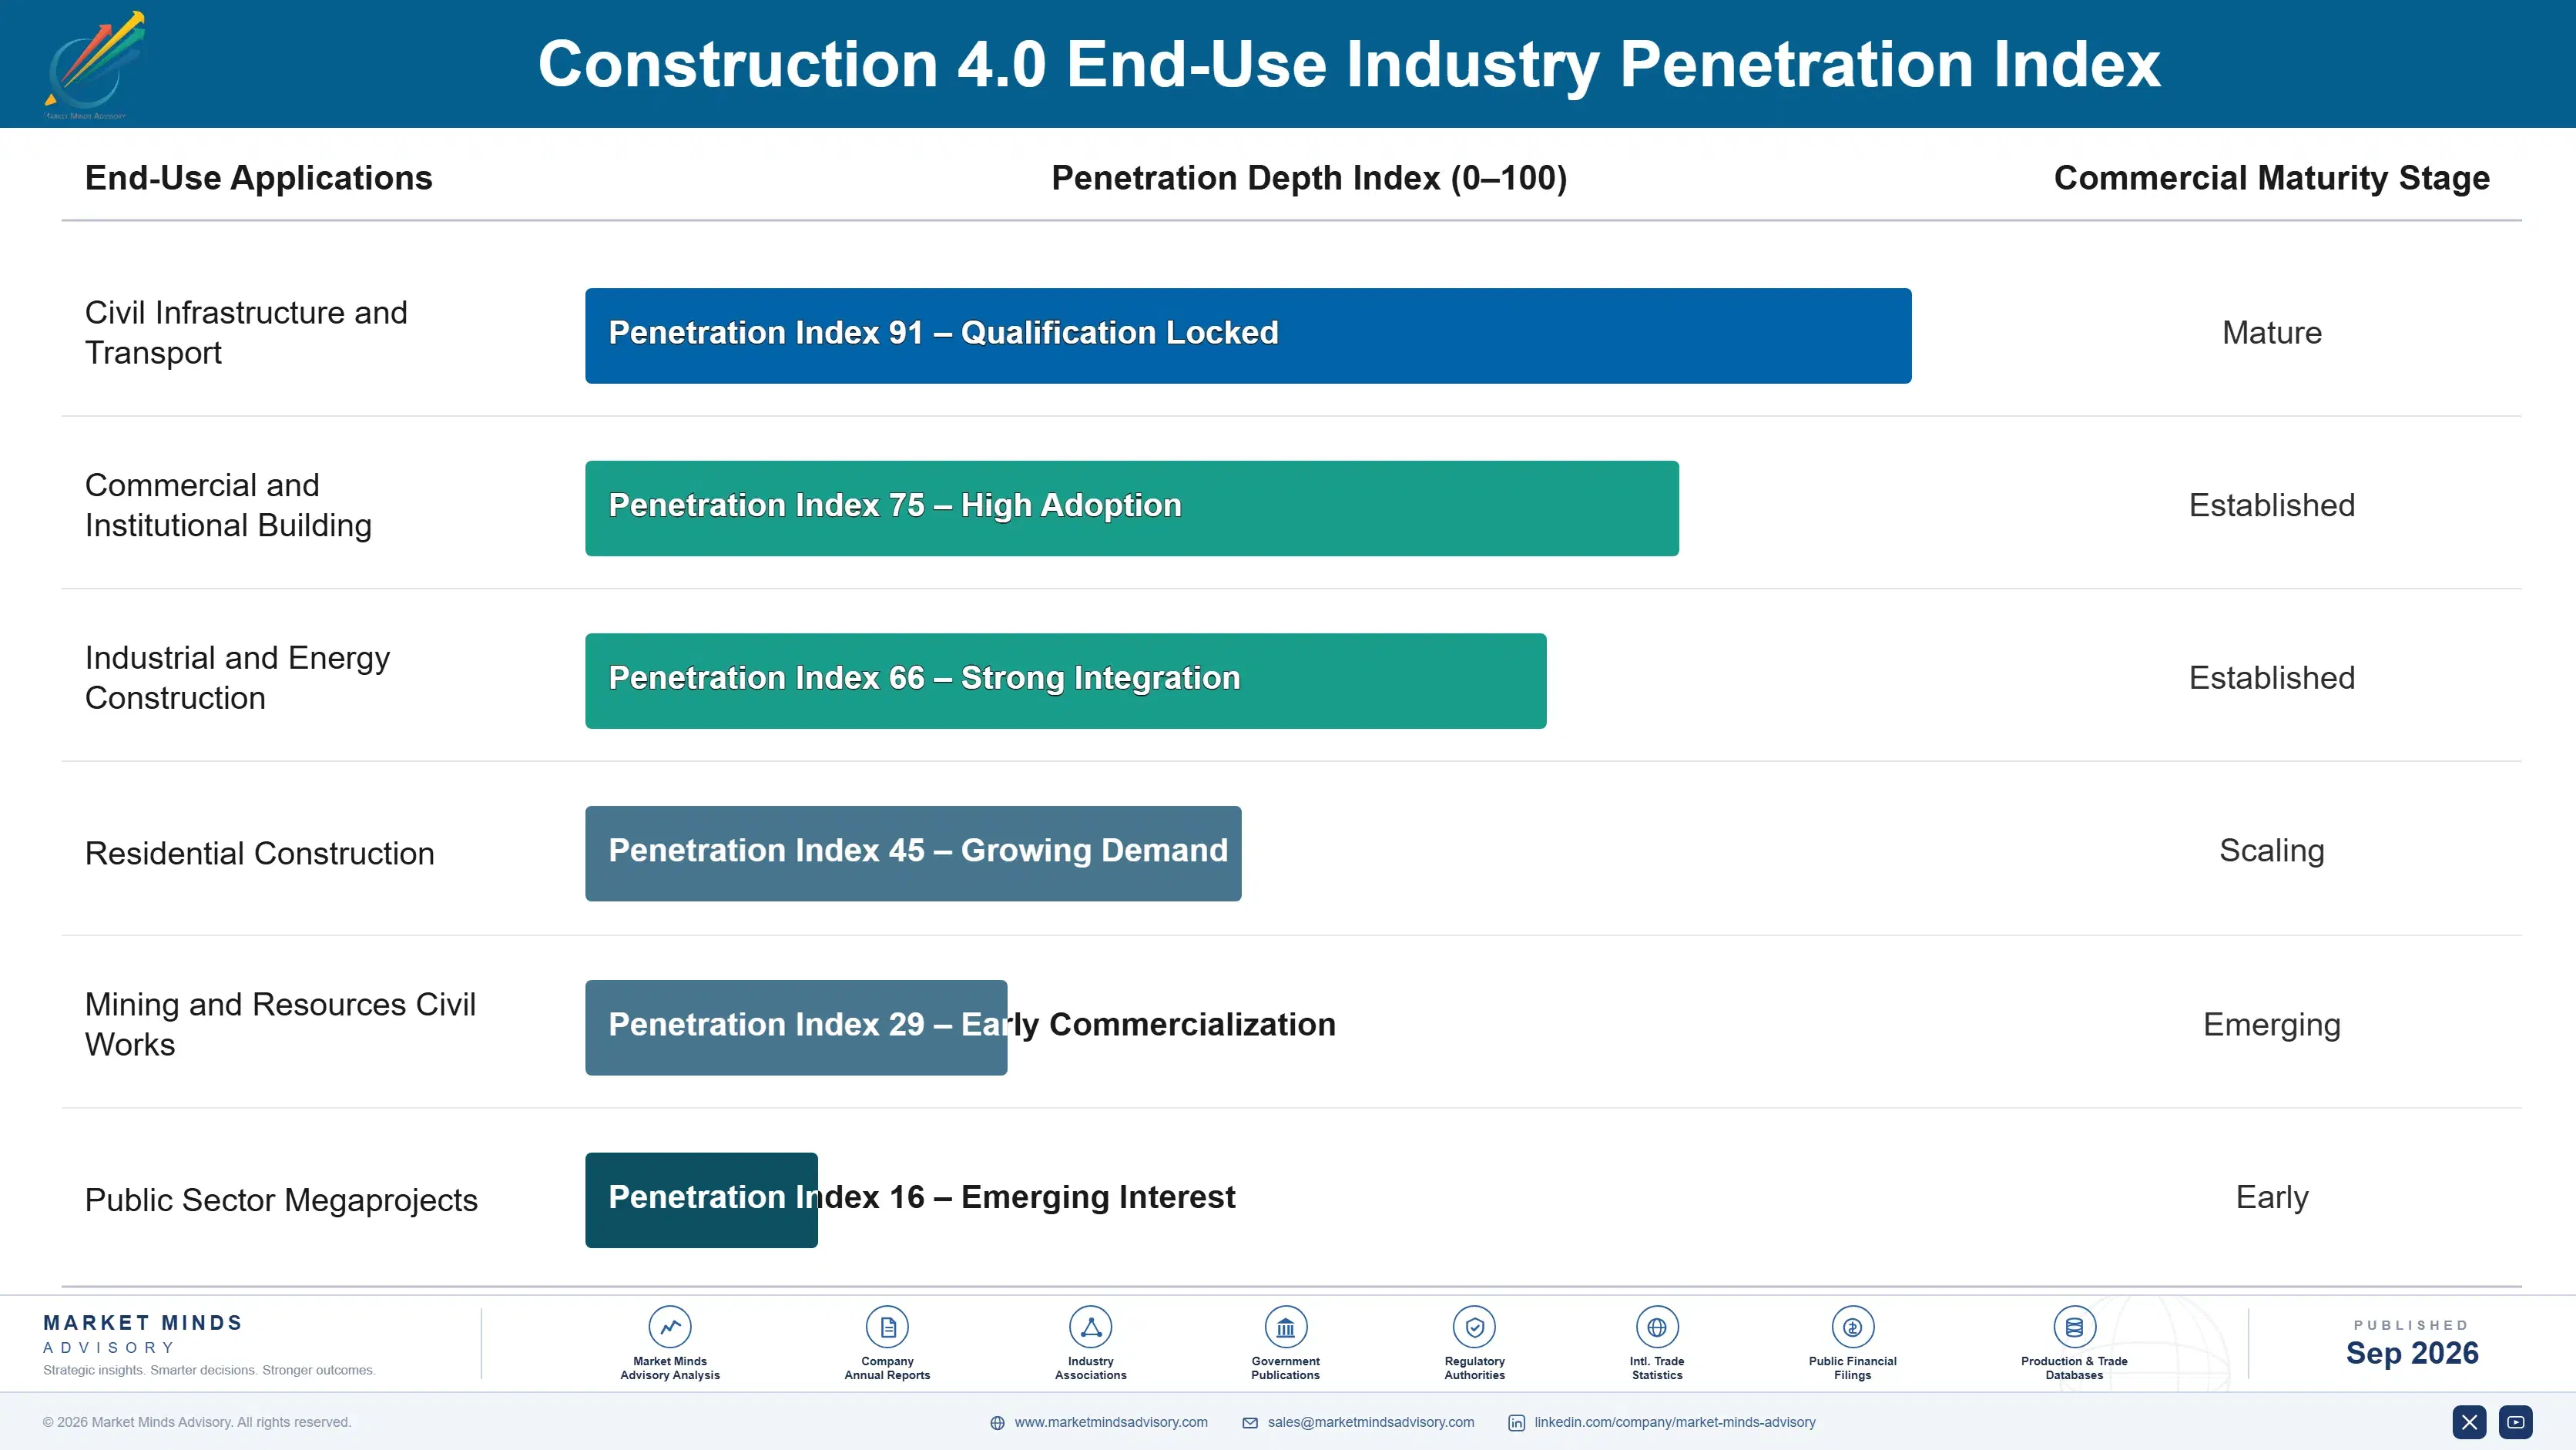
Adoption depth varies sharply by work type. Heavy civil and earthmoving contractors use machine control and positioning continuously, since the equipment carries it. Infrastructure contractors on mandated programmes use digital delivery comprehensively, since non-compliance means non-payment. Commercial building contractors use project management software widely and site technology thinly. Residential builders adopt almost nothing beyond design tools. Specialist subcontractors adopt whatever the main contractor requires and nothing more.

The buyer has broadened in a way vendors have been slow to follow. Innovation and digital functions still exist and still hold small budgets with no delivery authority. Commercial and quantity surveying teams now buy evidence tools against claim exposure with far larger budgets. Owners specify delivery requirements on major programmes. Suppliers organised around the innovation function address the buyer with least money and least influence.
construction-40-market-end-use-penetration-index-1788423715237

What Gets Adopted Here

These are among the four positions where our research anticipates prominent divergence between winners and laggards over the coming forecast period. Each is grounded in the demand model, the regulatory perimeter, and the announced capacity pipeline.
01 / SINGLE-PARTY DEPLOYMENT FOCUS

Sell what one firm can use without anybody else agreeing

Technologies requiring designers, subcontractors and owners to participate convert from pilot to practice far below the 23% overall rate, because construction contracts penalise exactly the information sharing they depend upon. Tools a contractor deploys alone and benefits from directly convert at roughly 3 times that rate. Vendors leading with collaborative capability are selling the part that fails and bundling the part that works, which is precisely the wrong order and it explains a very great many stalled pilot programmes across this industry.
02 / COMMERCIAL BUDGET ACCESS

Talk about claims and payments, not about productivity

Innovation and digital functions hold small discretionary budgets and no authority over how a project is delivered, while commercial and quantity surveying teams control claim positions worth many times any technology spending. Reality capture sold as dispute evidence rather than as progress monitoring reaches budgets around 4 times larger and closes considerably faster than any innovation sale. It requires speaking about variations and payment applications rather than productivity, and most vendors in this market remain organised entirely around the wrong conversation.
03 / OWNER MANDATE POSITIONING

Follow the clients who can compel a supply chain

Collaborative adoption happens reliably in one circumstance only, which is when an owner makes it a contract condition and funds it inside package pricing rather than expecting a contractor to absorb it. Giga-project and major infrastructure programmes do exactly that, and Saudi Arabia grows at 17.8% almost entirely because of it. One client relationship reaches an entire supply chain that would otherwise take years to sell into, and the requirement travels downward through the chain, because non-compliance simply means not working at all.
04 / PROJECT LEVEL COMMERCIALS

Charge into the job, never into contractor overhead

Operating margins near 2.8% make enterprise technology commitments genuinely difficult to approve, since the cost sits in overhead while the benefit lands on projects that were tendered without it. Per-project pricing charged into the job budget removes that obstacle and matches how construction firms actually think about every cost they carry. Suppliers pricing this way reach roughly 2 times as many projects within the same account, and the complication it creates is a supplier accounting problem rather than a customer one.

Engagement Snapshot From the Field

A live engagement with an industry participant carrying material or product regulatory and market exposure ahead of a defining policy shift, showing how our research translates into a defensible multi-year portfolio strategy.
MARKET MINDS ADVISORY · CLIENT ENGAGEMENT SUMMARY
Construction 4.0 Producer Strategic Portfolio Review and Transition Roadmap 2026·Investment Scenario on Construction 4.0 Exposure Evaluation 2025-26
CLIENT PROFILE
An international contractor group with annual revenue near USD 6.8 billion across civil infrastructure and commercial building (client-reported, unverified by MMA), operating in eleven countries with roughly 340 active projects. A central digital team had run 27 technology pilots across three years and could not demonstrate that any had become standard practice across the business.
STRATEGIC CHALLENGE
The digital programme cost roughly USD 24 million annually and faced cancellation at the next budget review (client-reported, unverified by MMA). Project directors described most tools as additional administration, while the commercial function had separately procured site capture services on several disputed projects without any involvement from the central digital team at all.
MMA APPROACH
MMA classified all 27 pilots by whether they required parties outside the contractor to participate, which nobody had examined, and tracked each against actual continued use. We interviewed 22 project and commercial staff, four clients and six suppliers. Evaluation weighted contractual deployability and demonstrated continued use rather than capability assessment or pilot satisfaction scores.
KEY FINDINGS
  1. All six pilots still in use eighteen months later could be deployed by the contractor alone, and every abandoned pilot had required supply chain participation of some kind.
  2. Commercially procured site capture had recovered an estimated USD 31 million in disputed claims across four projects, at a cost the digital team had never been told about.
  3. Machine control was in standard use across the earthmoving fleet and had never been counted as part of the digital programme at all.
  4. Two clients on major infrastructure programmes were mandating digital delivery and funding it, and those projects showed adoption that no internal initiative had achieved.
CLIENT PROFILE
An international contractor group with annual revenue near USD 6.8 billion across civil infrastructure and commercial building (client-reported, unverified by MMA), operating in eleven countries with roughly 340 active projects. A central digital team had run 27 technology pilots across three years and could not demonstrate that any had become standard practice across the business.
STRATEGIC CHALLENGE
The digital programme cost roughly USD 24 million annually and faced cancellation at the next budget review (client-reported, unverified by MMA). Project directors described most tools as additional administration, while the commercial function had separately procured site capture services on several disputed projects without any involvement from the central digital team at all.
MMA APPROACH
MMA classified all 27 pilots by whether they required parties outside the contractor to participate, which nobody had examined, and tracked each against actual continued use. We interviewed 22 project and commercial staff, four clients and six suppliers. Evaluation weighted contractual deployability and demonstrated continued use rather than capability assessment or pilot satisfaction scores.
KEY FINDINGS
  1. All six pilots still in use eighteen months later could be deployed by the contractor alone, and every abandoned pilot had required supply chain participation of some kind.
  2. Commercially procured site capture had recovered an estimated USD 31 million in disputed claims across four projects, at a cost the digital team had never been told about.
  3. Machine control was in standard use across the earthmoving fleet and had never been counted as part of the digital programme at all.
  4. Two clients on major infrastructure programmes were mandating digital delivery and funding it, and those projects showed adoption that no internal initiative had achieved.
RECOMMENDED STRATEGY
Phase 1: Stop piloting anything requiring supply chain participation unless a client has both mandated and funded it as an explicit contract condition. Phase 2: Move site capture procurement and budget to the commercial function formally, since that is where the value is recovered and the money already sits. Phase 3: Redirect the central digital team toward supporting owner-mandated programme requirements rather than continuing to initiate internal technology adoption programmes on its own.
OUTCOME
The programme budget was reduced to roughly USD 9 million and refocused on client-mandated delivery and commercially procured evidence tools (client-reported, unverified by MMA). Site capture was extended across all projects with claim exposure, and pilot activity requiring any supply chain cooperation was discontinued entirely across the group.

Frequently Asked Questions

Foundational context covering the market sizes, CAGR, scope, country, region and competition that inform every finding below. This section is provided to cover basics and most often pre-purchase conversations, answered from the MMA Primary Research Dataset.

What is the current size of the Construction 4.0 Market?

The market was worth USD 18.4 billion in 2025 and reaches USD 20.64 billion in 2026. Single-party technologies rather than collaborative platforms account for most of that growth.

How large will the Construction 4.0 Market be by 2036?

MMA forecasts USD 65.25 billion by 2036, an expansion of 3.16 times over the forecast period. That represents USD 44.61 billion of incremental annual revenue against 2026.

What is the CAGR for the Construction 4.0 Market 2026 to 2036?

The base case is 12.2% compound annual growth, with a bull case at 13.4% and a bear case at 11.0%. Whether collaborative contracting spreads separates the three scenarios.

Which segment is growing fastest?

Reality capture and progress verification grows at 18.3%, half again the market rate of 12.2%. It produces evidence a contractor uses commercially without needing anybody else to agree.

Who are the major companies in the Construction 4.0 Market?

Autodesk, Trimble, Procore, Hexagon and Bentley Systems lead on measured software, equipment and services revenue. Together they hold roughly 19%, which makes this exceptionally fragmented for a market of its size.

Which country is growing fastest?

Saudi Arabia grows fastest at 17.8%, on giga-project clients specifying digital delivery as a funded contract condition rather than expecting contractors to absorb the cost.

Report Segmentation Architecture

The full report scope spans multiple orthogonal segmentation dimensions, with cross-tabulated demand data provided for each dimension pair. Coverage extends further to regional breakdowns, trend trajectories, and the competitive detail needed to support segment-level decision-making.

By Primary Market Dimension

  • Building Information Modelling and Design Coordination
  • Reality Capture and Progress Verification
  • Machine Control and Automated Equipment
  • Offsite Manufacturing and Modular Systems
  • Connected Assets and Site Sensing
  • Project Data and Common Data Environments

By End-Use Industry

  • Civil Infrastructure and Transport
  • Commercial and Institutional Building
  • Industrial and Energy Construction
  • Residential Construction
  • Mining and Resources Civil Works
  • Public Sector Megaprojects

By Commercial Dimension

  • Direct Contractor Subscription
  • Owner Mandated Programme Supply
  • Equipment Dealer Channels
  • Commercial Function Procurement
  • Systems Integrator Delivery
  • Project Based Service Contracts

By Region

  • East Asia
  • North America
  • Western Europe
  • South Asia and Pacific
  • Middle East and Africa
  • Latin America
  • Eastern Europe

Scope, Methodology, and Coverage

Every figure in this report is reproducible from documented input assumptions. The scope below maps the historical period, the forecast horizon, the segmentation dimensions, and the countries covered, alongside the underlying primary and qualitative methodology.
Historical Period
2020 to 2025
Forecast Period
2026 to 2036
Base Year
2025 (USD billions; MMA Primary Research Dataset, September 2026)
Market Definition
This market covers digital and automation technologies applied to construction delivery, spanning building information modelling and design coordination, reality capture and progress verification, machine control and automated equipment, offsite manufacturing and modular systems, connected assets and site sensing, and project data and common data environments. Revenue is measured as software subscription and licence value, technology-attributable equipment and hardware value, and directly attributable implementation and capture services at supplier level. Conventional construction equipment without digital control content, and finishing materials, architectural and engineering design services, property development, and facilities management software are excluded.
Quantitative Units
USD billions, software, attributable equipment and service revenue
Segmentation Dimensions
Technology application, construction sector, commercial model, region
Regions Covered
East Asia, North America, Western Europe, South Asia and Pacific, Middle East and Africa, Latin America, Eastern Europe
Countries Covered
Japan, South Korea, China, Taiwan, Singapore, India, Australia, Malaysia, Vietnam, United States, Canada, Mexico, Brazil, Chile, United Kingdom, Germany, France, Netherlands, Sweden, Norway, Denmark, Spain, Poland, Czechia, Saudi Arabia, United Arab Emirates, Qatar, Egypt, South Africa
Key Companies Profiled
Autodesk, Trimble, Procore, Hexagon, Bentley Systems, Nemetschek, Topcon Positioning Systems, Caterpillar, Komatsu, Oracle, Dassault Systemes, OpenSpace, Buildots, Doxel, Built Robotics, Hilti, Volvo Construction Equipment, Liebherr, PlanRadar, Kojo
Quantitative Methodology
Primary survey, n=3,800 respondents, Q4 2025, six countries; demand-side model with trade association cross-validation
Qualitative Methodology
47 expert interviews, Q4 2025; applied to validate demand model assumptions, identify emerging dynamics, and assess competitive positioning
Report Format
PDF and XLSX data workbook (Word format preview document)
Publisher
Market Minds Advisory
Report Code
MMA-2026-CON-621
Published
September 2026
Contact
sales@marketmindsadvisory.com | www.marketmindsadvisory.com

Purchase the full Construction 4.0 Market Report (2026 to 2036).

The full MMA report explains why construction technology fails contractually rather than technically, and identifies which applications succeed because they require nobody else to cooperate. It sizes the market to 2036 across six technology applications, seven regions and 29 countries, with segment growth rates and regional demand mechanisms set out in full. Competitive analysis covers 20 participants assessed on measured software, equipment and services revenue, including moat and risk assessment for the two leaders. The report quantifies delivery cost structure, pilot conversion economics and margin architecture across three portfolio tiers. It closes with four strategic verdicts and an anonymised international contractor engagement.
Six technology applications sized to 2036
Seven regions with demand mechanism analysis
Twenty participants on consistent revenue basis
Pilot conversion and adoption benchmarks by type
Margin architecture across three portfolio tiers
Anonymised contractor technology portfolio review engagement

Built For The People Who Decide

From boardroom strategy to bench-side execution, this report is read cover-to-cover by leaders shaping the next decade of their industry, turning demand scenarios, market dynamics and valuation benchmarks into decisions.
CXOs/ Presidents/ VPs/ Managers
M&A and Corporate Development
Strategy Teams and R&D Heads
Procurement and Product Directors
Regulatory and Compliance Leaders
Investor Relations and Equity Analysts