Market Minds Advisory
Connector Adapter Kits Market

Connector Adapter Kits Market: Connector Adapter Kits Market: Curated Interconnect Sets, Field Coverage and Distribution Economics, 2026 to 2036

Buyers use about 34% of what a kit contains and pay willingly for the rest. They are not purchasing adapters at all; they are purchasing the absence of a wasted site visit.

Lead Analyst

Published

September 2026

Make Smarter Decisions with Customized Research Insights

Request a free sample report and evaluate market opportunities, growth trends, and competitive dynamics relevant to your business needs.

2025 MARKET VALUE$1.8BMarket Size 2025
2036 FORECAST VALUE$3.2BBase Case , 2026 to 2036
CAGR 2026 TO 20365.2 %Bull 6.4% / Bear 4.0%
INCREMENTAL OPPORTUNITY$1.3BNet 10- year value creation
EXPANSION MULTIPLE1.68x2036 value over 2026 base
Strategic Levers
M&A Pipeline
Regional Outlook
Country Rankings
Competitive Intelligence
Segmental Deep-dive
Call-Us : 91 93563 13602

Executive Snapshot and Market Trajectory.

Nobody counts the adapters they used. They count the one occasion the kit did not contain what the job needed, and that single memory sets the purchase specification for the next five years. Utilisation runs near 34% and buyers regard that as entirely acceptable.
Fibre optic kits grow at 7.8%, half again the market rate of 5.2%, carried by deployment programmes and by field maintenance forces who cannot predict which connector variant a given cabinet will present. East Asia holds 28% of kit revenue, combining the largest connector manufacturing base anywhere with fibre build programmes running at a scale nothing else matches. India grows fastest of the countries covered at 9.4%.
Concentration is low for an interconnect category, with five suppliers holding 39% of kit revenue, and 63% of kits reach buyers through distributors rather than the firms who make the connectors. Curation and availability are the value being added here, not manufacture, and standards convergence has enlarged kits rather than shrinking them. Every consolidation around a newer interface added adapters bridging back to equipment nobody retired on schedule, so kits grew larger instead of disappearing.
Market Definition
This market covers pre-assembled sets of interconnect adapters supplied as kits, including RF and coaxial adapter kits, fibre optic adapter kits, industrial and circular connector kits, data and computing interface kits, audio, video and broadcast kits, and power and high-current connector kits, together with the cases, inserts, and labelling supplied with them. It excludes individually sold connectors and adapters, cable assemblies, connector tooling and crimping equipment, test instruments, and permanently installed patching hardware.
Base Year Value
$1.8B in 2025 (MMA Primary Research Dataset, September 2026)
Forecast Period
2026 to 2036, eleven discrete annual values
CAGR
5.2% base case. Bull 6.4%. Bear 4.0%.
Fastest Growth Segment
Fibre Optic Adapter Kits: 7.8% CAGR
Fastest Growth Country
India: 9.4% CAGR
Fastest Growth Region
South Asia and Pacific: 7.3% CAGR
Largest Region
East Asia: 28% of 2025 global value
Market Leaders
TE Connectivity, Amphenol, Molex, Pasternack, and Rosenberger lead the field. Source: MMA Primary Research Dataset, July 2026.
Primary Survey
n=3,800 procurement and R&D decision-makers, Q4 2025, six countries
Methodology
Demand-side build-up, cross-validated against public data, 47 expert interviews

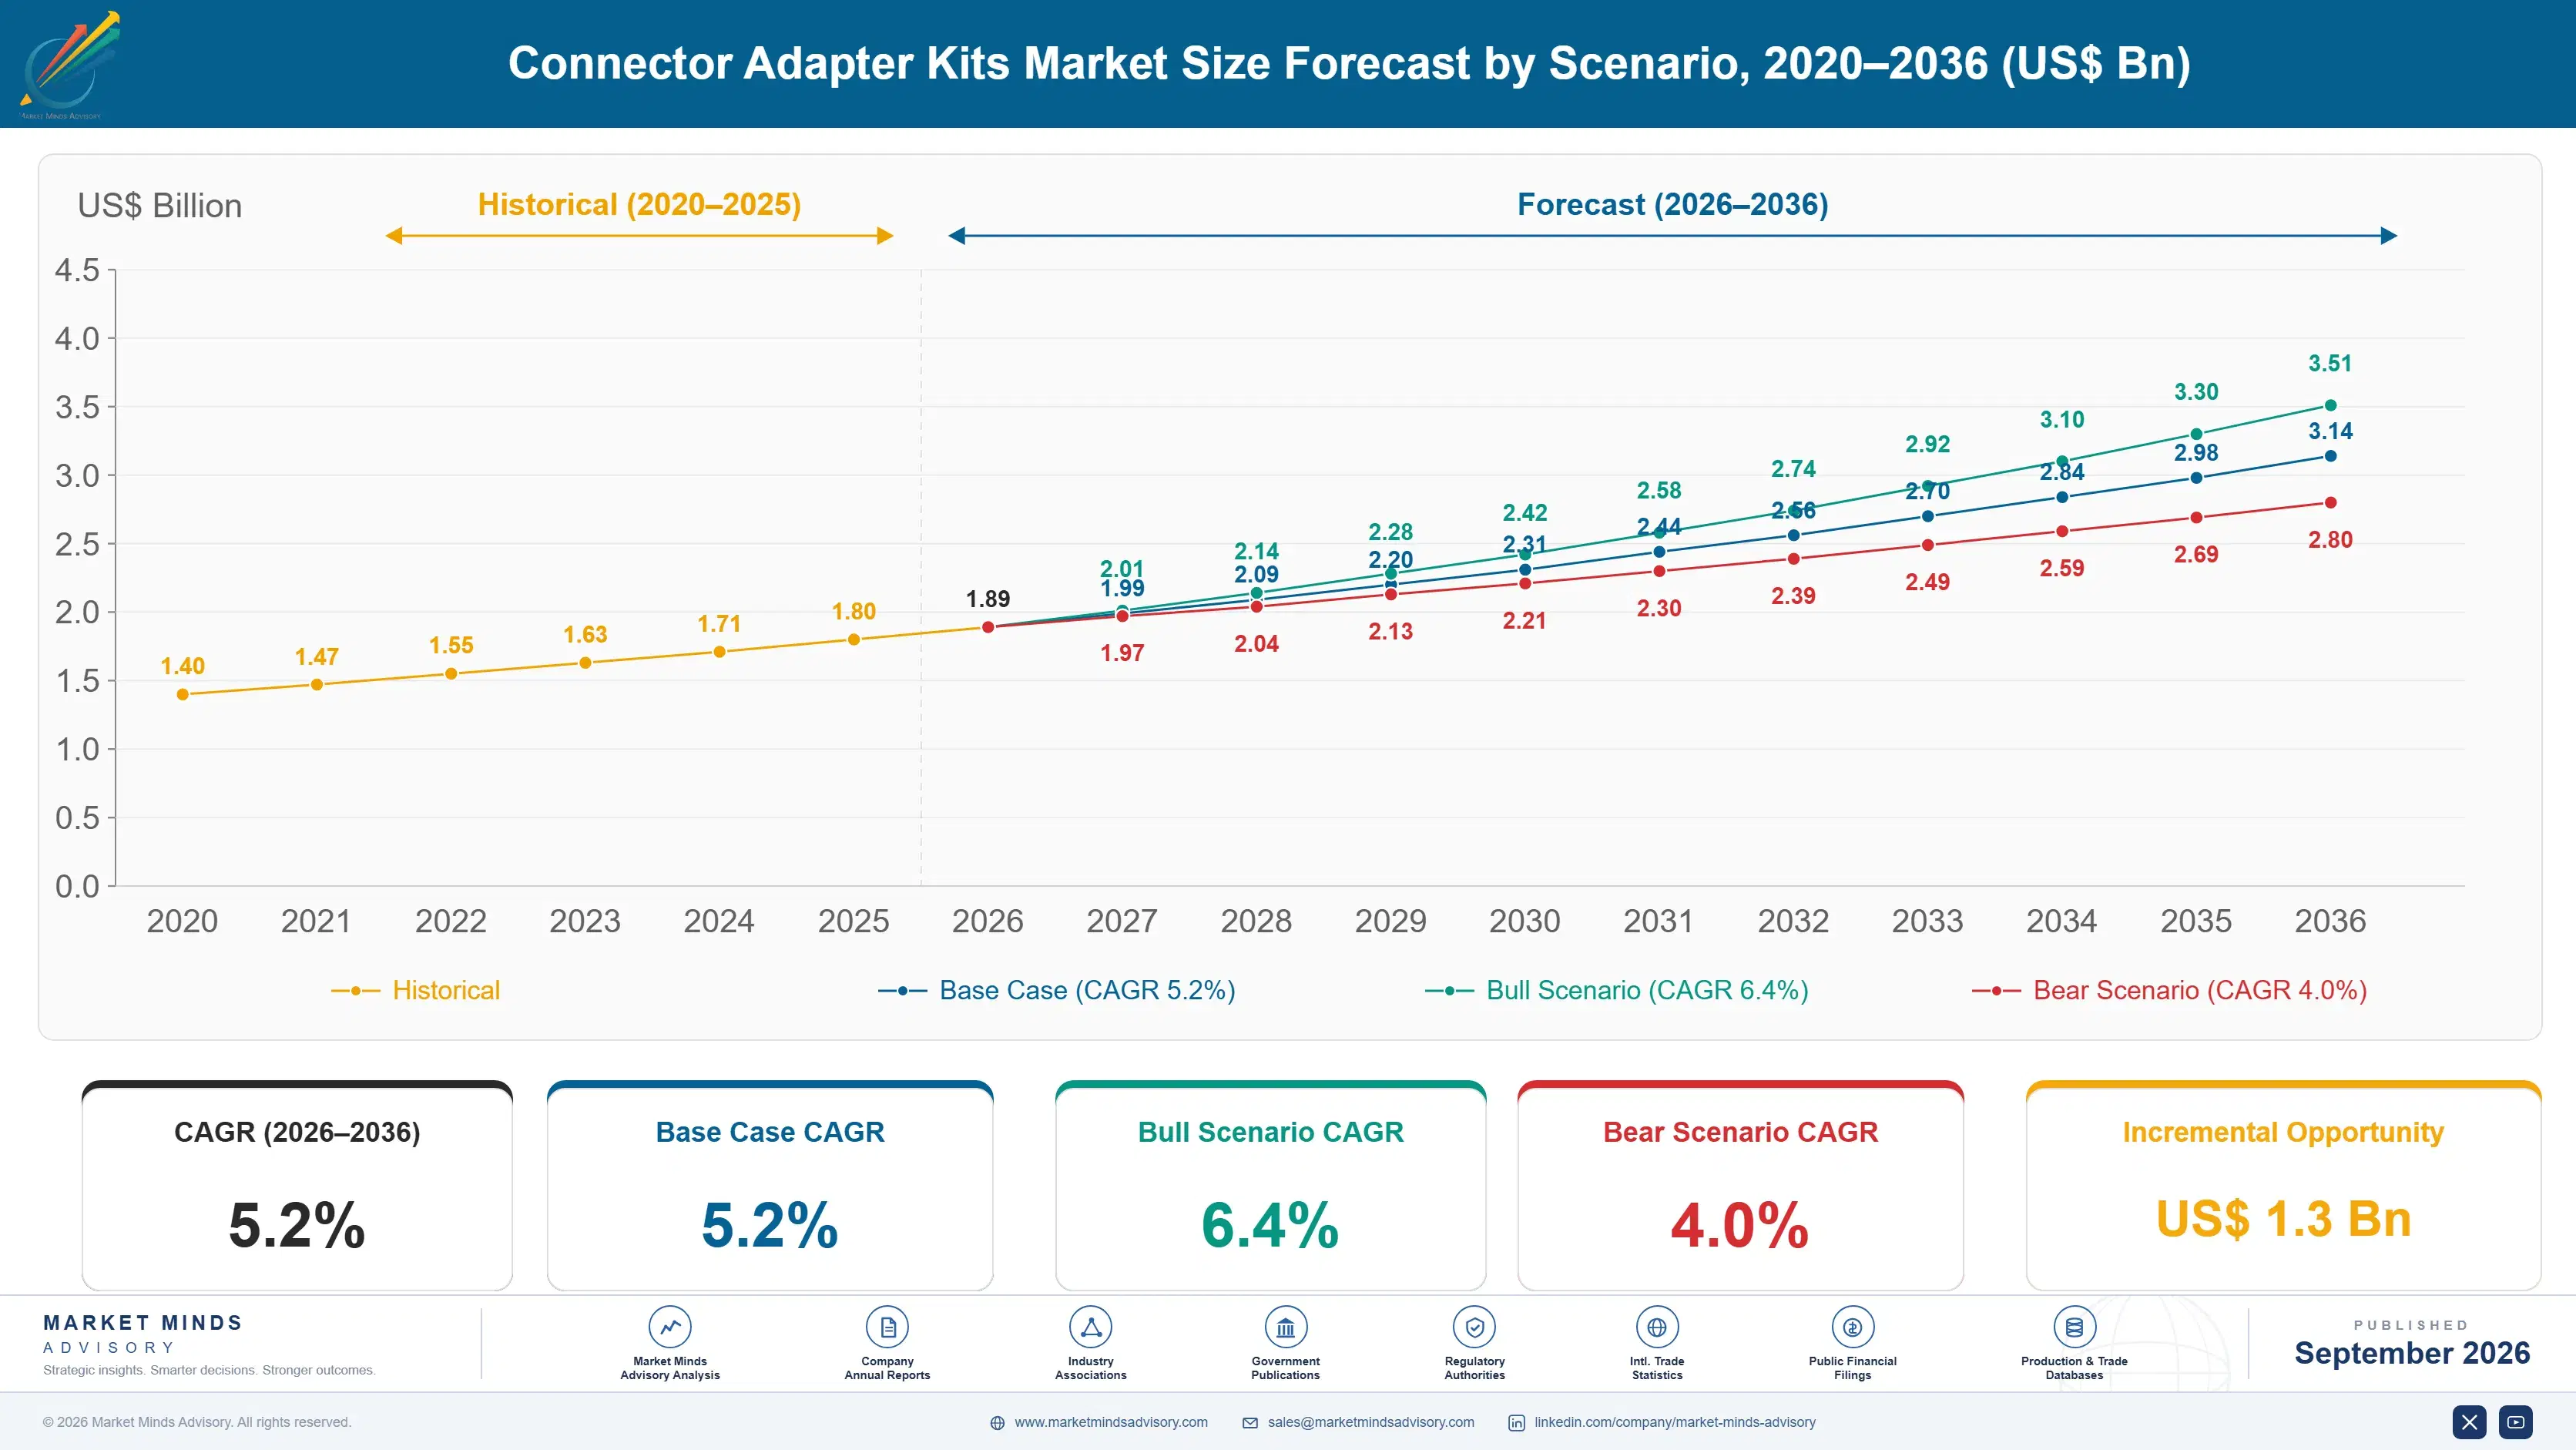
Connector Adapter Kits Market Forecast Scenarios

connector-adapter-kits-market-size-forecast-scenario-1790010093593
The 2020 to 2025 period should have been difficult for this category and was not. Interface convergence around a smaller number of standards was expected to reduce the variety a field engineer must carry, and it did the opposite, since each new standard added adapters bridging back to equipment nobody retired. Historical growth of 4.1% came from kits getting larger and dearer rather than from more of them selling.
The base case at 5.2% rests on three mechanisms. Fibre deployment and maintenance programmes create field forces who cannot predict which connector variant a cabinet will present and therefore carry everything. Test laboratories buy coverage rather than utilisation, because an unavailable adapter idles equipment costing far more than the kit. And the installed base of legacy interfaces keeps extending, since equipment is maintained for decades after its interface leaves new designs.
The bull case at 6.4% depends on defence and aerospace maintenance budgets expanding, where qualified kits carry prices several times commercial equivalents and utilisation is not questioned at all. The bear case at 4.0% is distributor stocking discipline: much of this demand sits in channel inventory, and working capital pressure across distribution suppresses orders before end demand changes.

Paying For Coverage, Not Contents

The commercial logic here is asymmetric and everybody involved knows it. A kit costs around USD 610. An hour of stopped work at the site it was carried to costs roughly 47 times that. So the buyer specifies for the improbable case, carries adapters that will never be opened, and considers 34% utilisation a sensible outcome rather than waste.
TOP FIVE CONCENTRATION39%Share of kit revenue held by the leading suppliers
KIT UTILISATION RATE34%Adapters in a typical kit ever used before its retirement
AVERAGE KIT PRICEUSD 610Delivered price averaged across all kit categories sold
DISTRIBUTOR CHANNEL SHARE63%Kits reaching buyers through distributors rather than connector makers
DOWNTIME COST MULTIPLE47xHourly downtime cost measured against a typical kit price
REPLACEMENT CYCLE LENGTH4.2 yearsTypical interval before a field kit is fully replaced
That asymmetry explains why interface convergence never shrank the category. Every consolidation around a newer standard added adapters bridging back to equipment still in service, and equipment gets maintained for decades after its interface stopped appearing in new designs. Kits got larger and more expensive instead of fewer. The engineers carrying them have watched this happen three times and stopped expecting anything different. Nobody now expects the next convergence to behave differently.
The value added is curation and availability rather than manufacture, which is why 63% of kits reach buyers through distributors and why concentration sits at only 39%. Somebody has to decide what belongs in a kit for a specific job, stock it against unpredictable demand, and ship it the same day. Connector makers are generally not organised to do any of that.
"We asked field engineers how much of their kit they had ever used and most guessed high, then checked and found a third. Not one of them proposed carrying less. They could all name the day a missing adapter cost them a return visit, and that memory outweighs every efficiency argument anybody has made since."
Practice Director, Interconnect and Electronic Components · MMA Technology Practice · September 2026

Market Trends

Standards Convergence Enlarges Kits Rather Than Shrinking Them

Each consolidation around a newer interface was expected to reduce the variety a field engineer carries, and each one instead added adapters bridging back to equipment already installed. Nothing gets retired on the schedule the standards body assumed. Equipment stays in maintenance for decades after its interface disappeared from new designs, so the bridging requirement accumulates rather than resolving. Average kit prices reached USD 610 on that accumulation, and engineers who have watched the pattern repeat three times now specify for it deliberately. Specifying for it is now the default rather than an unusual caution.
Market Impact: Segment grows at 7.8%

Distributors Capture The Curation Value Instead

Deciding what belongs in a kit for a specific job, stocking it against demand nobody can forecast, and shipping it the same day are the activities buyers actually pay for, and connector manufacturers are rarely organised to perform any of them. Around 63% of kits reach buyers through distributors and catalogue houses as a result. Concentration sits at just 39%, low for an interconnect category, because the position that matters is inventory breadth and fulfilment speed rather than manufacturing scale. Catalogue houses have extended private label ranges that bypass connector manufacturers altogether, and the buyers do not appear to mind.
Market Impact: Downtime costs 47 times more

Market Opportunities and Growth Drivers

Fibre Deployment Creates Unpredictable Field Connector Requirements

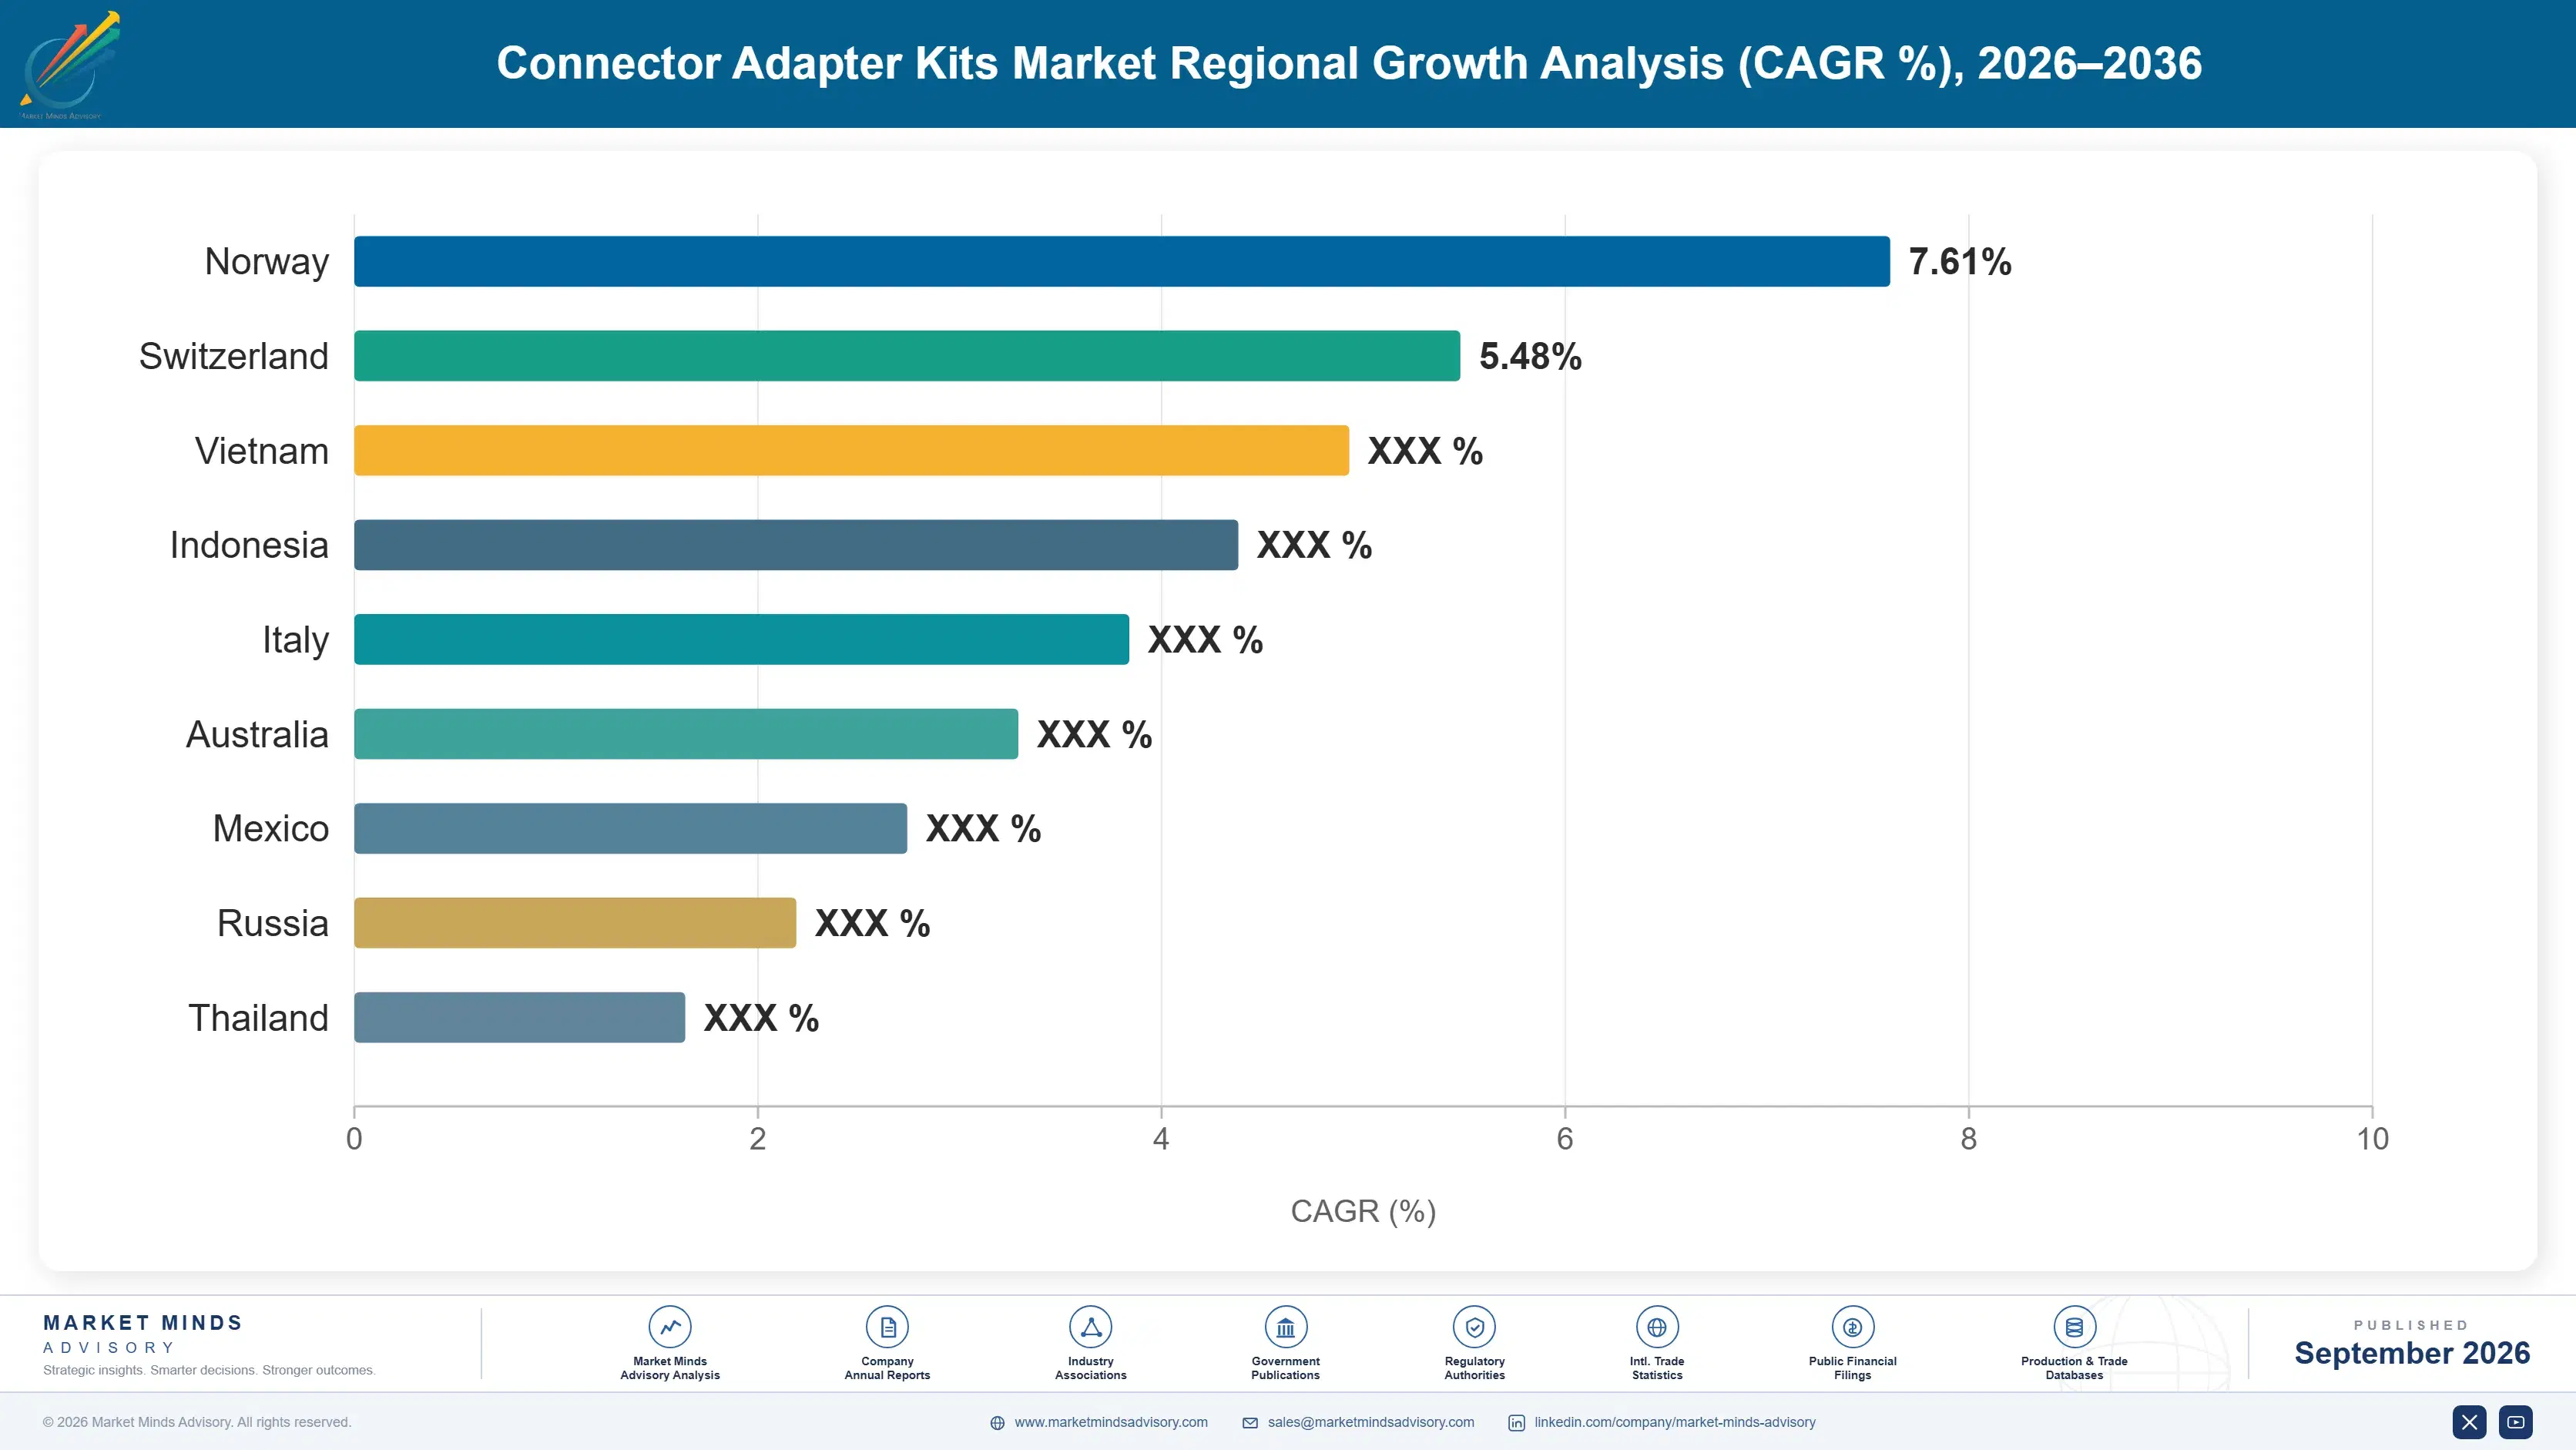
A maintenance engineer arriving at a cabinet cannot know in advance which connector variant the installation used, since builds spanning fifteen years and several contractors leave a mixture nobody documented completely. Fibre kits grow at 7.8% on that uncertainty alone. Indian growth of 9.4% leads every country covered, driven by deployment programmes running at enormous scale with maintenance forces built quickly behind them. The buyer specifies coverage rather than contents, because the alternative is a second site visit. Installation records that do exist are frequently wrong, which removes the last argument for carrying less.
Market Impact: Channel holds 63% of volume

Test Laboratories Buy Against Instrument Idle Cost

A missing adapter in a test laboratory idles instrumentation and engineers whose combined hourly cost runs around 47 times the price of the kit that would have prevented it. Laboratories therefore buy comprehensive RF and coaxial sets and accept that most contents will sit unopened, which is a rational decision rather than a procurement failure. This buyer is insensitive to kit price and highly sensitive to whether a supplier can ship the same day, which reshapes who wins the order. Suppliers quoting lead times lose these orders regardless of what they quote on price.
Market Impact: Only 34% ever used

Market Restraints and Challenges

Channel Inventory Absorbs And Distorts Real Demand

Around 63% of kits sit in distributor inventory before reaching a buyer, and the root cause is that end demand is genuinely unforecastable at the individual kit level, so somebody must hold stock speculatively. Commercially this means orders to manufacturers reflect distributor working capital decisions rather than field activity, and a stocking correction looks identical to a demand collapse. Suppliers respond with consignment arrangements, configure-to-order kitting that defers assembly, and shared demand data that shortens the correction. Manufacturers reading their own order book therefore see field activity through a distorting layer.
Market Impact: Prices reach USD 610 average

Utilisation Figures Invite Procurement Interference Later

Around 34% of a kit's contents are ever used, and the root cause is that buyers deliberately specify for improbable cases they cannot predict. Commercially the trouble comes when procurement discovers the figure and reduces kit scope to improve it, which works until the first missing adapter costs a return visit worth many times the saving. Suppliers respond by pricing coverage explicitly, publishing site revisit costs, and offering tiered kits that make the tradeoff visible rather than hidden. The saving is real and immediate; the cost arrives later and lands on operations rather than procurement.
Market Impact: Distributors carry 63% of kits
3 additional market trends, 4 additional growth drivers, and 2 additional restraints and challenges are covered in the full report. Contact sales@marketmindsadvisory.com to access the complete intelligence.

Segment CAGR and Growth Architecture

Segmentation follows interconnect domain. Six categories cover the market: RF and coaxial adapter kits, fibre optic adapter kits, industrial and circular connector kits, data and computing interface kits, audio, video and broadcast kits, and power and high-current connector kits. Cases, inserts, and labelling are counted within the kit they accompany rather than separately. Replenishment adapters sit within their kit category.
connector-adapter-kits-market-market-share-analysis-1790010094195

Fibre Optic Adapter Kits

Fibre kits grow at 7.8%, half again the market rate of 5.2%, because a maintenance engineer arriving at a cabinet genuinely cannot know which connector variant the installation used. Builds spanning fifteen years and several contractors leave mixtures nobody documented completely, and the documentation that does exist is frequently wrong. Deployment programmes in India, China, and across Southeast Asia have created large maintenance forces behind them, all facing the same uncertainty. Kits here carry more variants than any other category and command prices well above the market average, which buyers accept without much argument. Operators consolidating kit specification centrally are enlarging orders further. Prices here sit well above the market average and buyers accept that without much argument at all.
CAGR 7.8%

RF And Coaxial Adapter Kits

RF and coaxial kits grow at 6.1%, driven by test laboratories where a missing adapter idles instruments and engineers costing around 47 times the kit price per hour. That buyer is almost entirely insensitive to kit price and acutely sensitive to same-day availability, which decides who wins the order more often than specification does. Wireless infrastructure maintenance adds a second stream with the same unpredictability that drives fibre. Precision sets for laboratory metrology carry prices several times the general commercial equivalents, and utilisation there is never questioned by anybody. Suppliers quoting lead times lose these orders whatever they quote on price. Availability decides them, and it decides them quickly. Precision laboratory sets command real premiums.
CAGR 6.1%
Full segment breakdown across 6 segments available in the complete report.

Regional Architecture and Country Demand Map

Regional shares reflect where kits are bought and carried rather than where connectors are manufactured, and they follow field maintenance activity and test laboratory density more closely than industrial output. All seven regions sit inside the standard bands here. Revisit distance shapes specification more than budget does.

East Asia

China combines the largest connector manufacturing base anywhere with fibre and wireless build programmes running at a scale nothing else matches, and the maintenance forces behind those builds carry kits accordingly. Japanese and Korean electronics manufacturers operate dense test laboratory capacity where RF and coaxial sets are treated as consumables rather than assets. Taiwanese contract manufacturers add further laboratory demand. Growth of 6.2% runs above the world rate, and share of 28% is the highest of the seven regions. Domestic suppliers have taken most of the general commercial volume here. Branded suppliers hold the laboratory and qualified defence work while conceding general field volume, which is a pattern repeated across most of the region's larger markets.
Share: 28% | CAGR: 6.2% (2026 to 2036)

North America

Test laboratory density is the highest anywhere relative to population, spanning aerospace, defence, semiconductor, and communications equipment development, and those buyers treat kit price as immaterial against instrument idle cost. Defence maintenance adds qualified kits at prices several times commercial equivalents, with utilisation nobody questions. Growth of 4.5% is moderate, reflecting a mature field maintenance base rather than any weakness in demand. Distribution here is unusually well developed, and same-day fulfilment expectations are stricter than in any other region covered. Qualified defence kits carry documented traceability that takes years to establish, and the accounts renew through cycles that break ordinary commercial supplier relationships elsewhere in the region. Utilisation is never raised as an objection in those programmes.
Share: 26% | CAGR: 4.5% (2026 to 2036)
Regional intelligence for 5 additional markets available in the complete report: Western Europe, South Asia and Pacific, Latin America, Middle East and Africa, Eastern Europe. Contact sales@marketmindsadvisory.com.
connector-adapter-kits-market-country-cagr-analysis-1790010094722

Where Kit Suppliers Earn Most

Four commercial moves separate suppliers earning properly from those selling assembled boxes of parts at component margins. Each recognises that the buyer is purchasing the absence of a wasted site visit, and that the contents matter far less to them than the coverage does. Selling a parts list against a parts list is a losing argument here.

Price Coverage Explicitly Against Revisit Cost

Buyers pay around USD 610 for a kit against downtime costing roughly 47 times that per hour, yet suppliers routinely price on contents and then lose the argument when procurement discovers 34% utilisation. Suppliers who quantify site revisit cost in the customer's own terms, and price the kit against that rather than against a parts list, sustain gross margins 14 to 21 points above those defending contents. The work is commercial rather than technical and almost nobody does it properly. Buyers respond to it because operations already believes the argument and lacks the numbers.
Market Impact: Sustains gross margins 14 to 21 points higher

Own Same-Day Availability Rather Than Manufacturing

Around 63% of kits reach buyers through distributors because curation, speculative stocking, and same-day shipment are what buyers actually pay for, and connector manufacturers are rarely organised to provide any of it. Suppliers holding breadth and shipping same day win roughly 3.1 times more test laboratory orders than those quoting lead times, regardless of price. Concentration sits at only 39% precisely because inventory breadth rather than manufacturing scale decides the position here. Breadth is financed rather than engineered, which is a different business entirely from making connectors. Few manufacturers accept that.
Market Impact: Wins 3.1 times more orders from test laboratories

Configure Kits To Order Late In Assembly

Demand is genuinely unforecastable at the individual kit level, so somebody carries speculative inventory and absorbs the correction when working capital tightens across distribution. Suppliers deferring final kitting until the order arrives, while stocking components in common, reduce finished inventory by 28 to 37% without extending delivery beyond a day. It also allows kits to be tailored per customer, which raises price and makes the account considerably harder for a competitor to quote against. Working capital released this way funds the breadth that wins the same-day orders in the first place.
Market Impact: Reduces finished kit inventory by 28 to 37%

Build Qualified Kits For Defence Maintenance

Aerospace and defence maintenance kits carry documented traceability, qualified components, and controlled contents, and they sell at three to five times general commercial equivalents with utilisation nobody ever questions. Qualification takes years and considerable paperwork, which is exactly why the position holds once established. Suppliers with qualified lines report those accounts renewing at far higher rates than commercial ones, since requalifying an alternative supplier costs the customer more than the kits themselves do. Qualified accounts renew at roughly 2.8 times commercial renewal rates on that basis alone. Commercial lines hold nothing comparable.
Market Impact: Prices run 3 to 5 times commercial equivalents

Who Controls the Margin Pool

Concentration is low for an interconnect category. Five suppliers hold 39% of kit revenue, measured consistently on that basis across all participants, and the position that matters is inventory breadth and fulfilment speed rather than manufacturing scale. Large connector manufacturers coexist with catalogue distributors and specialist kit assemblers who make nothing at all and compete effectively regardless.
Competition currently turns on three things: breadth of stocked variants, same-day shipment reliability, and qualification credentials for defence and aerospace maintenance work. Price decides the general commercial volume, where regional assemblers compete hard, but it barely features in laboratory and defence purchasing where idle cost dominates every other consideration. Configuration against a documented operator specification has become a fourth dimension as network operators consolidate kit definition centrally rather than leaving it to regional teams.

Pressure comes from two directions. Catalogue distributors keep extending private label kit ranges that bypass connector manufacturers entirely. Meanwhile regional assemblers serve price-driven field maintenance at costs branded suppliers cannot match. Rankings will shift toward participants owning fulfilment and curation, because that is what buyers are paying for and always were. Manufacturers without a fulfilment position are weakest here.
connector-adapter-kits-market-company-positioning-matrix-1790010095250

Competitive Moat and Risk Dimensions

TE CONNECTIVITY

Moat: Breadth Across Interconnect Domains

A component range spanning RF, industrial, fibre, and data interfaces lets the company assemble kits covering mixed installations that narrower suppliers cannot address from their own catalogue. Field engineers encountering several domains on one site value that single-source coverage, and it is difficult to replicate without an equivalent component portfolio behind it.
TE CONNECTIVITY

Risk: Fulfilment Speed Against Distributors

Same-day shipment against unpredictable individual demand is a distribution capability rather than a manufacturing one, and catalogue houses have built it more effectively over decades of practice. Test laboratory buyers indifferent to price but not to lead time will take a distributor's private label kit without hesitation, and increasingly do.
AMPHENOL

Moat: Qualified Defence And Aerospace

Qualification credentials for defence and aerospace maintenance kits take years and considerable documentation to establish, and they support prices three to five times general commercial equivalents with utilisation nobody questions. Customers requalifying an alternative supplier face costs exceeding the kits themselves, which holds those accounts firmly through renewal after renewal.
AMPHENOL

Risk: Commercial Volume Price Exposure

General field maintenance kits face regional assemblers with no brand cost, no qualification overhead, and delivered prices the company cannot match while carrying its own structure. That volume is substantial and growing fastest in exactly the regions where price sensitivity is most severe, and defending it profitably is not realistic.

Players Tracked

Prominent Players

TE Connectivity
Amphenol
Molex
Pasternack
Rosenberger

Other Key Players

HUBER+SUHNER
Radiall
Fairview Microwave
L-com
Times Microwave Systems
Southwest Microwave
Maury Microwave
Smiths Interconnect
Hirose Electric
JAE
Bel Fuse
Anritsu
Corning
Senko Advanced Components
Diamond SA

Recent Developments

APRIL 2026

Pasternack Extends Same-Day Shipping Stock Across Fibre Adapter Ranges

Pasternack expanded stocked fibre adapter variants held for same-day shipment, an organic inventory investment funded internally, after laboratory and field customers cited lead time rather than price as the reason orders went elsewhere. Fibre variants were prioritised because installation records at customer sites proved least reliable across that domain.
Signal: Availability rather than specification decides these orders, which favours distribution economics over manufacturing scale considerably. Manufacturing scale decides little.
NOVEMBER 2025

Amphenol Acquires Specialist RF Adapter And Passive Component Maker

Amphenol completed an acquisition of a specialist RF adapter and passive component manufacturer, adding precision laboratory variants and qualified defence maintenance ranges that had previously been sourced externally for its own kit assemblies. The qualification credentials attached to those ranges take years to establish independently, which the company cited directly.
Signal: Qualified and precision ranges are being bought rather than developed, because the qualification timeline is prohibitive.
JULY 2025

HUBER+SUHNER Signs Field Maintenance Kit Supply Agreement With Network Operator

HUBER+SUHNER entered a multi-year supply agreement providing configured fibre maintenance kits to a European network operator, replacing an arrangement where regional teams had specified and purchased kits independently of one another. Contents are configured per region against documented installed equipment rather than issued as one standard national set.
Signal: Operators are consolidating kit specification centrally, which favours suppliers able to configure per region. Individual engineers specify less now.

What A Kit Actually Costs

Three input groups dominate cost. Brass, beryllium copper, and stainless bar stock run 24% to 31% of cost of goods sold from East Asian and European mills. Precision machining and plating take 28% to 36%, with gold plating on contact surfaces the single most volatile line inside that range. Cases, foam inserts, labelling, and the kitting labour itself add 14% to 20%, which is higher than most buyers assume.
Gold prices rose sharply through 2024 and 2025, and International Monetary Fund commodity data recorded the movement across both years. Several connector manufacturers described the plating cost effect directly in their annual reports for that period. Adapter kits felt it more than cable assemblies, because a kit contains many small plated parts and the plating cost does not scale down with the size of the component involved.

The competitive disadvantage mechanism runs through inventory carrying cost rather than manufacturing efficiency. A supplier holding breadth against unforecastable demand finances stock that turns slowly, and that carrying cost decides who can promise same-day shipment profitably. Exposure varies by participant type. Distributors with wide catalogues spread the cost across many categories, while specialist assemblers carry narrow stock at full cost.
connector-adapter-kits-market-cost-volatility-analysis-1790010095449

Defer Final Kitting Until The Order Arrives

Finished kits turn slowly because demand cannot be forecast at the individual configuration level, while the components inside them are common across many kits. Stocking components rather than assemblies and kitting on receipt of order reduces finished inventory substantially without extending delivery, and it allows per-customer tailoring that raises price at the same time.

Specify Plating Thickness Against Actual Mating Cycles

Gold plating is the most volatile cost line in the kit and it is routinely specified far beyond what an adapter used a handful of times will ever require. Matching thickness to realistic mating cycles for each kit category reduces exposure to precious metal movement without any effect on field performance or expected service life.

Spread Inventory Cost Across Adjacent Catalogue Categories

A supplier carrying breadth in one narrow category finances slow-turning stock at full cost and absorbs every distribution correction directly. Participants whose kit inventory sits within a wider catalogue spread that carrying cost across faster-moving lines, which is the practical reason distribution economics beat manufacturing economics in this category. Specialist assemblers feel every correction directly.

Portfolio Architecture for Margin Defence

Margin follows what the kit protects rather than what it contains. General commercial field kits are close to commodity, with regional assemblers competing on delivered price and buyers comparing parts lists. Laboratory precision sets earn better, because instrument idle cost makes price immaterial. Qualified defence and aerospace kits earn most of all, and their prices bear no relation to the components inside them.
The tension between volume and premium runs through who bears the consequence of a missing adapter. A field engineer at an urban site loses an hour and the buyer treats kits as consumables bought on price. A laboratory or a remote energy site loses far more, and those buyers specify comprehensively and stop negotiating. The two populations behave as though they were in separate markets entirely.

High-value pools concentrate where the revisit cost is severe or where qualification is mandatory: defence maintenance, aerospace line support, remote energy and utility field work, and laboratory metrology. Utilisation is never raised as an objection in any of them. Where a replacement adapter can be obtained within an hour, kits become a parts list and get priced exactly that way.

Volume / Commodity-Adjacent

General commercial field maintenance kits sold on contents and delivered price, where regional assemblers compete hard and buyers compare parts lists directly. The ten-point range reflects inventory carrying position rather than any product difference between the participants involved.
Gross Margin: 22% to 32%

Premium / Certified

Laboratory precision sets and configured operator maintenance kits where instrument idle cost or revisit distance makes price immaterial to the buyer. The ten-point range separates suppliers offering same-day availability from those quoting lead times against the same specification.
Gross Margin: 42% to 52%

Sustainability / Regulatory / Next-Generation

Qualified defence and aerospace maintenance kits with documented traceability and controlled contents, priced at three to five times commercial equivalents. The fourteen-point range reflects how differently qualification depth and contract terms are recognised across programmes and regions.
Gross Margin: 56% to 70%
connector-adapter-kits-market-portfolio-architecture-1790010095952

High-value Sub-segments and Strategic Watch-out

Qualified Defence Maintenance Kits

Highest value in the category, priced at three to five times commercial equivalents with utilisation nobody questions and requalification costs that hold accounts firmly. The fourteen-point range reflects differences in qualification depth and contract structure across national programmes and prime contractors. Renewal rates run far above commercial accounts.
Gross Margin: 58% to 72%

Fibre Field Maintenance Kits

Fastest growth at 7.8%, driven by installations no engineer can predict and documentation that is frequently wrong or missing entirely. The ten-point range separates suppliers configuring kits per operator from those shipping standard sets against a general specification. Central specification is enlarging orders steadily. Configuration depth decides them.
Gross Margin: 44% to 54%

Laboratory Precision Adapter Sets

Volume core among test buyers who treat kit price as immaterial against instrument idle cost running near 47 times hourly. The ten-point range reflects same-day availability rather than specification, which decides these orders more often than anything else. Breadth is financed rather than engineered here.
Gross Margin: 46% to 56%

General Commercial Field Kits

The strategic watch-out. Regional assemblers carry no brand cost, buyers compare parts lists directly, and procurement raises utilisation as an objection wherever the revisit consequence is mild. The ten-point range reflects inventory position and nothing commercially defensible. Utilisation objections land hardest in exactly this tier. Nothing defends it.
Gross Margin: 20% to 30%

How Kit Revenue Repeats

Kits replace on roughly a 4.2 year cycle, which is short for a durable product and is driven by loss, damage, and contamination rather than by wear. Individual adapter replenishment recurs continuously between those replacements and is worth more in aggregate than most suppliers recognise, since it arrives without any selling effort. Suppliers who let replenishment go to whoever ships fastest have given away the profitable half of the relationship.
Attachment depth follows configuration rather than brand. An operator whose kits are configured to its own regional specification, with contents documented and replenishment tied to that specification, does not switch without redoing the specification work. A buyer purchasing a standard catalogue kit has no attachment at all and orders from whoever has stock today, which describes most general commercial volume.

The buyer has moved from the individual engineer toward centralised operations procurement. Field engineers once specified their own kits and bought locally, and some still do. Network operators and defence primes now specify centrally and configure per region, which favours suppliers able to hold a documented specification and replenish against it consistently. Suppliers selling to individual engineers are addressing a buyer with steadily less authority.
connector-adapter-kits-market-end-use-penetration-index-1790010096442

Where This Market Rewards

These are among the four positions where our research anticipates prominent divergence between winners and laggards over the coming forecast period. Each is grounded in the demand model, the regulatory perimeter, and the announced capacity pipeline.
01 / REVISIT COST PRICING

The kit is insurance, so price it that way

Buyers pay roughly USD 610 against downtime costing about 47 times that per hour, yet suppliers price on contents and then lose the argument the moment procurement discovers utilisation runs near 34%. Those quantifying revisit cost in the customer's own terms and pricing against it sustain gross margins 14 to 21 points above suppliers defending a parts list. The work is commercial rather than technical, and remarkably few participants do it at all, even though operations already believes the argument and simply lacks the evidence.
02 / FULFILMENT OVER MANUFACTURING

Stock today beats a better adapter tomorrow

Around 63% of kits reach buyers through distributors because curation, speculative stocking, and same-day shipment are what the purchase is genuinely for. Suppliers holding breadth and shipping same day win roughly 3.1 times more laboratory orders than those quoting lead times at any price. Concentration sits at only 39% for exactly this reason, and manufacturing scale has never been the position that decided outcomes here, and the participants who understood that earliest hold the strongest positions today, which is a durable commercial advantage in their favour.
03 / QUALIFICATION BARRIER BUILDING

Years of paperwork buy a decade of renewals

Defence and aerospace maintenance kits sell at three to five times commercial equivalents with utilisation nobody raises, and the qualification behind them takes years of documentation to establish. That timeline is the barrier rather than any product capability the supplier holds. Customers requalifying an alternative face costs exceeding the kits themselves, which is why these accounts renew through cycles that break commercial relationships elsewhere, and the barrier grows rather than eroding as documentation requirements tighten across every programme covered here.
04 / LATE STAGE CONFIGURATION

Stock components, not finished kits

Individual kit demand cannot be forecast, so finished assemblies turn slowly and every distribution working capital correction lands directly on whoever holds them. Deferring final kitting until the order arrives, while stocking components in common, reduces finished inventory by 28 to 37% without extending delivery beyond a day. It also permits per-customer configuration, which raises price and makes the account considerably harder to quote against, and it funds the breadth that wins same-day orders in the first place, which compounds year after year.

Engagement Snapshot From the Field

A live engagement with an industry participant carrying material or product regulatory and market exposure ahead of a defining policy shift, showing how our research translates into a defensible multi-year portfolio strategy.
MARKET MINDS ADVISORY · CLIENT ENGAGEMENT SUMMARY
Connector Adapter Kits Producer Strategic Portfolio Review and Transition Roadmap 2026·Investment Scenario on Connector Adapter Kits Exposure Evaluation 2025-26
CLIENT PROFILE
A national fixed and mobile network operator running field maintenance across roughly 2,900 engineers in eleven regional operations, with annual spend on adapter kits and replenishment of approximately USD 6.8 million (client-reported, unverified by MMA). Each region had specified and purchased its own kits independently for more than a decade, with no shared documentation. Nobody centrally knew what any region carried.
STRATEGIC CHALLENGE
Procurement had found kit utilisation running near a third and proposed cutting scope by half across all regions. Field operations resisted, citing revisit costs nobody had quantified, and the argument had run for two years without resolution because neither side possessed the evidence to settle it either way. The board had asked twice for a recommendation.
MMA APPROACH
MMA sampled kit contents against six months of actual job records across four regions, measured how often a missing adapter caused a revisit, and priced those revisits against the cost of the contents procurement wanted to remove. Regional specification differences were compared to identify what was genuinely local. Replenishment order patterns were traced across every supplier used.
KEY FINDINGS
  1. Utilisation measured 31% across sampled kits, close to procurement's figure, but revisits caused by missing adapters cost 9.4 times the value of all unused contents combined.
  2. Only 22% of the variation between regional kit specifications reflected genuinely different installed equipment; the remainder was individual preference accumulated over many years.
  3. Replenishment orders went to whichever supplier had stock, spreading spend across 34 vendors and forfeiting every volume term the operator could have negotiated centrally.
  4. Fibre variants accounted for 71% of missing-adapter revisits, concentrated in areas built by contractors whose installation records were incomplete or simply wrong.
CLIENT PROFILE
A national fixed and mobile network operator running field maintenance across roughly 2,900 engineers in eleven regional operations, with annual spend on adapter kits and replenishment of approximately USD 6.8 million (client-reported, unverified by MMA). Each region had specified and purchased its own kits independently for more than a decade, with no shared documentation. Nobody centrally knew what any region carried.
STRATEGIC CHALLENGE
Procurement had found kit utilisation running near a third and proposed cutting scope by half across all regions. Field operations resisted, citing revisit costs nobody had quantified, and the argument had run for two years without resolution because neither side possessed the evidence to settle it either way. The board had asked twice for a recommendation.
MMA APPROACH
MMA sampled kit contents against six months of actual job records across four regions, measured how often a missing adapter caused a revisit, and priced those revisits against the cost of the contents procurement wanted to remove. Regional specification differences were compared to identify what was genuinely local. Replenishment order patterns were traced across every supplier used.
KEY FINDINGS
  1. Utilisation measured 31% across sampled kits, close to procurement's figure, but revisits caused by missing adapters cost 9.4 times the value of all unused contents combined.
  2. Only 22% of the variation between regional kit specifications reflected genuinely different installed equipment; the remainder was individual preference accumulated over many years.
  3. Replenishment orders went to whichever supplier had stock, spreading spend across 34 vendors and forfeiting every volume term the operator could have negotiated centrally.
  4. Fibre variants accounted for 71% of missing-adapter revisits, concentrated in areas built by contractors whose installation records were incomplete or simply wrong.
RECOMMENDED STRATEGY
Phase 1: Phase one: build one national kit specification covering genuinely common requirements, with a documented regional supplement only where installed equipment actually differs. Phase 2: Phase two: consolidate replenishment with two suppliers against that documented specification, trading volume for same-day availability commitments rather than for unit price. Phase 3: Phase three: expand fibre variant coverage in regions with poor installation records, funded from the savings that specification consolidation releases.
OUTCOME
Missing-adapter revisits fell 62% within three quarters of the specification change (client-reported, unverified by MMA). Total kit and replenishment spend rose 4% while field productivity gains were valued at several times that. Supplier count fell from 34 to two under negotiated availability terms. Fibre variant coverage widened in the four worst-documented regions.

Frequently Asked Questions

Foundational context covering the market sizes, CAGR, scope, country, region and competition that inform every finding below. This section is provided to cover basics and most often pre-purchase conversations, answered from the MMA Primary Research Dataset.

What is the current size of the Connector Adapter Kits Market?

The market was worth USD 1.8 billion in 2025 and reaches USD 1.9 billion in 2026. Value covers pre-assembled adapter kits including their cases and inserts.

How large will the Connector Adapter Kits Market be by 2036?

MMA forecasts USD 3.2 billion by 2036, an increase of USD 1.3 billion across the forecast period. That represents 1.68 times the 2026 base of USD 1.9 billion.

What is the CAGR for the Connector Adapter Kits Market 2026 to 2036?

The base case compound annual growth rate is 5.2%, with a bull case at 6.4% and a bear case at 4.0%. Historical growth from 2020 to 2025 ran at 4.1%.

Which segment is growing fastest?

Fibre optic adapter kits grow at 7.8%, half again the market rate of 5.2%. Engineers cannot predict which connector variant a cabinet will present, so they carry everything.

Who are the major companies in the Connector Adapter Kits Market?

TE Connectivity, Amphenol, Molex, Pasternack, and Rosenberger lead, together holding 39% of kit revenue. Concentration is low because distribution breadth rather than manufacturing scale decides position here.

Which country is growing fastest?

India grows at 9.4%, driven by fibre deployment at enormous scale with maintenance forces equipped quickly behind it and installation records that are frequently incomplete.

Report Segmentation Architecture

The full report scope spans multiple orthogonal segmentation dimensions, with cross-tabulated demand data provided for each dimension pair. Coverage extends further to regional breakdowns, trend trajectories, and the competitive detail needed to support segment-level decision-making.

By Interconnect Domain

  • RF and Coaxial Adapter Kits
  • Fibre Optic Adapter Kits
  • Industrial and Circular Connector Kits
  • Data and Computing Interface Kits
  • Audio, Video and Broadcast Kits
  • Power and High-Current Connector Kits

By End-Use Industry

  • Telecommunications and Network Operations
  • Aerospace and Defence Maintenance
  • Test Laboratories and Metrology
  • Industrial Automation and Process
  • Energy, Utilities and Mining
  • Broadcast, Media and Live Events

By Commercial Dimension

  • Catalogue Distributor Supply
  • Direct Manufacturer Purchase
  • Configured Operator Contract
  • Qualified Programme Supply
  • Online Retail and Marketplace
  • Replenishment and Consumable Order

By Region

  • East Asia
  • North America
  • Western Europe
  • South Asia and Pacific
  • Latin America
  • Middle East and Africa
  • Eastern Europe

Scope, Methodology, and Coverage

Every figure in this report is reproducible from documented input assumptions. The scope below maps the historical period, the forecast horizon, the segmentation dimensions, and the countries covered, alongside the underlying primary and qualitative methodology.
Historical Period
2020 to 2025
Forecast Period
2026 to 2036
Base Year
2025 (USD billions; MMA Primary Research Dataset, September 2026)
Market Definition
This market covers pre-assembled sets of interconnect adapters supplied as kits, including RF and coaxial adapter kits, fibre optic adapter kits, industrial and circular connector kits, data and computing interface kits, audio, video and broadcast kits, and power and high-current connector kits, together with the cases, inserts, and labelling supplied with them. It excludes individually sold connectors, cable assemblies, connector tooling and crimping equipment, test instruments, and permanently installed patching hardware.
Quantitative Units
USD billions, kit and replenishment revenue
Segmentation Dimensions
Interconnect domain, end-use industry, commercial dimension, region
Regions Covered
East Asia, North America, Western Europe, South Asia and Pacific, Latin America, Middle East and Africa, Eastern Europe
Countries Covered
China, Japan, South Korea, Taiwan, United States, Canada, Mexico, Germany, United Kingdom, France, Italy, Sweden, Netherlands, Switzerland, Spain, India, Indonesia, Vietnam, Thailand, Australia, Brazil, Mexico, Colombia, Chile, Saudi Arabia, United Arab Emirates, Nigeria, South Africa, Poland, Romania
Key Companies Profiled
TE Connectivity, Amphenol, Molex, Pasternack, Rosenberger, HUBER+SUHNER, Radiall, Fairview Microwave, L-com, Times Microwave Systems, Southwest Microwave, Maury Microwave, Smiths Interconnect, Hirose Electric, JAE, Bel Fuse, Anritsu, Corning, Senko Advanced Components, Diamond SA
Quantitative Methodology
Primary survey, n=3,800 respondents, Q4 2025, six countries; demand-side model with trade association cross-validation
Qualitative Methodology
47 expert interviews, Q4 2025; applied to validate demand model assumptions, identify emerging dynamics, and assess competitive positioning
Report Format
PDF and XLSX data workbook (Word format preview document)
Publisher
Market Minds Advisory
Report Code
MMA-2026-TEC-691
Published
September 2026
Contact
sales@marketmindsadvisory.com | www.marketmindsadvisory.com

Purchase the full Connector Adapter Kits Market Report (2026 to 2036).

The full report sizes the connector adapter kit market across six interconnect domains, seven regions, and thirty countries, with forecasts to 2036 under base, bull, and bear cases. It examines why utilisation near a third is a rational buying outcome rather than waste, how standards convergence enlarged kits instead of shrinking them, and why distribution economics beat manufacturing economics in this category. Competitive analysis covers twenty participants evaluated consistently on kit revenue, with detailed treatment of fulfilment speed and qualification barriers. Cost structure, margin architecture, and regional field maintenance drivers are analysed throughout. Primary research includes 3,800 survey responses and 47 expert interviews.
Six interconnect domains sized and forecast separately
Twenty participants evaluated on kit and replenishment revenue
Regional field maintenance drivers across seven distinct geographies
Margin architecture by kit category and qualification status
Utilisation and revisit cost benchmarking across operator fleets
Inventory carrying economics compared across distribution and manufacturing models

Built For The People Who Decide

From boardroom strategy to bench-side execution, this report is read cover-to-cover by leaders shaping the next decade of their industry, turning demand scenarios, market dynamics and valuation benchmarks into decisions.
CXOs/ Presidents/ VPs/ Managers
M&A and Corporate Development
Strategy Teams and R&D Heads
Procurement and Product Directors
Regulatory and Compliance Leaders
Investor Relations and Equity Analysts