Market Minds Advisory
Connected Logistics Market

Connected Logistics Market: Connected Logistics Market. Real-Time Visibility Platforms Redefine Freight Coordination

Shippers demanding minute-by-minute cargo visibility and carriers facing tightening capacity are colliding as IoT sensor networks and telematics platforms scale fast enough to make blind, paperwork-based freight tracking commercially obsolete.

Lead Analyst

Published

September 2026

Make Smarter Decisions with Customized Research Insights

Request a free sample report and evaluate market opportunities, growth trends, and competitive dynamics relevant to your business needs.

2025 MARKET VALUE$9.2BMarket Size 2025
2036 FORECAST VALUE$37.0BBase Case , 2026 to 2036
CAGR 2026 TO 203613.5 %Bull 14.8% / Bear 12.2%
INCREMENTAL OPPORTUNITY$26.6BNet 10- year value creation
EXPANSION MULTIPLE3.55x2036 value over 2026 base
Strategic Levers
M&A Pipeline
Regional Outlook
Country Rankings
Competitive Intelligence
Segmental Deep-dive
Call-Us : 91 93563 13602

Executive Snapshot and Market Trajectory.

Shippers are demanding minute-by-minute cargo location and condition data as a contract precondition, forcing carriers without connected tracking hardware out of premium freight lanes entirely and into low-margin spot market work. Visibility has become a baseline requirement rather than a differentiator across most enterprise freight contracts.
Real-time visibility platforms are pulling capital away from legacy electronic logging device vendors as freight brokers and retailers push connected sensor requirements deep into multi-tier supplier contracts, and East Asian exporters are adopting connected container tracking fastest given their outsized share of global containerized freight volume. Cold chain pharmaceutical and food shippers are driving the sharpest near-term hardware spending as spoilage liability costs make sensor-equipped trailers a clear investment case rather than a discretionary upgrade.
A small number of platform vendors dominate enterprise freight visibility contracts, but a wave of hardware-focused sensor specialists is entering from the telematics side rather than the software side, changing who counts as a credible competitor. Emissions reporting mandates taking effect across multiple jurisdictions are forcing shippers to instrument freight movements they previously tracked only loosely, adding a new category of connected logistics demand.
Market Definition
This report covers software platforms and IoT hardware enabling real-time tracking, condition monitoring, and coordination of freight shipments across road, rail, ocean, and air transport, measured on a global software and hardware revenue basis. It excludes core transportation management system modules and warehouse management software not specifically tied to in-transit shipment visibility.
Base Year Value
$9.2B in 2025 (MMA Primary Research Dataset, September 2026)
Forecast Period
2026 to 2036, eleven discrete annual values
CAGR
13.5% base case. Bull 14.8%. Bear 12.2%.
Fastest Growth Segment
Real-Time Freight Visibility Platforms: 19.5% CAGR
Fastest Growth Country
Vietnam: 20.0% CAGR
Fastest Growth Region
South Asia and Pacific: 15.8% CAGR
Largest Region
East Asia: 30% of 2025 global value
Market Leaders
Project44, FourKites, Samsara, Trimble, Descartes Systems
Primary Survey
n=3,800 procurement and R&D decision-makers, Q4 2025, six countries
Methodology
Demand-side build-up, cross-validated against public data, 47 expert interviews

Connected Logistics Market Forecast Scenarios

connected-logistics-market-size-forecast-scenario-1788417072867
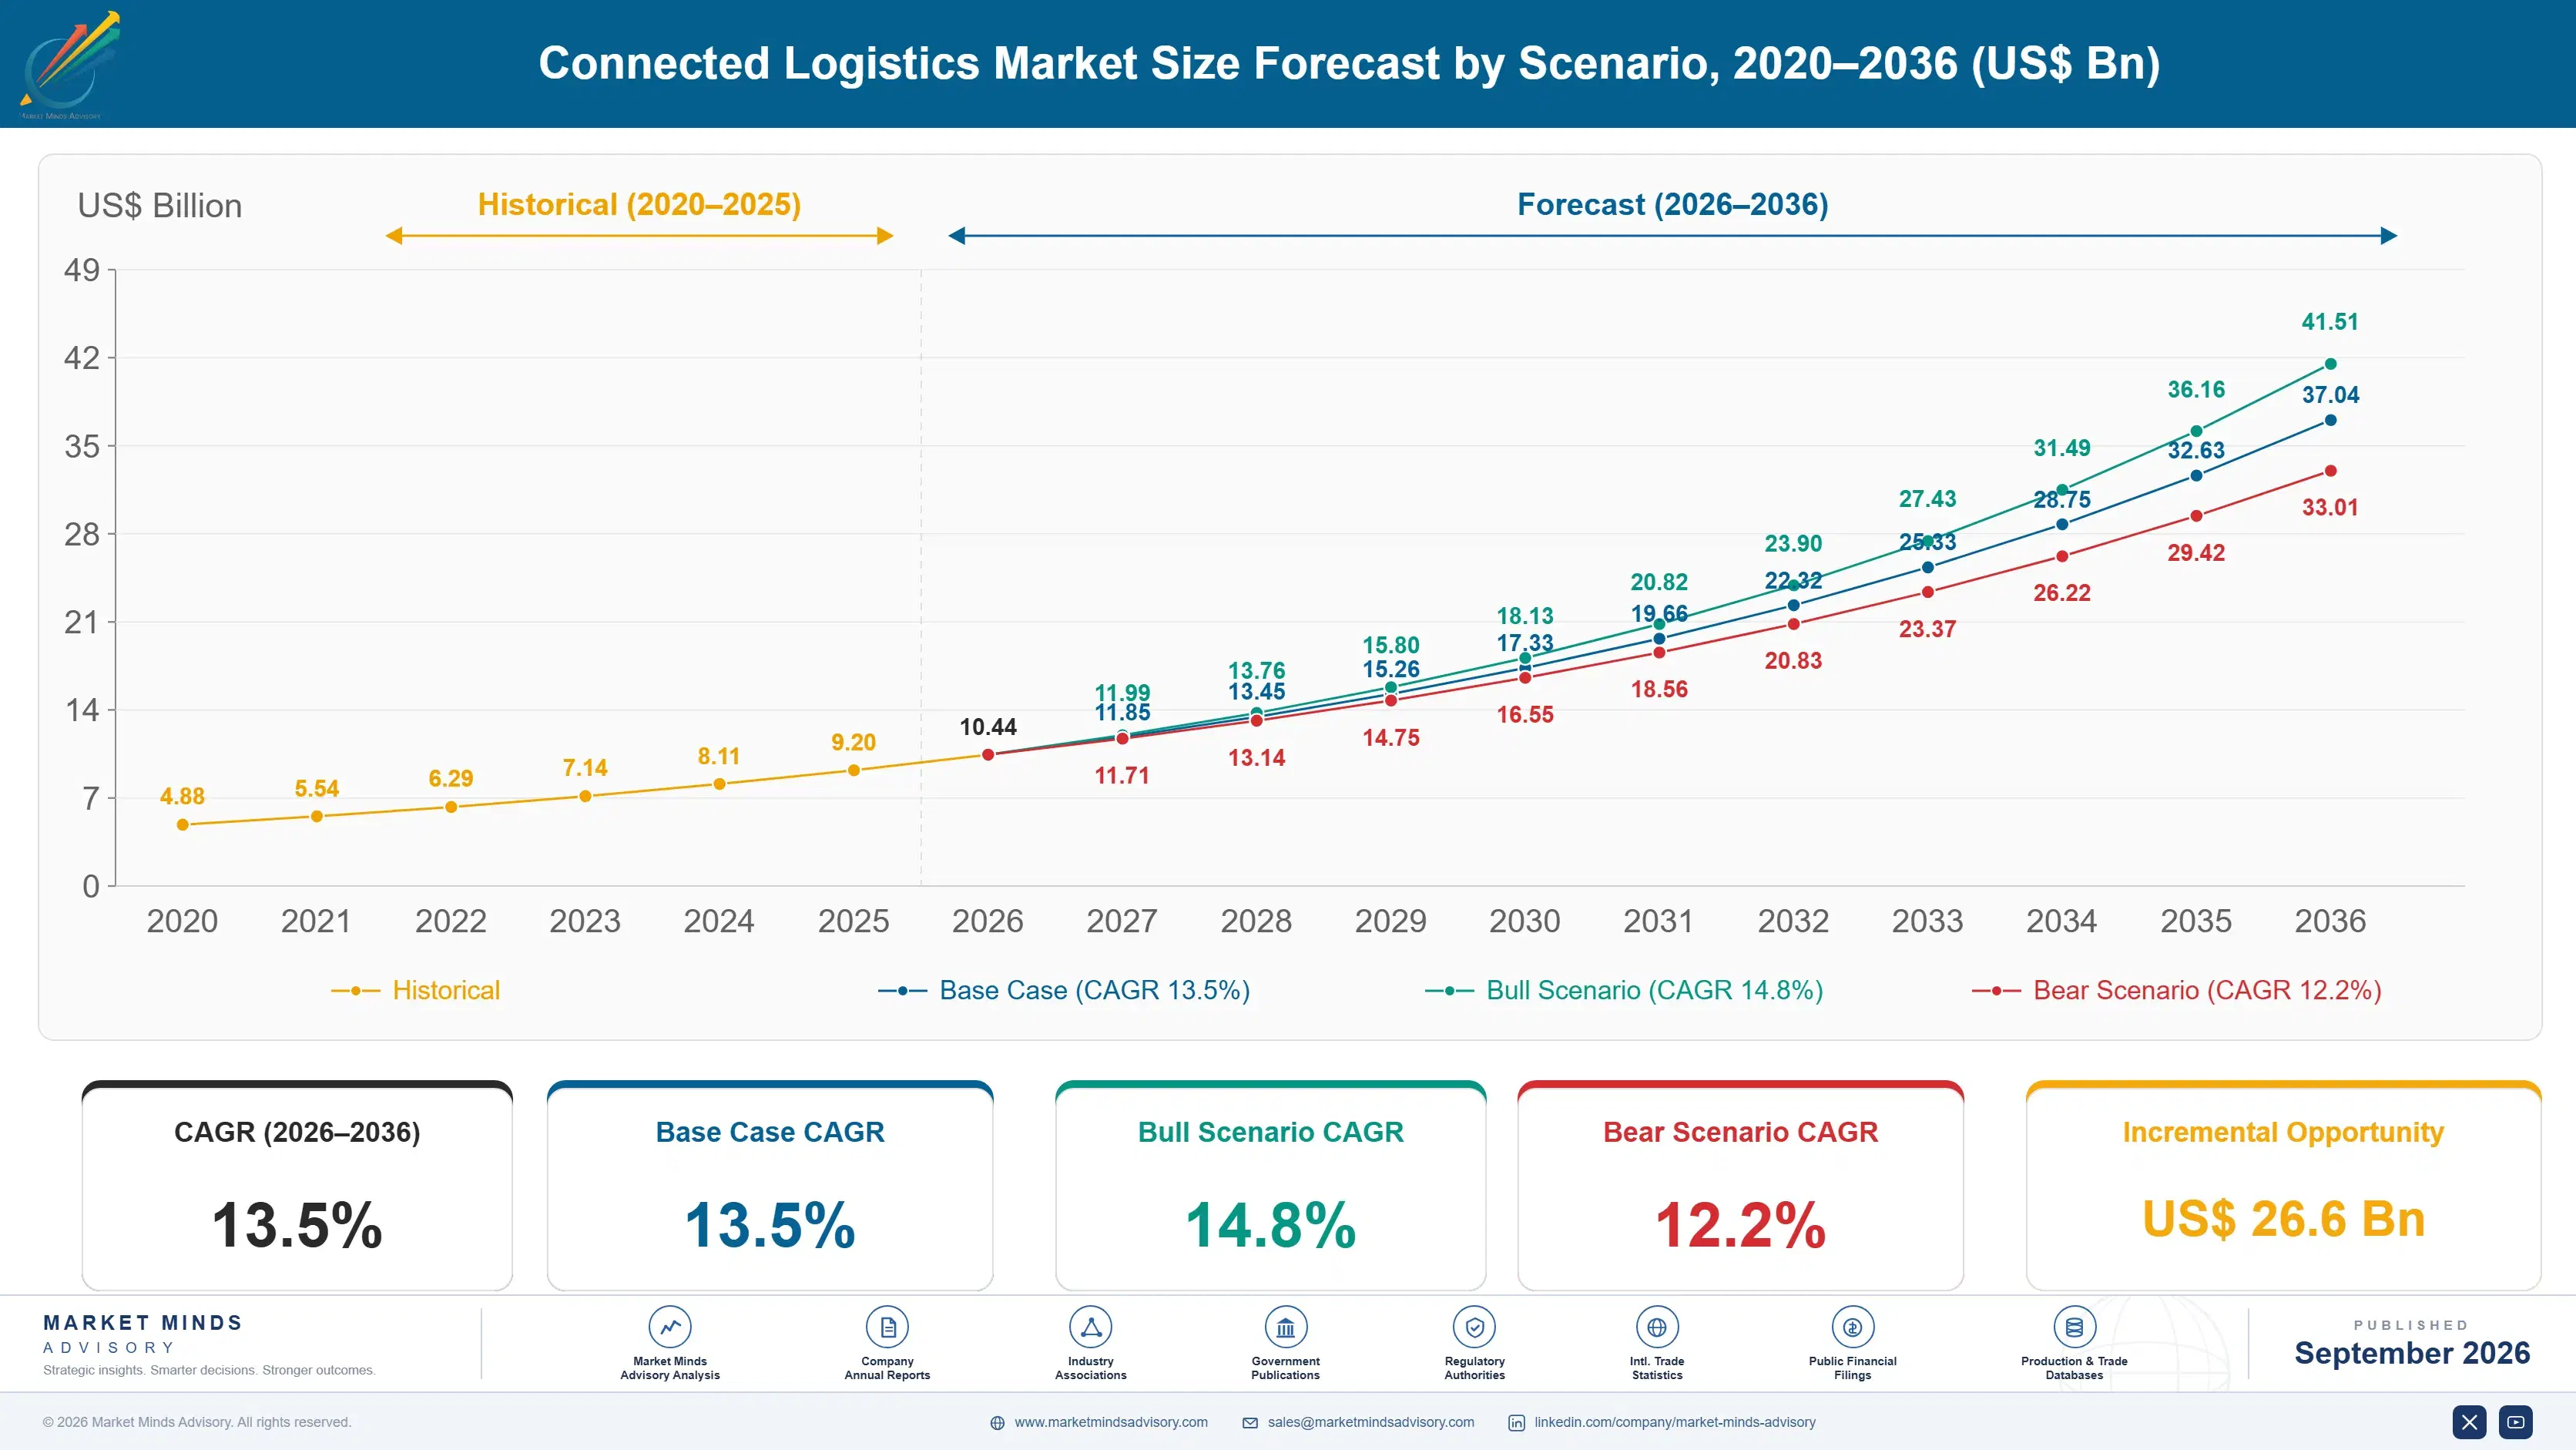
Between 2020 and 2025 the connected logistics market grew at roughly 12.2 percent annually as pandemic-era supply chain disruption exposed how little visibility most shippers actually had into in-transit cargo. Emergency capacity shortages during that period pushed even conservative logistics buyers to adopt tracking hardware they had previously viewed as an entirely unnecessary added cost.
The base case assumes continued strong double-digit expansion as three commercial mechanisms compound: large retailers push connected sensor requirements into multi-tier supplier contracts as a condition of doing business, emissions reporting mandates force shippers to instrument freight movements they previously tracked only loosely, and telematics hardware costs keep falling enough to make sensor deployment economical even on lower-value freight lanes. Freight brokers respond by building visibility data into their core matching platforms rather than treating it as an add-on service.
The bull case centers on a critical mass of retailers making connected tracking a hard contract requirement across their entire supplier base within the next several years, forcing rapid adoption. The bear case centers on freight rate volatility squeezing carrier margins so severely that many smaller operators delay hardware investment indefinitely, slowing fleet-wide adoption well below the pace larger, better-capitalized carriers are already achieving.

Freight Visibility Becomes a Software Layer, Not Hardware

Connected logistics vendors are no longer selling tracking devices, they are selling a data layer that sits on top of freight movement, and that shift is rewriting who counts as a credible supplier to a large shipper. A pure hardware maker cannot win a contract that now requires predictive analytics and exception management dashboards built on top of the raw location data.
MARKET CONCENTRATION34% CR5Top five vendors hold a modest share of total revenue
AVERAGE SENSOR UNIT COST$85 per tracking deviceHardware cost has fallen sharply over recent years industry-wide
OCEAN FREIGHT TRADE INTENSITY60% of containers now trackablePortion of global container shipments carrying connected tracking hardware
COLD CHAIN SENSOR PENETRATION48% of refrigerated trailersShare of temperature-sensitive freight fitted with condition monitoring sensors
PLATFORM SUBSCRIPTION ATTACH RATE55% of enterprise shippersPortion of large shippers paying for a visibility software subscription
AVERAGE CONTRACT LENGTHThree years per enterprise dealTypical duration of a connected logistics platform service agreement
Vendors that historically sold pure hardware are being squeezed out unless they build or acquire a software analytics layer, since large shippers increasingly buy visibility as a service rather than procuring sensors and platforms from separate suppliers through separate contracts. Several device-only manufacturers have already exited direct enterprise sales entirely, choosing instead to sell hardware wholesale to the software platforms that now own the customer relationship.
Telematics companies originally focused on vehicle fleet management are moving directly into freight visibility, competing with software-first platform vendors who never built hardware themselves, creating a market where neither pure hardware nor pure software positioning is defensible alone anymore. Shippers increasingly evaluate vendors on integration breadth across ocean, rail, and road modes rather than depth within a single transport mode, a criterion that barely mattered in procurement decisions a decade ago.
"A tracking device without a data platform behind it is just an expensive sticker. The device was never the product, the visibility was."
Practice Lead, Supply Chain Technology · MMA IoT-Enabled Supply Chain and Freight Technology Software Practice · September 2026

Market Trends

Retailers Mandate Connected Tracking Across Supplier Networks

Large retailers are writing connected tracking requirements directly into supplier logistics contracts, forcing even small regional carriers to adopt sensor hardware to remain eligible for premium freight lanes. Walmart's supplier logistics program now requires real-time shipment visibility across a large majority of its inbound freight volume, a mandate other major retailers are replicating at pace. This shift is pulling adoption down through multiple tiers of the carrier base that would otherwise have had no independent commercial reason to invest in tracking hardware, since the smallest regional operators rarely serve end customers directly.
Market Impact: Unit cost falls under 90 dollars
Emissions Reporting Rules Force Freight Movement Instrumentation

Regulatory reporting requirements under frameworks including the European Union's Corporate Sustainability Reporting Directive now require large shippers to disclose transport-related emissions with a level of granularity that manual estimation cannot credibly support. Over 50,000 companies across the European Union alone fall under expanded sustainability disclosure rules taking effect this decade, and freight emissions form a material share of most companies' reported footprint. Shippers previously tracking fuel use only at the fleet level are now instrumenting individual shipments to produce auditable, shipment-level emissions data demanded by regulators and increasingly by customers themselves.
Market Impact: Parcel volume exceeds 150 billion annually

Market Opportunities and Growth Drivers

Falling Sensor Hardware Costs Broaden Adoption Beyond Premium Freight

The cost of a basic GPS and temperature tracking sensor has fallen from roughly 200 dollars per unit a decade ago to under 90 dollars today, driven by cheaper cellular connectivity modules and battery technology improvements. This decline has made sensor deployment economical on mid-value freight lanes that previously could not justify the hardware cost against shipment value, expanding the addressable fleet several times over. Carriers that once reserved tracking hardware for high-value cargo are now fitting it across a much broader share of their trailer fleet, since payback has shrunk from years to months.
Market Impact: Adds 6-figure integration costs annually

E-Commerce Growth Increases Last-Mile Delivery Visibility Demand

Consumer expectations set by e-commerce platforms, where a shopper can watch a parcel move across a map in real time, are spilling over into business-to-business freight expectations that carriers historically never had to meet. Global e-commerce parcel volume has grown past 150 billion shipments annually, and a meaningful share of that growth now flows through freight networks that also carry commercial cargo, blurring the line between consumer and enterprise visibility expectations. Shippers increasingly ask for consumer-grade tracking interfaces even for large commercial shipments. This is pulling last-mile and long-haul visibility budgets into a single procurement decision at many shippers.
Market Impact: Adds 15 to 20 dollars

Market Restraints and Challenges

Fragmented Data Standards Limit Cross-Platform Interoperability

Shippers working with multiple carriers and freight brokers often receive tracking data in incompatible formats, since no single data standard has achieved universal adoption across the industry. The root cause is that visibility platforms grew up as competing proprietary systems rather than around a shared open standard, each building its own API and schema to lock in accounts. This forces large shippers to build and maintain custom integration layers for each carrier relationship, adding engineering overhead that smaller shippers cannot afford. Industry consortiums are mitigating this by developing shared exchange standards, though adoption remains voluntary and inconsistent.
Market Impact: Covers over 70 percent of volume

Cellular Connectivity Gaps Limit Tracking Coverage

Rural highway corridors and ocean shipping lanes outside major ports often lack reliable cellular coverage, creating tracking data gaps that undermine the real-time visibility promise carriers are selling to shippers. The underlying cause is that cellular network buildout has always prioritized population density over transportation corridor coverage, leaving predictable dead zones along major freight routes. This forces vendors to layer in satellite connectivity as a backup, adding meaningful hardware cost to units serving these routes. Vendors are mitigating the gap by developing hybrid cellular-satellite devices that switch automatically when cellular signal drops below a usable threshold.
Market Impact: Over 50,000 companies face new rules
3 additional market trends, 4 additional growth drivers, and 3 additional restraints and challenges are covered in the full report. Contact sales@marketmindsadvisory.com to access the complete intelligence.

Segment CAGR and Growth Architecture

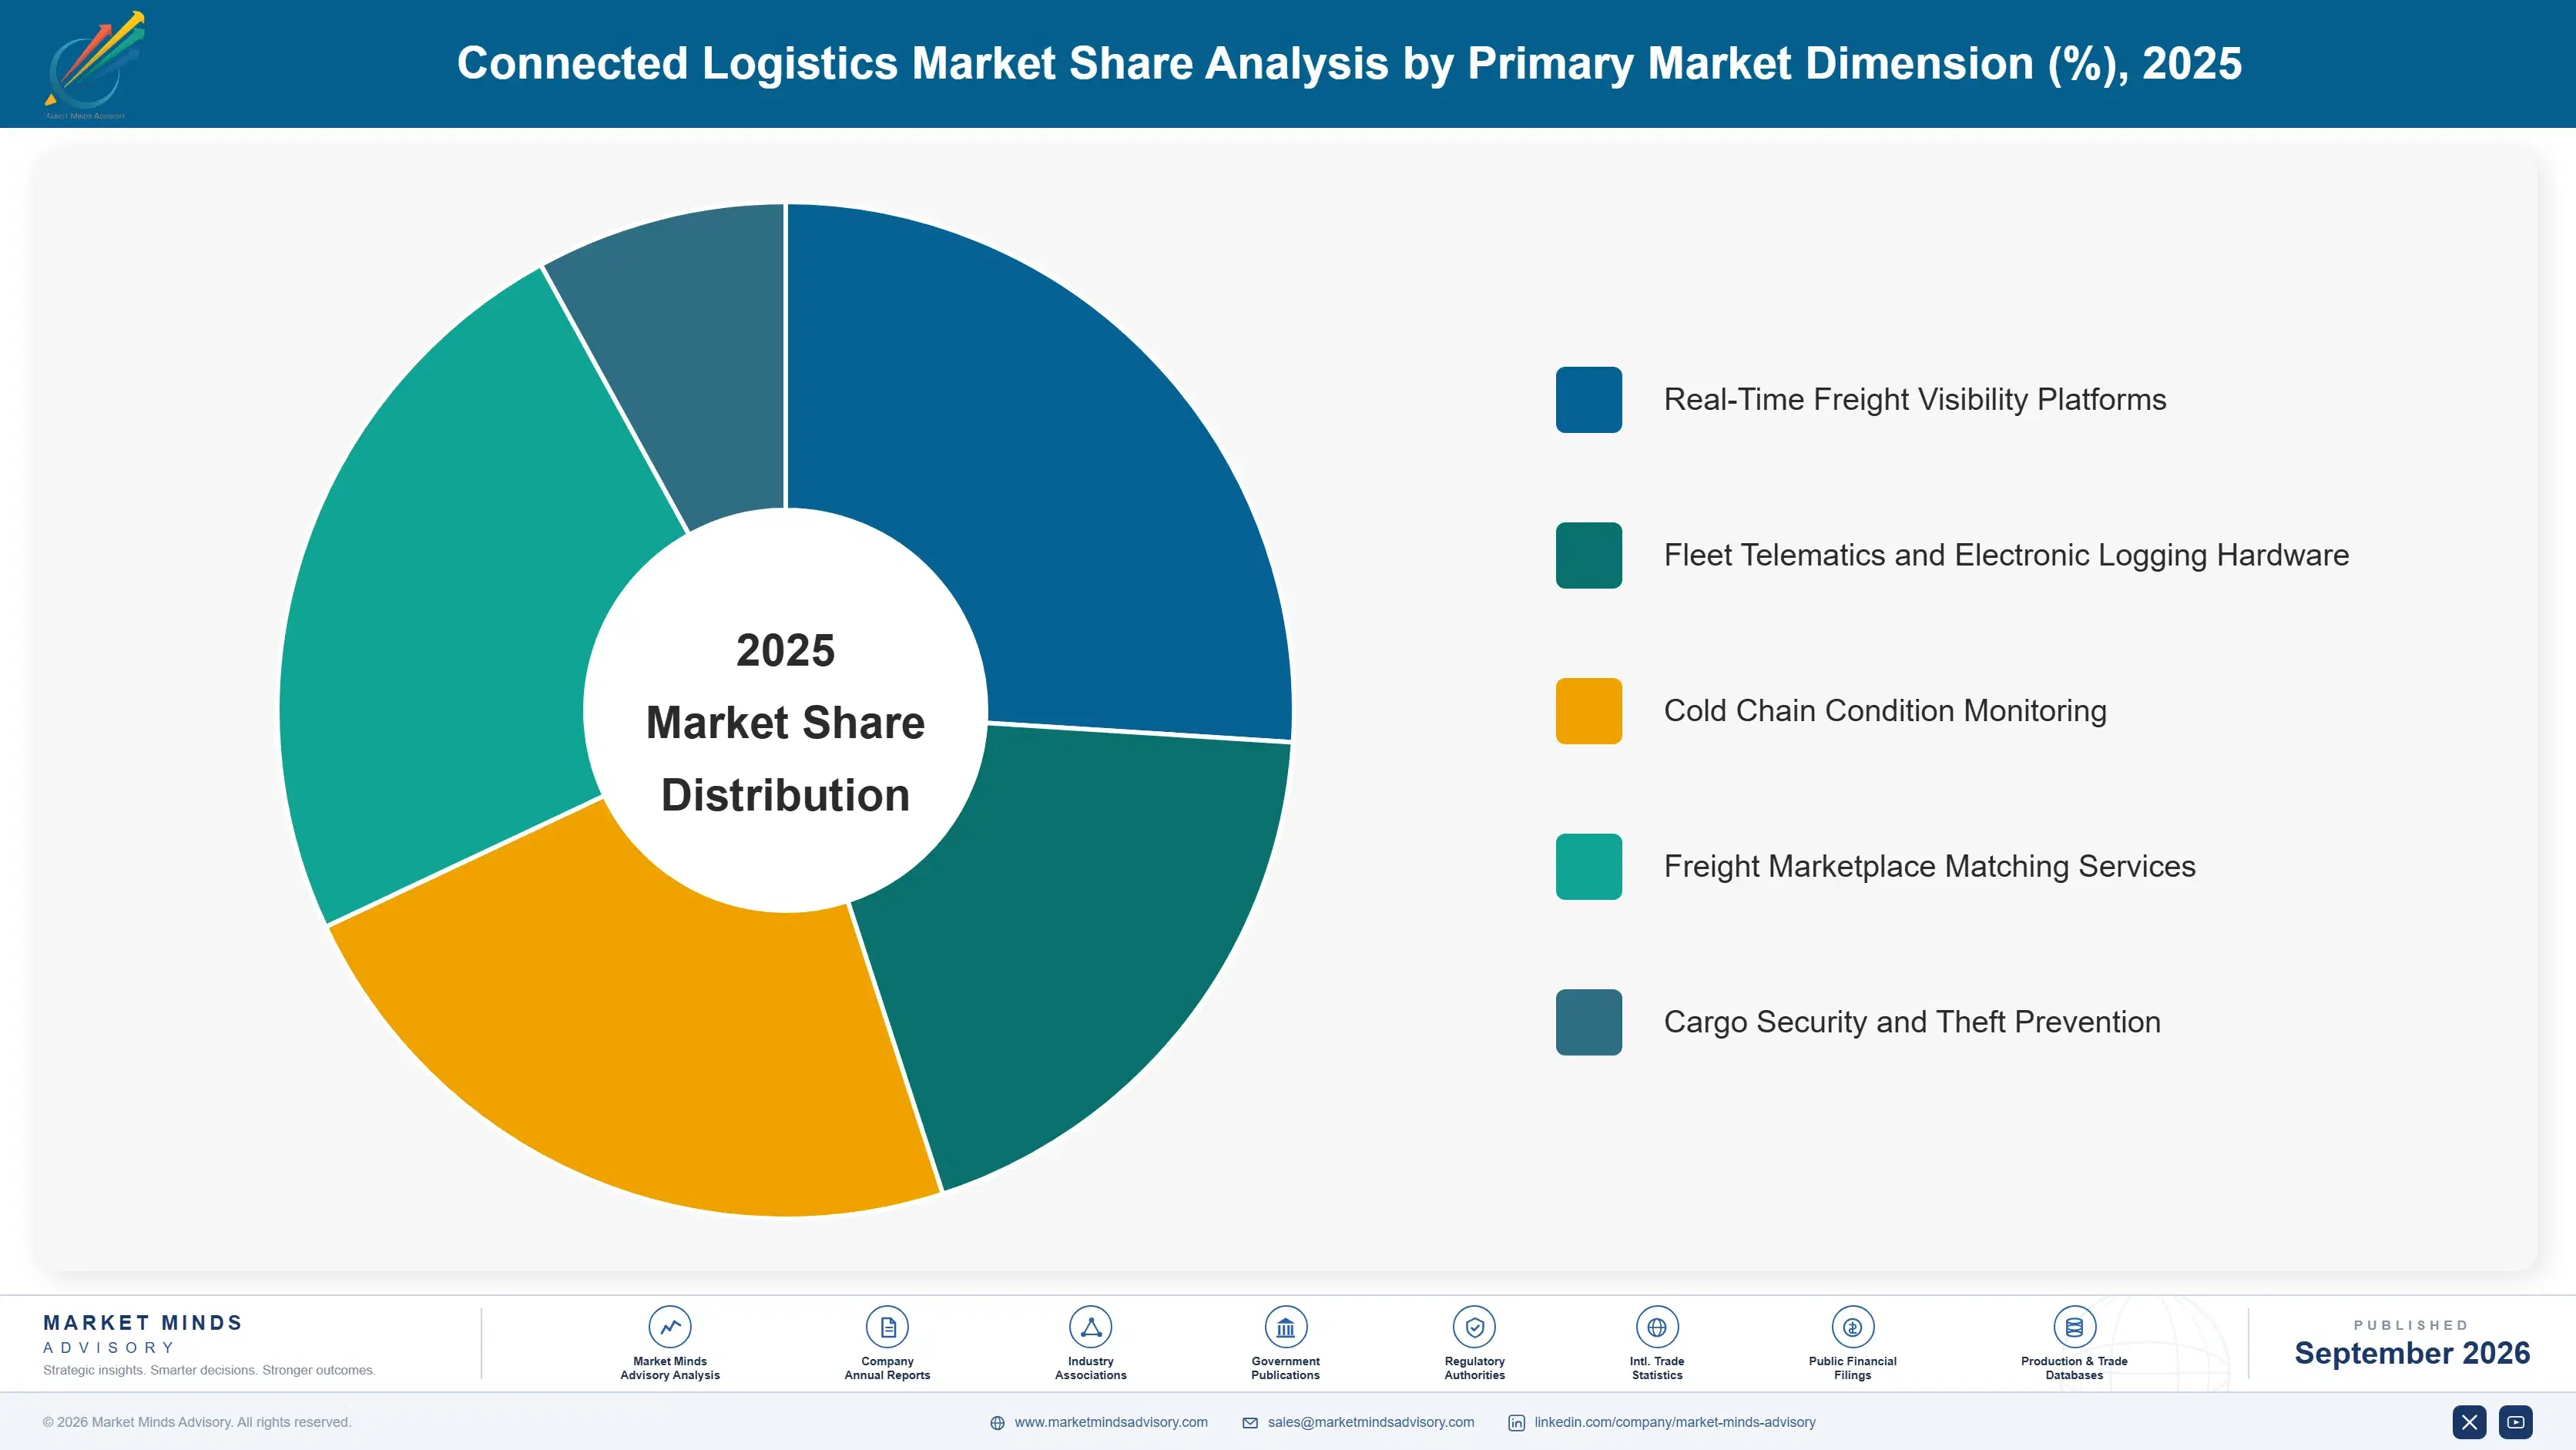
The connected logistics market splits across five technology-defined segments spanning both hardware and software layers of the freight visibility stack. Real-time freight visibility platforms lead growth as retailer contract mandates spread across supplier networks, while fleet telematics and electronic logging hardware still represent the largest installed base by unit count across the broader carrier fleet.
connected-logistics-market-market-share-analysis-1788417073406

Real-Time Freight Visibility Platforms

Real-time freight visibility platforms aggregate location, condition, and status data from sensors across multiple transport modes into a single dashboard, letting shippers and brokers see shipment status without contacting individual carriers directly. Growth here outpaces every other segment because retailer contract mandates are forcing adoption across supplier tiers that previously had no independent commercial reason to invest in this software. Platform vendors increasingly compete on predictive exception management, flagging a likely delay before it happens rather than simply reporting a shipment's current position, since that predictive capability is what shippers now pay the largest premium for relative to basic tracking alone. Contract renewal rates for platforms offering strong predictive capability now noticeably exceed renewal rates for pure tracking-only offerings.
CAGR 19.5%

Fleet Telematics and Electronic Logging Hardware

Fleet telematics and electronic logging hardware remains the largest segment by installed unit count, covering the GPS, engine diagnostic, and driver hours-of-service tracking devices that regulation has required on commercial trucks for years in major markets. This hardware base predates the current visibility software boom and continues expanding steadily as fleets replace aging units and as regulatory mandates extend to additional vehicle classes and smaller carrier operations that had previously been exempt. Growth here is comparatively modest since the addressable fleet is already largely instrumented, with most new spending going toward replacement rather than first-time adoption across the broader carrier base. Vendors serving this segment compete primarily on reliability and regulatory compliance certification rather than software sophistication.
CAGR 8.2%
Full segment breakdown across 6 segments available in the complete report.

Regional Architecture and Country Demand Map

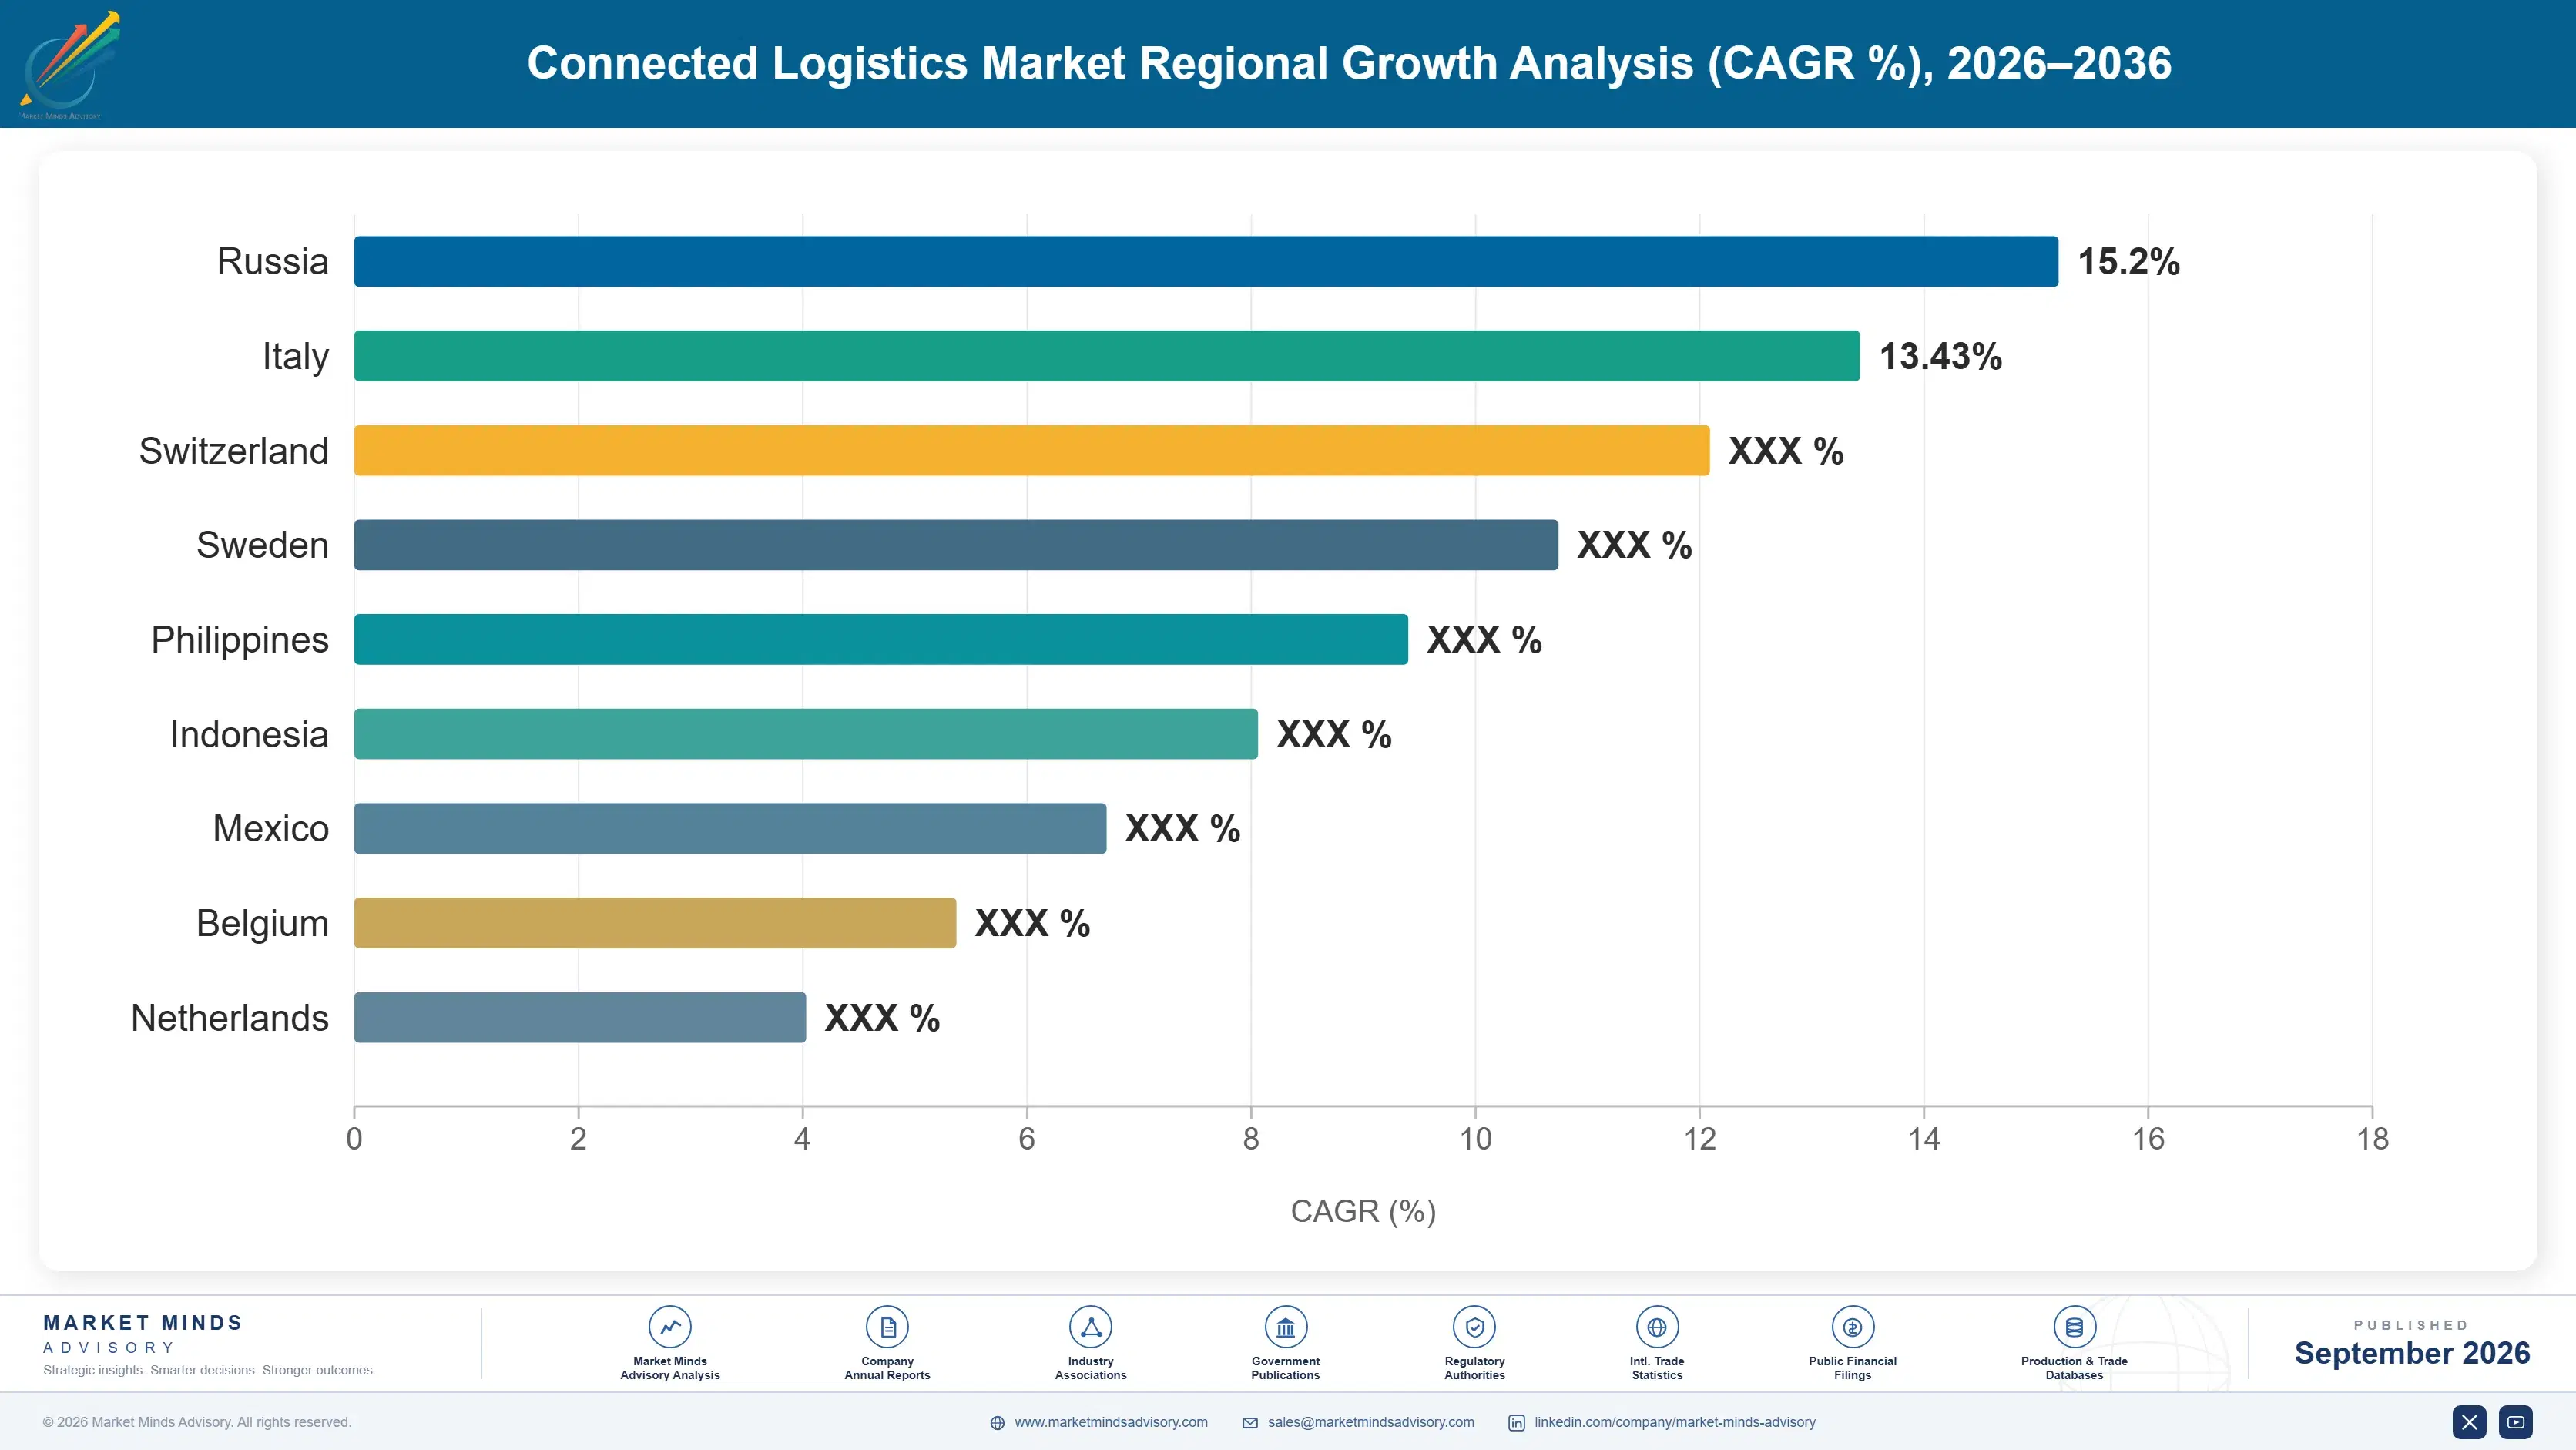
East Asia leads global connected logistics revenue as export manufacturers instrument factory-to-port freight movement at scale, while North America retains a strong share tied to retailer visibility mandates spreading fast. South Asia and Pacific grows fastest as Vietnam's export sector accelerates tracking hardware adoption nationwide.

North America

Retailer-driven mandates rather than carrier-led investment define how this market grows across the United States and Canada. Walmart, Target, and several other large retailers now require connected tracking data as a supplier contract condition, pulling adoption down through freight networks that would otherwise have had no independent reason to invest. Amazon's logistics network, both its own fleet and its extended partner carrier program, has separately pushed visibility standards that smaller regional carriers must now meet to remain eligible for contracted freight volume. Cross-border freight moving between the United States, Mexico, and Canada under regional trade agreements is adding a further layer of tracking demand tied to customs compliance documentation requirements.
Share: 24% | CAGR: 13.8% (2026 to 2036)

Western Europe

Western Europe's growth trails the global rate mainly because dense rail and short-haul trucking networks already carried extensive tracking infrastructure before this forecast period began, unlike the more fragmented and longer-haul North American market. The European Union's Corporate Sustainability Reporting Directive is nonetheless adding a distinct new wave of emissions-focused instrumentation demand separate from pure operational visibility spending. Germany's automotive supply chain, running extremely tight just-in-time delivery schedules, has driven some of the region's most sophisticated adoption of predictive exception management software, since even minor delays can halt an assembly line entirely. France's logistics sector has moved more slowly on predictive analytics specifically, favoring proven basic tracking over newer exception-management software.
Share: 19% | CAGR: 12.3% (2026 to 2036)
Regional intelligence for 5 additional markets available in the complete report: East Asia, South Asia and Pacific, Latin America, Middle East and Africa, Eastern Europe. Contact sales@marketmindsadvisory.com.
connected-logistics-market-country-cagr-analysis-1788417073974

Where Visibility Vendors Can Still Add Margin

Falling sensor hardware prices and commoditizing basic tracking software are pushing vendors toward adjacent revenue lines built on top of the data they already collect from every shipment moving through their network. Four levers stand out as genuinely additive to core platform revenue rather than cannibalistic of it, each riding on infrastructure the vendor already owns.

Selling Predictive Delay Analytics as a Subscription

Platforms with years of historical shipment data can build predictive models that flag a likely delay days before it happens, based on weather, port congestion, and carrier performance patterns rather than simple current-position reporting. Shippers pay a meaningful premium for this predictive capability since it lets them proactively notify customers and adjust production schedules rather than reacting after a delay is already confirmed. Vendors offering this capability report subscription pricing running roughly 25 to 35 percent above basic tracking-only contracts, a durable margin layer largely uncorrelated with hardware unit sales.
Market Impact: Subscription pricing runs 25 to 35 percent higher

Offering Carbon Emissions Reporting as a Service

Freight visibility data can be repackaged into auditable shipment-level emissions reports that shippers need for regulatory disclosure and customer sustainability commitments, turning compliance obligation into a paid service layered on top of core tracking. This capability requires building emissions calculation methodology that satisfies auditor scrutiny, a barrier smaller vendors struggle to clear credibly. Early providers of this service report attach rates above 30 percent among enterprise shippers already subject to mandatory sustainability disclosure requirements in their home jurisdiction. Regulatory scrutiny of emissions methodology is rising, but the underlying data advantage remains durable regardless of packaging.
Market Impact: Attach rates now exceed a 30 percent share

Selling Cargo Insurance Products Alongside Tracking Data

Real-time condition and location data lets platforms underwrite parametric cargo insurance products priced more accurately than traditional insurers relying on historical claims data alone, since the platform can verify actual shipment conditions rather than estimating risk from broad category averages. This creates a genuinely new revenue line built entirely on data the vendor already collects for tracking purposes. Vendors piloting this model report insurance commission revenue reaching 5 to 8 percent of total platform revenue within two years of launch. Regulatory licensing requirements for offering insurance products vary by jurisdiction, adding compliance overhead that smaller platforms often cannot absorb quickly.
Market Impact: Commission revenue reaches 5 to 8 percent share

Building Freight Marketplace Matching on Top of Visibility Data

Platforms with dense visibility data across many carriers can identify empty backhaul capacity in real time and match it to available freight, capturing a transaction fee on loads that would otherwise move empty or through a separate broker relationship entirely. This capability turns a pure visibility platform into a two-sided marketplace, a business model shift that requires different sales and operational infrastructure than software licensing alone. Marketplace fees typically run 3 to 5 percent of load value, adding a volume-linked stream distinct from subscription pricing. Building this requires a dense, liquid carrier network only the largest platforms currently have.
Market Impact: Fees run 3 to 5 percent of value

Who Controls the Margin Pool

Global visibility platform revenue concentrates modestly, with the top five vendors holding roughly 34 percent share on a platform revenue basis, the consistent yardstick applied throughout this assessment. Project44 and FourKites lead the pure-play visibility category, though Samsara's telematics-first scale gives it a distinct competitive position built on hardware installed base rather than software-only market entry. The gap between these leaders and mid-tier challengers remains narrow enough that near-term ranking changes look plausible.
Current activity centers on predictive analytics expansion and multimodal coverage rather than price competition on basic tracking. Vendors are racing to extend visibility across ocean, rail, and road simultaneously, since large shippers increasingly refuse to work with a platform that only covers a single transport mode. Several mid-tier players have pursued telematics hardware acquisitions specifically to reduce dependence on third-party sensor data feeds.

Emerging pressure comes from telematics-first entrants that built their business on vehicle hardware before extending into freight visibility software, competing directly with software-first platform vendors who never built hardware themselves. Ranking shifts are most likely in the mid-tier, where vendors lacking multimodal coverage risk losing enterprise contracts to faster-moving rivals. The very top of the market remains comparatively unsettled, unlike more mature technology categories.
connected-logistics-market-company-positioning-matrix-1788417074506

Competitive Moat and Risk Dimensions

PROJECT44

Moat: Multimodal Carrier Network Density

Project44 has built direct data integrations with thousands of carriers across ocean, rail, and road, giving it visibility breadth that a newer entrant would need years to replicate. This network density becomes self-reinforcing, since more carrier integrations make the platform more valuable to shippers. Shippers rarely rip out an integration this extensive once it is running reliably.
PROJECT44

Risk: Telematics Vendor Encroachment

Hardware-first telematics companies are extending directly into freight visibility software, threatening to bundle tracking capability that Project44 sells standalone. If large fleet telematics vendors offer visibility features at no incremental cost, pure-play platforms could see meaningful pricing pressure. Project44 would need to compete harder on analytics depth to defend its premium pricing in that scenario.
SAMSARA

Moat: Integrated Hardware and Software Stack

Samsara controls both the sensor hardware and the software platform end to end, letting it bundle pricing and iterate faster than vendors dependent on third-party hardware partners. This integration also gives Samsara richer sensor data than platforms relying on standardized third-party device feeds. This cost advantage becomes more pronounced as sensor hardware prices continue to fall industry-wide.
SAMSARA

Risk: Narrower Multimodal Coverage

Samsara's strength in road fleet telematics does not yet extend as deeply into ocean and rail visibility as pure-play multimodal platforms, a gap that could cost it enterprise contracts requiring comprehensive coverage across every transport mode a large shipper actually uses. Building out that coverage would require either acquisitions or years of new carrier integration work.

Players Tracked

Prominent Players

Project44
FourKites
Samsara
Trimble
Descartes Systems

Other Key Players

Overhaul
Shippeo
Sixfold
Wabco (ZF CVS)
Geotab
Motive
Convoy
Flexport
Anteo
Blume Global
MacroPoint
Loadsmart
Transporeon
Vizion
Roambee

Recent Developments

JANUARY 2026

FourKites Acquires Ocean Freight Visibility Startup

FourKites completed the acquisition of a smaller ocean freight visibility specialist, adding direct port and vessel tracking data to its existing road and rail coverage across major trade lanes. The deal closed for an undisclosed sum, letting FourKites offer genuinely multimodal visibility without a third-party data partner in the loop.
Signal: Multimodal coverage gaps are increasingly being closed through acquisition rather than slower internal software development timelines.
SEPTEMBER 2025

Samsara Launches Predictive Delay Analytics Feature

Samsara launched a predictive delay analytics feature built on its existing fleet telematics sensor data, extending its product beyond basic location tracking into the exception-management category that pure-play visibility platforms have historically dominated as their primary competitive differentiator against hardware vendors. Rollout began first for its largest fleet customers.
Signal: Hardware-first vendors are moving up the software stack into territory pure-play visibility platforms once controlled alone.
APRIL 2025

Trimble Wins Multi-Year Fleet Visibility Contract in Europe

Trimble secured a multi-year fleet visibility and compliance contract with a major European logistics provider, expanding its presence beyond its traditional North American customer base into a market long served primarily by regional European telematics vendors and smaller platform providers. Financial terms of the multi-year agreement were not disclosed publicly.
Signal: European carriers are increasingly open to non-domestic vendors that can demonstrate proven multimodal tracking capability. overall.

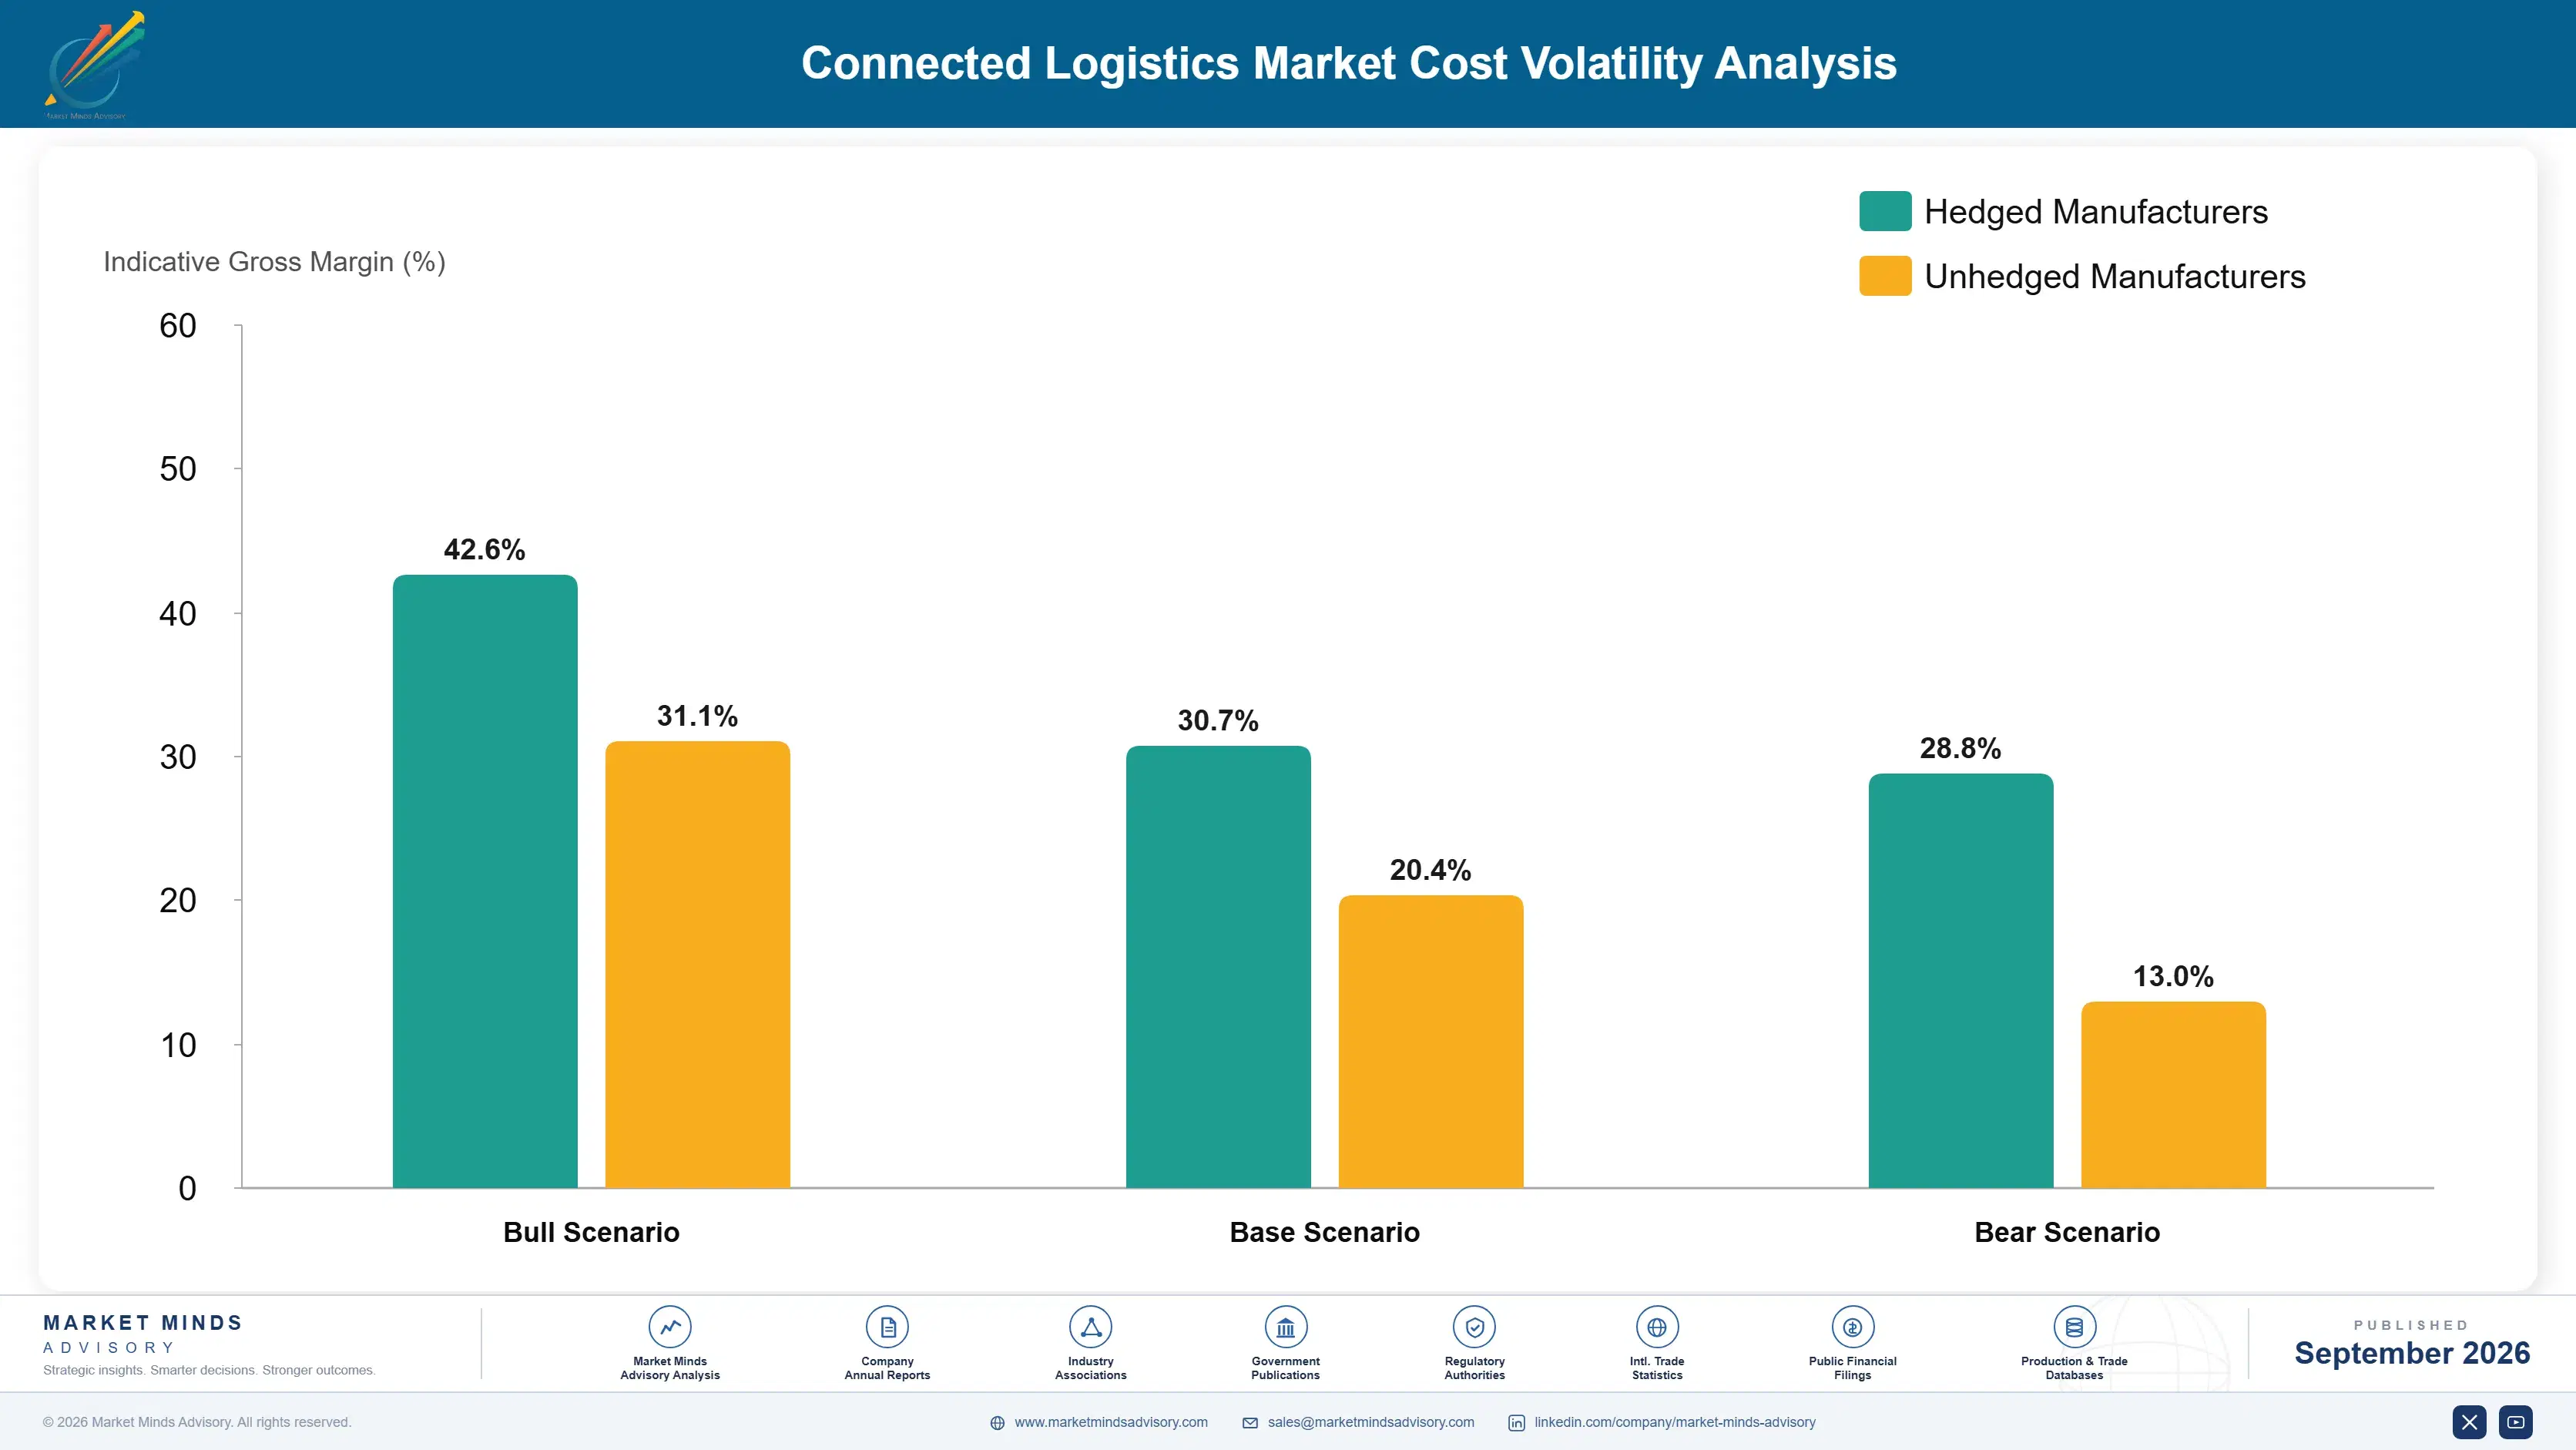
Sensor Component and Connectivity Cost Exposure

Cellular connectivity modules and IoT chipsets account for roughly 30 to 38 percent of a typical connected logistics hardware vendor's cost of goods sold, sourced primarily from semiconductor foundries in Taiwan and component assemblers in China and Southeast Asia. Cloud infrastructure and data processing costs for the software layer add a further 12 to 16 percent, sourced mainly from the major hyperscale cloud providers.
A 2021 global semiconductor shortage, documented in Trimble's 2022 annual report as a material supply constraint, delayed tracking device production for several quarters and forced multiple vendors to allocate limited chip supply toward their highest-margin enterprise contracts first. Samsara's 2023 annual report similarly cited component sourcing as a driver behind its decision to diversify its supplier base across multiple semiconductor foundries rather than relying on a single source.

Smaller hardware vendors face a genuine disadvantage here because they lack the purchasing volume to secure priority allocation from constrained component suppliers during shortage periods, unlike larger vendors with long-term supply agreements. Vendors based in regions with weaker semiconductor import infrastructure face additional exposure, since they cannot easily substitute alternate component sources the way a vendor with diversified global sourcing relationships can.
connected-logistics-market-cost-volatility-analysis-1788417074708

Dual-Sourcing Semiconductor Components

Vendors are increasingly qualifying two or more chip suppliers for critical components so a single-source shortage cannot halt production entirely. This adds engineering validation cost but has become close to standard practice among vendors shipping meaningful device volume. Vendors serving large enterprise contracts increasingly treat dual-sourcing as a requirement customers explicitly ask about during procurement, not an internal choice.

Long-Term Component Purchase Agreements

Locking in multi-year purchase commitments with semiconductor suppliers secures priority allocation during shortage periods and more predictable unit pricing, trading flexibility for supply security that smaller vendors without scale often cannot negotiate on their own. This approach requires substantial upfront capital commitment years ahead of actual production need, a tradeoff that favors well-capitalized vendors over smaller competitors.

Modular Hardware Design for Component Substitution

Designing tracking devices with modular component slots lets vendors substitute an alternate chip supplier without a full hardware redesign when a shortage hits, reducing the lead time needed to requalify a new component under supply pressure. This design approach adds modest upfront engineering cost but pays back quickly the first time a shortage forces a rapid supplier switch.

Portfolio Architecture for Margin Defence

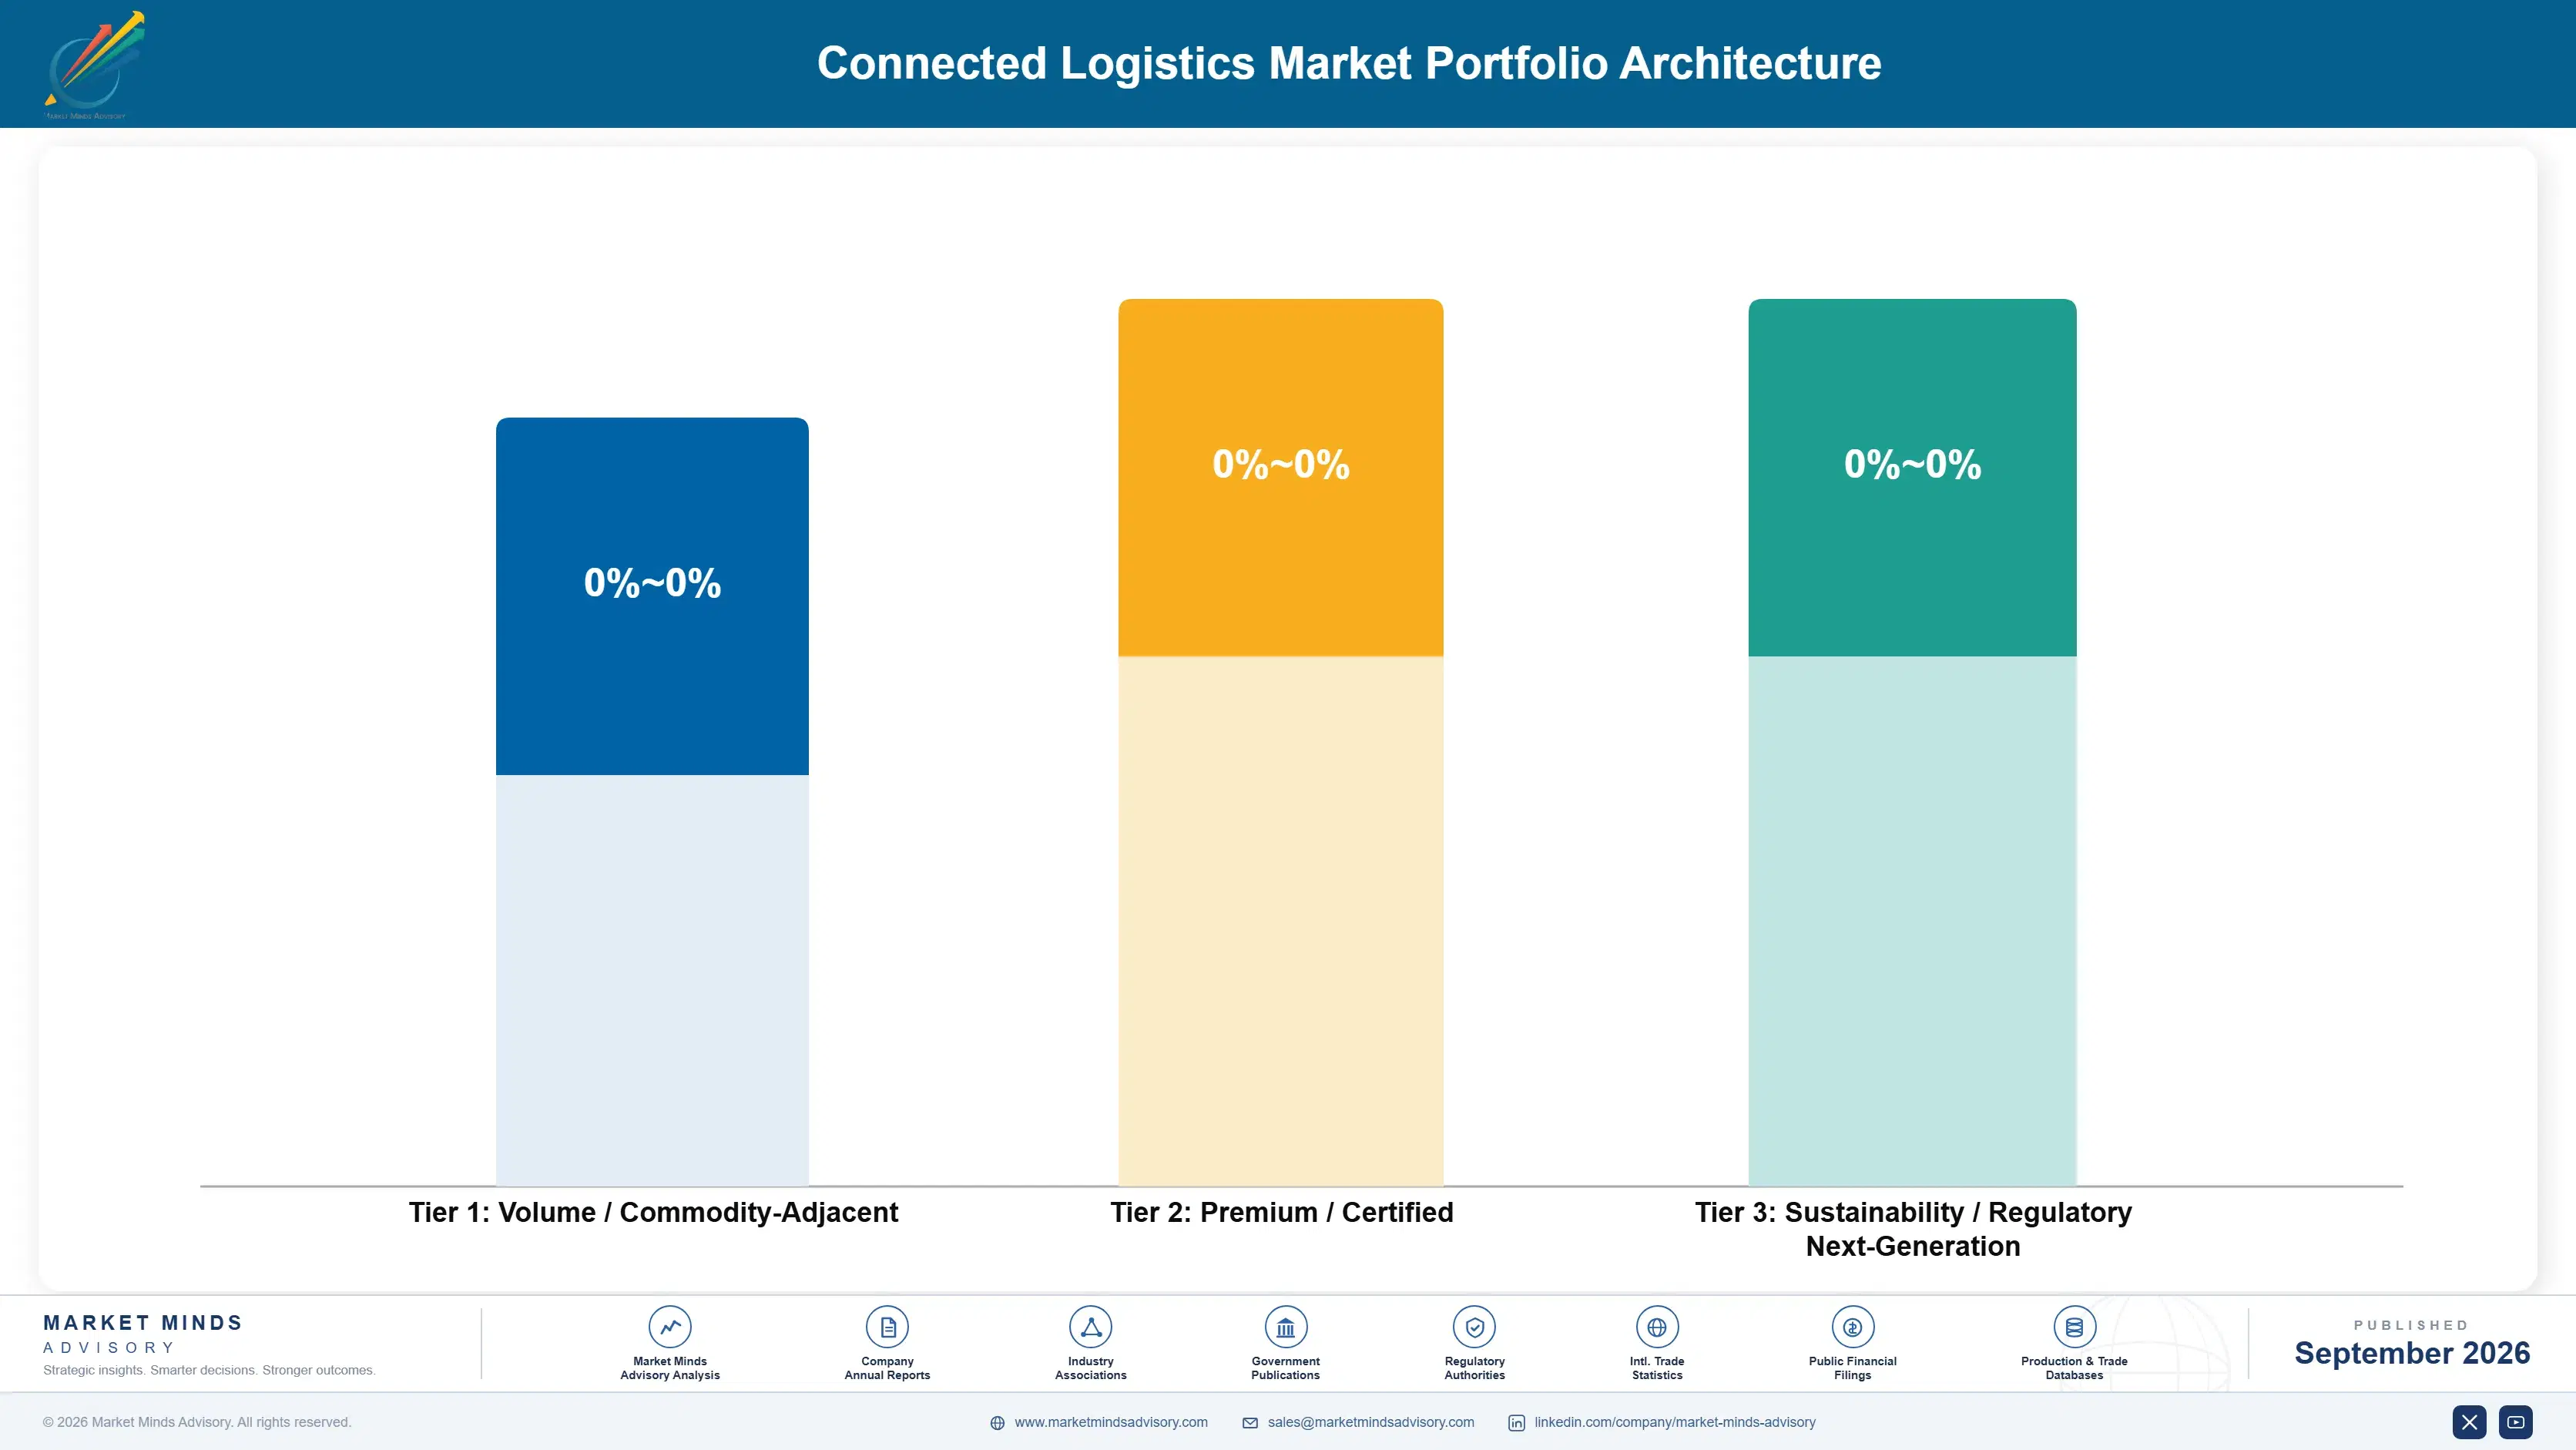
Connected logistics vendors operate across a widening tier structure as basic tracking commoditizes and higher-margin predictive analytics services concentrate pricing power elsewhere in the stack. Volume-tier hardware and basic subscription tracking now carry gross margins compressed by falling sensor costs, while premium predictive and compliance-grade platforms serving regulated enterprise shippers retain meaningfully stronger pricing across the board.
The tension between chasing raw device volume and defending premium software positioning defines strategic choice across the industry. Vendors competing purely on hardware unit price find margin eroding faster than their cost base can adjust, while vendors segmenting customers by predictive analytics uptake are protecting margin even as basic tracking fees compress across the broader market and customer base. Sales teams increasingly need analytics fluency, not just hardware knowledge.

High-value margin pools concentrate in predictive delay analytics, emissions reporting, and freight marketplace matching sold as standalone services rather than bundled features. These pools grow faster than core hardware revenue because they scale with data assets a vendor already owns rather than requiring incremental device shipments, making them the most defensible source of margin expansion available to vendors today. Building these capabilities takes years to do well.

Volume / Commodity-Adjacent

Basic GPS and temperature tracking hardware plus entry-level dashboard software sold to price-sensitive small and mid-sized carriers where switching cost remains low and competition centers on unit price. Carriers in this tier churn readily toward whichever vendor offers the lowest visible hardware price.
Gross Margin: 6 to 12%

Premium / Certified

Multimodal visibility platforms bundled with predictive exception management and dedicated account management for enterprise shippers who value reliability and integration breadth over marginal cost savings. These shippers typically sign multi-year contracts, reducing acquisition cost per dollar of recurring revenue.
Gross Margin: 20 to 30%

Sustainability / Regulatory / Next-Generation

Emissions reporting, carbon disclosure compliance tooling, and predictive analytics built to meet regulatory mandates ahead of competitors, commanding premium pricing while the capability remains relatively scarce industry-wide. Vendors here often price on a subscription basis tied to compliance scope rather than pure device count.
Gross Margin: 26 to 38%
connected-logistics-market-portfolio-architecture-1788417075215

High-value Sub-segments and Strategic Watch-out

Predictive Delay and Exception Analytics

High-value, high-growth pool as shippers pay premium pricing for advance warning of disruption, rewarding vendors who build accurate predictive models earliest with durable multi-year enterprise contracts locked in ahead of rivals. Vendors absent from this capability risk losing the largest enterprise contracts entirely to faster-moving specialists.
Gross Margin: 30 to 40%

Freight Marketplace Matching Services

High-value, moderate-growth pool constrained by the need for dense carrier network liquidity in most markets, but delivering strong transaction-fee margin once a platform has built sufficient two-sided marketplace scale. Expansion here depends heavily on how quickly a platform can build carrier density in each new geography.
Gross Margin: 24 to 32%

Basic Fleet Telematics and Tracking Hardware

Volume core segment carrying the bulk of installed devices but facing steady margin compression as falling component costs and commoditized software erode differentiation across most basic tracking offerings. Consolidation among mid-tier hardware makers is likely as scale becomes the primary way to defend thinning margin.
Gross Margin: 10 to 16%

Cross-Border Customs Documentation Integration

Strategic watch-out segment where shifting trade policy and customs digitization rules could rapidly change the competitive map, rewarding platforms with flexible multi-jurisdiction compliance infrastructure already built. A sudden shift in trade policy in any single major corridor could reroute meaningful volume within a single quarter.
Gross Margin: 18 to 26%

Recurring Revenue and Vertical Adoption Depth

Visibility platform revenue behaves like an annuity once a shipper integrates a platform into its transportation management workflow, since switching vendors requires re-mapping carrier data feeds and retraining staff, a cost most shippers avoid unless service quality deteriorates. This stickiness means vendors earn recurring revenue on essentially every shipment for years after integration, with almost no incremental sales cost.
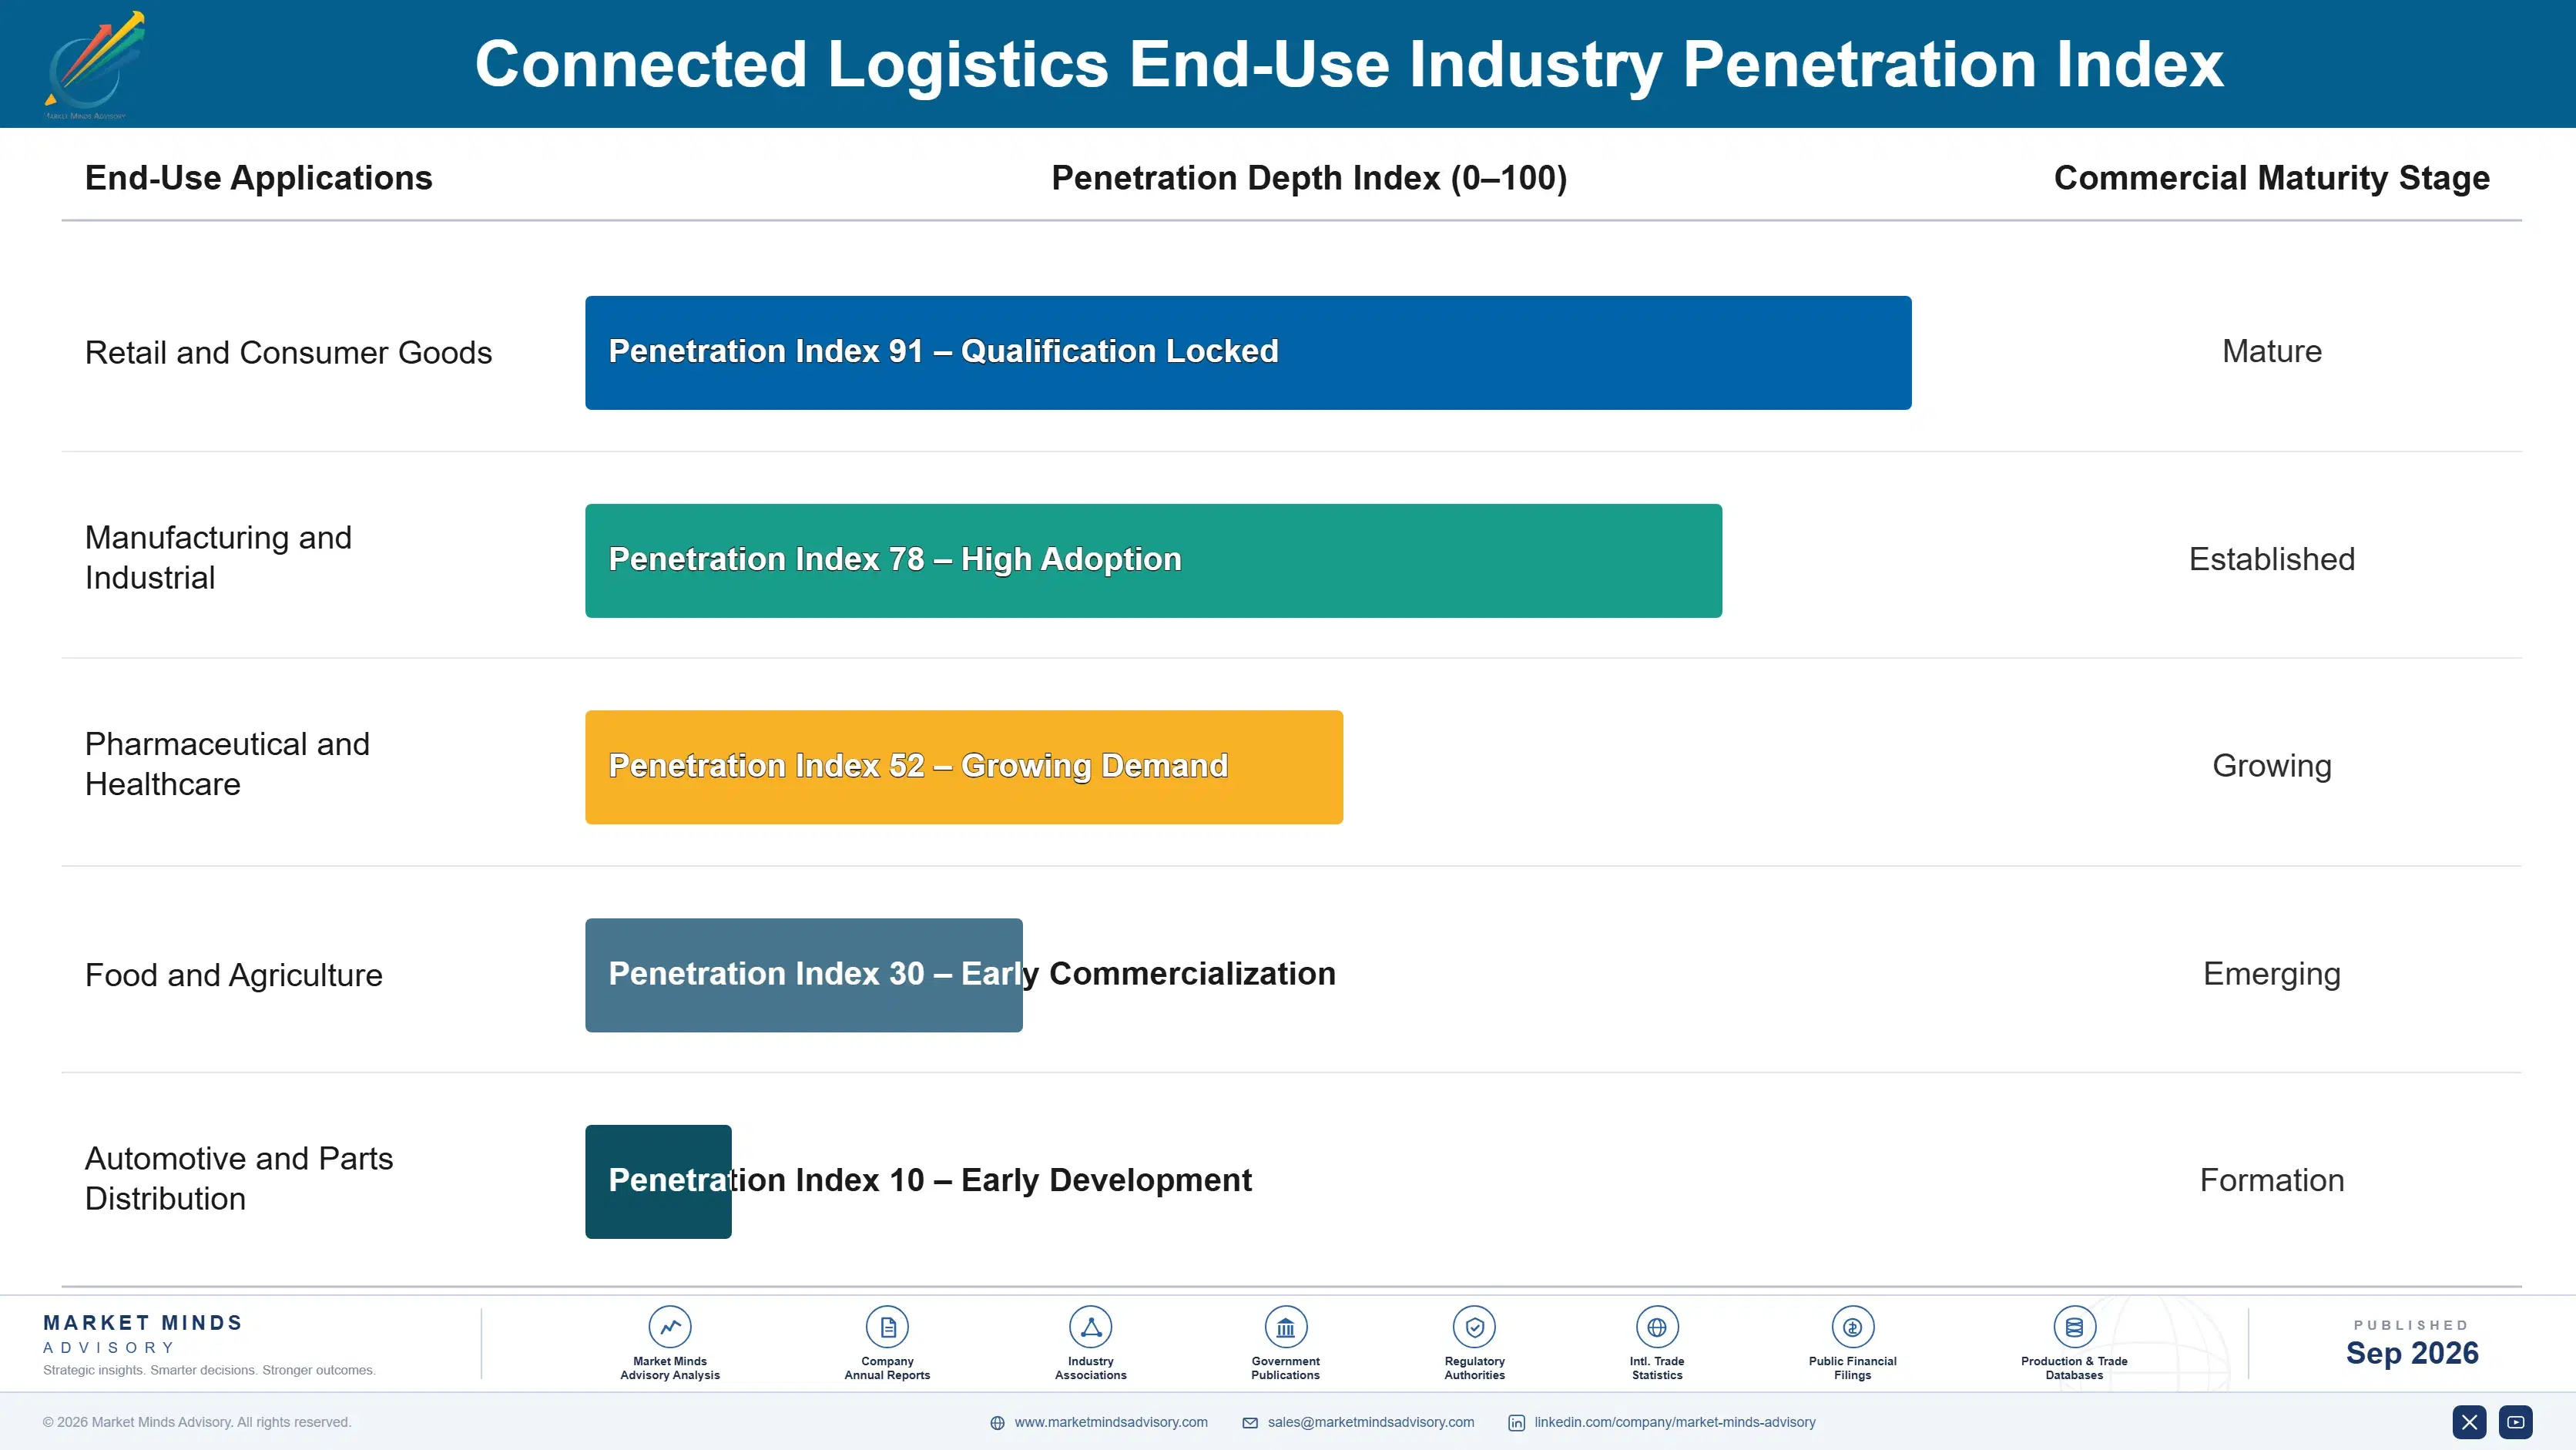
Adoption depth varies sharply by end-use vertical. Retail and consumer goods shippers adopt visibility platforms quickly since delivery promises directly affect revenue, while pharmaceutical and industrial equipment shippers integrate more slowly due to validation cycles stretching past a year. Agricultural and bulk commodity shippers sit furthest behind, since low per-unit value freight still relies on manual tracking rather than integrated sensor platforms.

Buyer profiles are shifting generationally as digitally native logistics managers replace an older generation comfortable with phone calls and manual status checks. Younger supply chain professionals expect visibility data to integrate directly with enterprise resource planning software from day one, treating a standalone tracking portal as an outdated concept. This generational turnover is accelerating adoption of embedded and API-first visibility tools faster than pricing alone would predict.
connected-logistics-market-end-use-penetration-index-1788417075716

Where MMA Sees the Real Bets

These are among the four positions where our research anticipates prominent divergence between winners and laggards over the coming forecast period. Each is grounded in the demand model, the regulatory perimeter, and the announced capacity pipeline.
01 / PREDICTIVE ANALYTICS PRIORITY

Build predictive delay capability before pricing pressure sets in

Vendors relying only on basic location tracking are already losing enterprise contracts to platforms that can flag a likely delay days in advance, and the gap in predictive accuracy compounds with every additional month of historical shipment data a rival platform accumulates. This gap widens every quarter a vendor delays investment, since predictive accuracy compounds with more historical shipment data collected over time and refined against real outcomes. MMA views predictive analytics depth as the clearest predictor of which platforms defend premium pricing over the next five years.
02 / MULTIMODAL COVERAGE EXPANSION

Extend visibility across ocean, rail, and road simultaneously now

Large shippers increasingly refuse to work with a platform that only covers a single transport mode, favoring vendors who can track a shipment door to door regardless of how many modes it crosses along the way and how many separate carriers actually handle it. Building this coverage requires either acquisitions or years of carrier integration work that smaller vendors struggle to fund alone without outside capital. MMA expects multimodal vendors to consolidate mid-tier competitors that cannot close this coverage gap quickly enough.
03 / EMISSIONS COMPLIANCE READINESS

Package emissions reporting as a standalone paid service

Regulatory disclosure requirements are spreading faster than most vendors' product roadmaps currently assume, creating a genuine near-term revenue opportunity for whichever vendor commits to moving first. Vendors that build auditor-grade emissions calculation methodology now can charge a premium for compliance-grade reporting before the capability becomes commoditized across the broader market and every remaining competitor offers something functionally similar. MMA advises treating this as a standing product priority rather than a reactive feature bolted on later once every competitor already offers something comparable.
04 / MARKETPLACE MODEL TESTING

Pilot freight matching before dense competitors lock in liquidity

Platforms with sufficient carrier density can capture transaction fees on backhaul capacity that would otherwise move empty, a genuinely new revenue line built entirely on existing visibility data the platform already collects for tracking purposes. This model favors whichever platform reaches sufficient two-sided liquidity first in a given freight corridor, since a thin marketplace with few participating carriers offers little value to either side. MMA regards early marketplace testing as lower risk than waiting for a larger competitor to establish dominant position first.

Engagement Snapshot From the Field

A live engagement with an industry participant carrying material or product regulatory and market exposure ahead of a defining policy shift, showing how our research translates into a defensible multi-year portfolio strategy.
MARKET MINDS ADVISORY · CLIENT ENGAGEMENT SUMMARY
Connected Logistics Producer Strategic Portfolio Review and Transition Roadmap 2026·Investment Scenario on Connected Logistics Exposure Evaluation 2025-26
CLIENT PROFILE
The client is a mid-sized consumer packaged goods manufacturer operating distribution across North America and Western Europe, shipping roughly 40,000 truckload and less-than-truckload freight movements annually through a mix of owned fleet and contracted carriers. Its existing tracking relied on carrier-provided status updates emailed manually, leaving the logistics team with no real-time view into shipment location or condition.
STRATEGIC CHALLENGE
The manufacturer faced mounting customer complaints about missed delivery windows and a retailer scorecard penalty tied to on-time delivery performance that was costing it preferred vendor status with a major retail chain. Leadership needed a visibility solution deployable across its full carrier network within one fiscal quarter, without requiring every contracted carrier to install proprietary hardware.
MMA APPROACH
MMA conducted a rapid audit of the manufacturer's carrier network and existing transportation management system, then benchmarked three visibility platform vendors against integration complexity and carrier onboarding friction. The engagement produced a phased rollout plan prioritizing the manufacturer's highest-volume retail accounts first, sequenced to demonstrate measurable delivery performance improvement before expanding across the full carrier base.
KEY FINDINGS
  1. The manufacturer's top fifteen retail accounts accounted for over 70 percent of total freight volume, making them the correct priority for early rollout.
  2. A carrier-agnostic visibility platform requiring no proprietary hardware installation cut projected onboarding time from months to roughly three weeks per new carrier.
  3. Two of three vendors evaluated already held existing data integrations with the manufacturer's core transportation management software, reducing implementation risk considerably overall.
  4. On-time delivery performance data revealed that a small number of regional carriers accounted for a disproportionate share of all missed delivery windows.
CLIENT PROFILE
The client is a mid-sized consumer packaged goods manufacturer operating distribution across North America and Western Europe, shipping roughly 40,000 truckload and less-than-truckload freight movements annually through a mix of owned fleet and contracted carriers. Its existing tracking relied on carrier-provided status updates emailed manually, leaving the logistics team with no real-time view into shipment location or condition.
STRATEGIC CHALLENGE
The manufacturer faced mounting customer complaints about missed delivery windows and a retailer scorecard penalty tied to on-time delivery performance that was costing it preferred vendor status with a major retail chain. Leadership needed a visibility solution deployable across its full carrier network within one fiscal quarter, without requiring every contracted carrier to install proprietary hardware.
MMA APPROACH
MMA conducted a rapid audit of the manufacturer's carrier network and existing transportation management system, then benchmarked three visibility platform vendors against integration complexity and carrier onboarding friction. The engagement produced a phased rollout plan prioritizing the manufacturer's highest-volume retail accounts first, sequenced to demonstrate measurable delivery performance improvement before expanding across the full carrier base.
KEY FINDINGS
  1. The manufacturer's top fifteen retail accounts accounted for over 70 percent of total freight volume, making them the correct priority for early rollout.
  2. A carrier-agnostic visibility platform requiring no proprietary hardware installation cut projected onboarding time from months to roughly three weeks per new carrier.
  3. Two of three vendors evaluated already held existing data integrations with the manufacturer's core transportation management software, reducing implementation risk considerably overall.
  4. On-time delivery performance data revealed that a small number of regional carriers accounted for a disproportionate share of all missed delivery windows.
RECOMMENDED STRATEGY
Phase 1: Phase 1 (Months 1-3): deploy visibility tracking across the top fifteen retail accounts and their entire associated carrier network fully. Phase 2: Phase 2 (Months 4-8): extend coverage to the remaining carrier base, prioritizing carriers with the weakest historical on-time performance first. Phase 3: Phase 3 (Months 9-12): integrate visibility data directly into the retailer scorecard reporting process to demonstrate sustained ongoing delivery improvement.
OUTCOME
The manufacturer achieved full visibility coverage across its top fifteen retail accounts within ten weeks, ahead of the one-quarter target (client-reported, unverified by MMA). On-time delivery performance improved enough to restore preferred vendor status with the affected retail chain within two quarters of launch (client-reported, unverified by MMA).

Frequently Asked Questions

Foundational context covering the market sizes, CAGR, scope, country, region and competition that inform every finding below. This section is provided to cover basics and most often pre-purchase conversations, answered from the MMA Primary Research Dataset.

What is the current size of the Connected Logistics Market?

The Connected Logistics Market reached 9.2 billion dollars in 2025, the report's base year for all forecast calculations. This figure covers freight visibility software and IoT tracking hardware globally.

How large will the Connected Logistics Market be by 2036?

The market is projected to reach 37.04 billion dollars by 2036, roughly 3.55 times its 2026 starting value. That growth reflects retailer visibility mandates and falling sensor hardware costs.

What is the CAGR for the Connected Logistics Market 2026 to 2036?

The market is forecast to grow at a 13.5 percent compound annual rate between 2026 and 2036. Bull and bear scenarios range from 14.8 percent to 12.2 percent respectively.

Which segment is growing fastest?

Real-time freight visibility platforms lead growth at 19.5 percent CAGR, roughly 1.44 times the overall market rate. Retailer contract mandates spreading across supplier tiers are driving this expansion.

Who are the major companies in the Connected Logistics Market?

Project44, FourKites, Samsara, Trimble, and Descartes Systems lead the market on a platform revenue basis. Together these five vendors hold roughly 34 percent combined share.

Which country is growing fastest?

Vietnam leads country-level growth at 20.0 percent CAGR, driven by export manufacturers instrumenting factory-to-port freight movement at scale. Supply chains shifting there from China are accelerating this adoption.

Report Segmentation Architecture

The full report scope spans multiple orthogonal segmentation dimensions, with cross-tabulated demand data provided for each dimension pair. Coverage extends further to regional breakdowns, trend trajectories, and the competitive detail needed to support segment-level decision-making.

By Primary Market Dimension

  • Real-Time Freight Visibility Platforms
  • Fleet Telematics and Electronic Logging Hardware
  • Cold Chain Condition Monitoring
  • Freight Marketplace Matching Services
  • Cargo Security and Theft Prevention

By End-Use Industry

  • Retail and Consumer Goods
  • Manufacturing and Industrial
  • Pharmaceutical and Healthcare
  • Food and Agriculture
  • Automotive and Parts Distribution

By Commercial Dimension

  • Large Enterprise Shippers
  • Small and Medium Freight Carriers
  • Third-Party Logistics Providers
  • Freight Brokers and Marketplaces

By Region

  • North America
  • Western Europe
  • East Asia
  • South Asia and Pacific
  • Latin America
  • Middle East and Africa
  • Eastern Europe

Scope, Methodology, and Coverage

Every figure in this report is reproducible from documented input assumptions. The scope below maps the historical period, the forecast horizon, the segmentation dimensions, and the countries covered, alongside the underlying primary and qualitative methodology.
Historical Period
2020 to 2025
Forecast Period
2026 to 2036
Base Year
2025 (USD billions; MMA Primary Research Dataset, September 2026)
Market Definition
This report covers software platforms and IoT hardware enabling real-time tracking, condition monitoring, and coordination of freight shipments across road, rail, ocean, and air transport, measured on a global software and hardware revenue basis. It excludes core transportation management system modules and warehouse management software not specifically tied to in-transit shipment visibility.
Quantitative Units
USD billions, global market size and forecast
Segmentation Dimensions
Product/technology type, end-use industry, commercial/customer dimension, region
Regions Covered
North America, Western Europe, East Asia, South Asia and Pacific, Latin America, Middle East and Africa, Eastern Europe
Countries Covered
United States, China, Germany, France, United Kingdom, Japan, South Korea, India, Vietnam, Canada, Brazil, Mexico, Indonesia, Thailand, Malaysia, United Arab Emirates, Saudi Arabia, South Africa, Nigeria, Turkey, Poland, Netherlands, Italy, Spain, Sweden, Switzerland, Argentina, Colombia, Australia, Singapore, and additional markets relevant to this sector
Key Companies Profiled
Project44, FourKites, Samsara, Trimble, Descartes Systems, Overhaul, Shippeo, Sixfold, Wabco (ZF CVS), Geotab, Motive, Convoy, Flexport, Anteo, Blume Global, MacroPoint, Loadsmart, Transporeon, Vizion, Roambee
Quantitative Methodology
Primary survey, n=3,800 respondents, Q4 2025, six countries; demand-side model with trade association cross-validation
Qualitative Methodology
47 expert interviews, Q4 2025; applied to validate demand model assumptions, identify emerging dynamics, and assess competitive positioning
Report Format
PDF and XLSX data workbook (Word format preview document)
Publisher
Market Minds Advisory
Report Code
MMA-2026-TEC-130
Published
September 2026
Contact
sales@marketmindsadvisory.com | www.marketmindsadvisory.com

Purchase the full Connected Logistics Market Report (2026 to 2036).

This report delivers a comprehensive analysis of the global Connected Logistics Market, covering market sizing, segmentation, and regional dynamics through 2036. It profiles the competitive landscape across twenty leading vendors, benchmarked on a consistent platform revenue basis. Regional analysis spans all seven major world regions, quantifying share and growth rate differences driven by trade, regulatory, and technology adoption factors. The report also examines revenue diversification strategies, input cost exposure, and portfolio economics shaping vendor profitability. A dedicated case study illustrates practical implementation lessons for shippers pursuing freight visibility rollouts.
Ten-year market size and CAGR forecast through 2036
Five-segment MECE market breakdown with growth rates
Seven-region share and growth rate analysis
Twenty-company competitive benchmarking on platform revenue basis
Revenue diversification strategy analysis across four commercial levers
Anonymized client implementation case study with outcomes

Built For The People Who Decide

From boardroom strategy to bench-side execution, this report is read cover-to-cover by leaders shaping the next decade of their industry, turning demand scenarios, market dynamics and valuation benchmarks into decisions.
CXOs/ Presidents/ VPs/ Managers
M&A and Corporate Development
Strategy Teams and R&D Heads
Procurement and Product Directors
Regulatory and Compliance Leaders
Investor Relations and Equity Analysts