Market Minds Advisory
Western Europe Conference Room Solution Market

Western Europe Conference Room Solution Market: Western Europe Conference Room Solution Market: Occupancy Reality, Refresh Deferral and Rooms Nobody Books 2026 to 2036

European offices are half empty and full of meeting rooms sized for a workforce that no longer attends. The refresh cycle is now a consolidation exercise dressed up as a technology upgrade.

Lead Analyst

Published

September 2026

Make Smarter Decisions with Customized Research Insights

Request a free sample report and evaluate market opportunities, growth trends, and competitive dynamics relevant to your business needs.

2025 MARKET VALUE$4.3BMarket Size 2025
2036 FORECAST VALUE$8.9BBase Case , 2026 to 2036
CAGR 2026 TO 20366.9 %Bull 8.1% / Bear 5.7%
INCREMENTAL OPPORTUNITY$4.3BNet 10- year value creation
EXPANSION MULTIPLE1.93x2036 value over 2026 base
Strategic Levers
M&A Pipeline
Regional Outlook
Country Rankings
Competitive Intelligence
Segmental Deep-dive
Call-Us : 91 93563 13602

Executive Snapshot and Market Trajectory.

European offices are half empty and full of meeting rooms sized for a workforce that no longer attends in those numbers. The refresh cycle now underway is a consolidation exercise dressed up as a technology upgrade, and buyers know it. Average room occupancy runs near 36% across the region.
The market reaches USD 4.6 billion in 2026 and USD 8.9 billion by 2036, a 1.93 times expansion at 6.9% annually across Western Europe. Small room and focus space systems grow at 10.4%, half again the market rate of 6.9%, because two and three person meetings are what actually happen in these buildings now. Poland-based deployment services compound fastest at 11.2%. Certification decides shortlists.
Five suppliers hold 58% of Western European spending, and the position rests on platform certification rather than on audio or video quality. Cisco Systems, Logitech, Poly, Neat and Barco lead. Room utilisation data is what decides how many systems an organisation actually buys. Median meeting size sits at four participants while large rooms run near 21% utilisation, which means the correction underway is about room plan rather than about equipment quality at all.
Market Definition
This report covers conference room solutions deployed across Western Europe: the audio, video and control equipment and associated software that makes a physical meeting space work for hybrid meetings. It spans small room and focus space systems, large room and boardroom systems, room booking and occupancy analytics platforms, audio conferencing and ceiling microphone systems, room control and scheduling displays, and the managed services and deployment work sold with them. It excludes personal headsets and webcams, meeting platform software licences, unified communications calling services, digital signage, and building management systems.
Base Year Value
$4.3B in 2025 (MMA Primary Research Dataset, September 2026)
Forecast Period
2026 to 2036, eleven discrete annual values
CAGR
6.9% base case. Bull 8.1%. Bear 5.7%.
Fastest Growth Segment
Small Room And Focus Space Systems: 10.4% CAGR
Fastest Growth Country
Poland: 11.2% CAGR
Fastest Growth Region
South Asia and Pacific: 8.7% CAGR
Largest Region
Western Europe: 44% of 2025 global value
Market Leaders
Cisco Systems, Logitech, Poly, Neat and Barco lead on Western European conference room solution revenue. Source: MMA Analysis.
Primary Survey
n=3,800 procurement and R&D decision-makers, Q4 2025, six countries
Methodology
Demand-side build-up, cross-validated against public data, 47 expert interviews

Western Europe Conference Room Solution Market Forecast Scenarios

conference-room-solution-industry-analysis-in-west-size-forecast-scenario-1790000860066
Between 2020 and 2025 the category compounded at 5.8% across Western Europe, and the shape of demand inverted completely. Organisations equipped every room for hybrid meetings during the first two years, then discovered that most of those rooms sat empty and the ones people fought over seated four. Spending since has gone into fixing that mismatch rather than into any further coverage expansion.
The base case holds 6.9% on three mechanisms. Small room and focus space systems keep replacing large room capacity as organisations rebuild around the meetings that actually happen. Occupancy analytics keep informing property decisions worth far more than the hardware that produces the data. And the equipment installed hurriedly in 2021 and 2022 keeps reaching end of support across a European installed base that skews older than the North American one.
The bull case at 8.1% assumes office attendance mandates hold and organisations equip for genuine capacity rather than for observed low occupancy. The bear case at 5.7% is continued property consolidation, where European organisations shed floor space faster than they refresh rooms and the total number of spaces requiring equipment falls below what the installed base implies today.

Rooms Sized For Nobody

The mismatch is the whole story. Median meeting size across Western European offices sits at four participants while large rooms run at around 21% utilisation against available hours, and average room occupancy overall reaches roughly 36%. Organisations equipped for a distribution of meetings that has not existed since 2019. What they are buying now is the correction, and it means more rooms, smaller, rather than better equipment in the ones they already have.
TOP FIVE CONCENTRATION58%Held by suppliers carrying certification across major meeting platforms
AVERAGE ROOM OCCUPANCY36%Booked capacity actually used across a typical European working week
MEDIAN MEETING SIZE4Participants in a typical meeting held in a physical room
LARGE ROOM UTILISATION21%Boardroom and large space capacity used against available booking hours
EQUIPMENT REFRESH INTERVAL7 yearsTypical replacement cycle for installed room conferencing equipment
MANAGED SERVICE ATTACH43%Deployments including ongoing managed service or support contracts
Occupancy data is worth more than the hardware generating it. A property director deciding whether to renew a lease on a floor uses room utilisation figures that cost a fraction of the rent under discussion. Room booking and occupancy analytics consequently reach a buyer who never cared about audio quality, and suppliers who understood that early are selling into property budgets rather than competing for shrinking technology ones.
Certification rather than performance decides supply. Five suppliers hold 58% of Western European spending because meeting platform certification is what determines whether a system works with what the organisation already runs. Equipment quality converges quickly and platform compatibility does not, which is why buyers shortlist on the certification list before anybody demonstrates anything at all.
"Every European organisation I speak to has the same problem. They built twelve-person rooms in 2021 and now hold four-person meetings in them while people queue for the two-seat booths. Nobody wants to admit the equipment was fine and the room plan was wrong."
Director, Workplace Technology and Collaboration Practice · MMA Technology Practice · September 2026

Market Trends

Room Sizing Corrections Drive More Spending Than Upgrades

Median meeting size across Western European offices sits at four participants while large rooms run near 21% utilisation, which means organisations equipped for a meeting distribution that stopped existing in 2019. Spending now goes into subdividing and re-equipping rather than into better systems in existing spaces. Small room and focus space systems grow at 10.4% against 6.9% for the market as a direct consequence, and suppliers positioned around large room performance are chasing the shrinking half. Buyers generally understand this before the supplier raises it. Refresh capital approved on age grounds keeps getting redirected once occupancy evidence appears.
Market Impact: Refresh interval runs 7 years
Occupancy Data Reaches Property Rather Than Technology Budgets

Room utilisation figures inform lease renewal decisions worth far more than the equipment producing them, which puts analytics in front of a property director who never cared about audio quality. Average occupancy near 36% is exactly the number that makes a floor consolidation case. Suppliers who understood this early sell into property budgets while competitors argue over shrinking technology allocations, and that difference is worth more than any product advantage in this market. Property budgets are expanding across Western Europe while technology allocations contract, which makes the buyer choice a commercial decision rather than a preference.
Market Impact: Managed attach reaches 43% today

Market Opportunities and Growth Drivers

Pandemic Era Equipment Reaches End Of Support

Equipment installed hurriedly across 2021 and 2022 is reaching end of support on a typical seven year refresh interval, and the Western European installed base skews older than the North American one because deployment started later and ran longer. That creates a replacement wave regardless of whether occupancy justifies the room count. Organisations facing it are taking the opportunity to resize rather than replace like for like, which changes what gets bought. Refresh capital approved on equipment age grounds is being redirected into resizing once occupancy evidence reaches the decision.
Market Impact: Occupancy sits at just 36%

Central European Deployment Cost Advantage Shifts Delivery

Poland-based deployment and managed services compound at 11.2%, faster than any other supply origin serving Western European buyers, because installation and support labour costs materially less while technical capability is genuinely equivalent. Managed service attach sits near 43% of deployments and is rising. Organisations buying equipment in one country and support from another have made delivery location a commercial variable that suppliers now compete on directly. Suppliers still delivering every service hour from the country of installation are quoting against a materially different cost base for identical technical work, and losing on price.
Market Impact: Top five hold 58% of supply

Market Restraints and Challenges

Property Consolidation Shrinks The Room Count Itself

Western European organisations continue shedding floor space, which reduces the total number of meeting spaces requiring equipment regardless of how good that equipment becomes. The root cause is that occupancy near 36% makes lease reduction the largest available cost saving for most organisations. Commercially this shrinks the installed base. Mitigation runs through analytics that make suppliers part of the consolidation decision, through higher value per remaining room, and through managed service revenue independent of unit count. None of those stops the consolidation; they make the supplier part of the decision rather than a casualty of it.
Market Impact: Median meeting holds 4 people

Platform Certification Cycles Delay Product Availability

Meeting platform certification determines whether a system works with what an organisation already runs, and each platform revision requires requalification before products can be sold as compatible. The root cause is that platform vendors control the certification programmes and revise them on their own schedules. Commercially this delays launches unpredictably. Mitigation runs through early access programmes, through hardware designed for firmware-level recertification, and through multi-platform certification that spreads the exposure. Certification breadth across several platforms spreads the exposure and reaches more shortlists, which matters more in fragmented Western Europe than anywhere else.
Market Impact: Occupancy runs near 36% only
3 additional market trends, 4 additional growth drivers, and 2 additional restraints and challenges are covered in the full report. Contact sales@marketmindsadvisory.com to access the complete intelligence.

Segment CAGR and Growth Architecture

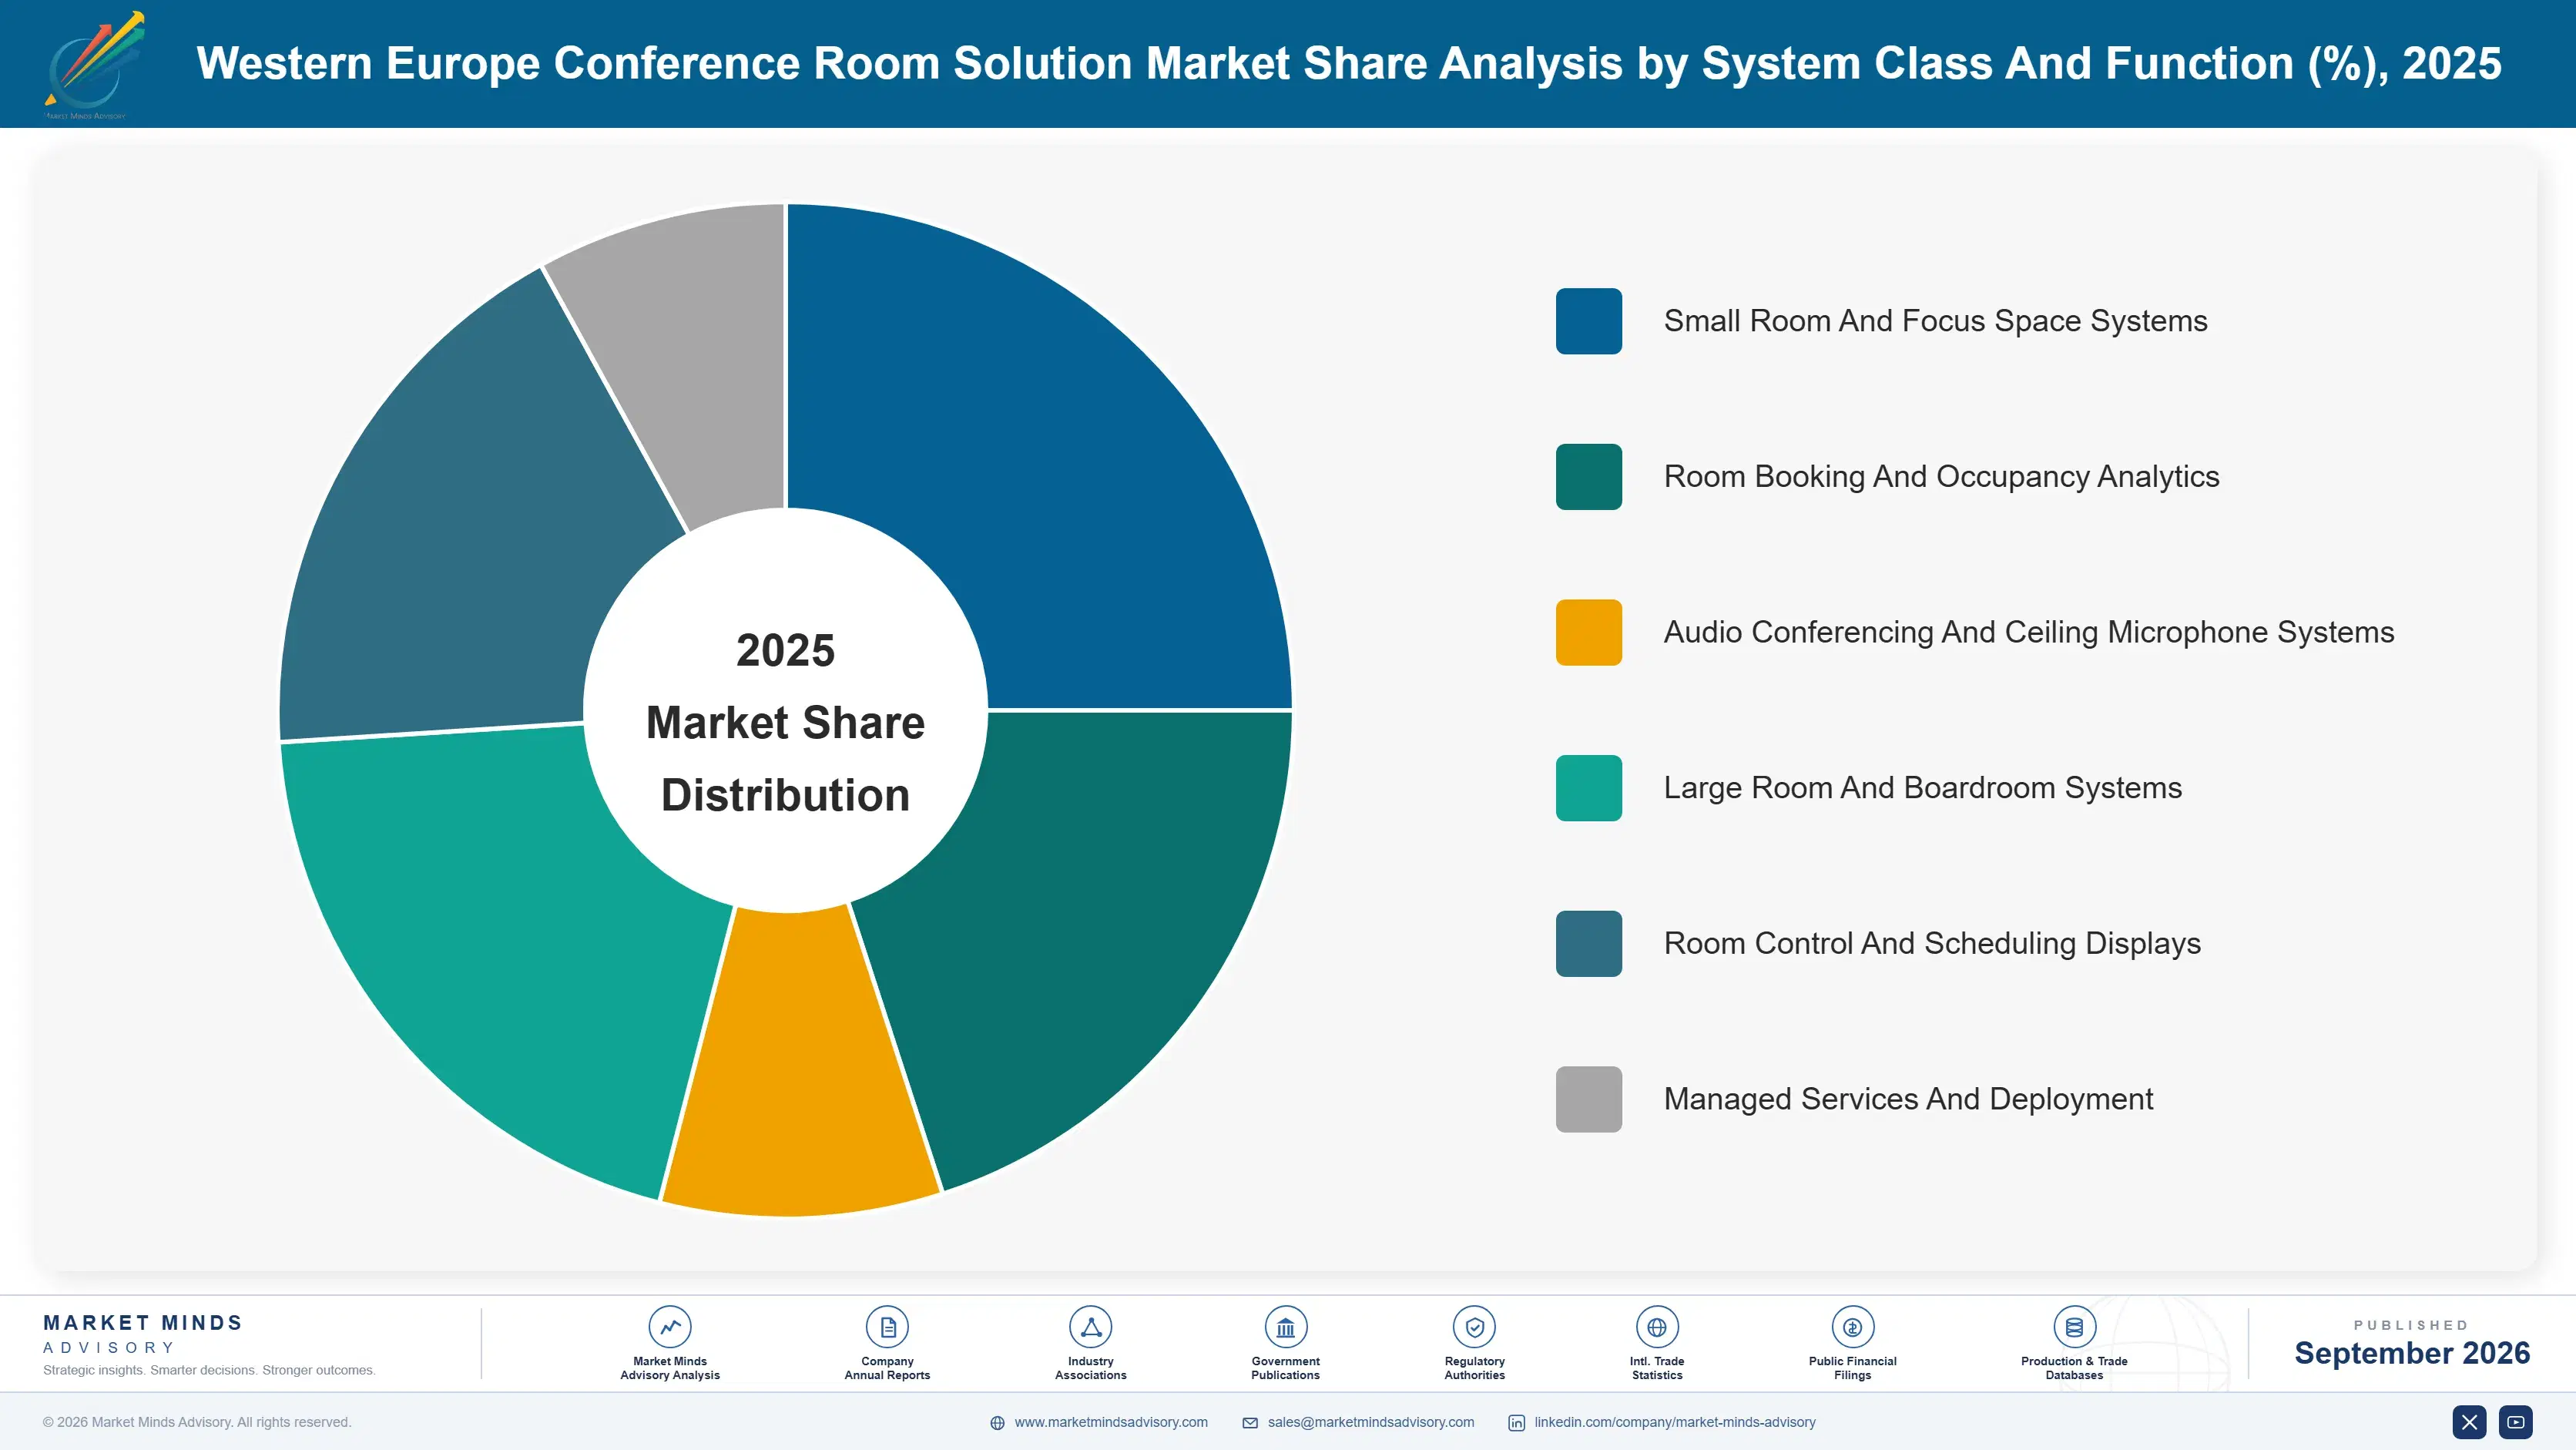
Segmentation follows system class and platform function, since each carries quite different room sizing exposure, certification burden and buyer within the organisation. Six classes cover the market: small room and focus space systems, room booking and occupancy analytics, audio conferencing and ceiling microphone systems, large room and boardroom systems, room control and scheduling displays, and managed services and deployment work.
conference-room-solution-industry-analysis-in-west-market-share-analysis-1790000860603

Small Room And Focus Space Systems

Small room and focus space systems grow at 10.4%, half again the market rate of 6.9%, because median meeting size across Western European offices sits at four participants while large rooms run near 21% utilisation against available hours. Organisations are subdividing and re-equipping rather than upgrading spaces that nobody fills. These systems also carry lower unit prices, so the revenue growth understates the volume shift considerably, and suppliers whose portfolios were built around large room performance find themselves competing in a category where integration simplicity matters far more than audio engineering does. Volume growth here is considerably steeper than the revenue figure alone conveys. Unit prices are lower and project counts considerably higher.
CAGR 10.4%

Room Booking And Occupancy Analytics

Room booking and occupancy analytics compound at 9.1% because utilisation data informs lease renewal decisions worth far more than the equipment producing it, which places this category in front of a property director rather than a technology manager. Average occupancy near 36% is precisely the figure that makes a floor consolidation case work. Suppliers who reached that buyer early are selling into property budgets that are expanding while technology allocations contract, and the resulting position is considerably more durable than any hardware advantage available in this market. The relationship also survives refresh cycles that hardware positions have to re-compete for every seven years. Hardware re-competes every seven years. Analytics relationships do not.
CAGR 9.1%
Full segment breakdown across 6 segments available in the complete report.

Regional Architecture and Country Demand Map

This is a Western Europe scoped report, so the regional table records where the supplied value originates rather than where it is consumed. Western Europe holds 44% through local integration, deployment and property analytics work. East Asia contributes 21% through hardware manufacturing. Poland leads services growth.

Western Europe

Western Europe accounts for 44% of the value supplied into this market, well above the usual band because this is a Western Europe scoped report and local integration, deployment, managed service and property analytics work all originate here. Barco supplies from within the region alongside a substantial integrator base serving national markets separately. Room sizing corrections and property consolidation decisions are both taken locally by facilities and property functions. Growth at 5.6% is the slowest of any supply origin, on services pricing rather than volume. National integrators here face the sharpest pressure from central European delivery, since their whole model rests on local presence that buyers increasingly decline to pay a premium for.
Share: 44% | CAGR: 5.6% (2026 to 2036)

East Asia

East Asia contributes 21% of supplied value, below the usual band, through manufacturing of cameras, displays, audio hardware and control electronics that reach Western European rooms through supplier channels rather than direct relationships. Chinese and Japanese component and assembly capacity underpins almost every system deployed in the region regardless of whose brand appears on it. Growth at 7.8% runs above the global rate because hardware content per room rises as small room systems proliferate faster than large ones. Component and assembly capacity here underpins the whole category regardless of brand, and hardware content per installed room is rising as room counts fall and system density increases. Brand ownership sits elsewhere.
Share: 21% | CAGR: 7.8% (2026 to 2036)
Regional intelligence for 5 additional markets available in the complete report: North America, Eastern Europe, South Asia and Pacific, Latin America, Middle East and Africa. Contact sales@marketmindsadvisory.com.
conference-room-solution-industry-analysis-in-west-country-cagr-analysis-1790000861149

Where Room Spending Now Lands

Rooms were sized for a workforce that stopped attending, occupancy data reaches property budgets that technology budgets cannot, and certification rather than performance decides shortlists. The four levers below follow those conditions rather than any argument about audio or video quality, which converged years ago. Each addresses a commercial condition instead. Product quality comes last.

Sell Subdivision Rather Than Equipment Upgrades

Median meeting size sits at 4 participants while large rooms run near 21% utilisation, which means the problem is room plan rather than equipment quality. Suppliers proposing subdivision and re-equipping reach a larger project than any upgrade conversation produces. Those defending large room performance are competing for the half of the installed base that occupancy data is steadily condemning, and the buyer usually already knows which half that is. Subdivision projects run larger than upgrades and reach a facilities budget rather than a technology one. Occupancy evidence carries the argument.
Market Impact: Large rooms now run at just 21% utilisation

Take Occupancy Data To The Property Director

Room utilisation figures inform lease decisions worth far more than the equipment producing them, and occupancy near 36% is exactly the number that makes a floor consolidation case. That conversation happens in a property budget that is expanding while technology allocations contract. Suppliers reaching that buyer sell analytics at values hardware never commands, and they become part of the consolidation decision rather than a casualty of it. Analytics cost a fraction of the rent under discussion. Suppliers reaching that buyer become part of the consolidation decision rather than one of its casualties.
Market Impact: Occupancy now runs near just 36% region wide

Certify Across Platforms Before Buyers Shortlist

Meeting platform certification determines whether a system can be shortlisted at all, and each platform revision requires requalification on a schedule the platform vendor controls entirely. Suppliers certified across several platforms spread that exposure and appear on more shortlists. Those holding single-platform certification are absent from evaluations whenever an organisation runs something else, which happens more often across Western Europe than in any other market. An organisation running 3 different meeting platforms across its estate will not shortlist a single-platform supplier at all, whatever the equipment does. Breadth spreads the exposure.
Market Impact: Top five now hold 58% of all supply

Deliver Services From Central Europe At Lower Cost

Managed service attach sits near 43% of deployments and Poland-based delivery compounds at 11.2%, because installation and support labour costs materially less while capability is genuinely equivalent. Organisations have made delivery location a commercial variable rather than an assumption. Suppliers still delivering every service hour from the country of installation are quoting against competitors whose cost base is materially different, and losing on price for identical work. Delivery location is now compared directly in tenders. Identical technical work competes on cost base rather than on capability, and local staffing has stopped commanding the premium it once did.
Market Impact: Managed attach now reaches a full 43% today

Who Controls the Margin Pool

Five suppliers hold 58% of Western European conference room solution revenue, and that position rests on meeting platform certification rather than on audio or video performance, which converges quickly across serious participants. Cisco Systems, Logitech, Poly, Neat and Barco lead. All participants are assessed on Western European conference room solution revenue rather than on broader networking, peripheral or display businesses they also operate. Concentration has held because certification programmes favour suppliers already inside them.
Competition runs on certification breadth and room sizing fit far more than on equipment specification. The second dimension is analytics capability, because occupancy data reaches property budgets that are expanding while technology allocations contract, and suppliers without it argue for a shrinking allocation against everybody else in the same position. Equipment specification competes a distant third behind both of those.

Pressure is emerging from meeting platform vendors specifying reference hardware directly, which narrows what buyers consider. Rankings shift where organisations resize rooms and where property consolidation proceeds fastest, particularly across the Nordic markets, the Netherlands and the United Kingdom at present. National integrators carry the most exposure to central European delivery pricing.
conference-room-solution-industry-analysis-in-west-company-positioning-matrix-1790000861680

Competitive Moat and Risk Dimensions

CISCO SYSTEMS

Moat: Platform Certification Depth

Cisco holds certification across meeting platforms alongside its own, which matters because certification rather than performance determines whether a system reaches a Western European shortlist at all. Organisations running mixed platform estates need equipment that works with each of them. Competitors certified on a single platform are simply absent from evaluations wherever the organisation runs something different.
CISCO SYSTEMS

Risk: Large Room Portfolio Weight

Portfolio strength concentrated in large room and boardroom systems sits in the half of the installed base that occupancy data is condemning, with large rooms running near 21% utilisation. Growth is in small rooms and focus spaces at lower unit values. Defending premium positions in spaces organisations are subdividing is a difficult argument to sustain across a refresh cycle.
NEAT

Moat: Small Room Design Focus

Neat built around small room and focus space systems where installation simplicity matters more than audio engineering depth, which is exactly where Western European demand has moved as median meeting size settled at four participants. That segment grows at 10.4% against 6.9% for the market. Competitors adapting large room designs downward carry cost and complexity the category does not reward.
NEAT

Risk: Services Attach Absence

Managed service attach near 43% of deployments is where recurring revenue and customer relationship durability both sit, and a hardware-focused position captures little of it. Product design advantage wins the initial purchase and not the ongoing relationship. Suppliers with integrator and managed service depth hold accounts across refresh cycles that product quality alone does not reach.

Players Tracked

Prominent Players

Cisco Systems
Logitech
Poly
Neat
Barco

Other Key Players

Yealink
Crestron Electronics
Biamp Systems
Shure
Sennheiser
Jabra
Huddly
DTEN
Q-SYS
Extron Electronics
Kramer Electronics
Sharp NEC Display Solutions
Bose Professional
Evoko
Sony Professional

Recent Developments

MARCH 2025

Organisations Subdivide Large Rooms Across European Estates

Western European organisations subdivided large meeting rooms into smaller spaces during refresh programmes, a facilities decision rather than any corporate transaction. Median meeting size sits at four participants while large rooms run near 21% utilisation, and the resulting mismatch is what refresh budgets are now being spent correcting.
Signal: Room plan rather than equipment quality is what these European refresh programmes are actually fixing now.
SEPTEMBER 2024

Occupancy Analytics Move Into Property Decision Making

Room utilisation data moved from technology reporting into property and lease decision making across large European occupiers, a budgeting development rather than any acquisition. Occupancy near 36% is the figure that supports floor consolidation, and the analytics producing it cost a fraction of the rent under discussion.
Signal: Suppliers reaching property directors now sell into budgets that are expanding rather than steadily contracting instead.
JUNE 2025

Central European Delivery Displaces Local Service Labour

Suppliers and integrators shifted deployment and managed service delivery toward Polish and Czech operations serving Western European projects, a sourcing development rather than any corporate event. Managed service attach near 43% of deployments makes labour cost a material component of what buyers actually compare across tenders.
Signal: Identical technical work now competes on delivery location rather than on technical capability at all today.

What A Room Costs

Camera, display and audio hardware absorb roughly 46% of installed room cost, sourced largely from East Asian manufacturing whichever brand appears on the equipment. Installation and commissioning labour takes around 21% and varies enormously by country across Western Europe. Platform certification and firmware maintenance absorb about 12%, with room control, cabling and scheduling displays taking the remaining balance.
Installation labour costs rose across Northern and Western European markets through 2023 and 2024 while central European rates stayed materially lower for equivalent technical work. Logitech Annual Report 2024 and Barco Annual Report 2024 both record component cost and services delivery among principal operating variables. Suppliers delivering through Polish and Czech operations retained margin that competitors staffing locally in high-cost markets could not. Buyers now compare delivery location directly in tenders.

The competitive disadvantage mechanism is delivery location rather than hardware price. A supplier installing through central European teams carries a labour cost base that a locally staffed competitor cannot approach for identical work. Exposure concentrates among national integrators, since their whole model rests on local presence that buyers increasingly refuse to pay a premium for when the technical outcome is the same.
conference-room-solution-industry-analysis-in-west-cost-volatility-analysis-1790000861876

Deliver Installation And Support From Central Europe

Installation and commissioning labour absorbs around 21% of installed room cost and varies enormously across Western European markets for identical technical work. Central European delivery teams cost materially less at equivalent capability. Buyers have already made delivery location a commercial variable, so suppliers holding out for local staffing are defending a premium their customers have stopped agreeing to pay.

Design Hardware For Firmware Level Recertification

Platform certification and firmware maintenance absorb about 12% of cost and recur whenever a meeting platform revises its programme on a schedule the supplier does not control. Hardware designed so recertification is a firmware exercise rather than a redesign contains that expense. The architecture decision has to be taken early, since retrofitting it into a shipped product is not realistic.

Standardise Component Platforms Across Room Sizes

Camera, display and audio hardware absorb roughly 46% of installed cost, and maintaining separate component platforms for small and large rooms multiplies both inventory and certification work considerably. Sharing across room sizes spreads that expense as demand shifts toward smaller spaces. The discipline is product management rather than engineering, and it erodes whenever ranges are developed independently.

Portfolio Architecture for Margin Defence

Margin architecture separates on recurring revenue rather than on hardware sophistication. Room control and scheduling displays earn least, since they are commoditised and frequently specified on price alone. Large room and audio systems sit above on specification depth. Occupancy analytics, managed services and small room systems earn most, because each carries either recurring revenue or the volume that room resizing is generating across the region.
The volume versus premium tension runs between large room specification and small room volume, which reward opposite portfolio decisions entirely. Large rooms carry higher unit values against utilisation near 21% that buyers can measure. Small rooms carry lower values against demand that is genuinely growing. Suppliers defending large room premium positions are defending revenue per unit in a category losing units steadily.

High-value pools concentrate in occupancy analytics and in managed services, and neither is reached through hardware capability. Analytics requires a relationship with property functions that technology suppliers have rarely built. Managed services requires a delivery organisation at competitive cost, which increasingly means central European operations. Both explain why five suppliers hold 58% while the durable revenue sits outside the equipment itself.

Volume / Commodity-Adjacent

Room control panels and scheduling displays, commoditised products frequently specified on price alone and rarely differentiated in any evaluation a buyer actually runs. The twelve point spread separates suppliers sharing component platforms across room sizes from those maintaining separate ranges.
Gross Margin: 22% to 34%

Premium / Certified

Large room and boardroom systems and audio conferencing and ceiling microphone systems, where specification depth and acoustic performance still determine selection in the spaces that justify them. The twelve point spread tracks certification breadth across meeting platforms rather than any audio quality difference.
Gross Margin: 38% to 50%

Sustainability / Regulatory / Next-Generation

Room booking and occupancy analytics, managed services and small room and focus space systems, each carrying either recurring revenue or the volume that room resizing generates. The sixteen point spread reflects analytics platform depth and services delivery cost base combined.
Gross Margin: 55% to 71%
conference-room-solution-industry-analysis-in-west-portfolio-architecture-1790000862384

High-value Sub-segments and Strategic Watch-out

Small Room And Focus Space Systems

Grows at 10.4% because median meeting size sits at four participants and organisations are subdividing accordingly. The sixteen point spread reflects delivery cost base. Lower unit values mean revenue growth understates the volume shift considerably. Integration simplicity beats audio engineering here. Demand is genuinely growing.
Gross Margin: 55% to 71%

Room Booking And Occupancy Analytics

Grows at 9.1% because utilisation data informs lease decisions worth far more than the hardware producing it. The sixteen point spread reflects platform depth. Property budgets are expanding while technology allocations across the region contract. The relationship survives every refresh cycle. Property budgets keep expanding.
Gross Margin: 55% to 71%

Audio Conferencing And Ceiling Microphone Systems

Grows at 6.4% on rooms where acoustic performance genuinely affects whether remote participants can follow. The twelve point spread reflects certification breadth. Smaller spaces need considerably less of this equipment than large rooms required. Demand follows large room count downward. Acoustics still matter here. Small rooms need less.
Gross Margin: 38% to 50%

Room Control And Scheduling Displays

Grows at 3.8%, slowest of the six classes, as commoditised products specified on price with almost no differentiation available. The twelve point spread reflects platform sharing. Fewer rooms overall means fewer panels regardless of how good they are. Differentiation is essentially absent here. Price decides everything.
Gross Margin: 22% to 34%

Why Data Beats Hardware

The annuity here is the analytics relationship rather than the equipment. Room utilisation data feeds lease decisions on a continuous cycle, while hardware gets replaced roughly every seven years and competes on price each time. A supplier producing the occupancy figures a property director relies on holds a position that survives refresh cycles. One selling only equipment re-competes for the same building every time the cycle comes around.
Depth varies by which function the supplier reaches. A technology manager evaluating cameras compares specifications and buys on price and certification. A property director using occupancy data to justify shedding a floor is making a decision worth many times the equipment budget and values the supplier accordingly. Suppliers who never reached the second buyer are competing entirely within a budget that European organisations keep reducing.

The buyer has moved and most positioning has not. An audio visual manager evaluated acoustic performance and integration effort against a room specification. A workplace function evaluates whether room sizes match observed meeting patterns. A property function evaluates floor space against occupancy near 36%. Only the first of those three cares about equipment quality, and only the first has a shrinking budget.
conference-room-solution-industry-analysis-in-west-end-use-penetration-index-1790000862877

What Wins European Rooms

These are among the four positions where our research anticipates prominent divergence between winners and laggards over the coming forecast period. Each is grounded in the demand model, the regulatory perimeter, and the announced capacity pipeline.
01 / ROOM PLAN CORRECTION

Sell Subdivision, Not Better Equipment

Median meeting size across Western European offices sits at four participants while large rooms run near 21% utilisation against available booking hours across a working week. The problem is the room plan rather than the equipment installed in it, and organisations increasingly understand that themselves. Suppliers proposing subdivision and re-equipping reach a substantially larger project than any upgrade conversation about audio or video quality will ever produce in a refresh conversation about equipment specifications alone or installed equipment age anywhere in the estate.
02 / PROPERTY BUDGET ACCESS

Take The Data Upstairs

Room utilisation figures inform lease renewal decisions worth many times the equipment producing them, and occupancy near 36% is exactly the number that makes a floor consolidation case stand up. That conversation happens inside a property budget which is expanding while technology allocations across European organisations keep contracting. Suppliers reaching that buyer become part of the consolidation decision rather than one of its casualties once the floor decision is taken and the floor space released by the property function during the review.
03 / CERTIFICATION BREADTH COVERAGE

Appear On Every Shortlist

Meeting platform certification determines whether a system can be shortlisted at all, and each platform revision requires requalification on a schedule the platform vendor controls entirely by itself. Suppliers certified across several platforms spread that exposure and reach more evaluations as a direct result. Those holding single-platform certification are simply absent wherever an organisation runs something else, which happens frequently across a fragmented European market running several platforms at once across their European estates in different national offices across the same organisation.
04 / DELIVERY COST STRUCTURE

Install From Where Labour Costs Less

Managed service attach sits near 43% of deployments and Poland-based delivery compounds at 11.2%, because installation and support labour costs materially less at genuinely equivalent technical capability. Buyers have already made delivery location a commercial variable rather than an unexamined assumption. Suppliers still delivering every service hour locally are quoting against competitors with a different cost base and losing identical work on price they could otherwise have won on price rather than merit for entirely identical outcomes and comparable delivery quality.

Engagement Snapshot From the Field

A live engagement with an industry participant carrying material or product regulatory and market exposure ahead of a defining policy shift, showing how our research translates into a defensible multi-year portfolio strategy.
MARKET MINDS ADVISORY · CLIENT ENGAGEMENT SUMMARY
Western Europe Conference Room Solution Producer Strategic Portfolio Review and Transition Roadmap 2026·Investment Scenario on Western Europe Conference Room Solution Exposure Evaluation 2025-26
CLIENT PROFILE
A professional services firm operating across six Western European countries, facing a refresh proposal to replace conferencing equipment in more than two hundred meeting rooms. Facilities leadership had approved the capital request on age grounds, without anybody establishing how many of those rooms were being used or at what occupancy. Nobody had measured occupancy at all.
STRATEGIC CHALLENGE
Technology wanted like-for-like replacement to keep the estate consistent across countries. Property wanted evidence for a floor consolidation it was already considering. Nobody had connected the two, and the refresh capital request would have equipped rooms in buildings that property was separately proposing to exit within eighteen months. Neither function had seen the other's plan.
MMA APPROACH
MMA instrumented room occupancy across the estate for a full quarter, measuring booked against actual use and meeting size distribution by country. We modelled refresh cost against a resized room plan and against the floor consolidation property was considering. Work drew on 47 expert interviews conducted in Q4 2025 with occupiers, integrators and workplace technology suppliers.
KEY FINDINGS
  1. Rooms seating 8 or more ran at roughly 19% occupancy while two and four person spaces were fully booked throughout the working week.
  2. Around 30% of the rooms in the refresh proposal sat in buildings that property was already evaluating for exit within eighteen months.
  3. Resizing the estate to match observed meeting sizes required fewer rooms overall and less capital than like-for-like replacement (client-reported, unverified by MMA).
  4. Occupancy evidence produced for the refresh decision turned out to be worth more to property than to technology across the whole engagement.
CLIENT PROFILE
A professional services firm operating across six Western European countries, facing a refresh proposal to replace conferencing equipment in more than two hundred meeting rooms. Facilities leadership had approved the capital request on age grounds, without anybody establishing how many of those rooms were being used or at what occupancy. Nobody had measured occupancy at all.
STRATEGIC CHALLENGE
Technology wanted like-for-like replacement to keep the estate consistent across countries. Property wanted evidence for a floor consolidation it was already considering. Nobody had connected the two, and the refresh capital request would have equipped rooms in buildings that property was separately proposing to exit within eighteen months. Neither function had seen the other's plan.
MMA APPROACH
MMA instrumented room occupancy across the estate for a full quarter, measuring booked against actual use and meeting size distribution by country. We modelled refresh cost against a resized room plan and against the floor consolidation property was considering. Work drew on 47 expert interviews conducted in Q4 2025 with occupiers, integrators and workplace technology suppliers.
KEY FINDINGS
  1. Rooms seating 8 or more ran at roughly 19% occupancy while two and four person spaces were fully booked throughout the working week.
  2. Around 30% of the rooms in the refresh proposal sat in buildings that property was already evaluating for exit within eighteen months.
  3. Resizing the estate to match observed meeting sizes required fewer rooms overall and less capital than like-for-like replacement (client-reported, unverified by MMA).
  4. Occupancy evidence produced for the refresh decision turned out to be worth more to property than to technology across the whole engagement.
RECOMMENDED STRATEGY
Phase 1: Phase one: pause the refresh in buildings property is evaluating for exit, since roughly a third of proposed rooms sat in them. Phase 2: Phase two: resize the remaining estate to observed meeting sizes rather than replacing large rooms that run near twenty percent occupancy. Phase 3: Phase three: hand occupancy reporting to property as a standing input, since the data is worth more there than in technology reporting.
OUTCOME
The firm paused refresh in the buildings under review and resized the remaining estate to observed meeting patterns (client-reported, unverified by MMA). Capital spending fell substantially against the original proposal while room availability improved for the meetings people actually hold. Occupancy reporting now feeds property decisions directly, which is the change that outlasted the engagement.

Frequently Asked Questions

Foundational context covering the market sizes, CAGR, scope, country, region and competition that inform every finding below. This section is provided to cover basics and most often pre-purchase conversations, answered from the MMA Primary Research Dataset.

What is the current size of the Western Europe Conference Room Solution Market?

Western European value reaches USD 4.6 billion in 2026, measured as conference room solution revenue across six system classes. The 2025 base was USD 4.3 billion.

How large will the Western Europe Conference Room Solution Market be by 2036?

The market reaches USD 8.9 billion by 2036, an increase of USD 4.3 billion across the forecast period. That represents 1.93 times expansion from the 2026 base.

What is the CAGR for the Western Europe Conference Room Solution Market 2026 to 2036?

The base case runs at 6.9% annually, with a bull case at 8.1% if attendance mandates hold and a bear case at 5.7% if property consolidation continues shrinking the room count.

Which segment is growing fastest?

Small room and focus space systems grow at 10.4%, half again the market rate of 6.9%. Median meeting size across Western European offices sits at four participants.

Who are the major companies in the Western Europe Conference Room Solution Market?

Cisco Systems, Logitech, Poly, Neat and Barco lead on Western European conference room revenue, holding 58% between them. Yealink and Crestron Electronics hold smaller positions here.

Which country is growing fastest?

Poland-based deployment and managed services compound fastest at 11.2%, because installation labour costs materially less at genuinely equivalent capability. Czechia and Romania follow behind it.

Report Segmentation Architecture

The full report scope spans multiple orthogonal segmentation dimensions, with cross-tabulated demand data provided for each dimension pair. Coverage extends further to regional breakdowns, trend trajectories, and the competitive detail needed to support segment-level decision-making.

By System Class And Function

  • Small Room And Focus Space Systems
  • Room Booking And Occupancy Analytics
  • Audio Conferencing And Ceiling Microphone Systems
  • Large Room And Boardroom Systems
  • Room Control And Scheduling Displays
  • Managed Services And Deployment

By End-Use Industry

  • Professional And Financial Services
  • Technology And Software Companies
  • Public Sector And Government Offices
  • Pharmaceutical And Life Sciences
  • Manufacturing And Industrial Head Offices
  • Education And Research Institutions

By Commercial Dimension

  • Systems Integrator Delivery
  • Direct Enterprise Procurement
  • Managed Service Subscription
  • Meeting Platform Reference Specification
  • Facilities Framework Agreements
  • Distribution And Reseller Channel

By Region

  • Western Europe
  • East Asia
  • North America
  • Eastern Europe
  • South Asia and Pacific
  • Latin America
  • Middle East and Africa

Scope, Methodology, and Coverage

Every figure in this report is reproducible from documented input assumptions. The scope below maps the historical period, the forecast horizon, the segmentation dimensions, and the countries covered, alongside the underlying primary and qualitative methodology.
Historical Period
2020 to 2025
Forecast Period
2026 to 2036
Base Year
2025 (USD billions; MMA Primary Research Dataset, September 2026)
Market Definition
This report covers conference room solutions deployed across Western Europe: the audio, video and control equipment and associated software making a physical meeting space work for hybrid meetings, spanning small room and focus space systems, large room and boardroom systems, room booking and occupancy analytics, audio conferencing and microphone systems, room control and scheduling displays, and managed services. It excludes personal headsets and webcams, meeting platform software licences, calling services, digital signage, and building management systems.
Quantitative Units
USD millions, Western European conference room solution revenue; rooms equipped; average room occupancy as a percentage; median meeting size in participants; equipment refresh intervals in years; managed service attach rates across deployments.
Segmentation Dimensions
System class and function; end-use industry; commercial delivery route; supplied value origin across seven regions.
Regions Covered
Western Europe, East Asia, North America, Eastern Europe, South Asia and Pacific, Latin America, Middle East and Africa
Countries Covered
United Kingdom, Germany, France, Netherlands, Belgium, Switzerland, Austria, Sweden, Denmark, Norway, Finland, Ireland, Spain, Portugal, Italy, Luxembourg, Poland, Czechia, Romania, Hungary.
Key Companies Profiled
Cisco Systems, Logitech, Poly, Neat, Barco, Yealink, Crestron Electronics, Biamp Systems, Shure, Sennheiser, Jabra, Huddly, Q-SYS, Evoko, Sony Professional.
Quantitative Methodology
Primary survey, n=3,800 respondents, Q4 2025, six countries; demand-side model with trade association cross-validation
Qualitative Methodology
47 expert interviews, Q4 2025; applied to validate demand model assumptions, identify emerging dynamics, and assess competitive positioning
Report Format
PDF and XLSX data workbook (Word format preview document)
Publisher
Market Minds Advisory
Report Code
MMA-2026-TEC-161
Published
September 2026
Contact
sales@marketmindsadvisory.com | www.marketmindsadvisory.com

Purchase the full Western Europe Conference Room Solution Market Report (2026 to 2036).

This report sizes the Western European conference room solution market from 2026 to 2036 across six system classes, six industries and seven supplied value origins. It explains why median meeting size at four participants against large room utilisation near 21% makes room plan rather than equipment quality the problem refresh budgets are correcting. Occupancy near 36% is analysed as the figure that moves this category into property budgets rather than technology ones. Central European delivery cost advantage is examined as a commercial variable buyers now compare directly. Regional analysis explains where the supplied value originates.
Six system classes sized through to 2036
Room occupancy quantified against installed meeting space capacity
Property budget access analysed as a commercial route
Twenty named suppliers assessed on Western European revenue
Four revenue levers with quantified commercial impact
Anonymised occupier estate review engagement documented in full

Built For The People Who Decide

From boardroom strategy to bench-side execution, this report is read cover-to-cover by leaders shaping the next decade of their industry, turning demand scenarios, market dynamics and valuation benchmarks into decisions.
CXOs/ Presidents/ VPs/ Managers
M&A and Corporate Development
Strategy Teams and R&D Heads
Procurement and Product Directors
Regulatory and Compliance Leaders
Investor Relations and Equity Analysts