Market Minds Advisory
Condensing Unit Market

Condensing Unit Market: The Refrigerant Transition, Cold Chain Buildout, and Where Aftermarket Revenue Actually Sits

Refrigerant phase-down rules are forcing a complete product redesign across the installed base, and the manufacturers who moved early on carbon dioxide and propane are now setting the specification everyone else follows.

Lead Analyst

Bilal Shaikh

Published

September 2026

Make Smarter Decisions with Customized Research Insights

Request a free sample report and evaluate market opportunities, growth trends, and competitive dynamics relevant to your business needs.

2025 MARKET VALUE$21.6BMarket Size 2025
2036 FORECAST VALUE$39.8BBase Case , 2026 to 2036
CAGR 2026 TO 20365.7 %Bull 6.9% / Bear 4.5%
INCREMENTAL OPPORTUNITY$16.9BNet 10- year value creation
EXPANSION MULTIPLE1.74x2036 value over 2026 base
Strategic Levers
M&A Pipeline
Regional Outlook
Country Rankings
Competitive Intelligence
Segmental Deep-dive
Call-Us : 91 93563 13602

Executive Snapshot and Market Trajectory

Condensing units are being redesigned around the refrigerant rather than the other way round. Phase-down rules have made the working fluid the first specification decision, and it now determines compressor choice, pressure rating, charge limits, and where the unit can legally be installed. Efficiency comes second, cost a distant third.
Commercial power sits with manufacturers who committed to natural refrigerant platforms early enough to build service networks around them. Hydrocarbon units grow fastest at 13.2%, roughly 2.32 times the market, from a base still constrained by charge-size rules. East Asia holds 30% of global value, carried by Chinese food retail construction and by the manufacturing base that supplies most of the world's smaller units.
Concentration is moderate at roughly 41% for the top five, and the compressor position rather than assembly capability is what separates them. Charge limitation rules restrict propane systems to smaller capacities in most jurisdictions, which is why carbon dioxide holds the larger commercial installations. Aftermarket service now supplies 27% of manufacturer revenue. That share grows faster than equipment sales do, and it is quietly rewriting where the profit in this industry actually sits.
Market Definition
The market comprises factory-assembled refrigeration condensing units combining compressor, condenser, receiver, and controls, supplied for commercial refrigeration, cold storage, food processing, and industrial process cooling. Value is measured at manufacturer level across hydrofluorocarbon, hydrofluoroolefin blend, carbon dioxide, hydrocarbon, and ammonia platforms. Standalone compressors, evaporators and display cases, chillers, residential air conditioning outdoor units, and installation labour fall outside scope.
Base Year Value
$21.6B in 2025 (MMA Primary Research Dataset, August 2026)
Forecast Period
2026 to 2036, eleven discrete annual values
CAGR
5.7% base case. Bull 6.9%. Bear 4.5%.
Fastest Growth Segment
Hydrocarbon Condensing Units: 13.2% CAGR
Fastest Growth Country
India: 8.6% CAGR
Fastest Growth Region
South Asia and Pacific: 7.9% CAGR
Largest Region
East Asia: 30% of 2025 global value
Market Leaders
Copeland, Danfoss, Carrier Global, BITZER, and Daikin Industries lead on condensing unit shipments. Source: company annual reports and MMA Analysis, July 2026.
Primary Survey
n=3,800 procurement and R&D decision-makers, Q4 2025, six countries
Methodology
Demand-side build-up, cross-validated against public data, 47 expert interviews

Condensing Unit Market Forecast Scenarios

condensing-unit-market-trends-size-forecast-scenario-1787548951770
Between 2020 and 2025 the market grew on regulation and cost inflation more than on unit volume. European F-gas rules and the American phase-down under the Kigali Amendment pulled replacement demand forward, and component costs rose sharply as semiconductors, steel, and copper tightened. Cold chain construction held up better than food retail refurbishment. The 4.6% historical growth reflects a market changing product mix rather than expanding its base.
The 5.7% base case rests on three mechanisms. Refrigerant phase-down schedules force replacement on a legal timetable rather than an economic one, and natural refrigerant units carry materially higher selling prices than the hydrofluorocarbon equipment they displace. Cold chain construction across Asia and Latin America adds genuine unit volume where chilled storage capacity per capita remains low. And connected controls keep raising the service revenue attached to each installed unit over its life.
The 6.9% bull case assumes phase-down enforcement tightens on schedule and food retail refurbishment cycles resume across Europe and North America. The 4.5% bear case reflects deferred replacement where enforcement is weak, weaker commercial construction, and price resistance among smaller operators who cannot fund the upgrade. Enforcement, not technology, is the real variable separating the two cases.

Why the Refrigerant Now Decides the Whole Product

Three things set the commercial shape of this market. Refrigerant regulation comes first, because the phase-down schedule decides what can be sold and installed rather than merely what is efficient. Compressor supply comes second, since the compressor is 38% of manufacturing cost and only a handful of companies make them at scale. Service network reach comes third, and it decides who a supermarket chain will actually buy from.
TOP-FIVE CONCENTRATION41%Share of global condensing unit shipments held by leading manufacturers
AVERAGE SELLING PRICEUSD 3,850 per unitTypical commercial refrigeration configuration across mainstream capacity ranges
NATURAL REFRIGERANT SHARE23%Portion of new shipments using carbon dioxide or hydrocarbons
COMPRESSOR COST SHARE38%Compressor input within total condensing unit manufacturing cost
REPLACEMENT CYCLE LENGTH12 yearsTypical service life before commercial operators replace installed units
AFTERMARKET REVENUE SHARE27%Portion of manufacturer revenue from parts and service work
That third point is underrated. A condensing unit that fails takes stock with it, so buyers select on response time and technician availability far more than on efficiency data. Manufacturers without a service footprint sell through contractors who own the relationship and can substitute a competitor whenever it suits them. Contractors are the gatekeepers in most of the market, and they recommend what their technicians can service quickly and confidently.
Carbon dioxide changed the engineering. Transcritical operation runs at pressures several times conventional systems, which forces heavier components, different controls, and technicians trained specifically for it. That raised the barrier to entry considerably and rewarded manufacturers who invested before the regulation made it unavoidable. Propane went the other way: simple and efficient, but charge limits confine it to smaller units.
"The refrigerant transition is usually described as an environmental story, and commercially it is nothing of the sort. It is a forced product redesign that reset twenty years of accumulated engineering advantage, and the companies that treated it as a compliance exercise rather than a competitive opening are the ones losing specification now."
Practice Director, Refrigeration and Thermal Systems · MMA Construction and Industrial Equipment Practice · August 2026

Market Trends

Natural Refrigerants Move From Niche Toward Default Specification

Carbon dioxide and hydrocarbon systems now account for roughly 23% of new condensing unit shipments, and the share climbs with every step of the phase-down schedule. What changed is not environmental preference but availability: high global warming potential refrigerants are being quota-restricted, and their service gas prices have risen enough to make replacement economics work on their own. Transcritical carbon dioxide dominates larger commercial installations while propane takes the smaller end where charge limits permit. Manufacturers who built service technician training around these platforms early are converting that investment into specification wins now.
Market Impact: Quota cuts run through 2036
Connected Controls Turn Units Into Service Revenue Streams

Condensing units now ship with controllers that report compressor runtime, suction pressure, and fault codes to a monitoring platform, and that data changes the commercial relationship completely. A manufacturer who sees a failing unit before the operator does can schedule the repair, sell the part, and keep the account. Aftermarket parts and service already supply 27% of manufacturer revenue and grow faster than equipment sales. Operators accept it because losing a chiller of stock costs far more than any monitoring subscription. The margin structure of the industry is shifting quietly as a result.
Market Impact: Adds capacity growing above 8%

Market Opportunities and Growth Drivers

Refrigerant Phase-Down Schedules Force Replacement on Legal Timetables

The European F-gas regulation and the American Environmental Protection Agency rules under the Kigali Amendment both set quota reductions with fixed dates, and the 2024 European revision tightened them considerably. Equipment using high global warming potential refrigerants becomes progressively harder to service as quota shrinks and gas prices rise. That converts what would be a discretionary replacement decision into a scheduled one, and it pulls demand forward across the installed base. Natural refrigerant units also sell at meaningfully higher prices, so the transition raises market value faster than it raises unit shipments.
Market Impact: Limits restrict charge below 500 grams

Cold Chain Construction Adds Genuine Unit Volume Across Asia

Chilled and frozen storage capacity per person in India, Southeast Asia, and much of Latin America remains a small fraction of developed market levels, and post-harvest food loss keeps the issue funded politically. India's agricultural infrastructure programmes have supported steady cold store construction, and organised food retail expansion adds display refrigeration demand behind it. This volume is less regulated than European replacement demand and more price-sensitive, which favours manufacturers with low-cost production. It also grows the installed base that will generate service revenue for the following decade across the region.
Market Impact: Shortfall exceeds 20% of demand

Market Restraints and Challenges

Charge Limits Confine Hydrocarbon Systems to Smaller Capacities

Propane is efficient, cheap, and has almost no global warming potential, yet it is flammable, and safety standards cap the charge permitted in occupied spaces. The root cause is the standards framework rather than the chemistry: limits were written when hydrocarbon use was rare and have only recently begun rising. That caps addressable capacity per unit and forces multiple smaller systems where one larger unit would be simpler. Manufacturers mitigate through secondary loop designs, reduced-charge heat exchangers, and active participation in the standards revisions now under way. Progress is real but slow.
Market Impact: Natural refrigerants reach 23% of shipments

Technician Shortages Constrain Natural Refrigerant Installation Everywhere

Transcritical carbon dioxide runs at pressures several times conventional systems and propane carries flammability handling requirements, so both need trained technicians that the trade does not have in sufficient numbers. The root cause is demographic: refrigeration technicians are retiring faster than apprenticeships replace them across Europe and North America. Projects get deferred because nobody can commission them, which slows the transition regardless of equipment availability. Manufacturers are funding training academies, simplifying commissioning through pre-configured controls, and offering remote support to contractors. None of it fixes the underlying labour shortage. Commissioning capacity now paces the transition.
Market Impact: Aftermarket supplies 27% of revenue
4 additional market trends, 3 additional growth drivers, and 2 additional restraints and challenges are covered in the full report. Contact sales@marketmindsadvisory.com to access the complete intelligence.

Segment CAGR and Growth Architecture

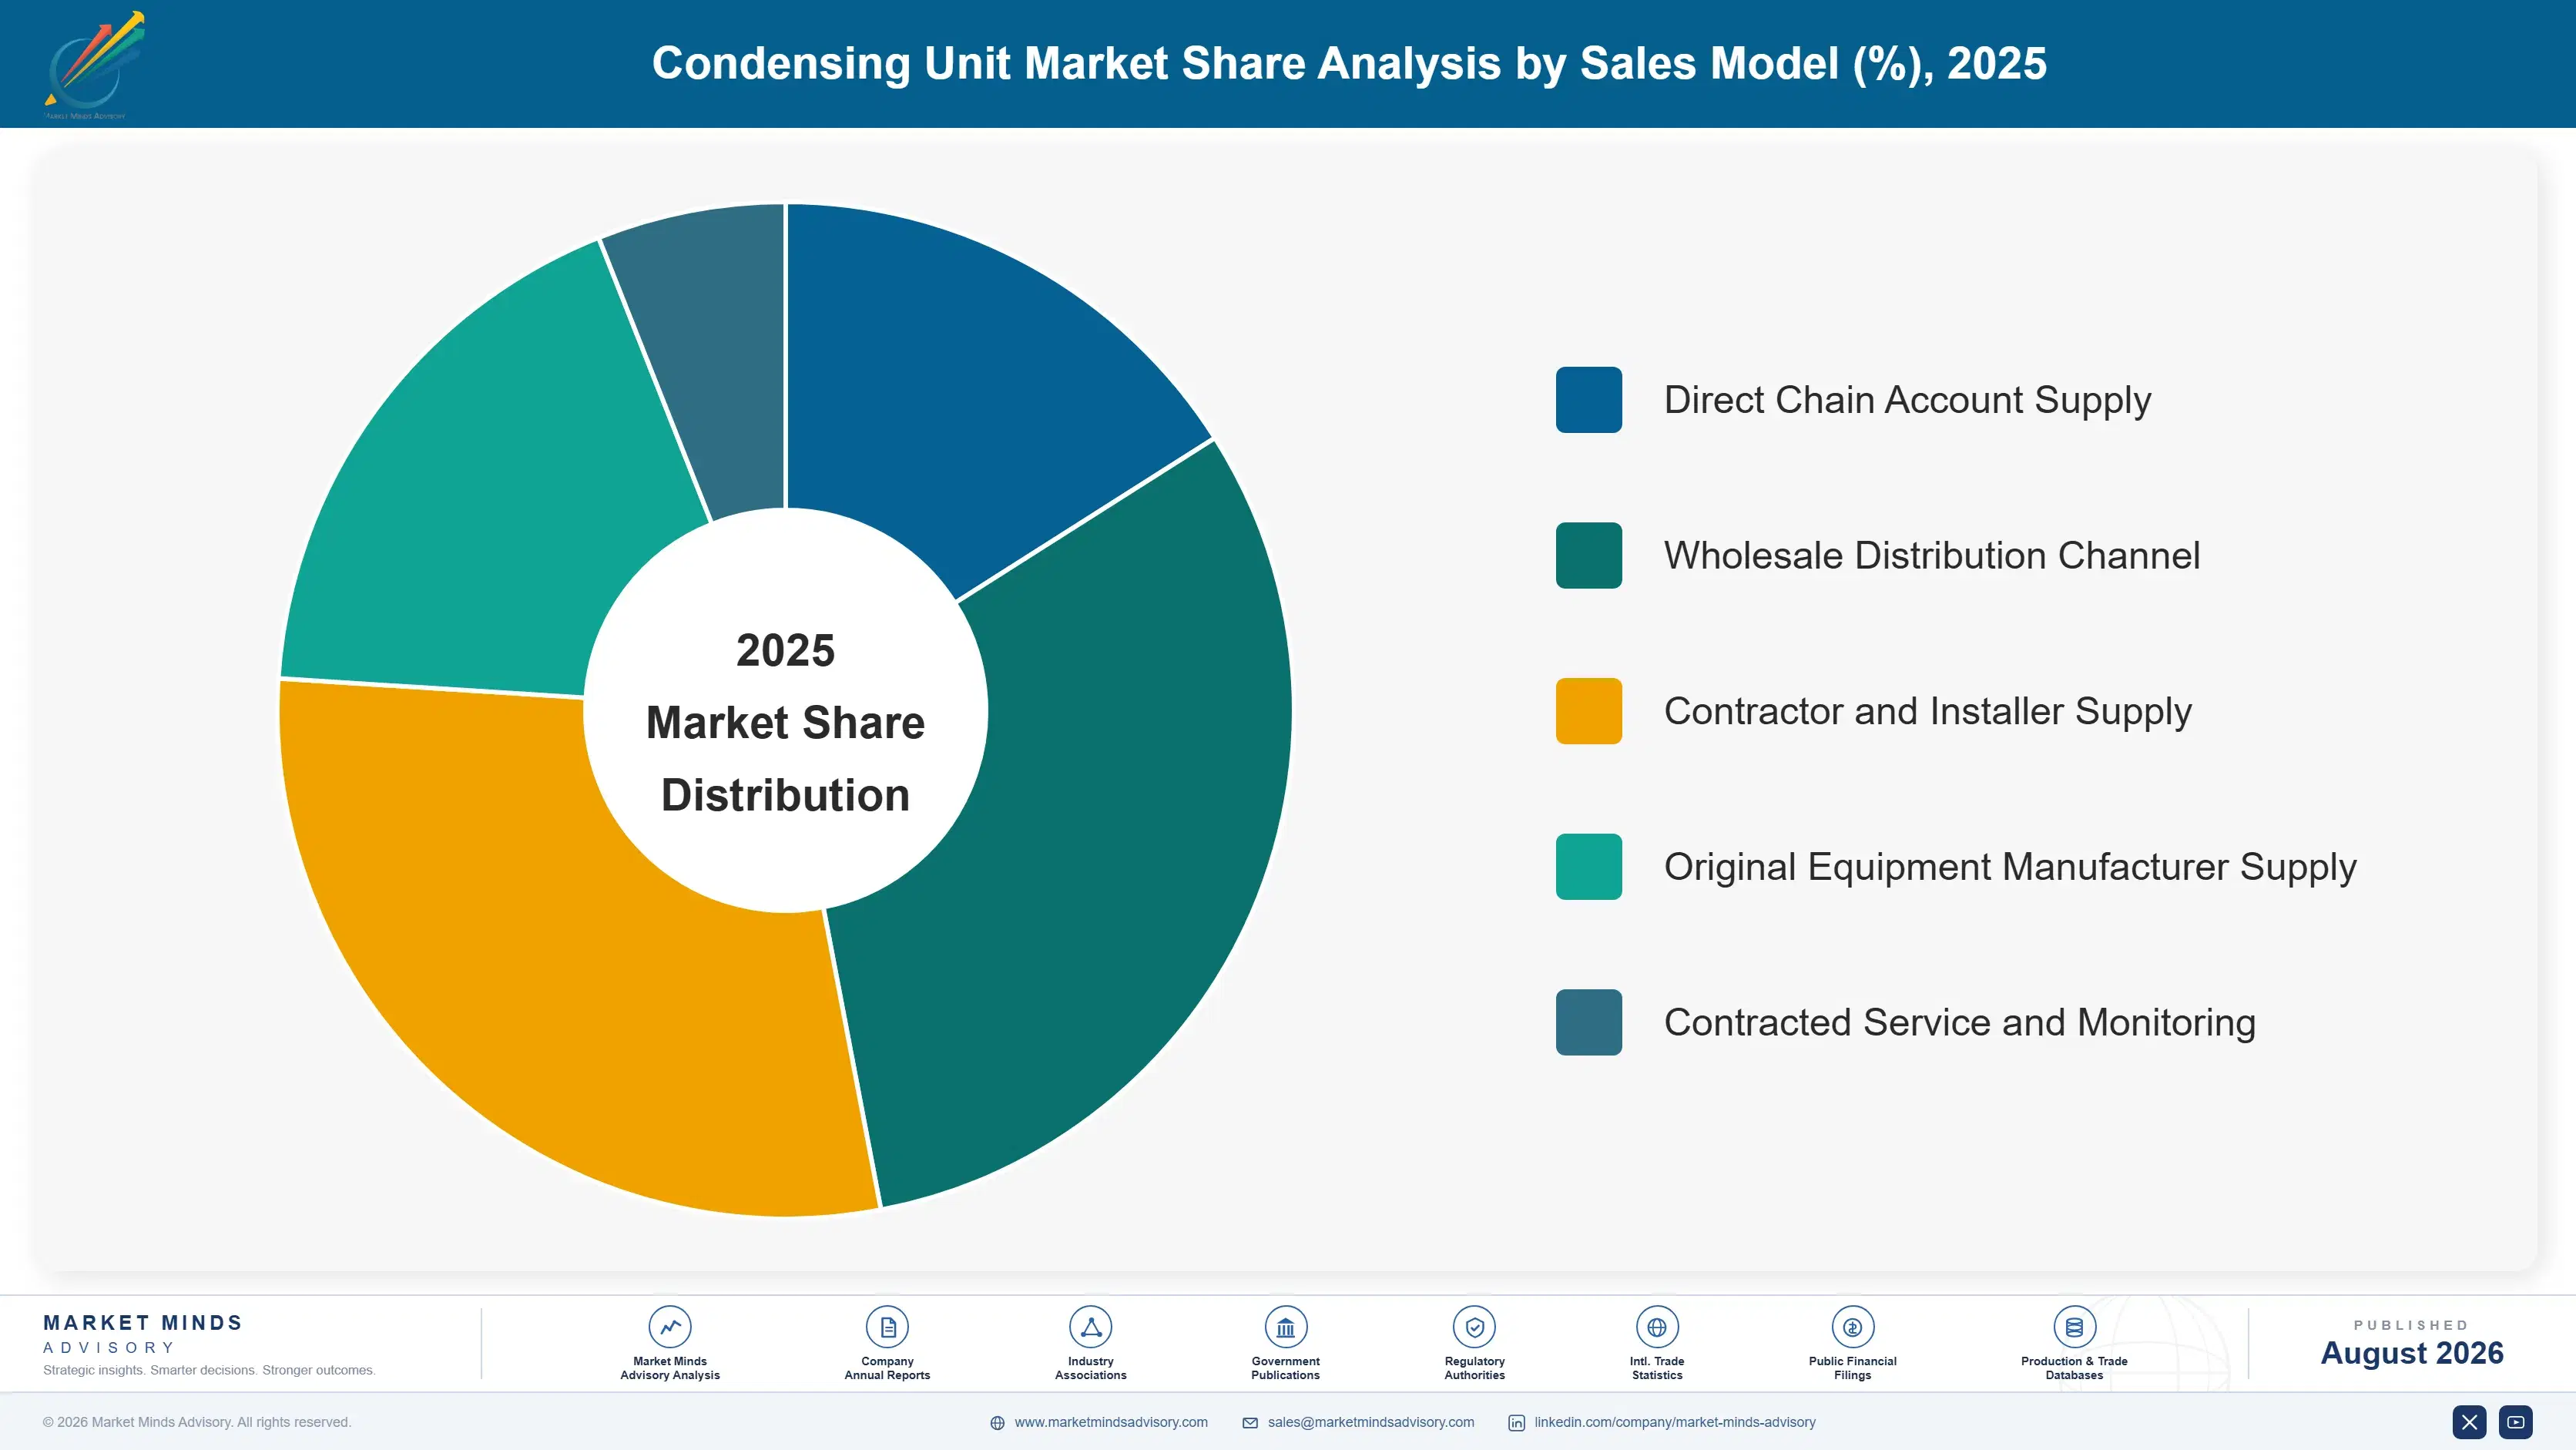
Segmentation follows refrigerant platform, because the working fluid determines compressor selection, pressure rating, permitted charge, installation rules, technician training, and which jurisdictions will still allow the equipment to be sold. Five platforms cover commercial supply, and regulation rather than customer preference is now moving volume between them. Migration between them is one-directional and effectively permanent.
condensing-unit-market-trends-market-share-analysis-1787548952303

Hydrocarbon Condensing Units

The fastest-growing platform at 13.2%, roughly 2.32 times the market, and constrained by rules rather than by demand. Propane offers excellent thermodynamic efficiency, negligible global warming potential, and low refrigerant cost, which makes the operating case straightforward wherever it can legally be used. Charge limits are the binding constraint, confining most applications to integral cases and smaller condensing units below a few kilowatts. Standards revisions now under way would raise those limits substantially and open mid-range commercial capacity. Manufacturers are positioning for that change with reduced-charge heat exchanger designs and secondary loop architectures that keep the flammable charge outside occupied space entirely. Refrigerant cost is trivial, which changes the service economics as well.
CAGR 13.2%

Transcritical Carbon Dioxide Condensing Units

Second fastest at 11.8%, and the established answer for larger commercial installations where propane charge limits rule hydrocarbons out. Carbon dioxide is non-flammable, non-toxic, and cheap as a fluid, but transcritical operation demands components rated several times conventional pressures and controls that manage gas cooler behaviour in warm ambient conditions. Early systems performed poorly in hot climates, and ejector and parallel compression technology largely resolved that. European food retail adopted it first and now specifies it routinely. The barrier is engineering depth and technician training rather than component cost, which is exactly why the competitive field here is narrower than in conventional equipment. Service contracts attach more readily to it than to conventional equipment.
CAGR 11.8%
Full segment breakdown across 5 segments available in the complete report.

Regional Architecture and Country Demand Map

Regional shares reflect food retail structure, cold chain maturity, and how strictly refrigerant rules are enforced. Manufacturing concentration matters too, since a large share of smaller units is built in East Asia and shipped worldwide under several different brand names. Enforcement strictness explains most of the difference in product mix.

North America

Supermarket and convenience retail sets the tone here, and the installed base is old enough that replacement rather than expansion drives most volume. Environmental Protection Agency rules under the American Innovation and Manufacturing Act are tightening refrigerant quota on a published schedule, which has moved chain operators toward carbon dioxide on new builds and major refits. Cold storage construction adds a second stream tied to food distribution and pharmaceutical handling. Technician availability is the binding constraint on how fast the transition actually happens across the region. Copeland, Carrier, Lennox, and Hussmann hold most of the qualified positions with national chains. Growth of 6.0% reflects regulation-driven replacement more than any underlying volume expansion.
Share: 25% | CAGR: 6.0% (2026 to 2036)

Western Europe

The F-gas regulation is applied more strictly here than anywhere, and the 2024 revision tightened quota schedules further, making this the reference market for natural refrigerant adoption globally. Food retail chains committed to transcritical carbon dioxide years ago and now specify it as standard, which pulled the whole supply base along. Manufacturers headquartered in the region, including Danfoss and BITZER, built the engineering depth that transition required and now export it. The offsetting problem is volume: the installed base is mature, food retail construction is modest, and replacement demand has already been partly pulled forward. Growth of 4.2% is the slowest of the major regions and reflects saturation rather than technical stagnation.
Share: 20% | CAGR: 4.2% (2026 to 2036)
Regional intelligence for 5 additional markets available in the complete report: East Asia, South Asia and Pacific, Latin America, Middle East and Africa, Eastern Europe. Contact sales@marketmindsadvisory.com.
condensing-unit-market-trends-country-cagr-analysis-1787548952816

Four Moves That Change the Economics

Advantage here comes from compressor position, service network reach, and refrigerant platform timing rather than from assembly capability, which is widely available. Four moves are worth capital and management attention across the forecast period, and two of them build recurring revenue rather than one-off equipment sales. The remaining two are engineering decisions with fairly predictable timing behind them.

Convert connected controls into contracted service revenue

Units already ship with controllers reporting runtime, pressures, and faults, yet most manufacturers treat that data as a warranty tool rather than a product. Monitoring contracts attached to the installed base typically add 4 to 7 percentage points of blended margin while making the customer relationship direct rather than contractor-mediated. Operators buy it because a failed unit costs them stock worth many times the subscription. The investment is a platform and a service organisation rather than plant, and the advantage compounds because every unit sold enlarges the addressable base for the following decade.
Market Impact: Adds 4 to 7 points of blended margin

Own the compressor, or contract it on long terms

Compressors are 38% of manufacturing cost and come from a short list of suppliers, several of whom also assemble competing condensing units. That is an uncomfortable dependence during any period of tight supply, and the 2021 shortage showed exactly how uncomfortable. Vertical integration is expensive and only makes sense above real volume thresholds. Multi-year supply agreements with capacity reservation are the practical alternative, and they typically secure 8 to 12% better pricing than spot purchasing alongside allocation priority when the market tightens again, which it reliably does. Allocation priority is worth more than the discount in practice.
Market Impact: Secures 8 to 12% better compressor unit pricing

Fund technician training as a commercial channel investment

Natural refrigerant projects are being deferred because nobody can commission them, and the shortfall exceeds 20% of demand in several markets. Manufacturers who run training academies create technicians who know their equipment, their controls, and their fault codes, and those technicians specify accordingly for the rest of their careers. It also removes the excuse contractors use for recommending conventional equipment instead. Training infrastructure costs perhaps $2 million to $4 million per regional academy, which is trivial against the specification share it protects across a decade of installations. The trained technician becomes a permanent specification advocate.
Market Impact: Addresses a 20% shortfall in trained technician supply

Design for the coming charge limit revision now

Standards bodies are revising hydrocarbon charge limits upward, and the revision would open mid-range commercial capacity to propane for the first time. Manufacturers with reduced-charge heat exchanger designs and secondary loop architectures already engineered will convert that overnight; everyone else will spend two years catching up. Propane units carry 15 to 25% lower lifetime refrigerant and energy cost than the equipment they would displace, which makes the commercial argument straightforward once the rules permit it. The development spend is modest and the timing is reasonably predictable from committee schedules. Committee schedules make the timing unusually predictable.
Market Impact: Cuts lifetime operating cost by 15 to 25%

Who Controls the Margin Pool

Concentration is moderate: the top five hold roughly 41% of global condensing unit shipments, and compressor position rather than assembly scale separates them. Copeland leads on compressor breadth and North American service reach. Danfoss competes on components and controls across the whole system rather than on units alone, and BITZER holds a specialist position in larger commercial and industrial compressors where transcritical carbon dioxide engineering matters most.
Competitive activity runs on three fronts. Refrigerant platform coverage is the first, because a manufacturer without a credible carbon dioxide offer is excluded from European food retail entirely. Service network density is the second, and it decides which supplier a chain operator will accept. Controls and monitoring capability is the third, and it is where the recurring revenue is being built.

Pressure is building from two directions. Chinese manufacturers are competitive on conventional equipment in every price-sensitive market and are moving upward into carbon dioxide. And component suppliers who also assemble units are competing with their own customers, which is quietly reshaping who partners with whom across the industry. Both pressures point the same way, toward manufacturers who own service relationships rather than assembly capacity.
condensing-unit-market-trends-company-positioning-matrix-1787548953335

Competitive Moat and Risk Dimensions

COPELAND

Moat: Compressor breadth and service reach

The company makes the compressors that a large share of the industry buys and runs a service and distribution network that reaches most North American commercial operators directly. That combination means it profits from competitors' equipment sales while holding the customer relationships that decide replacement specification, and neither position can be replicated quickly by anyone.
COPELAND

Risk: Ownership transition and investment pace

Separation from Emerson placed the business under new ownership with different capital priorities, and the refrigerant transition demands sustained engineering investment across several platforms simultaneously. Competitors with longer-established carbon dioxide programmes in Europe are setting specification in the market that regulation will eventually make global, which is an uncomfortable position for an incumbent.
DANFOSS

Moat: Component and controls integration

Supplying compressors, valves, sensors, and system controls lets Danfoss engineer the whole refrigeration circuit rather than one box within it, which matters enormously for transcritical carbon dioxide where control strategy determines whether the system performs at all. Customers buying a working circuit rather than assembled parts find the position difficult to unpick component by component.
DANFOSS

Risk: Competing with its own customers

Selling components to condensing unit assemblers while also supplying complete systems creates a conflict that customers increasingly notice and price into their sourcing decisions. As Chinese component suppliers improve, those assemblers gain a credible alternative that carries no competitive tension, and the integrated position becomes harder to defend commercially.

Players Tracked

Prominent Players

Copeland
Danfoss
Carrier Global
BITZER
Daikin Industries

Other Key Players

Emerson Electric
GEA Group
Johnson Controls
Lennox International
Hussmann
Rivacold
Tecumseh Products
Nidec Global Appliance
Frascold
Officine Mario Dorin
Panasonic Corporation
LU-VE Group
Güntner Group
Secop
Zhejiang Sanhua Intelligent Controls

Recent Developments

MARCH 2025

BITZER extends transcritical compressor range

The company broadened its carbon dioxide compressor offering into additional capacity bands, targeting mid-size commercial installations that previously sat awkwardly between product families. The extension responds to European food retail specifying transcritical systems on smaller store formats than the technology originally served economically. Pricing was not disclosed.
Signal: Carbon dioxide is moving down the capacity range, squeezing the space where conventional equipment still wins
AUGUST 2025

Copeland expands North American service network

Additional service and distribution locations opened across the region, extending technician coverage as refrigerant phase-down pulls replacement work forward. The investment was organic and directed at response times that commercial operators increasingly write into their supply agreements as contractual commitments. Coverage now reaches most major metropolitan areas.
Signal: Service response time is becoming a contractual specification item rather than an informal supplier promise made verbally
NOVEMBER 2025

Standards revision advances on hydrocarbon charge limits

International safety standards work progressed toward raising permitted propane charge in commercial refrigeration equipment, following several years of technical committee activity. Higher limits would open mid-range capacity to hydrocarbon systems that charge restrictions have kept confined to smaller integral applications. Adoption would follow national code updates.
Signal: A single standards decision could reset competitive positioning right across the whole mid-range commercial capacity band

What Sets the Cost Base

Compressors dominate at roughly 38% of manufacturing cost, sourced from a short supplier list that includes several companies who also assemble competing units. Heat exchanger materials, principally copper and aluminium, contribute 19% and track exchange-traded metal pricing directly. Electronics and controls take 12%, a share that has risen as connectivity became standard. Steel casings, fans, refrigerant charge, and assembly labour absorb the balance.
The 2021 and 2022 period exposed several of these at once. Semiconductor shortages delayed controller supply across the industry, copper moved sharply, and compressor lead times extended well beyond a year in some capacity bands. IEA energy price reporting documented the industrial cost backdrop then. Carrier and Daikin both referenced component availability and input cost pressure across their reporting for those years, and several manufacturers reallocated compressor supply between product lines.

Exposure divides on vertical integration rather than on scale. Manufacturers who make their own compressors held cost and delivery position through the shortage, while assemblers dependent on external supply queued behind their suppliers' own product lines. Regional differences matter less, though European energy costs weigh on heat exchanger production. Transcritical carbon dioxide equipment carries a further exposure, since pressure-rated components have a narrower supplier base.
condensing-unit-market-trends-cost-volatility-analysis-1787548953529

Reserve compressor capacity through multi-year supply agreements

Capacity reservation agreements secure both allocation priority and pricing typically 8 to 12% better than spot purchasing when supply tightens. The cost is volume commitment through soft periods when spot would be cheaper. For assemblers whose suppliers also build competing units, allocation priority during a shortage is worth considerably more than the price advantage being negotiated.

Standardise controller platforms across the whole product range

Electronics are 12% of cost and were the binding constraint during the semiconductor shortage. Running one controller platform across every capacity band and refrigerant type raises volume per part number, improves supply priority, and cuts qualification work when components go obsolete. The engineering cost is real and the resulting product loses some optimisation at the extremes of the range.

Qualify second sources for pressure-rated carbon dioxide components

Transcritical systems need valves, receivers, and fittings rated for pressures conventional refrigeration never sees, and the supplier base is narrow enough to be a genuine risk. Qualifying alternatives costs testing time and engineering attention before any shortage arrives. Manufacturers who deferred this during the early carbon dioxide years found themselves allocated when demand accelerated across European food retail.

Portfolio Architecture for Margin Defence

Margin follows refrigerant platform and service attachment rather than unit volume. Conventional hydrofluorocarbon equipment sold through distribution earns low to mid teens gross margin, because several manufacturers meet the specification and contractors buy on price and availability. Transcritical carbon dioxide systems earn considerably more, since engineering depth and technician training limit the field to manufacturers who invested years before the demand arrived.
The volume and premium tension is sharp because assembly capacity must run. Manufacturers take conventional equipment business at thin margin to hold plant loading and distribution relationships, even where the same capacity could build natural refrigerant units at better returns. That works while conventional volumes last, and the phase-down schedule makes clear that they will not last indefinitely across the regulated markets.

High-value pools concentrate in three places: transcritical carbon dioxide systems for regulated food retail, contracted monitoring and service on the installed base, and pressure-rated spare parts where the supplier base is narrow. Each is defended by engineering, data, or supply position rather than by price. Price competition arrives only when a competitor matches the engineering, the installed base data, or the pressure-rated supply position, and none of those is a quick build for anybody.

Volume / Commodity-Adjacent Tier

Conventional hydrofluorocarbon and hydrofluoroolefin blend units sold through distribution into price-sensitive replacement work. Wins on availability and delivered cost. The range reflects large differences in compressor sourcing and regional manufacturing cost.
Gross Margin: 12%-20%

Premium / Certified Tier

Transcritical carbon dioxide and engineered commercial systems sold with commissioning support and performance commitments. The buyer purchases engineering confidence and service response rather than hardware, and switching means retraining technicians.
Gross Margin: 25%-35%

Sustainability / Regulatory / Next-Generation Tier

Hydrocarbon platforms, reduced-charge designs, and connected units sold with contracted monitoring. Growing fast from a small base on regulation and recurring revenue. The range is wide because service attachment rates vary enormously by operator.
Gross Margin: 28%-44%
condensing-unit-market-trends-portfolio-architecture-1787548954030

High-value Sub-segments and Strategic Watch-out

Transcritical Carbon Dioxide Systems

The highest-value equipment pool and effectively mandatory for European food retail. Engineering depth and technician training keep the competitive field narrow, and control strategy rather than hardware decides whether systems perform. Regulation guarantees the demand continues expanding. Early engineering investment is what protects the position.
Gross Margin: 26%-36%

Contracted Monitoring and Service

The recurring revenue pool and the fastest-growing part of the profit mix. Connected controls make the manufacturer the first to know about a fault, which converts a contractor-mediated relationship into a direct one. Every unit sold enlarges the base. Attachment rate is the metric that matters most.
Gross Margin: 35%-50%

Volume Conventional Refrigerant Units

The utilisation engine rather than the profit engine. Assembly capacity must run and distribution relationships must be fed, so this business earns its place on loading rather than on margin. Phase-down schedules put a visible end date on it. Manage it for loading and nothing more than that.
Gross Margin: 12%-19%

Hydrocarbon Mid-Range Equipment

The strategic watch-out. Growth of 13.2% is genuine but charge limits confine it to small capacities, and the mid-range opening depends entirely on a standards revision whose timing nobody controls. Design ahead of it rather than waiting. Timing risk sits entirely outside management control. Design early.
Gross Margin: 22%-33%

How Demand Actually Reaches Manufacturers

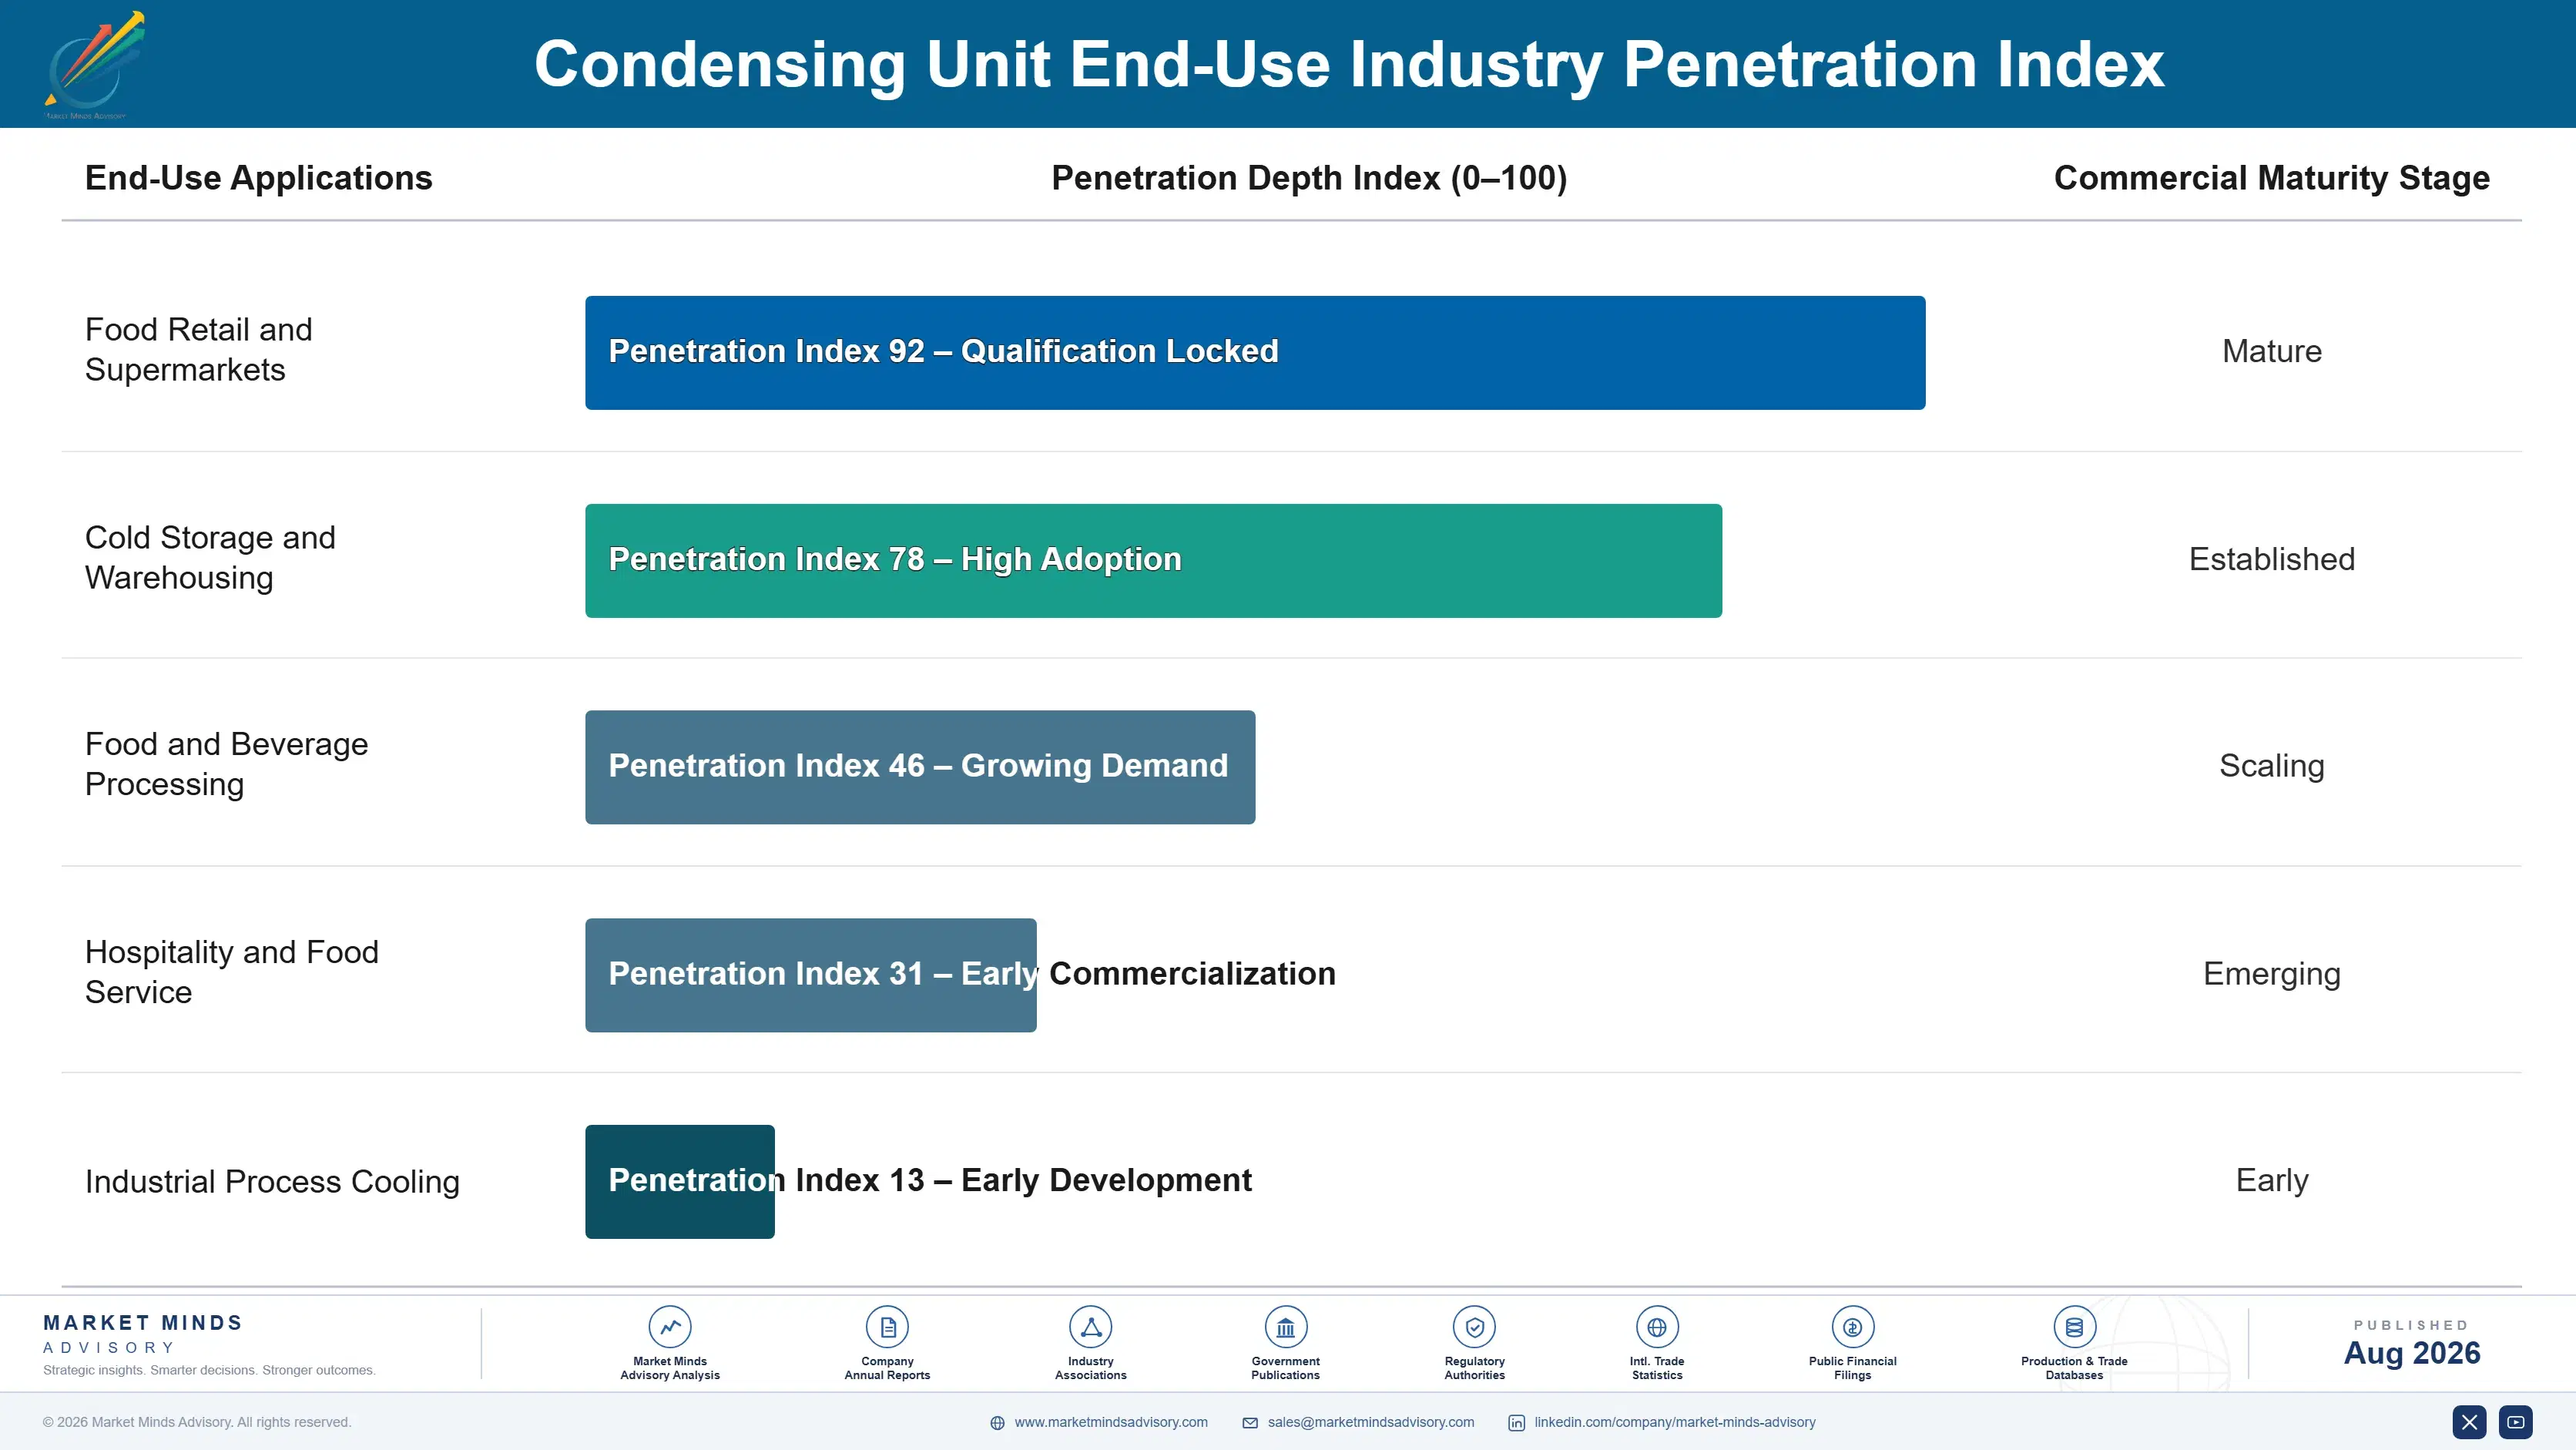
The annuity here is unusually strong and getting stronger. Condensing units run continuously, wear out on roughly a twelve-year cycle, and need parts and service throughout that life, which already supplies 27% of manufacturer revenue. Connected controls deepen it further by making the manufacturer rather than the contractor the first party to know about a developing fault. That turns a transactional parts business into something closer to a subscription on every unit shipped.
Adoption depth varies sharply by vertical. National food retail chains standardise refrigerant platform and supplier across the whole estate, which makes each win enormous and each loss painful. Cold storage operators buy on lifetime energy cost and are the most technically sophisticated buyers in the market. Food processors buy on reliability and downtime cost. Independent convenience retail buys on price and switches freely.

The buyer has changed as well. Refrigeration purchasing that once sat with facilities managers now sits with sustainability and compliance teams who must evidence phase-down progress to auditors. Those teams need evidence of phase-down progress for audit, which makes refrigerant platform a reporting question rather than an engineering preference, and it has moved specification authority away from maintenance teams.
condensing-unit-market-trends-end-use-penetration-index-1787548954519

Where the Money Sits

These are among the four positions where our research anticipates prominent divergence between winners and laggards over the coming forecast period. Each is grounded in the demand model, the regulatory perimeter, and the announced capacity pipeline.
01 / SERVICE REVENUE ATTACHMENT

Sell the monitoring contract, because the box is commoditising

Aftermarket parts and service already supply 27% of manufacturer revenue and grow faster than equipment, yet most manufacturers still treat controller data as a warranty tool rather than a product they could sell. Monitoring contracts add 4 to 7 percentage points of blended margin and convert a contractor-mediated relationship into a direct one that competitors cannot easily interrupt. The required investment is a monitoring platform and a service organisation rather than plant, and every single unit shipped permanently enlarges the addressable base behind it.
02 / COMPRESSOR SUPPLY SECURITY

Reserve capacity, because your supplier is also your competitor

Compressors are 38% of manufacturing cost and come from a short list that includes companies assembling competing condensing units, which is an uncomfortable dependence in any tight market. The 2021 shortage demonstrated clearly that assemblers end up queuing behind their own suppliers' competing product lines whenever difficult allocation decisions have to be made. Multi-year capacity reservation secures 8 to 12% better pricing and, far more valuably, allocation priority during the next shortage that this industry will reliably produce sooner or later.
03 / TECHNICIAN PIPELINE INVESTMENT

Train the trade, because commissioning capacity is the real constraint

Natural refrigerant projects are being deferred because nobody can commission them, and the technician shortfall exceeds 20% of demand across several major markets already. Manufacturers running their own training academies produce technicians who know their controls and their fault codes intimately, and who then specify accordingly for the rest of their working lives. At perhaps $2 million to $4 million per regional academy, the spend is trivially cheap measured against the specification share it protects across a full decade of installations.
04 / CHARGE LIMIT READINESS

Engineer for propane now, before the standards revision lands

Hydrocarbon units grow at 13.2%, roughly 2.32 times the market, and the only thing now confining them to small capacities is a charge limit that standards bodies are actively revising upward right now. Manufacturers with reduced-charge and secondary loop designs already engineered will convert the moment rules permit, while everyone else spends two years catching up. Propane cuts lifetime refrigerant and energy cost 15 to 25%, so the commercial argument writes itself the moment legality stops being the binding obstacle.

Engagement Snapshot From the Field

A live engagement with an industry participant carrying material or product regulatory and market exposure ahead of a defining policy shift, showing how our research translates into a defensible multi-year portfolio strategy.
MARKET MINDS ADVISORY · CLIENT ENGAGEMENT SUMMARY
Condensing Unit Producer Strategic Portfolio Review and Transition Roadmap 2026·Investment Scenario on Condensing Unit Exposure Evaluation 2025-26
CLIENT PROFILE
A European manufacturer of commercial condensing units with two assembly plants and revenue concentrated in conventional hydrofluorocarbon equipment sold through wholesale distribution. Annual revenue ran near EUR 240 million (client-reported, unverified by MMA). The business held a modest transcritical carbon dioxide range, no service organisation of its own, and no monitoring platform behind its installed base.
STRATEGIC CHALLENGE
F-gas quota reductions were shrinking the conventional product market on a published timetable while national food retail chains awarded carbon dioxide contracts to three competitors with deeper engineering and service coverage. Management needed to know whether to invest in transcritical capability, in a service organisation, or in both, and how quickly the conventional revenue would actually disappear.
MMA APPROACH
MMA modelled quota schedules against the client's product mix to date the conventional revenue decline, mapped food retail specification decisions and service coverage requirements across four countries, and assessed margin outcomes for equipment-only supply against contracted service. Forty-seven expert interviews with chain engineers, contractors, and technicians established what actually drives supplier selection.
KEY FINDINGS
  1. Conventional equipment revenue would decline faster than management had assumed, with quota pricing rather than any outright ban making the product commercially unattractive well before the legal deadline.
  2. Every chain contract lost in the preceding two years had turned on service response commitments rather than on equipment price or technical specification, which distribution-based selling could not deliver.
  3. Contracted monitoring on the existing installed base represented a revenue pool comparable to a fifth of equipment sales, and it required a platform rather than any manufacturing investment.
  4. Technician availability limited how fast the client could grow carbon dioxide volumes regardless of factory capacity, making training the binding constraint on the whole transition plan.
CLIENT PROFILE
A European manufacturer of commercial condensing units with two assembly plants and revenue concentrated in conventional hydrofluorocarbon equipment sold through wholesale distribution. Annual revenue ran near EUR 240 million (client-reported, unverified by MMA). The business held a modest transcritical carbon dioxide range, no service organisation of its own, and no monitoring platform behind its installed base.
STRATEGIC CHALLENGE
F-gas quota reductions were shrinking the conventional product market on a published timetable while national food retail chains awarded carbon dioxide contracts to three competitors with deeper engineering and service coverage. Management needed to know whether to invest in transcritical capability, in a service organisation, or in both, and how quickly the conventional revenue would actually disappear.
MMA APPROACH
MMA modelled quota schedules against the client's product mix to date the conventional revenue decline, mapped food retail specification decisions and service coverage requirements across four countries, and assessed margin outcomes for equipment-only supply against contracted service. Forty-seven expert interviews with chain engineers, contractors, and technicians established what actually drives supplier selection.
KEY FINDINGS
  1. Conventional equipment revenue would decline faster than management had assumed, with quota pricing rather than any outright ban making the product commercially unattractive well before the legal deadline.
  2. Every chain contract lost in the preceding two years had turned on service response commitments rather than on equipment price or technical specification, which distribution-based selling could not deliver.
  3. Contracted monitoring on the existing installed base represented a revenue pool comparable to a fifth of equipment sales, and it required a platform rather than any manufacturing investment.
  4. Technician availability limited how fast the client could grow carbon dioxide volumes regardless of factory capacity, making training the binding constraint on the whole transition plan.
RECOMMENDED STRATEGY
Phase 1: Phase one: build the monitoring platform and attach contracts to the existing installed base, generating recurring revenue before any manufacturing investment is committed. Phase 2: Phase two: establish direct service coverage in the two countries with the largest chain opportunities, replacing distribution-only selling where response commitments decide awards. Phase 3: Phase three: expand transcritical engineering and open a technician training academy, sized against realistic commissioning capacity rather than factory output.
OUTCOME
The client launched monitoring contracts within eight months and opened direct service operations in two countries the following year. Service and recurring revenue reached 21% of the total by the second year, and the business won its first national chain carbon dioxide award at blended margin 6.2 percentage points above the conventional base (client-reported, unverified by MMA).

Frequently Asked Questions

Foundational context covering the market sizes, CAGR, scope, country, region and competition that inform every finding below. This section is provided to cover basics and most often pre-purchase conversations, answered from the MMA Primary Research Dataset.

What is the current size of the Condensing Unit Market?

The market was valued at USD 21.6 billion in 2025, rising to an estimated USD 22.83 billion in 2026. East Asia holds the largest regional share at 30% of global value.

How large will the Condensing Unit Market be by 2036?

MMA forecasts USD 39.75 billion by 2036 under the base case, an expansion multiple of 1.74 times the 2026 value. That represents USD 16.92 billion of incremental value across the forecast period.

What is the CAGR for the Condensing Unit Market 2026 to 2036?

The base case CAGR is 5.7%, with a bull case of 6.9% and a bear case of 4.5%. The spread reflects uncertainty over phase-down enforcement and commercial construction activity.

Which segment is growing fastest?

Hydrocarbon condensing units grow fastest at 13.2%, roughly 2.32 times the market rate. Transcritical carbon dioxide follows at 11.8%, taking the larger commercial installations that propane charge limits exclude.

Who are the major companies in the Condensing Unit Market?

Copeland, Danfoss, Carrier Global, BITZER, and Daikin Industries lead on condensing unit shipments. The top five hold roughly 41% of global volume, with compressor position separating them.

Which country is growing fastest?

India grows fastest at 8.6%, driven by cold storage construction under agricultural infrastructure funding and by organised food retail expansion. Chilled capacity per person remains far below developed market levels.

Report Segmentation Architecture

The full report scope spans multiple orthogonal segmentation dimensions, with cross-tabulated demand data provided for each dimension pair. Coverage extends further to regional breakdowns, trend trajectories, and the competitive detail needed to support segment-level decision-making.

By Refrigerant Platform

  • Hydrofluorocarbon Condensing Units
  • Hydrofluoroolefin Blend Condensing Units
  • Transcritical Carbon Dioxide Condensing Units
  • Hydrocarbon Condensing Units
  • Ammonia Condensing Units

By End-Use Industry

  • Food Retail and Supermarkets
  • Cold Storage and Warehousing
  • Food and Beverage Processing
  • Hospitality and Food Service
  • Industrial Process Cooling

By Sales Model

  • Direct Chain Account Supply
  • Wholesale Distribution Channel
  • Contractor and Installer Supply
  • Original Equipment Manufacturer Supply
  • Contracted Service and Monitoring

By Region

  • North America
  • Western Europe
  • East Asia
  • South Asia and Pacific
  • Latin America
  • Middle East and Africa
  • Eastern Europe

Scope, Methodology, and Coverage

Every figure in this report is reproducible from documented input assumptions. The scope below maps the historical period, the forecast horizon, the segmentation dimensions, and the countries covered, alongside the underlying primary and qualitative methodology.
Historical Period
2020 to 2025
Forecast Period
2026 to 2036
Base Year
2025 (USD billions; MMA Primary Research Dataset, August 2026)
Market Definition
The market comprises factory-assembled refrigeration condensing units combining compressor, condenser, receiver, and controls in a single package, supplied for commercial refrigeration, cold storage, food processing, hospitality, and industrial process cooling. Value is measured at manufacturer level across hydrofluorocarbon, hydrofluoroolefin blend, transcritical carbon dioxide, hydrocarbon, and ammonia platforms. Standalone compressors, evaporators and display cases, packaged chillers, residential air conditioning outdoor units, refrigerant supply, and installation labour fall outside scope.
Quantitative Units
USD billions (current prices); condensing units shipped annually; USD per unit average selling price by capacity band
Segmentation Dimensions
By Refrigerant Platform; By End-Use Industry; By Sales Model; By Region
Regions Covered
North America, Western Europe, East Asia, South Asia and Pacific, Latin America, Middle East and Africa, Eastern Europe
Countries Covered
United States, Canada, Mexico, Germany, France, United Kingdom, Italy, Spain, Netherlands, Nordics, Poland, Romania, China, Japan, South Korea, India, Australia, Southeast Asia, Brazil, Chile, Peru, Saudi Arabia, United Arab Emirates, Egypt, South Africa
Key Companies Profiled
Copeland, Danfoss, Carrier Global, BITZER, Daikin Industries, Emerson Electric, GEA Group, Johnson Controls, Lennox International, Hussmann, Rivacold, Tecumseh Products, Nidec Global Appliance, Frascold, Officine Mario Dorin, Panasonic Corporation, LU-VE Group, Güntner Group, Secop, Zhejiang Sanhua Intelligent Controls
Quantitative Methodology
Primary survey, n=3,800 respondents, Q4 2025, six countries; demand-side model with trade association cross-validation
Qualitative Methodology
47 expert interviews, Q4 2025; applied to validate demand model assumptions, identify emerging dynamics, and assess competitive positioning
Report Format
PDF and XLSX data workbook (Word format preview document)
Publisher
Market Minds Advisory
Report Code
MMA-2026-CON-152
Published
August 2026
Contact
sales@marketmindsadvisory.com | www.marketmindsadvisory.com

Purchase the full Condensing Unit Market Report (2026 to 2036).

The full report sizes condensing unit demand across five refrigerant platforms, five end-use categories, and seven regions with 2026 to 2036 forecasts under base, bull, and bear cases. It models phase-down quota schedules against installed base age to date replacement demand market by market. Competitive profiles cover twenty manufacturers assessed consistently on condensing unit shipments, compressor position, and service network reach. Cost analysis traces compressor, heat exchanger metal, and controller exposure through recent supply disruptions. Commercial guidance addresses service revenue attachment, compressor supply security, technician training investment, and hydrocarbon charge limit readiness.
Five refrigerant platforms sized separately by region
Phase-down quota schedules mapped to replacement demand
Aftermarket and monitoring revenue quantified against equipment sales
Compressor supply concentration assessed across twenty manufacturers
Technician availability modelled as a commissioning capacity constraint
Hydrocarbon charge limit revision scenarios and commercial consequences

Built For The People Who Decide

From boardroom strategy to bench-side execution, this report is read cover-to-cover by leaders shaping the next decade of their industry, turning demand scenarios, market dynamics and valuation benchmarks into decisions.
CXOs/ Presidents/ VPs/ Managers
M&A and Corporate Development
Strategy Teams and R&D Heads
Procurement and Product Directors
Regulatory and Compliance Leaders
Investor Relations and Equity Analysts