

Market Minds Advisory
Computer Vision Market

Computer Vision Market: Computer Vision Market. Deep Learning Models Push Machine Sight Into Every Industrial Process

Deep learning inference costs have fallen enough that manufacturers, retailers, and automakers are embedding cameras and vision models directly into production lines and vehicles rather than piloting the technology in isolated trials.

Lead Analyst

Published

September 2026

Make Smarter Decisions with Customized Research Insights

Request a free sample report and evaluate market opportunities, growth trends, and competitive dynamics relevant to your business needs.

2025 MARKET VALUE$19.8BMarket Size 2025
2036 FORECAST VALUE$99.4BBase Case , 2026 to 2036
CAGR 2026 TO 203615.8 %Bull 17.0% / Bear 14.6%
INCREMENTAL OPPORTUNITY$76.5BNet 10- year value creation
EXPANSION MULTIPLE4.34x2036 value over 2026 base
Strategic Levers
M&A Pipeline
Regional Outlook
Country Rankings
Competitive Intelligence
Segmental Deep-dive
Call-Us : 91 93563 13602

Executive Snapshot and Market Trajectory.

Falling deep learning inference costs are pushing computer vision out of isolated pilot programs and into standing production deployments across manufacturing lines, retail stores, and vehicle platforms simultaneously this year, reshaping how enterprises budget for automation across their capital planning and annual procurement cycles.
Industrial inspection and autonomous vehicle applications still anchor the bulk of current revenue, but robotics and warehouse automation are pulling installed base growth faster as e-commerce fulfillment operators deploy vision-guided picking systems at scale, reshaping vendor product roadmaps toward edge inference hardware well beyond the cloud-dependent architectures that dominated early deployments across most enterprise customer categories worldwide and across secondary automation markets, emerging robotics startups, and defense applications.
Competitive intensity concentrates around model accuracy under real-world lighting and occlusion conditions rather than benchmark performance alone, as vendors race to certify systems across the widest possible set of deployment environments ahead of enterprise buyers committing to a single vision platform for a multi-year automation program spanning several sites, supplier networks, and downstream logistics partners. This pressure is pushing smaller model specialists lacking certification budgets toward consolidation or exit within a few years.
Market Definition
The computer vision market covers hardware, software, and AI models that enable machines to interpret and act on visual data across industrial, automotive, retail, security, healthcare, and robotics applications. It excludes standalone image sensor manufacturing sold without vision processing capability, general-purpose cloud computing infrastructure, and consumer photography editing software.
Base Year Value
$19.8B in 2025 (MMA Primary Research Dataset, September 2026)
Forecast Period
2026 to 2036, eleven discrete annual values
CAGR
15.8% base case. Bull 17.0%. Bear 14.6%.
Fastest Growth Segment
Autonomous Vehicles and ADAS: 20.5% CAGR
Fastest Growth Country
South Korea: 17.2% CAGR
Fastest Growth Region
South Asia and Pacific: 17.8% CAGR
Largest Region
North America: 31% of 2025 global value
Market Leaders
NVIDIA, Cognex, Intel, Google, and Microsoft lead the competitive landscape. Source: MMA Primary Research Dataset, July 2026.
Primary Survey
n=3,800 procurement and R&D decision-makers, Q4 2025, six countries
Methodology
Demand-side build-up, cross-validated against public data, 47 expert interviews

Computer Vision Market Forecast Scenarios

computer-vision-market-size-forecast-scenario-1790004937552
Between 2020 and 2025 computer vision demand progressed steadily as enterprises piloted point deployments across individual manufacturing lines and retail stores, with autonomous vehicle and robotics integration entering the mainstream only toward the end of the period, producing a historical CAGR of 14.6 percent that understates the pace now underway as deep learning model costs continue falling rapidly.
The base case assumes three commercial mechanisms compound together: falling GPU and edge inference hardware costs make comprehensive vision deployment economically viable across mid-sized manufacturers and retailers, deep learning model accuracy improvements reduce the false positive rates that previously limited production deployment confidence, and cloud providers increasingly bundle pre-trained vision models into standard developer tooling rather than requiring every enterprise to build custom models from scratch for each individual application.
A bull scenario builds on accelerated autonomous vehicle regulatory approval that pulls forward vision hardware and model licensing demand years ahead of current adoption timelines across major automotive markets and their supplier networks. The bear case centers on general-purpose foundation models commoditizing basic vision tasks, eroding specialized vendor pricing power across standard detection and classification applications industry-wide.

Real-World Accuracy Now Separates Winners From Demos

Enterprise buyers increasingly evaluate vision vendors on real-world deployment accuracy under variable lighting, occlusion, and camera angle conditions before comparing benchmark dataset performance directly, a shift that rewards vendors able to demonstrate proven results across the widest range of actual production environments simultaneously rather than a single controlled test facility alone, since most deployments span multiple physical sites, equipment vintages, camera hardware generations, and lighting configurations.
MARKET CONCENTRATIONCR5 38%Top five vendors hold meaningfully fragmented but consolidating share
AVERAGE MODEL DEPLOYMENT COST$85,000 per siteTypical cost to deploy and tune a production vision system
TOP ADOPTING COUNTRY SHAREUnited States 22%Largest single-country base of enterprise computer vision deployments
EDGE INFERENCE ADOPTION47% of deploymentsShare of production systems running inference at the edge
MODEL RETRAINING CYCLE6 monthsTypical interval before enterprises retrain deployed vision models
GPU HARDWARE COST SHARE38%Portion of total deployment cost tied to processing hardware
Manufacturing and logistics customers favor vision systems bundled with model retraining and drift monitoring services, since a model tuned once at installation rarely maintains accuracy as lighting conditions, product variants, and camera positioning gradually shift across a facility's operating life and seasonal production cycles that introduce new variables continuously throughout the calendar year and well beyond it each cycle.
Model development remains concentrated among a small number of vendors with deep GPU hardware and training infrastructure relationships, though rising demand from mid-sized manufacturers is pushing some smaller vendors toward specialized vertical applications that larger incumbents deprioritize given limited near-term deal volume and uncertain long-term account commitments across smaller regional customer segments, emerging verticals, newer startup accounts, and pilot programs.
"A model that scores ninety-nine percent on a clean benchmark dataset can still fail constantly on a factory floor with inconsistent lighting. That gap is where most of the real engineering work happens."
Senior Analyst, AI and Machine Vision Systems Practice · MMA Technology Practice · September 2026

Market Trends

Edge Inference Hardware Replaces Cloud-Dependent Architectures

Manufacturers and logistics operators are shifting vision inference workloads from cloud servers to dedicated edge hardware installed directly at the point of camera capture, eliminating the network latency and connectivity dependency that made cloud-based architectures unreliable for time-sensitive production line decisions and real-time safety interventions across critical operating zones. Vendors are responding by prioritizing edge inference chip development over general-purpose cloud model hosting, reallocating engineering resources toward power-efficient processors capable of running increasingly sophisticated models locally without requiring a continuous internet connection to function reliably across remote or bandwidth-constrained facility locations this year.
Market Impact: Cuts deployment cost by 29 percent

Pre-Trained Foundation Models Accelerate Deployment Timelines

Vision foundation models pre-trained on massive general-purpose image datasets are letting enterprises fine-tune deployment-ready models in weeks rather than the months previously required to train custom models from scratch for each specific application and camera configuration deployed on site across the facility. Vendors are responding by building foundation model licensing and fine-tuning services directly into their commercial offerings, letting customers with limited in-house machine learning expertise deploy production-grade vision systems without hiring dedicated data science teams for every new use case across their organization and its expanding multi-site facility footprint.
Market Impact: Cuts inspection labor needs 33 percent

Market Opportunities and Growth Drivers

Falling GPU Costs Widen Mid-Market Deployment Access

Graphics processing unit prices for inference workloads have declined steadily as broader semiconductor manufacturing scale improved and specialized inference-optimized chips reached mass production volume, lowering the total hardware investment required for a mid-sized manufacturer to deploy a production vision system across multiple lines. Manufacturers who previously viewed computer vision as an enterprise-scale investment reserved for only the largest facilities now specify vision inspection as standard equipment on new production line orders, since the marginal cost per camera station has narrowed considerably against the defect detection and labor savings that vision systems reliably deliver across shifts and product runs.
Market Impact: Cuts accuracy by 12 percent yearly

Labor Shortages Accelerate Automated Inspection Adoption

Persistent skilled labor shortages across manufacturing and logistics operations are pushing operators to automate visual inspection tasks that previously required dedicated quality control staff to manually examine products or packages throughout each production shift and across multiple parallel production lines, quality checkpoints, and packaging or sorting stations. Operators report meaningfully reduced quality control staffing requirements when vision systems handle routine defect detection tasks, freeing remaining quality personnel to focus on complex edge cases and process improvement rather than repetitive visual inspection across their limited available workforce and shrinking talent pipeline nationwide.
Market Impact: Adds 4 to 9 months delay

Market Restraints and Challenges

Model Drift Erodes Accuracy Without Ongoing Monitoring

Deployed vision models gradually lose accuracy as real-world conditions like lighting, product packaging, and camera positioning shift away from the conditions present during initial training, forcing enterprises to budget for ongoing model maintenance rather than treating deployment as a one-time project. The root cause is that machine learning models fundamentally learn statistical patterns specific to training data distribution, and any meaningful shift in that distribution over time degrades prediction accuracy in ways that are often invisible until failure rates climb. Vendors are responding by building automated drift detection and retraining pipelines that flag accuracy degradation before it affects production decisions.
Market Impact: Covers 34 percent of new deployments

Integration Complexity Extends Deployment Timelines Significantly

Enterprise vision deployments routinely require extensive integration work connecting cameras, edge hardware, and existing manufacturing execution or inventory systems, extending project timelines well beyond what vendors quote during initial sales conversations focused primarily on model accuracy alone. The underlying constraint is that most enterprise IT environments were never designed with real-time vision data streams in mind, requiring custom integration work that varies significantly from one facility to the next depending on existing infrastructure. Some vendors now offer standardized integration frameworks and pre-built connectors for common enterprise systems to shorten this timeline.
Market Impact: Cuts deployment timelines by 41 percent
3 additional market trends, 4 additional growth drivers, and 2 additional restraints and challenges are covered in the full report. Contact sales@marketmindsadvisory.com to access the complete intelligence.

Segment CAGR and Growth Architecture

Six end-use segments define computer vision demand, spanning industrial inspection, autonomous vehicles and ADAS, security and surveillance, retail analytics, healthcare imaging diagnostics, and robotics and warehouse automation across enterprise and government buyers alike worldwide and their extended supplier networks. Autonomous vehicles and ADAS now grow fastest as driver assistance features expand across new vehicle production.
computer-vision-market-market-share-analysis-1790004938099

Autonomous Vehicles and ADAS

Automakers are integrating increasingly sophisticated vision systems into driver assistance and autonomous driving features, moving from basic lane departure warnings toward comprehensive scene understanding that combines multiple camera feeds with radar and lidar sensor fusion for real-time decision making across highway and urban driving conditions and varying weather patterns alike and traffic densities. Regulatory mandates requiring advanced safety features on new vehicles anchor much of the near-term demand, pushing vision hardware and software licensing into standard production vehicles rather than optional premium packages reserved for luxury models alone. Robotaxi and commercial autonomous fleet operators increasingly contribute meaningful licensing revenue as pilot programs expand into standing commercial service across additional metropolitan markets.
CAGR 20.5%

Robotics and Warehouse Automation

E-commerce fulfillment operators are deploying vision-guided robotic picking and sorting systems at increasing scale, letting warehouses handle irregular item shapes and packaging variations that earlier fixed-automation systems could never reliably process without extensive manual intervention and human oversight during peak order volume periods, seasonal demand surges, and holiday shopping spikes. Vision-guided mobile robots anchor much of the current demand, navigating dynamic warehouse floors using real-time camera feeds rather than relying entirely on fixed floor markers or wire guidance systems. Manufacturing robotics integrators increasingly specify vision guidance as standard equipment on new robotic arm installations, expanding the addressable application base well beyond traditional warehouse and fulfillment operations into general assembly line automation.
CAGR 18.2%
Full segment breakdown across 6 segments available in the complete report.

Regional Architecture and Country Demand Map

North America leads global computer vision demand, anchored by concentrated AI model research investment and the world's largest autonomous vehicle and enterprise software development base nationwide, well ahead of a fast-growing East Asian manufacturing base and its extensive surveillance camera and industrial automation deployment infrastructure.

North America

AI research and model development concentration anchors regional demand more deeply than anywhere else, with major cloud providers and autonomous vehicle companies here having accumulated years of proprietary training infrastructure and dataset advantages that competitors elsewhere struggle to match. Industrial inspection adoption runs deep across automotive and electronics manufacturing, with facility operators increasingly specifying vision systems as standard equipment on new production line investments. Retail analytics adoption is also expanding quickly across major chains, aided by strong enterprise software procurement budgets and mature cloud infrastructure that smaller competing regions still lack the scale to match. Canada contributes a smaller but growing base of AI research talent and startup activity tied to its expanding technology sector.
Share: 31% | CAGR: 16.3% (2026 to 2036)

East Asia

Manufacturing base concentration gives this region substantial adoption depth, with China anchoring the bulk of regional demand across its massive surveillance camera deployment and rapidly expanding domestic AI model development base pursuing government-backed technology self-sufficiency programs. Japan contributes substantial demand tied to its established precision manufacturing sector, where quality inspection adoption runs particularly deep given the country's export-oriented automotive and electronics industries. South Korea's dense semiconductor and robotics manufacturing base increasingly specifies vision guidance as standard equipment across new production line investments nationwide, reinforcing the region's overall adoption depth and export capacity. Taiwan's electronics contract manufacturers also drive meaningful regional demand tied to their high-precision production environments requiring granular vision inspection.
Share: 28% | CAGR: 16.8% (2026 to 2036)
Regional intelligence for 5 additional markets available in the complete report: Western Europe, South Asia and Pacific, Latin America, Middle East and Africa, Eastern Europe. Contact sales@marketmindsadvisory.com.
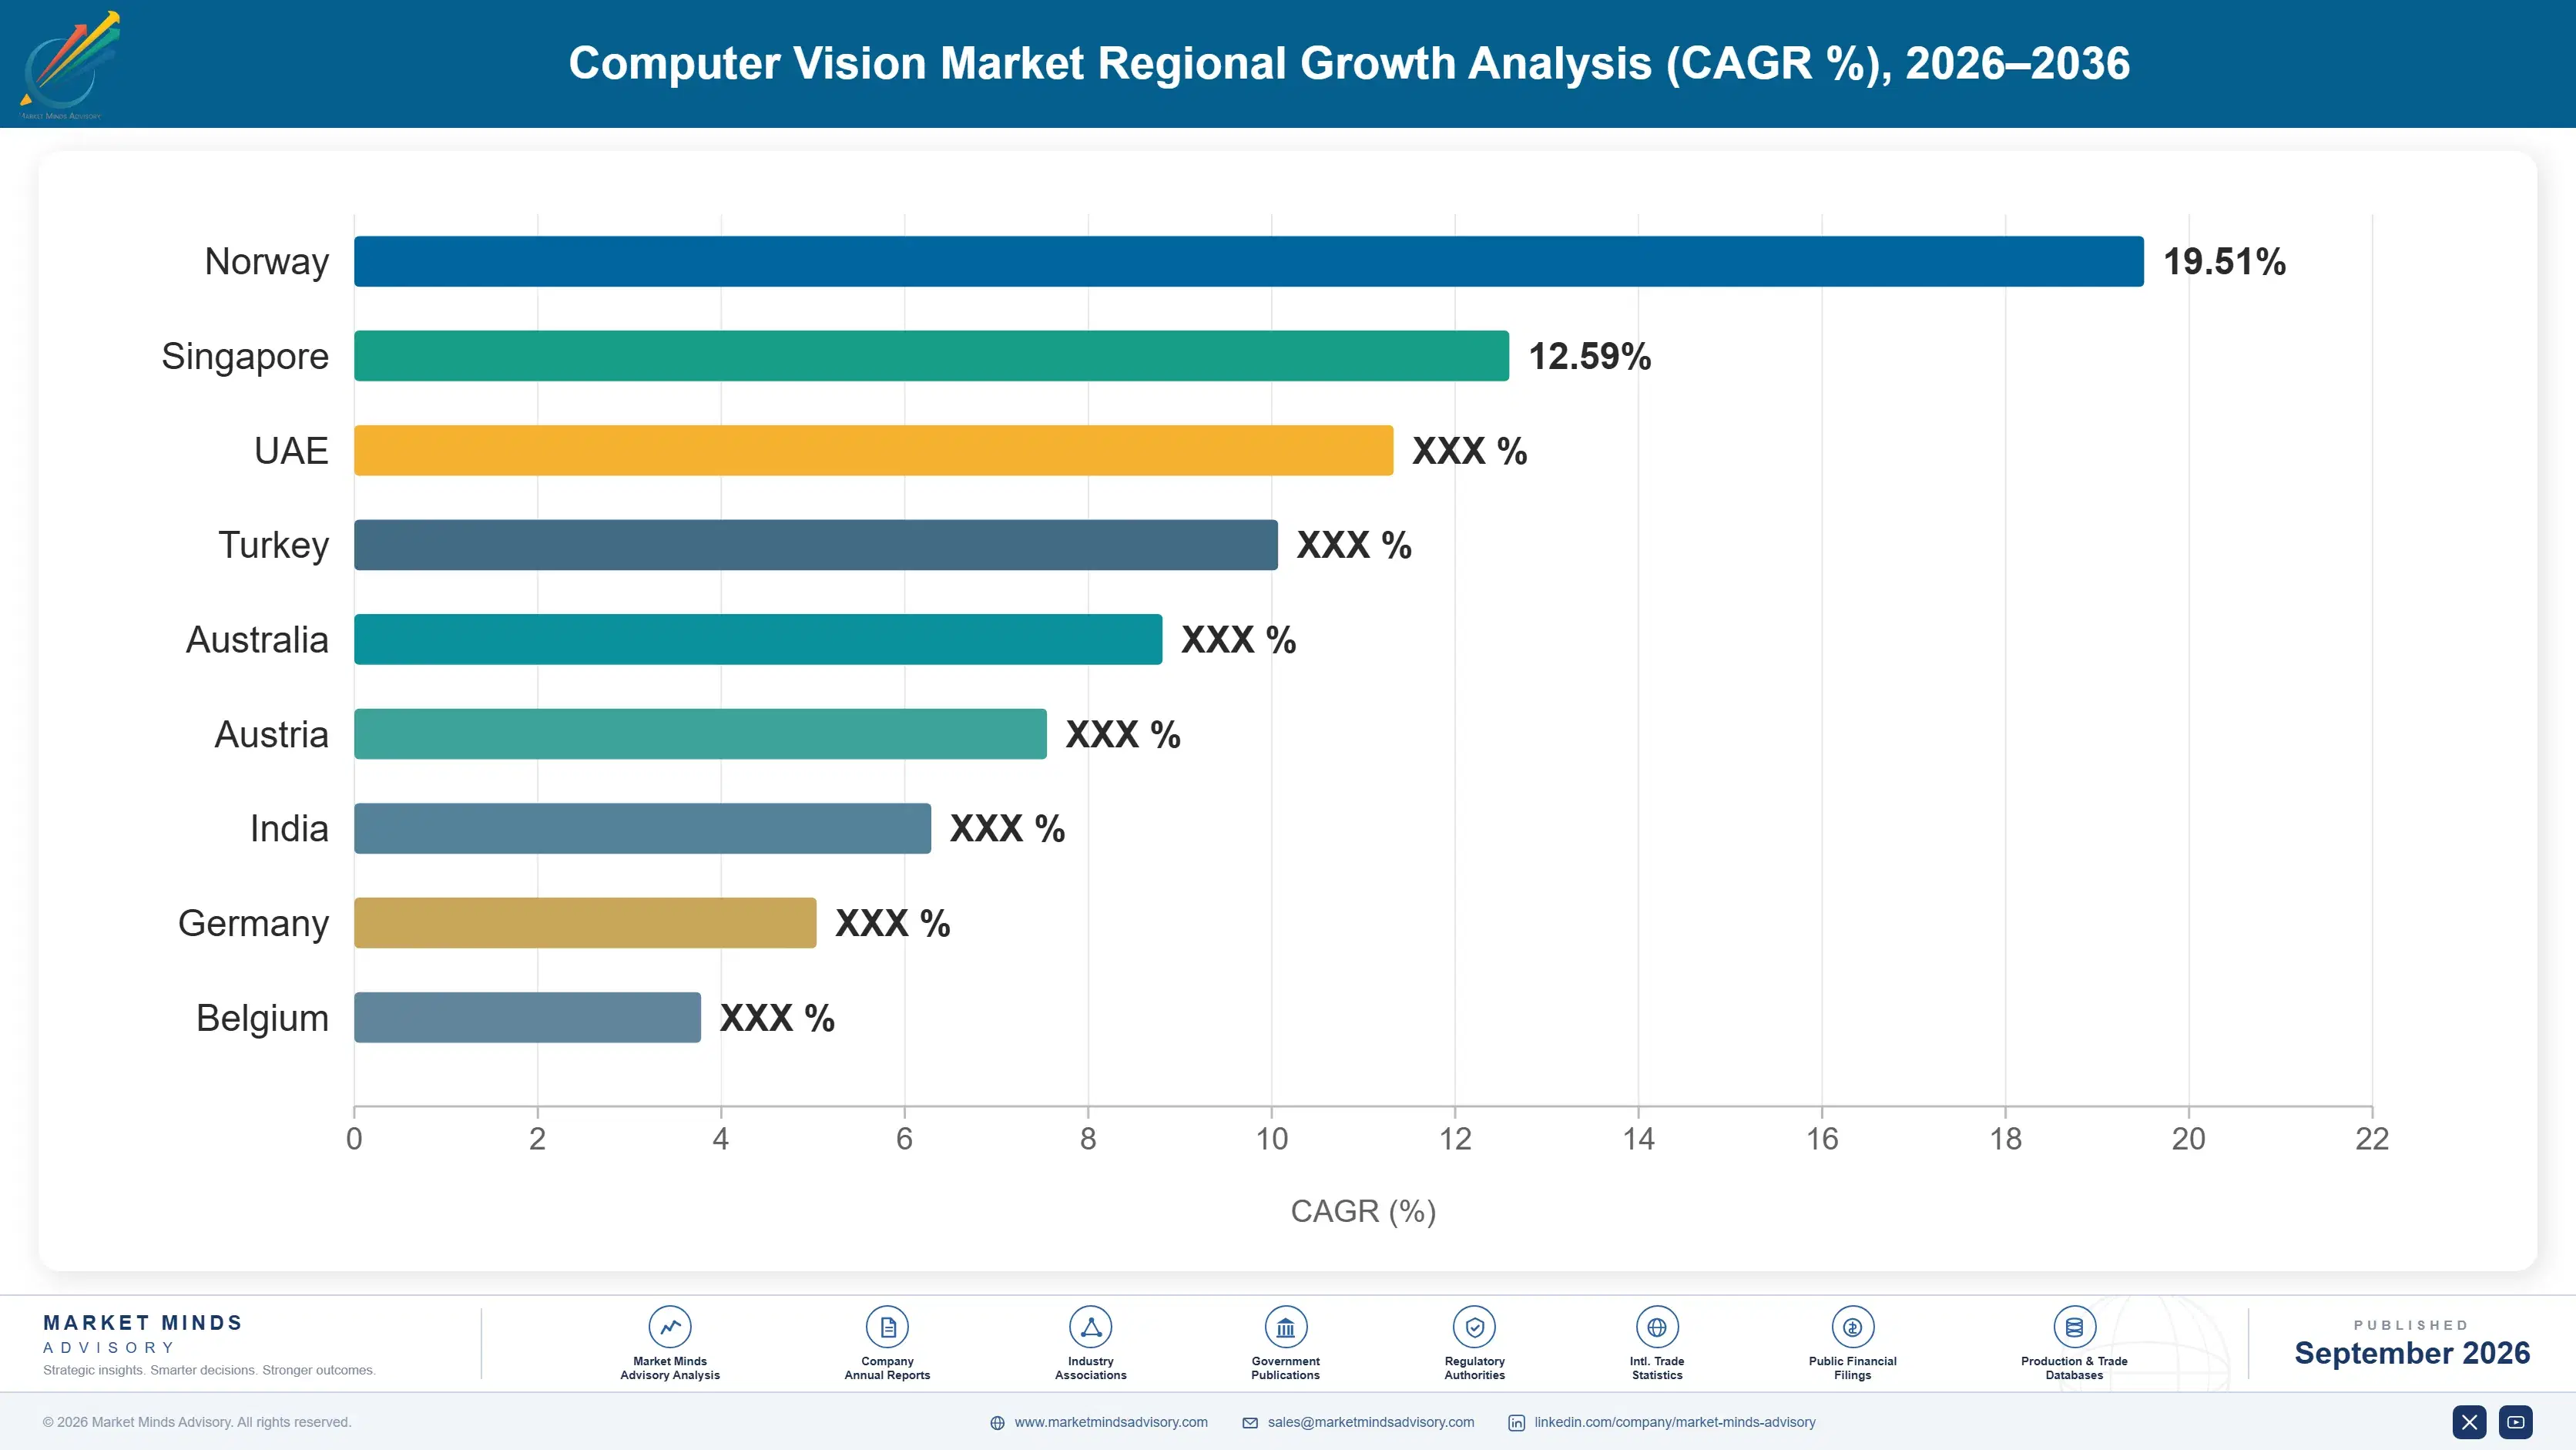
computer-vision-market-country-cagr-analysis-1790004938633

Converting Model Deployments Into Platform Subscriptions

Vendors capture the largest share of long-term value by bundling core vision models with retraining subscriptions, edge hardware licensing, and integration services that convert one-time deployment fees into multi-year enterprise platform relationships spanning facility expansion, model generations, and eventual hardware refresh and upgrade cycles across the entire customer relationship lifetime and every future product line.

Bundle Model Retraining and Drift Monitoring Subscriptions

Vendors increasingly attach automated drift monitoring and retraining subscriptions to core model deployments, converting a one-time integration fee into a recurring revenue relationship that persists across the full multi-year operating life of each production vision system and its successive hardware and software generations and upgrades. Customers gain assured accuracy maintenance without dedicated in-house data science staff, while vendors capture margin that hardware price competition alone increasingly compresses across standard deployment tiers and product categories. Roughly 38 percent of enterprise customers now attach a retraining subscription to every new production deployment.
Market Impact: Adds roughly 26 percent recurring subscription revenue overall

Offer Edge Hardware Leasing and Refresh Programs

Vendors partnering with hardware manufacturers to offer edge inference device leasing and refresh programs lower the upfront capital barrier for mid-sized manufacturers who previously delayed comprehensive vision deployment due to hardware budget constraints, worth roughly 22 percent of typical total project cost each cycle. This financing layer captures interest and service margin beyond the software licensing fee itself while accelerating overall deployment volume, since customers can now spread hardware costs across a multi-year term rather than committing capital all at once. Vendors report meaningfully faster deployment expansion among leasing customers.
Market Impact: Expands the addressable customer base by 24 percent

Sell Custom Model Fine-Tuning as a Service

Vendors with deep training infrastructure expertise increasingly offer custom model fine-tuning services to enterprise customers seeking application-specific accuracy improvements beyond standard off-the-shelf foundation model configurations, often worth 20 percent or more of total contract value across a typical multi-year engagement and renewal. This service layer captures meaningfully higher margins than standard licensing alone, since customers pay a premium for engineering time dedicated specifically to their unique deployment environment rather than a generic model serving many customers simultaneously. Vendors report substantially stronger customer loyalty among accounts receiving custom fine-tuning services regularly.
Market Impact: Generates roughly 22 percent incremental service margin overall

Monetize Aggregated Deployment Performance Data Products

Vendors with large multi-customer installed bases increasingly package anonymized model performance and failure pattern data into secondary analytics products sold to hardware manufacturers and enterprise customers seeking benchmarking data across comparable deployment types, industry verticals, and various geographic regions. This data layer requires minimal incremental cost to produce once the underlying monitoring infrastructure already exists, making it disproportionately profitable relative to standard licensing margins that rarely exceed 30 percent across the category. Early movers in this space are building data moats that later entrants will find increasingly difficult to replicate.
Market Impact: Generates roughly 16 percent incremental margin each year

Who Controls the Margin Pool

The computer vision market carries a CR5 of 38 percent, leaving substantial room for specialized model vendors and vertical application startups to compete alongside the largest GPU and cloud platform incumbents across most application segments simultaneously. NVIDIA and Cognex's hardware scale and existing customer relationships separate them clearly from the next tier of challengers, most of whom compete on specialized vertical models rather than broad-based platform competition.
Current competitive activity centers on edge inference hardware efficiency and foundation model fine-tuning capability races, as vendors work to certify systems across the widest possible set of deployment environments ahead of enterprise buyers committing to a single vision platform for a multi-year automation program. Several vendors have also begun bundling drift monitoring and edge hardware leasing to lock in customers beyond the initial deployment.

Rankings are most likely to shift as foundation models commoditize basic detection and classification tasks, favoring vendors who differentiate clearly on vertical-specific accuracy and integration depth over those competing primarily on general-purpose model performance. Smaller specialists focused narrowly on single applications like retail analytics face rising pressure from platform vendors extending coverage across adjacent use cases, threatening the niche positioning several mid-tier vendors have relied on for years.
computer-vision-market-company-positioning-matrix-1790004939161

Competitive Moat and Risk Dimensions

NVIDIA

Moat: GPU and software stack depth

NVIDIA's deep integration between its GPU hardware and broader software development stack gives customers a unified training and inference pipeline that competitors offering standalone model software struggle to replicate, letting the company bundle vision model licensing into broader multi-year hardware and platform subscription agreements across its enterprise customer base.
NVIDIA

Risk: Exposure to hardware price competition

NVIDIA's hardware-centric business model leaves it more exposed to emerging lower-cost inference chip competitors than software-only vendors, particularly as specialized edge inference chips designed for narrower vision workloads increasingly challenge its general-purpose GPU pricing power across cost-sensitive mid-market deployment segments and smaller enterprise customer accounts.
COGNEX

Moat: Industrial machine vision certification depth

Cognex's deep certification heritage across major industrial manufacturers and quality control organizations gives it design-in relationships across a wide range of production line inspection programs that broader AI platform vendors offering general-purpose models have struggled to match in this specific industrial application niche and its associated certification requirements.
COGNEX

Risk: Narrower platform breadth exposure

Cognex's comparatively narrower application breadth outside industrial inspection leaves it more exposed to customers seeking single-vendor solutions spanning autonomous vehicles, retail analytics, and security applications as well, pushing some large diversified customers toward broader platform vendors offering integrated portfolios instead across their entire enterprise footprint.

Players Tracked

Prominent Players

NVIDIA Corporation
Cognex Corporation
Intel Corporation
Google LLC
Microsoft Corporation

Other Key Players

Basler AG
Keyence Corporation
OmniVision Technologies Inc
Sony Group Corporation
Teledyne Technologies Incorporated
Zebra Technologies Corporation
Datalogic SpA
MVTec Software GmbH
SICK AG
Clarifai Inc
Scale AI Inc
Landing AI Inc
Matroid Inc
Chooch AI Inc
Trigo Vision Ltd

Recent Developments

JUNE 2025

NVIDIA launches new AI vision inference chip

NVIDIA announced a new AI vision inference chip optimized for edge deployment in industrial and robotics applications, targeting manufacturers seeking faster on-device processing without the latency and connectivity dependency that cloud-based inference architectures previously required for time-sensitive production line decisions and real-time safety interventions across facilities.
Signal: Signals leading global semiconductor chipmakers steadily racing to capture the fast-growing edge AI inference hardware market
SEPTEMBER 2025

Cognex acquires machine vision software startup

Cognex acquired a machine vision software startup specializing in automated defect characterization, strengthening its industrial inspection portfolio for automotive and electronics customers seeking faster deployment and more consistent accuracy across large-scale multi-site manufacturing programs and their expanding global production networks, supplier bases, and quality assurance teams.
Signal: Signals continued industry consolidation among the industry's most established global machine vision software platform vendors worldwide
MARCH 2025

Intel signs ADAS vision chip supply agreement

Intel entered into a supply agreement with a major automaker to provide vision processing chips for its next-generation driver assistance systems, extending its existing automotive semiconductor relationship into a broader multi-year vision hardware and software licensing contract covering several vehicle platforms and production line facilities.
Signal: Signals semiconductor incumbents steadily expanding further into automotive vision hardware revenue streams and ongoing support services

GPU Silicon and Image Sensor Cost Exposure

GPU and AI accelerator silicon, alongside high-resolution image sensors, together represent roughly 56 percent of computer vision system cost of goods sold, concentrated primarily across Taiwan, South Korea, and Japan, with secondary sensor fabrication capacity spread steadily across the United States and various parts of Western Europe supplementing the primary Asian semiconductor supply base overall.
GPU and specialized AI chip prices spiked meaningfully during 2025 as demand for training and inference capacity surged across cloud, enterprise, and autonomous vehicle customer segments simultaneously, a trend company annual reports linked to intensifying competition for a limited pool of advanced semiconductor fabrication capacity worldwide, forcing several vendors to absorb higher hardware costs for two consecutive fiscal quarters rather than pass the full increase through to customers mid-contract.

Smaller vendors without long-term chip supplier agreements face the sharpest cost pressure during these episodes, since they lack the purchasing volume to secure priority silicon allocation during shortages. Larger vendors with multi-year supply contracts and diversified sourcing relationships weather these episodes with comparatively minor disruption to production schedules and existing customer delivery commitments across their broader installed base and regional service territories.
computer-vision-market-cost-volatility-analysis-1790004939365

Diversify GPU and AI chip sourcing relationships

Several vendors are qualifying alternative inference chip suppliers outside the traditional GPU supply base, reducing exposure to future capacity disruptions tied to a concentrated set of specialized global producers and shortening emergency procurement timelines across the broader semiconductor supply chain, its secondary fabrication partners, contract foundry operators, and specialized packaging and testing houses worldwide.

Invest in domestic sensor fabrication capacity

Larger vendors increasingly invest in domestic image sensor fabrication infrastructure, trading upfront capital investment for long-term supply certainty that protects production schedules during periods of broader global component shortages affecting the wider technology sector and its major regional suppliers, assembly partners, secondary fabrication sites, contract manufacturers, and specialized packaging facilities spread across the world overall.

Negotiate multi-year silicon supply agreements

Vendors are increasingly locking in multi-year fixed-price silicon supply agreements with key chip manufacturers, trading some near-term flexibility for predictable input cost planning across multi-year customer delivery commitments and internal margin forecasts spanning several fiscal years across the entire organization, its regional business units, and its long-term global supplier and product distribution networks worldwide.

Portfolio Architecture for Margin Defence

Three tiers structure the computer vision market, separating volume-oriented standard detection models from premium certified platforms carrying autonomous vehicle and regulated application value. Gross margin ranges span roughly twenty points between the volume tier and the certified premium tier, reflecting how much value enterprise buyers place on real-world accuracy and edge inference performance across demanding deployment environments and downstream applications.
Volume-tier deployments still dominate unit counts across standard retail and manufacturing quality control applications, but premium autonomous vehicle and certified regulated systems capture a disproportionate share of vendor profit pools because automotive and healthcare buyers pay materially more for proven reliability and safety certification. This tension shapes vendor product roadmaps directly, pushing established players toward higher-margin certified platforms and away from commodity detection models alone as competition intensifies across the volume tier.

High-value margin pools concentrate specifically around model fine-tuning bundled with drift monitoring subscriptions, since enterprise buyers increasingly value the recurring accuracy maintenance and integration support these arrangements generate over simple model licensing alone, a pattern accelerating as deployment footprints grow across multiple facilities, application categories, successive hardware generations, and rapidly expanding enterprise vendor relationships worldwide.

Volume / Commodity-Adjacent Tier

Standard object detection and classification models for routine retail and manufacturing applications, sold largely on price and delivery speed against established regional competitors across mature national markets and secondary procurement channels.
Gross Margin: 26 to 34%

Premium / Certified Tier

Autonomous vehicle and regulated healthcare vision systems carrying safety certification credentials, commanding materially higher prices from buyers requiring guaranteed reliability across the industry's most demanding regulatory environments, applications, and multi-year platform validation cycles.
Gross Margin: 42 to 51%

Sustainability / Regulatory / Next-Generation Tier

Energy-efficient edge inference platforms aligned to emerging data center sustainability mandates and long-term deployment cost reduction targets across large enterprise operator groups, their multi-facility networks, and broader supply chain partners worldwide.
Gross Margin: 46 to 56%
computer-vision-market-portfolio-architecture-1790004939879

High-value Sub-segments and Strategic Watch-out

Autonomous Vehicle Certified Vision Systems

Combines the fastest unit growth with the richest margin profile as automakers pair certified hardware with fine-tuning and regulatory compliance subscriptions, creating durable recurring revenue streams beyond the initial licensing fee itself across expanding vehicle production programs and successive model generations worldwide throughout the forecast decade.
Gross Margin: 48 to 57%

Robotics and Warehouse Vision Guidance

Commands strong margins from logistics operators seeking certified reliability across regulated warehouse safety standards, though growth trails the fastest autonomous vehicle segment by a moderate but consistent margin across most fulfillment center budgets nationwide and across several export-oriented global distribution markets, networks, and supply chains.
Gross Margin: 40 to 48%

Standard Retail and Manufacturing Detection

Remains the volume core of the market, anchoring licensing counts across routine detection and classification deployments even as margin pressure intensifies from regional low-cost competitors expanding aggressively into adjacent enterprise markets and secondary procurement channels across multiple continents and several fast-growing emerging market economies worldwide.
Gross Margin: 26 to 33%

Legacy Rule-Based Vision Replacement Programs

Warrants close monitoring as older rule-based machine vision installations approach replacement age, creating a swing factor that could either sustain volume-tier demand or accelerate migration toward deep learning platforms entirely across the customer base over the coming several forecast years and budget planning cycles ahead.
Gross Margin: 22 to 29%

Vision Deployments as Recurring Infrastructure

Computer vision platforms increasingly function as long-lived enterprise infrastructure rather than one-time model deployments, generating recurring retraining, drift monitoring, and eventual hardware refresh revenue across a typical four to six year deployment service life. Enterprise customers rarely swap vision vendors mid-deployment given the integration cost of retraining models and reconfiguring camera and edge hardware pairings, giving incumbent vendors durable annuity-like revenue once a platform is standardized across a facility.
Adoption stickiness varies meaningfully by end-use vertical. Automotive and healthcare programs exhibit the deepest lock-in given multi-year regulatory certification requirements and extensive safety validation cycles, while retail analytics buyers switch more readily since their deployments carry shorter contract cycles and lower integration complexity. Manufacturing customers sit between these two, valuing proven reliability but retaining flexibility as new sensor and foundation model technologies create natural vendor re-evaluation points.

Buyer profiles are shifting generationally as enterprise technology teams increasingly favor foundation model fine-tuning offering rapid deployment over legacy custom model development requiring lengthy in-house data science investment. Younger engineering leadership entering enterprise organizations expect the same rapid iteration capability common across other cloud software categories, gradually reshaping vendor selection criteria toward platforms bundling fine-tuning support alongside core model licensing.
computer-vision-market-end-use-penetration-index-1790004940374

Where Computer Vision Value Concentrates Next

These are among the four positions where our research anticipates prominent divergence between winners and laggards over the coming forecast period. Each is grounded in the demand model, the regulatory perimeter, and the announced capacity pipeline.
01 / REAL-WORLD ACCURACY PRIORITY

Prioritize deployment-condition accuracy over benchmark scores

Vendors still competing primarily on standardized benchmark performance face compressing margins as foundation models commoditize basic detection tasks that once justified premium pricing across standard applications and mid-market deployments. Reallocating engineering investment toward real-world deployment accuracy under variable lighting and occlusion conditions captures the disproportionate profit pool tied to autonomous vehicle and regulated healthcare certification requirements now determining vendor selection across the most demanding customer segments. Firms that delay this shift risk ceding the highest-margin certified contracts to faster-moving rivals within the next several years.
02 / SEMICONDUCTOR SUPPLY RESILIENCE

Diversify GPU and AI chip sourcing relationships

GPU and AI accelerator exposure remains concentrated among a small group of Taiwanese and Korean suppliers, leaving vendors without diversified sourcing relationships vulnerable during future capacity shortages tied to competing cloud and autonomous vehicle demand across multiple industries simultaneously. Securing multi-year fixed-price silicon contracts protects production schedules against the kind of cost compression seen during the 2025 pricing spike, when several vendors absorbed higher costs for two consecutive quarters. This single step meaningfully reduces earnings volatility tied to component pricing swings ahead.
03 / GEOGRAPHIC MARKET PRIORITIZATION

Prioritize North America and South Korea expansion investment

North America anchors regional volume through concentrated AI model research investment and the world's largest autonomous vehicle development base, while South Korea's faster growth trajectory reflects an earlier stage of robotics and semiconductor manufacturing vision investment across its expanding industrial base. Vendors that establish local research partnerships or service centers in these regions gain meaningful cost and delivery advantages over competitors operating from more distant headquarters locations. This positioning matters increasingly as customers favor suppliers who can meet compressed deployment timelines reliably.
04 / RECURRING REVENUE MONETIZATION

Build recurring revenue through model retraining subscriptions

Bundling automated drift monitoring with subscription-based model retraining services creates a recurring revenue stream that one-time deployment fees alone cannot replicate across a vendor's installed customer base and multi-year automation programs spanning several successive hardware and software generations. Vendors making this transition report materially stronger blended margins than peers still selling standard models as one-time licensing transactions, and several have begun restructuring sales compensation around subscription attachment rates. Building this capability now positions vendors ahead of the broader industry shift toward subscription-based model maintenance.

Engagement Snapshot From the Field

A live engagement with an industry participant carrying material or product regulatory and market exposure ahead of a defining policy shift, showing how our research translates into a defensible multi-year portfolio strategy.
MARKET MINDS ADVISORY · CLIENT ENGAGEMENT SUMMARY
Computer Vision Producer Strategic Portfolio Review and Transition Roadmap 2026·Investment Scenario on Computer Vision Exposure Evaluation 2025-26
CLIENT PROFILE
A multi-plant electronics manufacturer operating eight production facilities across North America approached MMA to evaluate consolidating fragmented plant-level vision inspection tools into a single enterprise platform. The manufacturer's individual plants had adopted four different vision vendors over the prior several years, creating inconsistent defect classification standards that complicated corporate-level quality benchmarking and executive-level reporting decisions.
STRATEGIC CHALLENGE
The manufacturer faced a choice between standardizing on a single enterprise vision platform immediately across all eight plants or pursuing a phased migration that would let individual facilities retain existing systems until natural contract renewal dates. Internal teams disagreed on which approach better balanced near-term disruption risk against the corporate-level quality reporting consistency executives increasingly demanded.
MMA APPROACH
MMA conducted primary interviews with plant quality managers and corporate operations executives and benchmarked platform vendor integration capabilities against the manufacturer's diverse camera and lighting infrastructure across all eight facilities. The team modeled migration cost and disruption risk under three consolidation scenarios, drawing on comparable multi-plant standardization engagements across the broader electronics manufacturing industry.
KEY FINDINGS
  1. Roughly forty-two percent of existing plant-level vision contracts were already approaching natural renewal within the following eighteen months across the entire network.
  2. A phased migration tied to existing contract renewal dates reduced disruption risk relative to immediate full-scale platform replacement (client-reported, unverified by MMA).
  3. Standardizing on a single platform vendor reduced projected total licensing and support costs by roughly nineteen percent compared to maintaining four separate vendor relationships (client-reported, unverified by MMA).
  4. Corporate-level defect classification consistency improved measurably once at least half of the entire facility network migrated to the newly standardized platform nationwide.
CLIENT PROFILE
A multi-plant electronics manufacturer operating eight production facilities across North America approached MMA to evaluate consolidating fragmented plant-level vision inspection tools into a single enterprise platform. The manufacturer's individual plants had adopted four different vision vendors over the prior several years, creating inconsistent defect classification standards that complicated corporate-level quality benchmarking and executive-level reporting decisions.
STRATEGIC CHALLENGE
The manufacturer faced a choice between standardizing on a single enterprise vision platform immediately across all eight plants or pursuing a phased migration that would let individual facilities retain existing systems until natural contract renewal dates. Internal teams disagreed on which approach better balanced near-term disruption risk against the corporate-level quality reporting consistency executives increasingly demanded.
MMA APPROACH
MMA conducted primary interviews with plant quality managers and corporate operations executives and benchmarked platform vendor integration capabilities against the manufacturer's diverse camera and lighting infrastructure across all eight facilities. The team modeled migration cost and disruption risk under three consolidation scenarios, drawing on comparable multi-plant standardization engagements across the broader electronics manufacturing industry.
KEY FINDINGS
  1. Roughly forty-two percent of existing plant-level vision contracts were already approaching natural renewal within the following eighteen months across the entire network.
  2. A phased migration tied to existing contract renewal dates reduced disruption risk relative to immediate full-scale platform replacement (client-reported, unverified by MMA).
  3. Standardizing on a single platform vendor reduced projected total licensing and support costs by roughly nineteen percent compared to maintaining four separate vendor relationships (client-reported, unverified by MMA).
  4. Corporate-level defect classification consistency improved measurably once at least half of the entire facility network migrated to the newly standardized platform nationwide.
RECOMMENDED STRATEGY
Phase 1: Phase one migrated the two plants with contracts nearest to natural renewal onto the newly standardized enterprise platform right away. Phase 2: Phase two extended migration to the remaining plants as their existing contracts gradually reached renewal over the following two years. Phase 3: Phase three established a formal corporate governance process requiring all future facility acquisitions to standardize on the platform immediately upon integration.
OUTCOME
The manufacturer adopted the phased migration approach, reporting a nineteen percent reduction in total licensing and support costs once the full facility network was standardized (client-reported, unverified by MMA). Corporate-level quality benchmarking became measurably more consistent within the first full year of the migration program.

Frequently Asked Questions

Foundational context covering the market sizes, CAGR, scope, country, region and competition that inform every finding below. This section is provided to cover basics and most often pre-purchase conversations, answered from the MMA Primary Research Dataset.

What is the current size of the Computer Vision Market?

The computer vision market reached an estimated 19.8 billion dollars globally in 2025. Growth reflects accelerating deep learning adoption across manufacturing, retail, and automotive applications worldwide.

How large will the Computer Vision Market be by 2036?

MMA projects the market will reach roughly 99.4 billion dollars by 2036 under the base case scenario. That reflects more than a four-fold increase over 2026 revenue by 2036.

What is the CAGR for the Computer Vision Market 2026 to 2036?

The base case compound annual growth rate is 15.8 percent across the forecast period. Bull and bear scenarios range from 14.6 percent to 17.0 percent depending on foundation model adoption pace.

Which segment is growing fastest?

Autonomous Vehicles and ADAS leads growth at a 20.5 percent CAGR, roughly 1.30 times the overall market rate. Expanding driver assistance mandates drive this accelerating adoption pace.

Who are the major companies in the Computer Vision Market?

NVIDIA, Cognex, Intel, Google, and Microsoft lead the competitive landscape. Combined, the top five players hold an estimated 38 percent share on a revenue basis.

Which country is growing fastest?

South Korea leads country-level growth at a 17.2 percent CAGR, outpacing the global average as its robotics and semiconductor manufacturing base scales rapidly. Industrial automation investment contributes meaningfully to this pace.

Report Segmentation Architecture

The full report scope spans multiple orthogonal segmentation dimensions, with cross-tabulated demand data provided for each dimension pair. Coverage extends further to regional breakdowns, trend trajectories, and the competitive detail needed to support segment-level decision-making.

By Primary Market Dimension

  • Vision Hardware and Cameras
  • Edge Inference Chips and Processors
  • Vision Software and AI Models
  • Model Training and Fine-Tuning Services
  • Vision Cloud Platform Services
  • Integration and Deployment Services

By End-Use Industry

  • Automotive and Autonomous Vehicles
  • Industrial Manufacturing
  • Retail and E-Commerce
  • Healthcare and Medical Imaging
  • Security and Public Safety
  • Logistics and Warehouse Automation

By Commercial Dimension

  • Direct Enterprise Licensing
  • Cloud Platform Subscription Channel
  • Systems Integrator Channel
  • OEM Hardware Bundled Sales
  • Model Fine-Tuning Service Contracts
  • Managed Deployment and Support Services

By Region

  • North America
  • East Asia
  • Western Europe
  • South Asia and Pacific
  • Latin America
  • Middle East and Africa
  • Eastern Europe

Scope, Methodology, and Coverage

Every figure in this report is reproducible from documented input assumptions. The scope below maps the historical period, the forecast horizon, the segmentation dimensions, and the countries covered, alongside the underlying primary and qualitative methodology.
Historical Period
2020 to 2025
Forecast Period
2026 to 2036
Base Year
2025 (USD billions; MMA Primary Research Dataset, September 2026)
Market Definition
The computer vision market covers hardware, software, and AI models that enable machines to interpret and act on visual data across industrial, automotive, retail, security, healthcare, and robotics applications. It excludes standalone image sensor manufacturing sold without vision processing capability, general-purpose cloud computing infrastructure, and consumer photography editing software.
Quantitative Units
USD Billion
Segmentation Dimensions
Application, End-Use Industry, Commercial Channel, Region
Regions Covered
North America, East Asia, Western Europe, South Asia and Pacific, Latin America, Middle East and Africa, Eastern Europe
Countries Covered
United States, Canada, Germany, United Kingdom, France, China, Japan, South Korea, India, Australia, Brazil, Mexico, Saudi Arabia, Israel, Poland
Key Companies Profiled
NVIDIA Corporation, Cognex Corporation, Intel Corporation, Google LLC, Microsoft Corporation, Basler AG, Keyence Corporation, OmniVision Technologies Inc, Sony Group Corporation, Teledyne Technologies Incorporated, Zebra Technologies Corporation, Datalogic SpA, MVTec Software GmbH, SICK AG, Clarifai Inc, Scale AI Inc, Landing AI Inc, Matroid Inc, Chooch AI Inc, Trigo Vision Ltd
Quantitative Methodology
Primary survey, n=3,800 respondents, Q4 2025, six countries; demand-side model with trade association cross-validation
Qualitative Methodology
47 expert interviews, Q4 2025; applied to validate demand model assumptions, identify emerging dynamics, and assess competitive positioning
Report Format
PDF and XLSX data workbook (Word format preview document)
Publisher
Market Minds Advisory
Report Code
MMA-2026-TEC-582
Published
September 2026
Contact
sales@marketmindsadvisory.com | www.marketmindsadvisory.com

Purchase the full Computer Vision Market Report (2026 to 2036).

This report delivers a comprehensive analysis of the global computer vision market across the 2026 to 2036 forecast period. It covers market sizing, segmentation by application and end-use industry, and regional demand dynamics across all seven major world regions. The report profiles twenty leading vendors, benchmarks competitive positioning, and quantifies input cost exposure tied to GPU silicon and image sensor supply chains. Analysts detail revenue diversification strategies, portfolio margin economics, and the demand mechanisms shaping enterprise procurement decisions through the coming decade. A dedicated client case study illustrates how these findings translate into practical platform consolidation decisions.
Seven-region demand and CAGR breakdown analysis
Twenty-company competitive benchmarking and positioning profile
Revenue lever and monetization pathway analysis
Input cost exposure and mitigation strategies
Segment-level growth and margin forecasting detail
Client engagement case study with outcomes

Built For The People Who Decide

From boardroom strategy to bench-side execution, this report is read cover-to-cover by leaders shaping the next decade of their industry, turning demand scenarios, market dynamics and valuation benchmarks into decisions.
CXOs/ Presidents/ VPs/ Managers
M&A and Corporate Development
Strategy Teams and R&D Heads
Procurement and Product Directors
Regulatory and Compliance Leaders
Investor Relations and Equity Analysts