Market Minds Advisory
Computer Microchips Market

Computer Microchips Market: Computer Microchips Market: Node Economics, Packaging Value and The Customer Who Became A Competitor 2026 to 2036

For forty years the buyer of a computing chip was somebody building a computer. The largest buyers now design their own, which changes what a chip company is actually selling.

Lead Analyst

Published

September 2026

Make Smarter Decisions with Customized Research Insights

Request a free sample report and evaluate market opportunities, growth trends, and competitive dynamics relevant to your business needs.

2025 MARKET VALUE$296.0BMarket Size 2025
2036 FORECAST VALUE$970.4BBase Case , 2026 to 2036
CAGR 2026 TO 203611.4 %Bull 12.7% / Bear 10.1%
INCREMENTAL OPPORTUNITY$640.7BNet 10- year value creation
EXPANSION MULTIPLE2.94x2036 value over 2026 base
Strategic Levers
M&A Pipeline
Regional Outlook
Country Rankings
Competitive Intelligence
Segmental Deep-dive
Call-Us : 91 93563 13602

Executive Snapshot and Market Trajectory.

For forty years the buyer of a computing chip was somebody assembling a computer out of parts. The largest buyers now design their own silicon and purchase fabrication directly, which changes what a chip company is actually selling and to whom it sells it.
The market reaches USD 329.7 billion in 2026 and USD 970.4 billion by 2036, a 2.94 times expansion at 11.4%. AI accelerator and parallel compute logic grows at 17.1%, half again the market rate of 11.4%, because workloads moved toward parallel computation across every serious data centre. East Asia holds 44% of global shipment revenue, far above the usual band ceiling, and India compounds fastest of any market at 19.6% on design and assembly investment.
Five suppliers hold 62% of all computing logic shipment revenue, concentrated among firms designing at the leading node where a single product now costs around USD 580 million to develop. NVIDIA, Intel, AMD, Qualcomm and Broadcom lead the field between them. Advantage has moved decisively toward packaging and manufacturing access rather than transistor design, which is a considerable change from how the previous four decades worked.
Market Definition
This report covers computing logic microchips by device class: AI accelerator and parallel compute logic, server and data centre processors, client computing processors, embedded and edge compute processors, networking and infrastructure logic, and mature-node general purpose logic. It excludes memory and storage devices of every kind, analogue and mixed-signal components, power semiconductors and discretes, image sensors, semiconductor manufacturing equipment, and design software or intellectual property licensing.
Base Year Value
$296.0B in 2025 (MMA Primary Research Dataset, September 2026)
Forecast Period
2026 to 2036, eleven discrete annual values
CAGR
11.4% base case. Bull 12.7%. Bear 10.1%.
Fastest Growth Segment
AI Accelerator And Parallel Compute Logic: 17.1% CAGR
Fastest Growth Country
India: 19.6% CAGR
Fastest Growth Region
South Asia and Pacific: 13.6% CAGR
Largest Region
East Asia: 44% of 2025 global value
Market Leaders
NVIDIA, Intel, AMD, Qualcomm and Broadcom lead on computing logic chip shipment revenue. Source: MMA Analysis.
Primary Survey
n=3,800 procurement and R&D decision-makers, Q4 2025, six countries
Methodology
Demand-side build-up, cross-validated against public data, 47 expert interviews

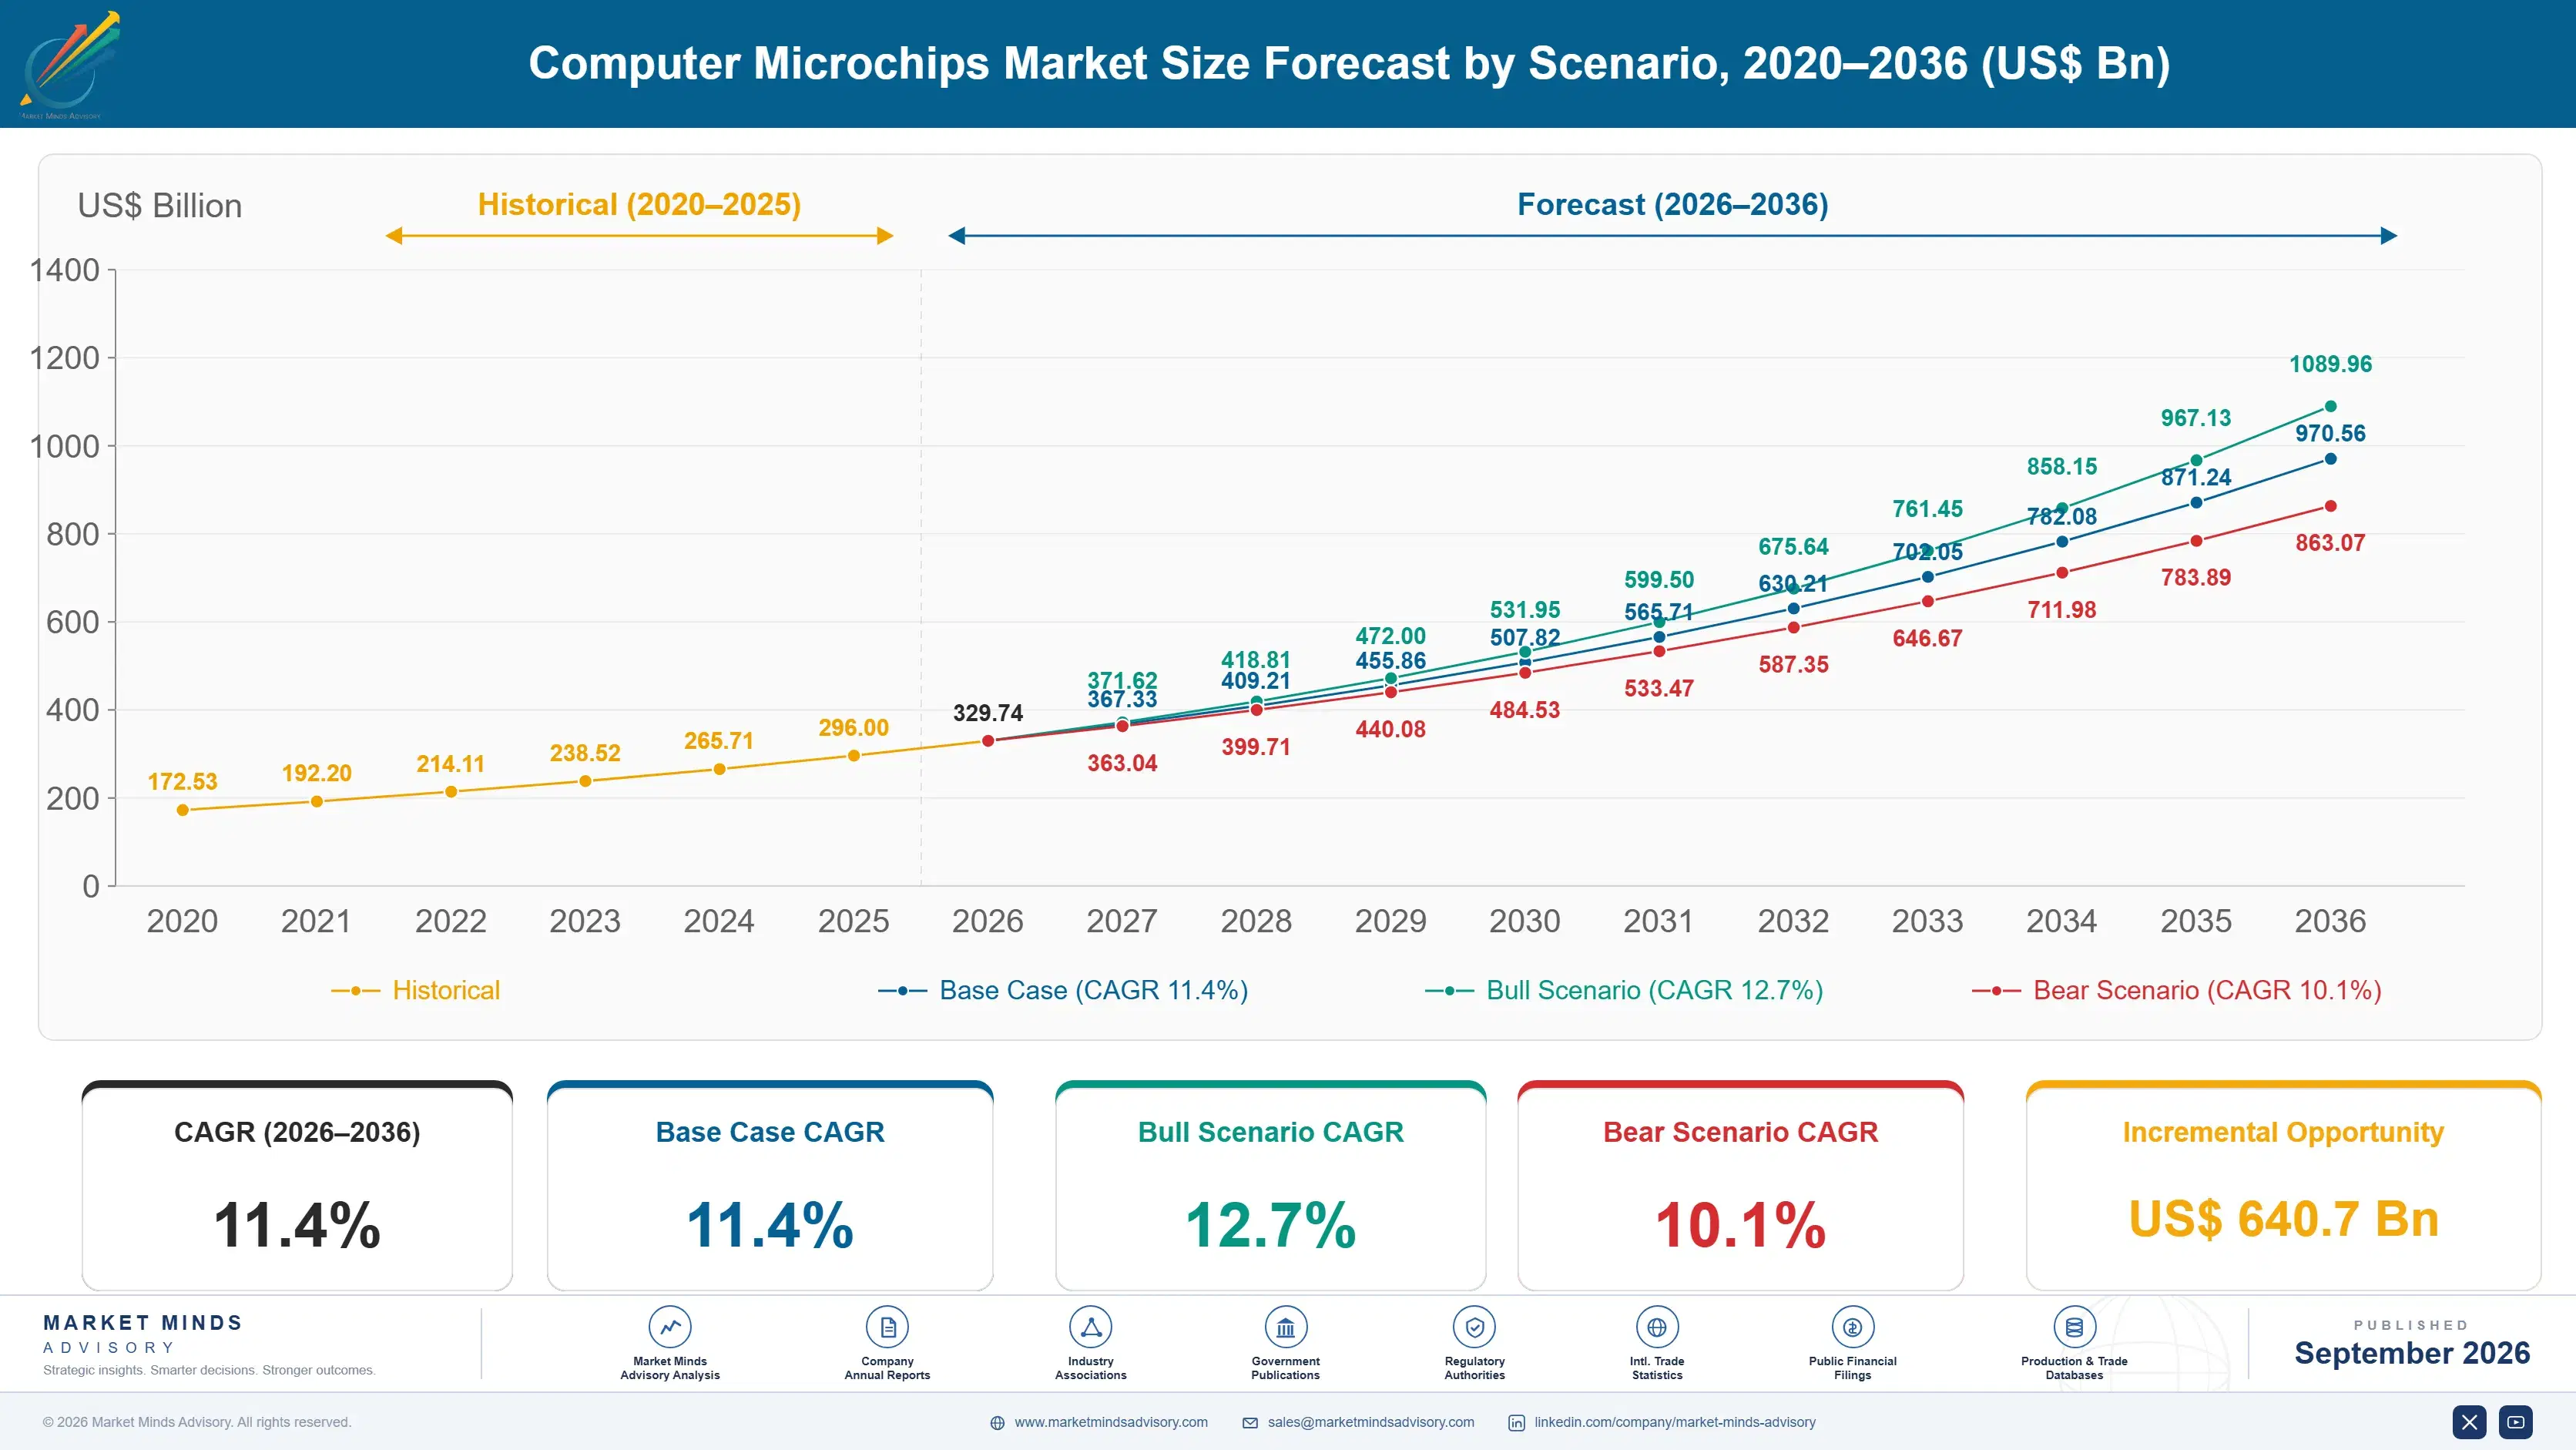
Computer Microchips Market Forecast Scenarios

computer-microchips-market-size-forecast-scenario-1789996436315
Between 2020 and 2025 the category compounded at 10.2%, and the composition changed more than the total did. Client computing flattened after a surge that pulled several years of purchases forward. Accelerator demand for machine learning training arrived and grew at rates nobody in the industry had modelled. Manufacturing capacity became the constraint on delivery rather than demand, which had not been true for a long time.
The base case holds 11.4% on three mechanisms working together. Parallel compute demand keeps rising as machine learning workloads move from training into inference at far larger volumes. Advanced packaging keeps adding value where transistor scaling no longer delivers gains at the old rate, and packaging now absorbs roughly 27% of finished device cost. And custom silicon designed by the largest buyers keeps growing, shifting revenue toward manufacturing and packaging rather than removing it.
The bull case at 12.7% assumes inference deployment scales faster than currently planned, since inference volume dwarfs training volume once applications reach production. The bear case at 10.1% is capital digestion: enormous accelerator purchases have been made against demand nobody has fully verified, and a pause while buyers establish what they actually need would slow the category considerably.

Where Chip Value Actually Sits

Two numbers explain most of what has happened to this industry. Developing a single leading node product now costs around USD 580 million, and building a fabrication facility capable of making it costs roughly USD 24 billion. Both figures have risen faster than the market, which means the number of products and the number of companies that can justify leading node economics keeps falling with every generation.
TOP FIVE CONCENTRATION62%Concentrated among firms designing leading node computing logic
LEADING NODE DESIGN COST580 millionTypical development spend for a single leading node product
LEADING EDGE FAB COST24 billionCapital required for one new leading node manufacturing facility
MATURE NODE VOLUME SHARE58%Wafer starts running on established rather than leading processes
ADVANCED PACKAGING SHARE27%Portion of finished device cost sitting in assembly work
DESIGN TO VOLUME PERIOD34 monthsFrom architecture freeze to volume shipment on new products
That is why 58% of wafer starts still run on mature processes, and why the industry that talks constantly about the leading edge actually earns a great deal of its volume elsewhere. A microcontroller in an appliance does not need a leading node and never will. The commercial mistake made repeatedly is treating mature node capacity as a legacy business rather than as the volume foundation it genuinely is.
The third change is where performance now comes from. Transistor scaling delivers less per generation than it once did, so gains increasingly come from packaging: chiplets, stacked memory and interconnect built at assembly rather than at the wafer. Advanced packaging absorbs roughly 27% of finished device cost, which relocates competitive advantage toward assembly capability that most chip designers do not own.
"The industry spent decades competing on who could design the better processor. Now the largest customers design their own and buy the manufacturing, so the question became who can build it and who can package it. Those are completely different companies from the ones that used to win."
Director, Semiconductor and Advanced Computing Practice · MMA Technology Practice · September 2026

Market Trends

Largest Buyers Design Their Own Computing Silicon

Hyperscale operators and large device makers now design processors and accelerators for their own use, buying fabrication and packaging directly rather than purchasing finished chips from any supplier. That inverts a commercial relationship which held for a full four decades, turning the largest customers into designers who compete with their former suppliers on architecture while remaining customers of exactly the same foundries. Revenue does not disappear at all; it moves toward manufacturing and packaging, which is an entirely different business carrying different economics and considerably different margins attached to it.
Market Impact: Accelerators compound at 17.1%
Packaging Delivers Gains That Scaling No Longer Provides

Transistor scaling now returns rather less performance per generation than it used to, so improvement increasingly comes from how devices are assembled: chiplet partitioning, stacked memory and interconnect built at packaging rather than on the wafer itself. Advanced packaging now absorbs roughly 27% of the finished device cost, which is a remarkable figure for work that the industry historically treated as low value back-end assembly. Competitive advantage has consequently moved toward assembly capability that a great many chip design companies simply do not own, control or have any access to.
Market Impact: India compounds at 19.6% yearly

Market Opportunities and Growth Drivers

Inference Deployment Follows Training At Larger Volumes

Machine learning training work originally built the whole accelerator market, and inference is the far larger volume opportunity, because every single deployed application runs it continuously rather than only once. AI accelerator and parallel compute logic consequently grows at 17.1% against 11.4% for the market as a whole. Inference silicon carries genuinely different requirements from any training silicon does, favouring efficiency per watt over absolute throughput, which opens real competitive space for suppliers who cannot match leading training performance but can win decisively on total operating cost instead of it.
Market Impact: Designs cost 580 million each

National Programmes Fund Design And Assembly Capability

India compounds at 19.6% annually, faster than any other market measured anywhere, on chip design centres and assembly and test capacity funded directly through national semiconductor programmes rather than emerging commercially. Design capability is comparatively affordable to establish, since foundry access can simply be purchased on the open market, and assembly capacity requires very much less capital than a USD 24 billion leading edge fabrication plant does. Several countries have now concluded that participating in packaging and design work is genuinely achievable where competing in leading node manufacturing plainly is not.
Market Impact: One segment drove 17.1% growth

Market Restraints and Challenges

Leading Node Economics Exclude Most Products Entirely

A single leading node design costs around USD 580 million and takes roughly 34 months from architecture freeze to volume, which means only products expecting enormous unit volume or extraordinary selling prices can possibly justify it. The root cause is that mask sets, verification and physical design complexity all rise steeply with each node. Commercially this narrows the leading edge down to a mere handful of product categories. Mitigation runs through chiplet reuse across product generations, and through the mature nodes where fully 58% of wafer starts already sit today.
Market Impact: Design costs reach 580 million

Accelerator Purchases Have Outrun Verified Demand

Enormous accelerator capacity has now been bought against workload demand that nobody has fully verified in production, and a digestion pause would slow this whole category considerably given how much of recent growth came from that single segment. The root cause is that buyers are provisioning for a capability whose eventual scale remains genuinely uncertain. Commercially this creates cycle risk considerably larger than the industry has faced before. Mitigation runs through inference workloads, which consume steadily rather than arriving in procurement waves, and through genuinely diversified product exposure across classes.
Market Impact: Packaging absorbs 27% of cost
4 additional market trends, 3 additional growth drivers, and 2 additional restraints and challenges are covered in the full report. Contact sales@marketmindsadvisory.com to access the complete intelligence.

Segment CAGR and Growth Architecture

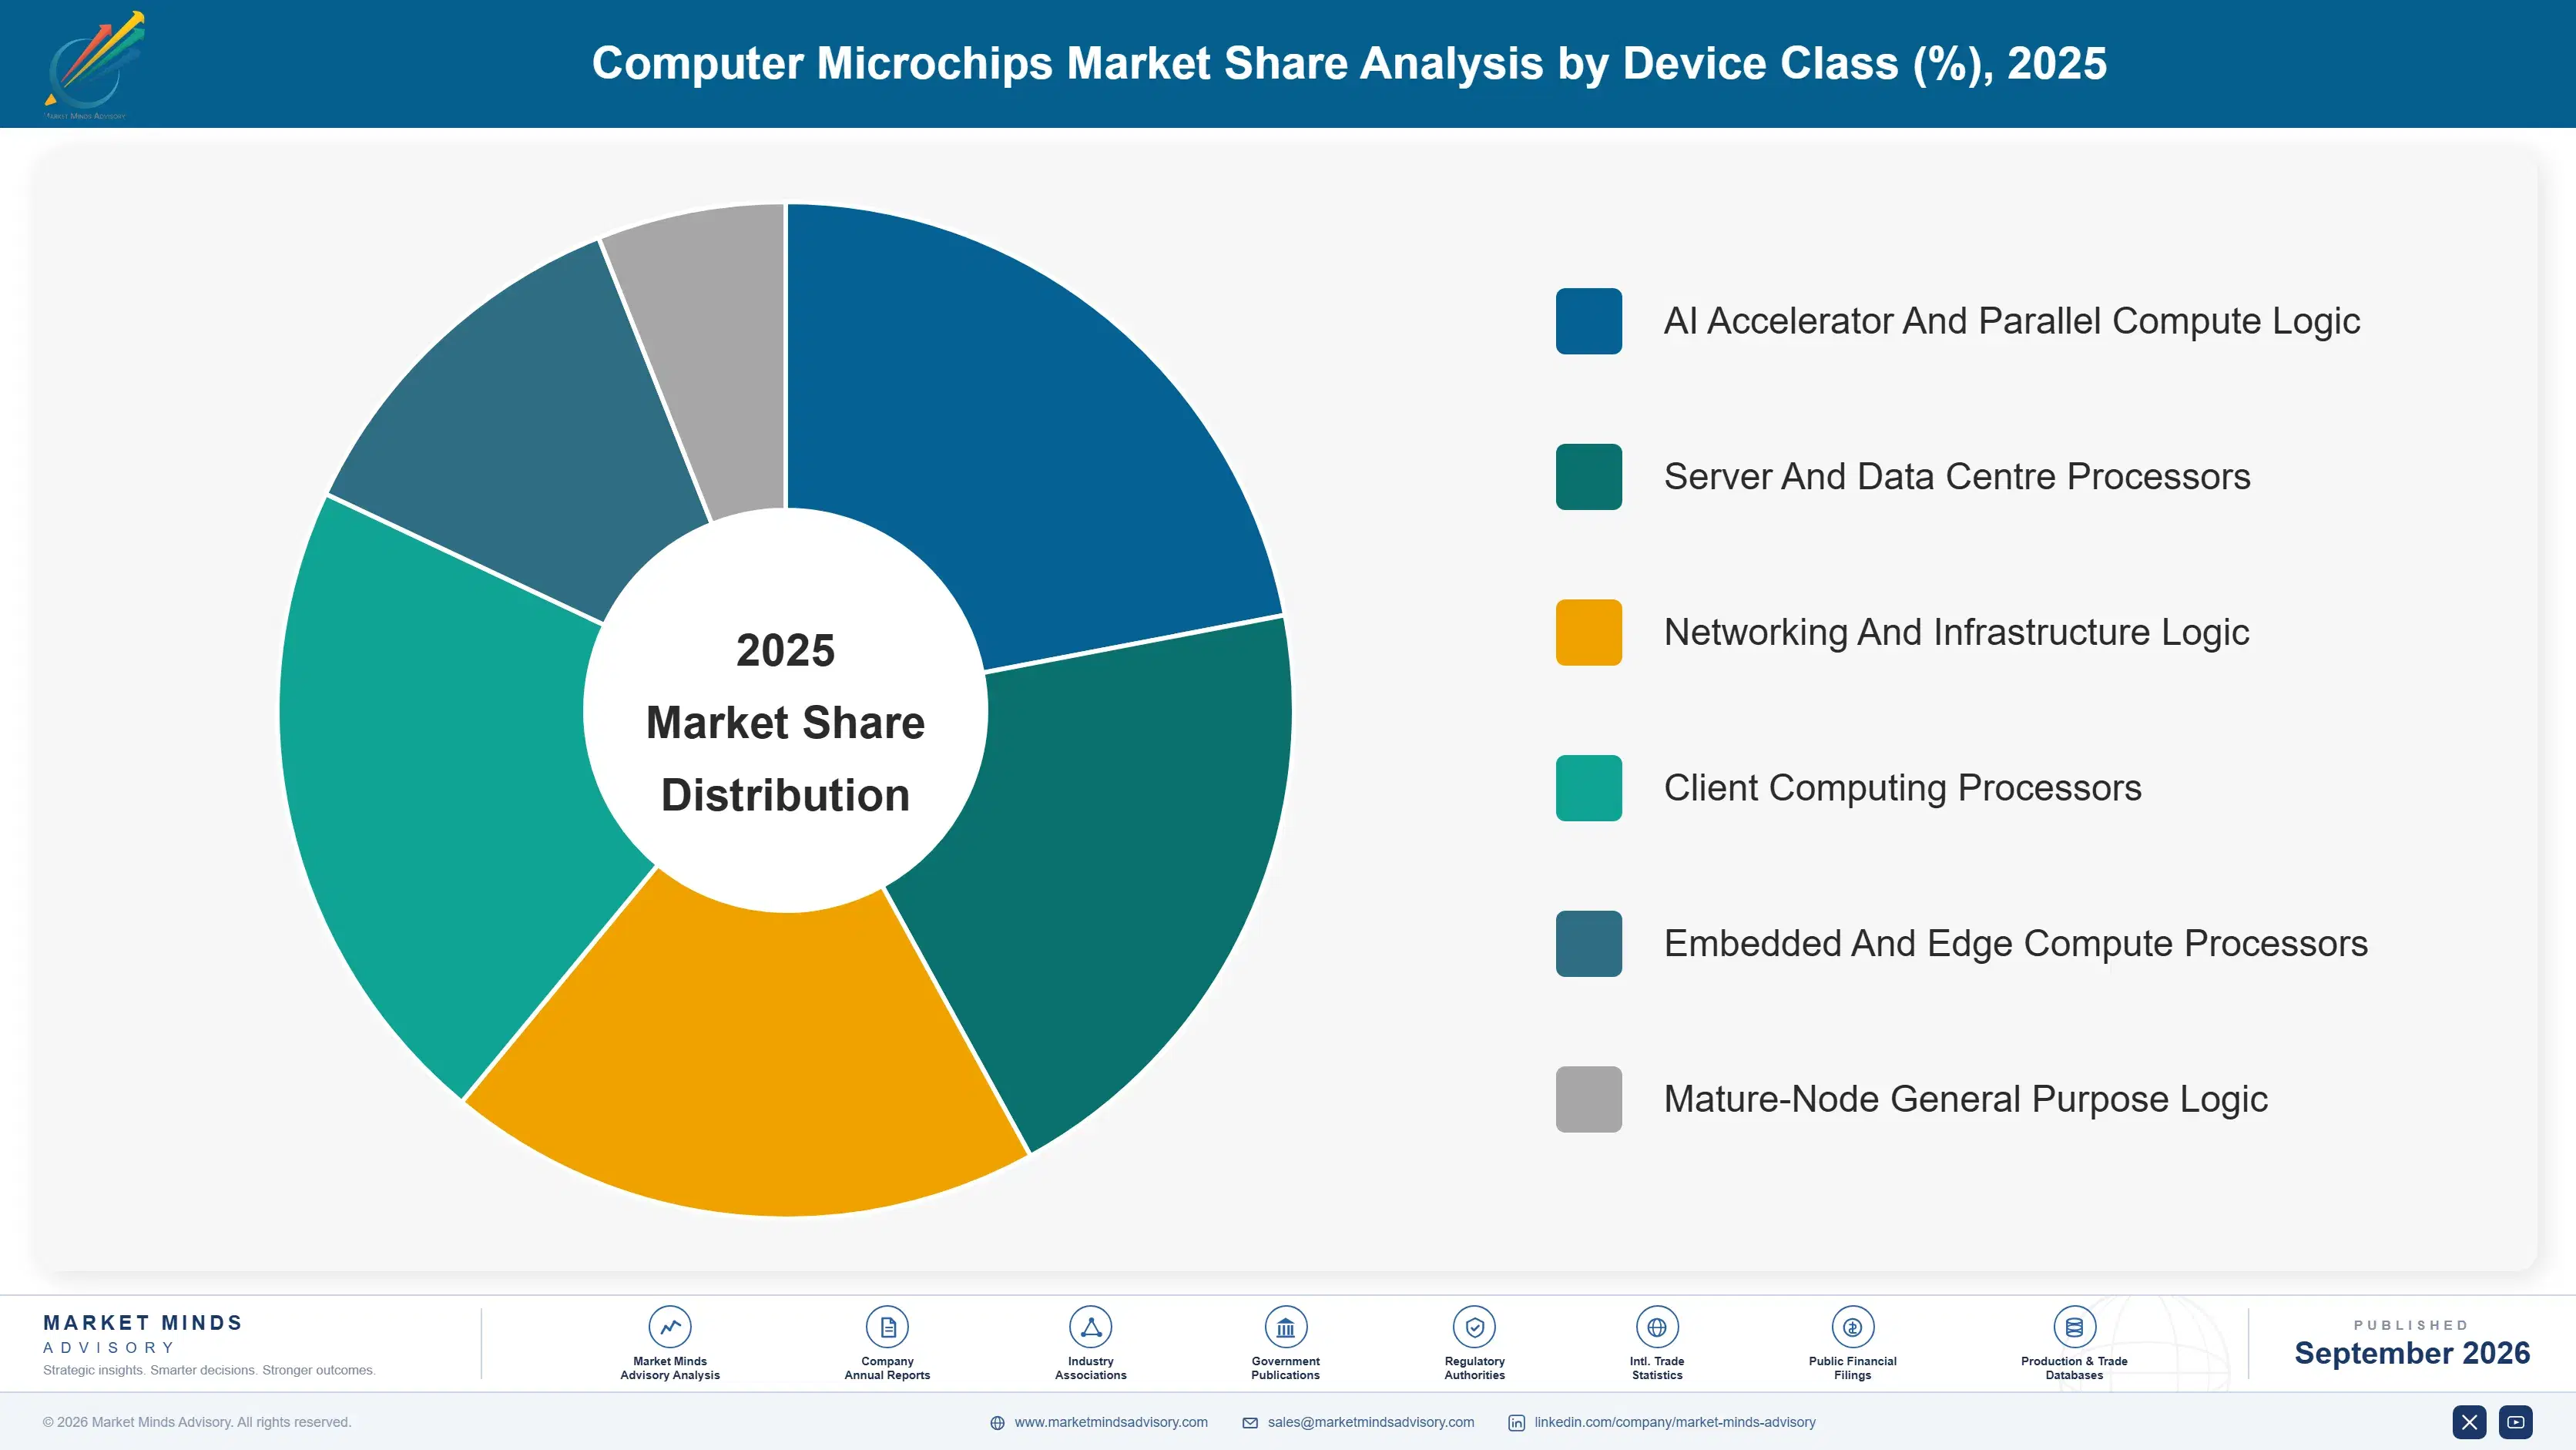
Segmentation follows device class, since each carries different node requirements, different design economics and a different buyer with quite different purchasing behaviour. Six classes cover the market, spanning accelerator logic, server processors, client processors, embedded compute, networking logic and mature-node general purpose devices. End-use industry and commercial supply route are separate dimensions handled elsewhere in this report.
computer-microchips-market-market-share-analysis-1789996436856

AI Accelerator And Parallel Compute Logic

AI accelerator and parallel compute logic grows at 17.1%, half again the market rate of 11.4%, on workloads that moved decisively toward parallel computation across every serious data centre operator worldwide. These are the products that genuinely justify leading node economics at around USD 580 million per design, because unit selling prices and shipped volumes are both extraordinary by any historical standard at all. The segment also carries the category's largest risk: purchases have run ahead of verified production demand, and a digestion pause would slow the whole market considerably. Inference deployment at far larger volumes than training is what turns this from a procurement wave into genuinely sustained consumption.
CAGR 17.1%

Server And Data Centre Processors

Server and data centre processors compound at 13.5% as capacity expands to host the workloads that accelerators execute, since an accelerator does not run without a host processor coordinating it. The competitive character changed fundamentally when the largest operators began designing their own, which converted several of the biggest customers into architectural competitors who nonetheless still buy manufacturing and packaging. Revenue therefore moves rather than disappearing, though it moves toward foundries and assembly providers rather than staying with the processor designer. Efficiency per watt increasingly decides selection, because data centre power availability now constrains deployment considerably more than capital does. Host processor volume consequently tracks accelerator deployment volume rather closely.
CAGR 13.5%
Full segment breakdown across 6 segments available in the complete report.

Regional Architecture and Country Demand Map

East Asia holds 44% of shipment revenue, far above the usual band ceiling, because the systems assembly consuming these chips and most of the leading node manufacturing capacity both sit there. North America follows at 26% on hyperscale demand and chip design authority combined together.

East Asia

East Asia takes 44% of global shipment revenue, far above the 30% band ceiling, because the systems assembly consuming these chips and virtually all of the leading node manufacturing both sit within the region. Taiwanese foundry capacity produces the great majority of leading node computing logic for customers headquartered somewhere else entirely. South Korean, Japanese and Chinese assembly operations then consume the resulting devices into finished computing systems. Chinese domestic logic design has expanded substantially under national programmes operating against export restrictions on leading node access. Growth at 12.6% sits above the global rate, and manufacture and consumption sitting together in one region is precisely what produces this degree of concentration.
Share: 44% | CAGR: 12.6% (2026 to 2036)

North America

Twenty-six percent of shipment revenue reaches North America, where hyperscale data centre demand and chip design authority both concentrate more heavily than anywhere else in the world. NVIDIA, Intel, AMD, Qualcomm and Broadcom all design here, and several of the largest buyers now design their own silicon alongside them. Manufacturing capacity is now being rebuilt under federal programmes, though leading node output still remains far below the level of regional design activity. Power availability rather than capital increasingly constrains data centre deployment across the region. Growth at 12.2% sits above the global rate on accelerator demand heavily concentrated in this region. Design authority located here exceeds regional manufacturing output very considerably indeed.
Share: 26% | CAGR: 12.2% (2026 to 2036)
Regional intelligence for 5 additional markets available in the complete report: Western Europe, South Asia and Pacific, Latin America, Middle East and Africa, Eastern Europe. Contact sales@marketmindsadvisory.com.
computer-microchips-market-country-cagr-analysis-1789996437415

Where Chip Advantage Now Lies

Leading node design costs have now narrowed the field to a mere handful of viable products, the largest customers have started designing their own silicon instead, and packaging delivers the performance gains that transistor scaling no longer provides. The four levers below follow those conditions rather than any argument about architecture or instruction sets.

Secure Packaging Capacity Alongside Wafer Supply

Advanced packaging now absorbs roughly 27% of finished device cost and delivers the performance gains that transistor scaling simply no longer provides at anything like the historical rate. Capacity for it has expanded far more slowly than wafer capacity has, and it queues first whenever demand rises sharply anywhere. Suppliers holding contracted packaging capacity are able to commit to delivery dates that their customers will build entire product roadmaps around. Those without any eventually discover that having wafers and having shippable product are two entirely different commercial positions to hold.
Market Impact: Packaging carries fully 27% of the device cost

Serve Customers Who Design Their Own Silicon

Hyperscale operators and large device makers designing their own processors remain enormous consumers of fabrication, packaging, intellectual property and design services, even while competing directly on architecture with the very suppliers they formerly bought from. Each of those design programmes costs around USD 580 million, and almost none of that money is ever spent internally on manufacturing. Treating those customers purely as lost accounts badly misreads what has actually happened here. Suppliers organised entirely around selling complete finished chips are effectively invisible to the fastest growing part of their own customer base.
Market Impact: Each design programme now costs 580 million dollars

Defend The Mature Node Volume Deliberately

Some 58% of all wafer starts still run on mature processes today, and a microcontroller inside a domestic appliance will simply never need a leading node however the industry chooses to talk about itself. That volume funds the fixed costs, keeps fabrication capacity utilised and generates steady reliable margin without any USD 580 million design programme sitting behind it. Suppliers treating mature nodes as a legacy business to be managed steadily downward are discarding exactly the volume foundation that makes any leading node investment survivable right through a full cycle.
Market Impact: Mature nodes hold fully 58% of wafer starts

Position Inference Against The Training Economics

Inference runs continuously inside every deployed application while training happens only periodically, which makes inference the far larger eventual volume, even though training work is what originally built this whole market. Inference silicon favours efficiency per watt over absolute throughput, since data centre power availability now constrains actual deployment a great deal more than available capital ever does. That opens up genuine competitive space for suppliers who cannot match the leading training performance, and accelerator logic grows at 17.1% overall, with inference eventually becoming much the larger share of that total.
Market Impact: Accelerator logic compounds at fully 17.1% each year

Who Controls the Margin Pool

Five suppliers hold 62% of computing logic shipment revenue, concentrated among firms designing at the leading node where a single product costs around USD 580 million to develop. NVIDIA, Intel, AMD, Qualcomm and Broadcom lead the field on that combined basis. All participants here are assessed on computing logic chip shipment revenue rather than on any broader semiconductor business they also operate across other device categories.
Competition now runs on manufacturing and packaging access considerably more than on architecture itself, because the largest customers design their own silicon and simply buy the fabrication they need. The second dimension is efficiency per watt rather than absolute peak performance, since data centre power availability now constrains deployment considerably more than capital does, and operators evaluate accordingly across every accelerator purchase they make.

Pressure comes from customers who have become designers themselves, and from the foundry and assembly providers steadily capturing value that chip designers previously held for themselves. Rankings shift wherever packaging capacity has actually been contracted rather than where architecture is being developed, particularly as chiplet approaches keep spreading across more product categories and more suppliers.
computer-microchips-market-company-positioning-matrix-1789996437941

Competitive Moat and Risk Dimensions

NVIDIA

Moat: Software And Developer Depth

NVIDIA holds a software and developer position accumulated over many years, which means workloads are written against its platform before any hardware selection happens. That is considerably harder to attack than any silicon advantage, because displacing it requires customers to rewrite work that already functions correctly. Competitors offering better hardware still face migration costs most customers will not accept.
NVIDIA

Risk: Customer Design Competition

The largest customers now design their own accelerators, and they hold both the workload knowledge and the volume to justify USD 580 million design programmes themselves. Those are exactly the buyers generating most of the current revenue. Software depth slows that transition considerably and does not stop a customer determined to control its own silicon roadmap.
BROADCOM

Moat: Custom Silicon Partnership Position

Broadcom builds custom logic for customers designing their own silicon, which places the company on the side of the transition that is growing rather than the side being displaced. That work requires design services capability, packaging expertise and foundry relationships together, which very few organisations hold in combination. It also generates revenue from exactly the customers other suppliers are losing.
BROADCOM

Risk: Customer Concentration Exposure

Custom silicon work concentrates among a small number of very large customers, each capable of bringing more design work in house as their own teams mature and grow. Those relationships are commercially deep and numerically few. A single customer deciding to internalise more of the work removes revenue that no broad market position replaces quickly.

Players Tracked

Prominent Players

NVIDIA
Intel
AMD
Qualcomm
Broadcom

Other Key Players

Apple
MediaTek
Texas Instruments
Marvell Technology
Ampere Computing
Renesas Electronics
NXP Semiconductors
Infineon Technologies
STMicroelectronics
Microchip Technology
Analog Devices
Rockchip Electronics
Loongson Technology
Alchip Technologies
Socionext

Recent Developments

MAY 2025

Advanced Packaging Capacity Expands Across Asian Assembly Sites

Foundry and assembly providers expanded advanced packaging capacity across Asian sites serving accelerator and server logic customers, organic capacity expansion rather than any corporate transaction. Packaging absorbs roughly 27% of finished device cost and queues ahead of wafer capacity when demand rises, making it the binding delivery constraint industry wide.
Signal: Having wafers and having genuinely shippable product are entirely different positions once the packaging capacity queues.
NOVEMBER 2024

Hyperscale Operators Extend Custom Silicon Design Programmes

Several hyperscale data centre operators extended internal silicon design programmes covering accelerators and server processors, capability development rather than any acquisition. Those operators remain enormous consumers of fabrication, packaging and design services while competing on architecture with the suppliers they previously bought finished devices from directly.
Signal: A customer who designs its own silicon is still a customer, just of an entirely different thing.
AUGUST 2025

Indian Programmes Fund Design Centres And Assembly Capacity

Indian national semiconductor programmes funded chip design centres and assembly and test capacity across several locations, a policy development rather than any commercial transaction. Design capability is affordable to establish because foundry access can be purchased, while assembly requires far less capital than a leading node fabrication facility needs.
Signal: Countries priced out of leading node fabrication can still participate through design and assembly work instead.

What A Computing Chip Costs

Wafer fabrication accounts for roughly 41% of finished device cost at the leading node, purchased from a very small group of foundries with the required capability. Advanced packaging and assembly absorb around 27%, which is unusually high and reflects where performance gains now originate. Design amortisation takes about 18% across expected volumes, and test with qualification absorbs most of the remaining balance.
Leading node wafer pricing rose substantially through 2023 and 2024 as accelerator demand competed for capacity that expands only on multi-year construction timelines. NVIDIA Annual Report 2024 and Intel Annual Report 2024 both record foundry cost and capacity access as principal operating variables across the period. Suppliers holding long-term wafer and packaging agreements managed the situation considerably better than those buying capacity as demand arrived.

The competitive disadvantage mechanism is packaging access rather than wafer price. A supplier with contracted advanced packaging capacity can convert wafers into shippable product on a schedule customers plan around, while one holding wafers alone cannot ship anything at all. Exposure concentrates among suppliers who secured foundry allocation without matching packaging capacity, which is a mistake the industry made repeatedly through the recent accelerator cycle.
computer-microchips-market-cost-volatility-analysis-1789996438141

Contract Packaging Capacity Alongside Every Wafer Agreement

Advanced packaging absorbs roughly 27% of device cost and queues ahead of wafer capacity whenever demand rises sharply. Contracting both together lets a supplier commit to delivery dates that customers can build product roadmaps around. Suppliers securing foundry allocation without matching packaging capacity hold wafers they cannot convert into anything shippable, which is a position several found themselves in recently.

Reuse Chiplet Blocks Across Product Generations

A leading node design costs around USD 580 million and takes roughly 34 months to reach volume, which very few products can justify on their own. Partitioning designs into chiplets that carry across generations spreads that expense across considerably more revenue. The discipline is architectural rather than financial, and must be decided at the outset.

Keep Mature Node Volume Loading Fixed Capacity

Some 58% of wafer starts run on mature processes, and that volume covers fixed costs while leading node programmes consume capital. Suppliers managing mature node business downward as a legacy category remove the earnings base that makes leading node investment survivable across a full cycle. It is unglamorous revenue and it is what funds the interesting work when demand turns.

Portfolio Architecture for Margin Defence

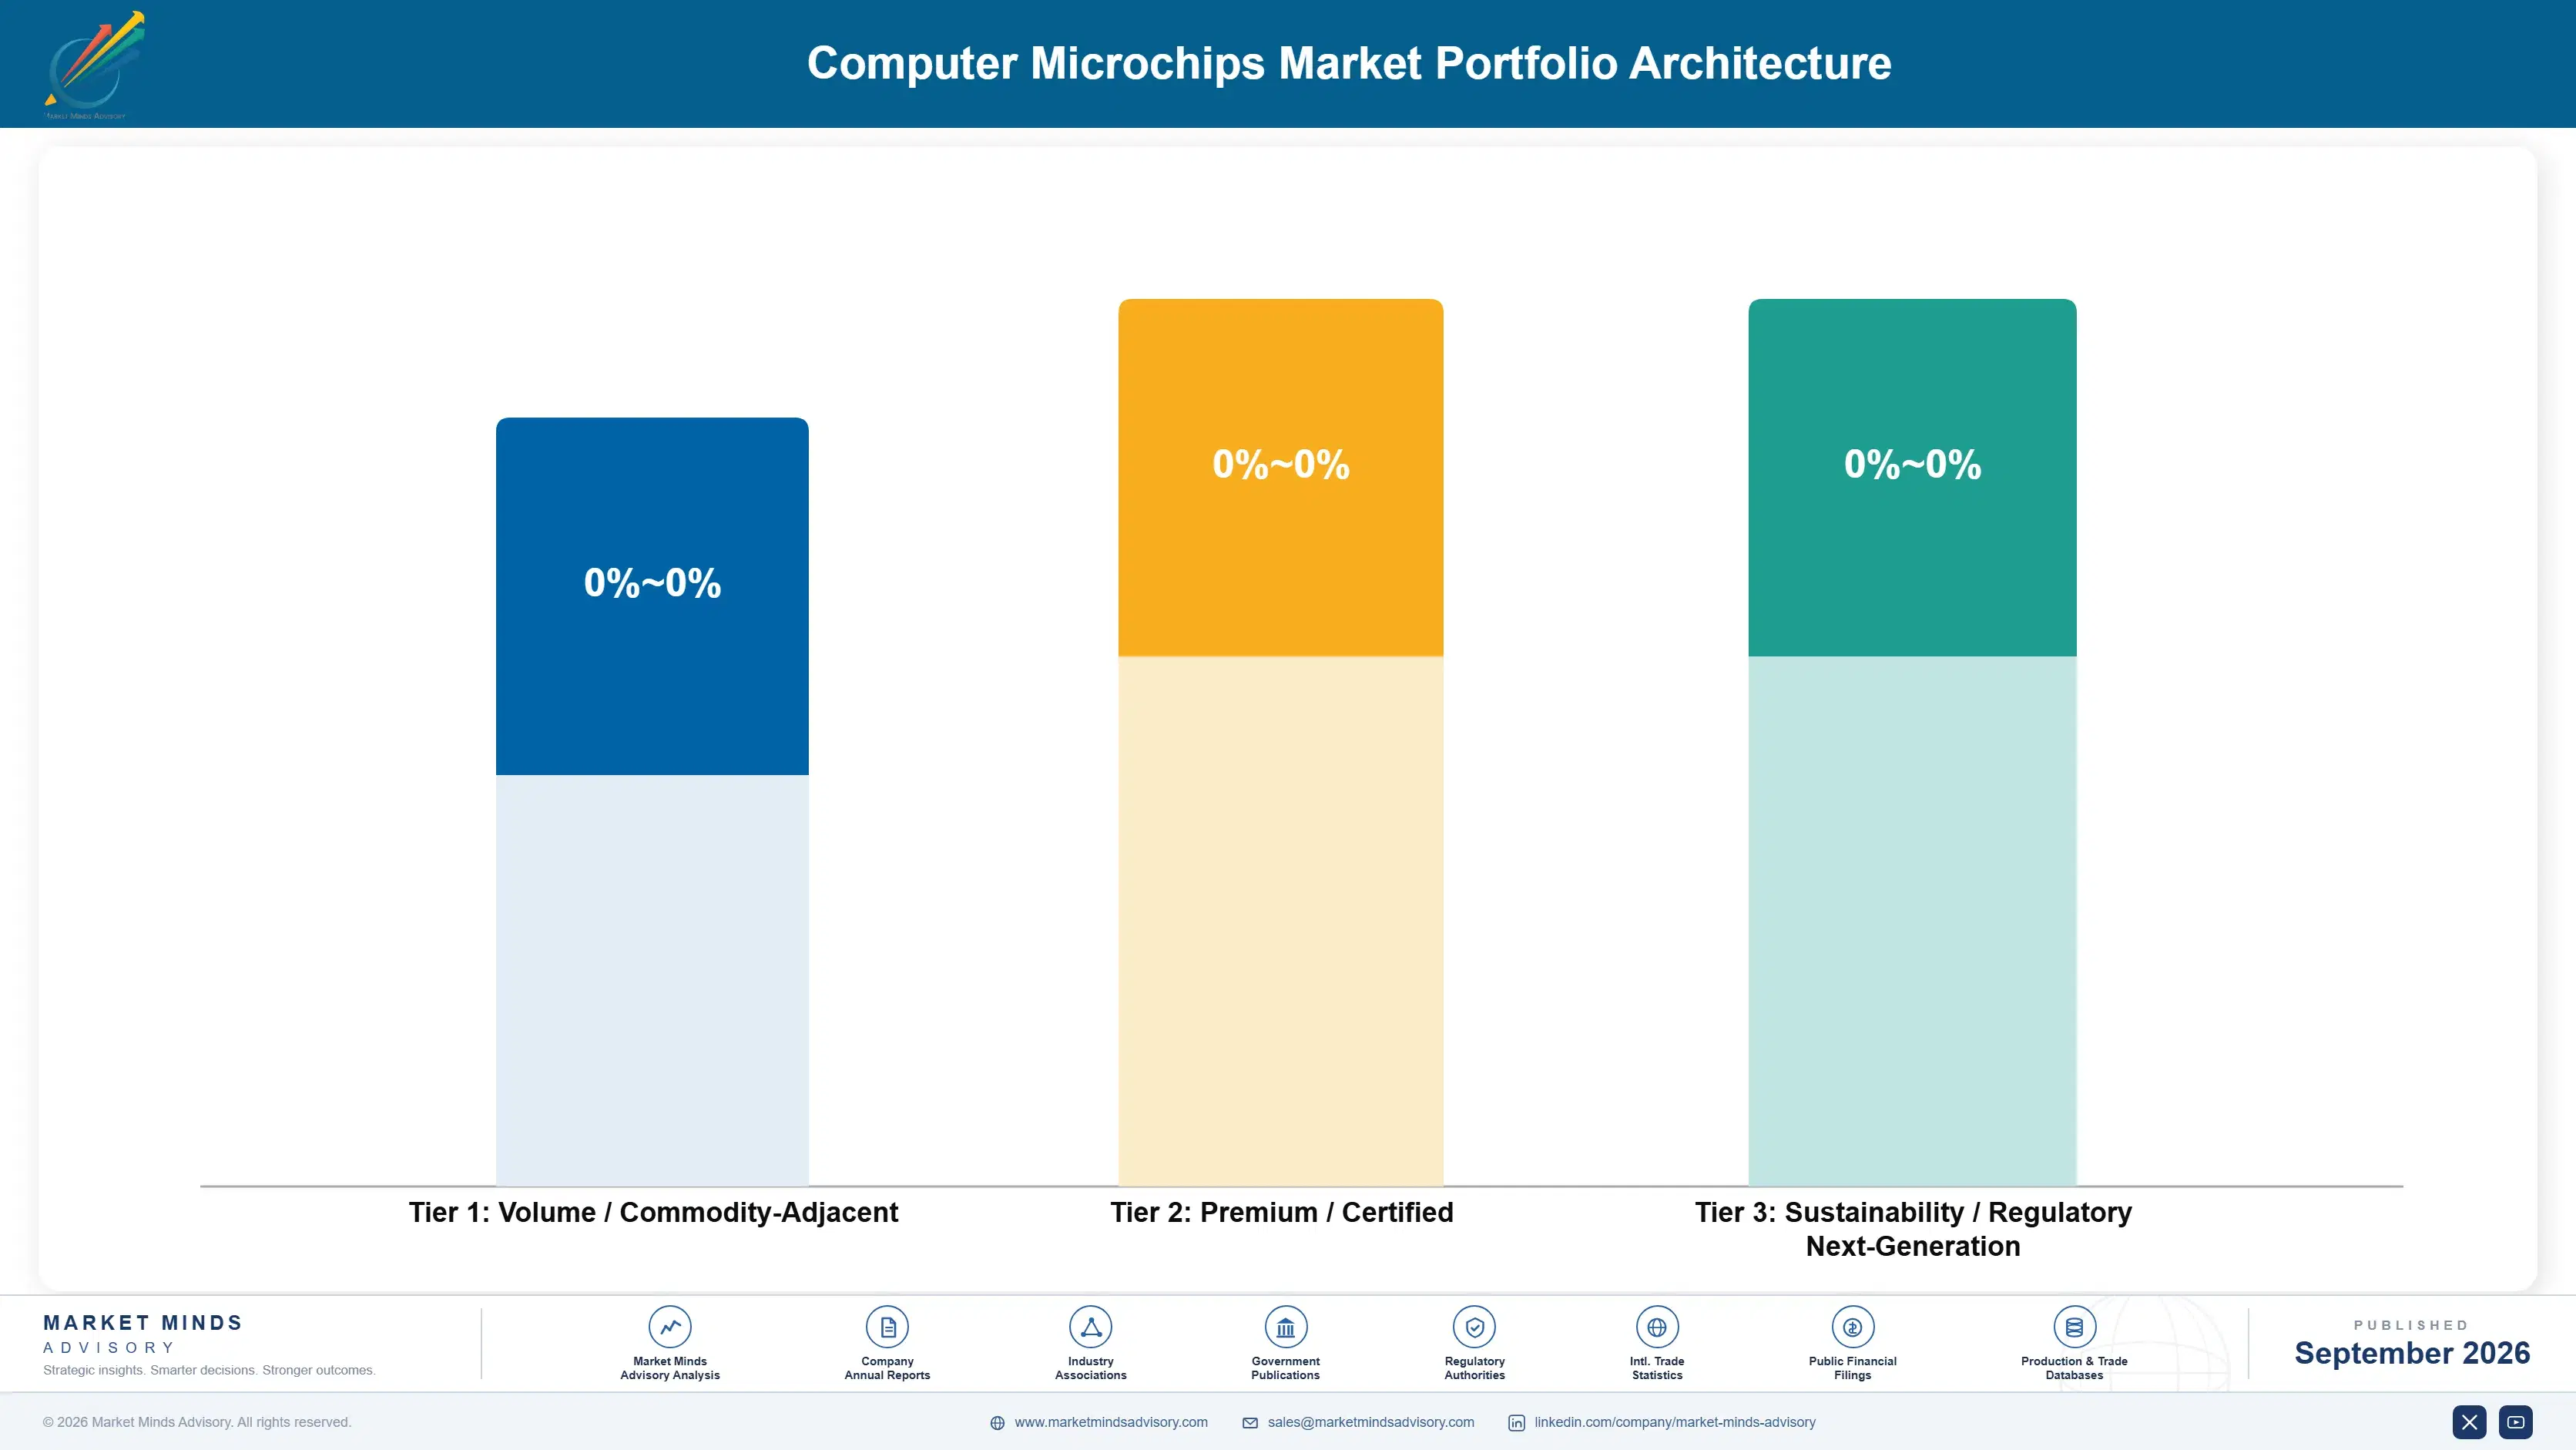
Margin architecture separates on node position and software attachment. Mature-node general purpose logic earns least, competing on price where many suppliers can produce equivalent devices. Embedded and client processors sit above on integration content. Accelerator logic, server processors and custom silicon design services earn most, because each combines leading node scarcity with either software depth or customer partnership that competitors cannot readily replicate.
The volume versus premium tension runs between mature and leading nodes, and the two fund each other whether or not management admits it. Mature node volume covers fixed costs and generates steady margin. Leading node products consume USD 580 million design programmes and deliver the growth. Suppliers abandoning mature nodes to concentrate on the leading edge remove the earnings stability that carries them through a demand pause.

High-value pools concentrate in accelerator logic and in custom silicon partnership work, and neither is reached through design capability alone. Accelerator positions depend on software depth accumulated over years. Custom silicon work requires design services, packaging expertise and foundry relationships together. Both take years to assemble, which is why the same firms keep holding these positions across successive technology transitions.

Volume / Commodity-Adjacent

Mature-node general purpose logic and standard microcontrollers, competing largely on price where many capable suppliers can produce broadly equivalent devices. The twelve point spread separates suppliers running fully utilised mature capacity from those carrying fixed costs across declining volume.
Gross Margin: 26% to 38%

Premium / Certified

Client computing processors, embedded compute and networking infrastructure logic, where integration content and platform position determine selection alongside performance. The fourteen point spread tracks node access and packaging capacity, both of which vary considerably between the largest suppliers and everybody else.
Gross Margin: 42% to 56%

Sustainability / Regulatory / Next-Generation

AI accelerator logic, server processors and custom silicon partnership work, combining leading node scarcity with software depth or customer partnership competitors cannot readily replicate. The twenty point spread reflects software attachment, which differs enormously across this layer and explains most earnings dispersion.
Gross Margin: 58% to 78%
computer-microchips-market-portfolio-architecture-1789996438640

High-value Sub-segments and Strategic Watch-out

AI Accelerator And Parallel Compute Logic

Grows at fully 17.1% on workloads that moved decisively toward parallel computation across every serious data centre operator worldwide. The twenty point spread here reflects platform software depth. Purchases have run some way ahead of verified production demand, which remains this segment's principal downside risk.
Gross Margin: 58% to 78%

Server And Data Centre Processors

Grows at fully 13.5% as host processor capacity keeps expanding to coordinate the accelerators actually executing the workloads. The twenty point spread here reflects the customer design competition. Efficiency per watt increasingly decides selection, since power availability now constrains deployment considerably more than capital does.
Gross Margin: 58% to 78%

Networking And Infrastructure Logic

Grows at only 9.8% as data centre interconnect requirements keep rising alongside compute density inside every single rack deployed. The fourteen point spread here reflects advanced packaging capacity access. Bandwidth between accelerators now constrains overall system performance quite as much as the accelerators themselves do.
Gross Margin: 42% to 56%

Mature-Node General Purpose Logic

Grows at 2.8%, slowest of the six device classes, on established processes carrying 58% of wafer starts and likely to keep carrying them. The twelve point spread here reflects fabrication capacity utilisation. This remains the volume foundation funding leading node investment right through any cycle.
Gross Margin: 26% to 38%

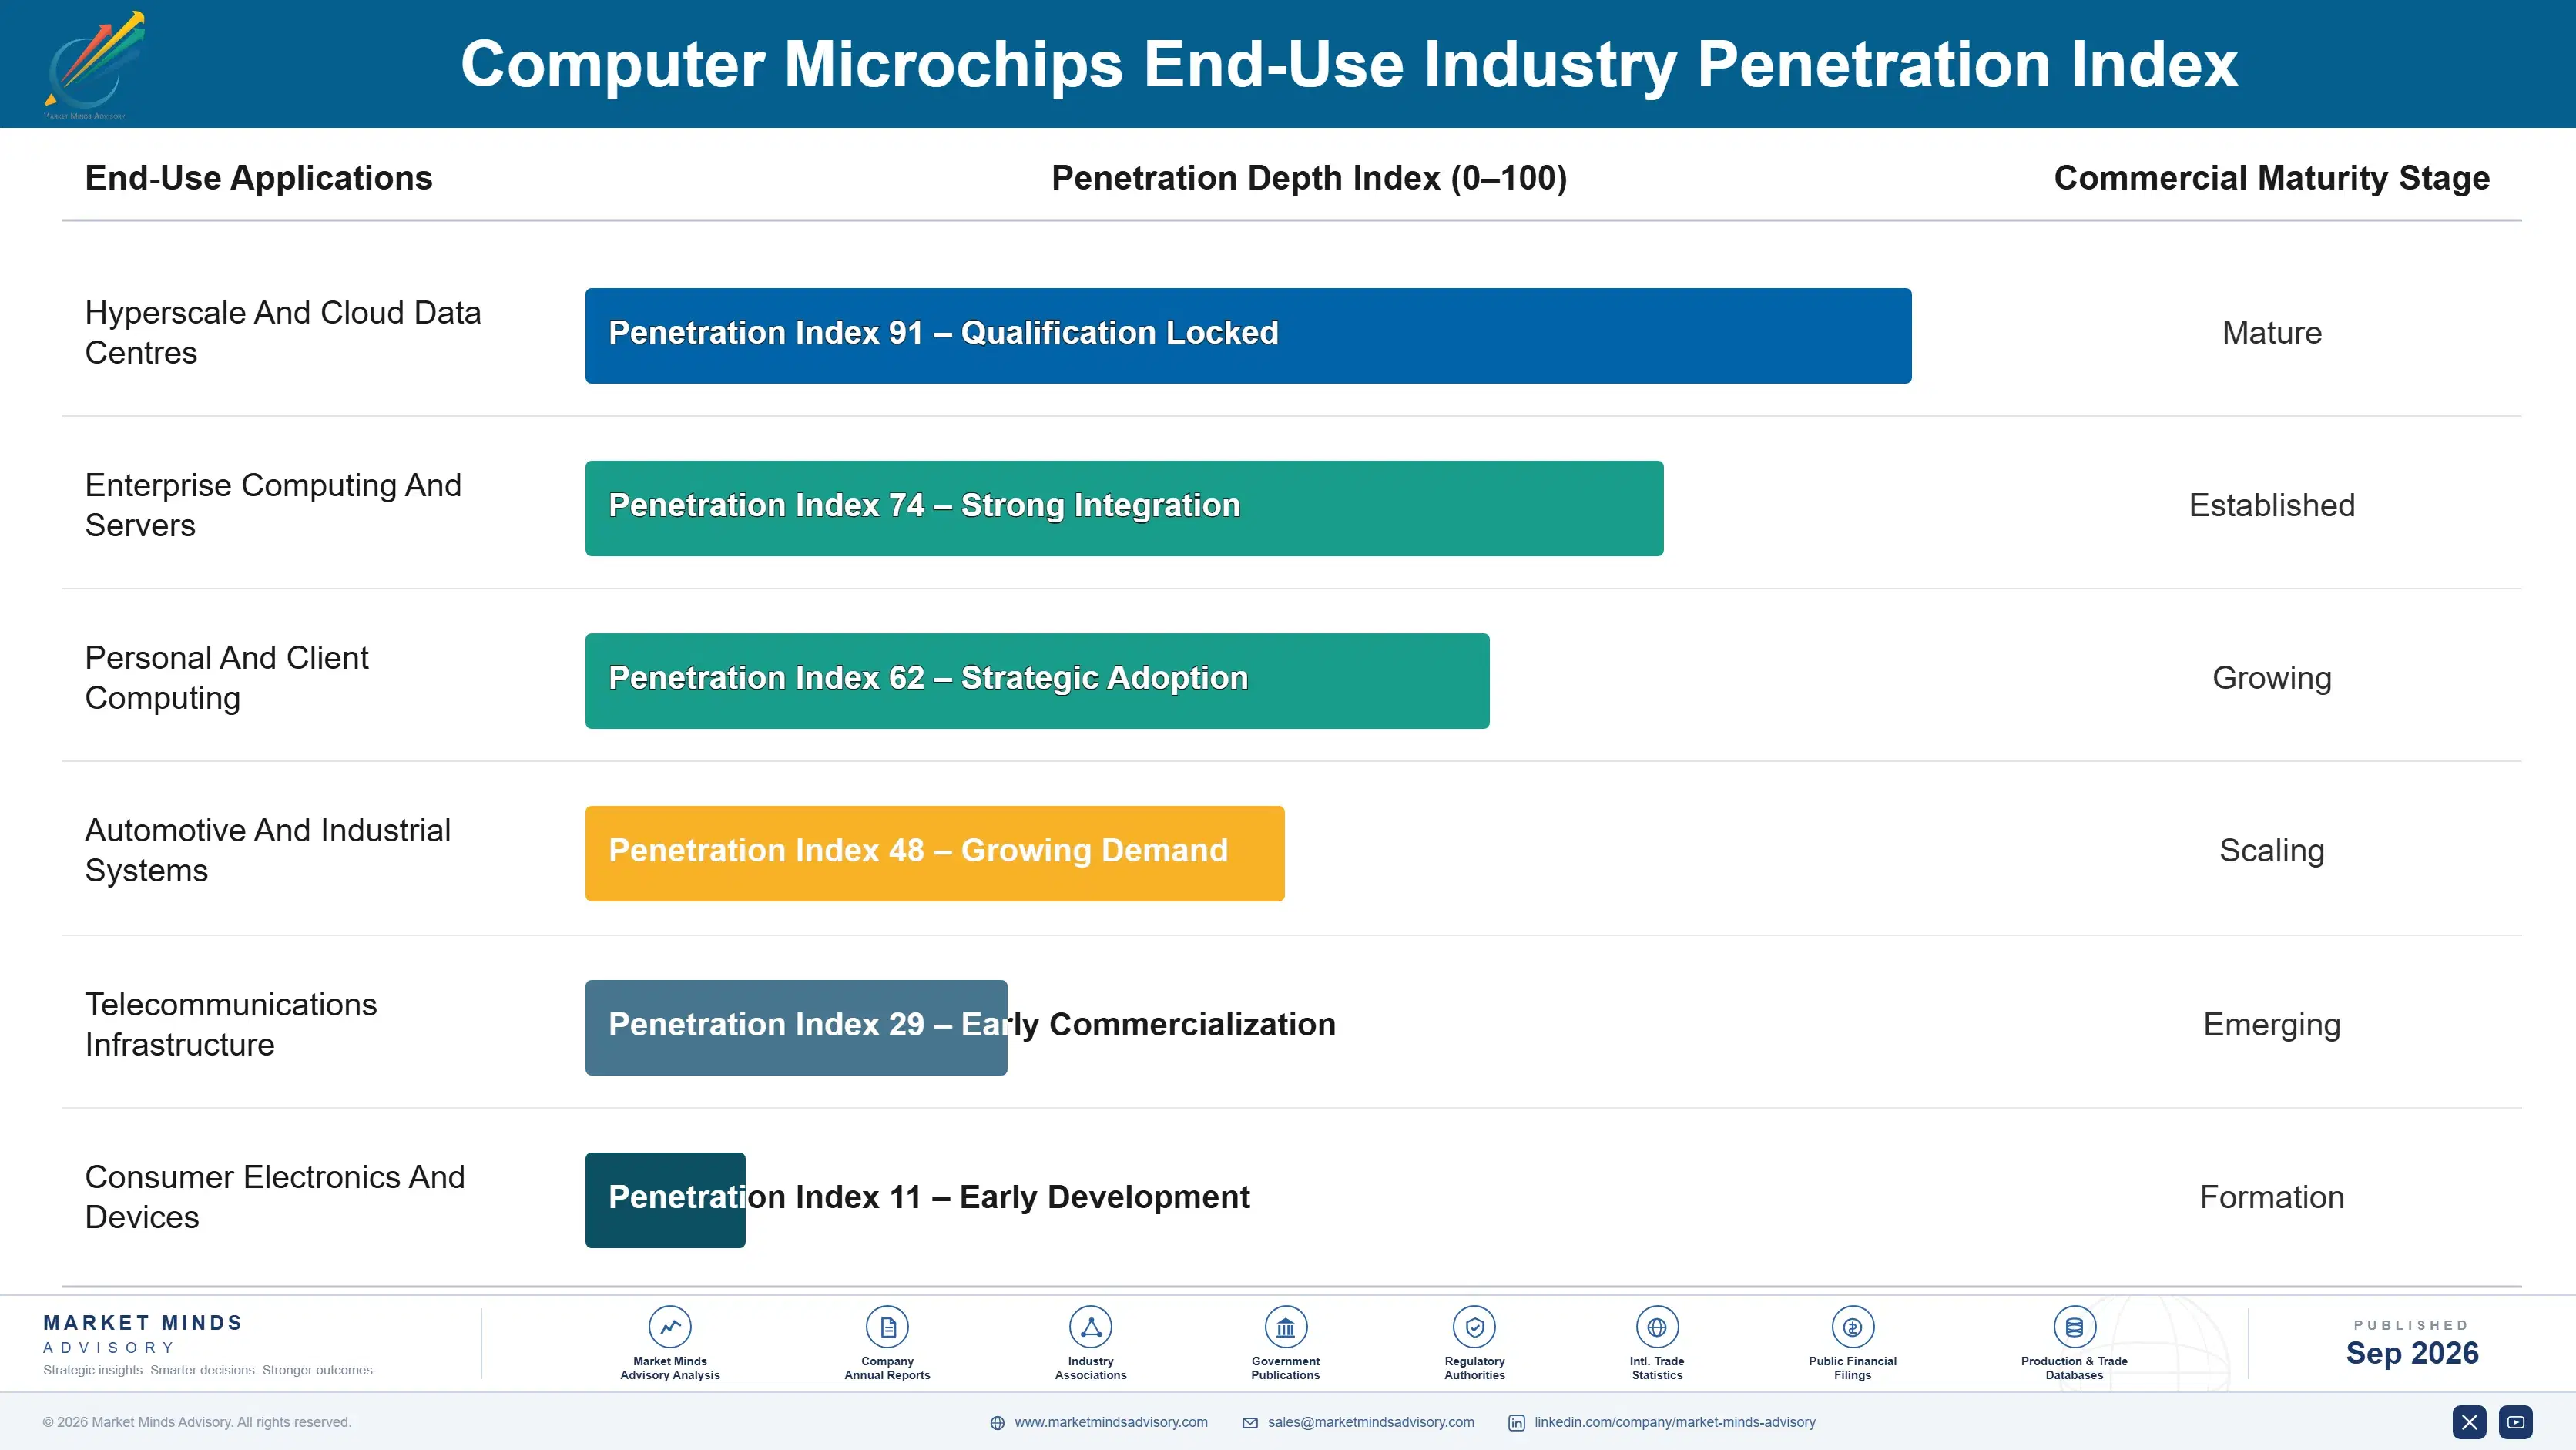
Why Silicon Choices Persist

The annuity here lives in the software rather than in the silicon. Workloads are written against a particular platform and optimised for it over years, so moving them means rewriting work that already functions correctly for no gain the customer can point to. Product generations turn over every two to three years, and each turnover favours whatever the software already targets. A supplier holding that developer position sells into a preference it built.
Depth varies sharply by device class and by who wrote the software. An accelerator platform with years of optimised workloads behind it is deeply entrenched. A server processor meeting a standard instruction set is far more substitutable, which is precisely why large customers found designing their own feasible. Embedded processors sit between the two, held by development tooling and long product lifetimes rather than by any performance advantage at all.

The buyer has changed more fundamentally here than in almost any technology category. A systems maker once selected chips against a specification and a price alone. A hyperscale operator now designs its own and buys fabrication and packaging instead. Suppliers organised entirely around selling finished devices to systems makers address a shrinking part of a growing market.
computer-microchips-market-end-use-penetration-index-1789996439132

What Decides Silicon Position

These are among the four positions where our research anticipates prominent divergence between winners and laggards over the coming forecast period. Each is grounded in the demand model, the regulatory perimeter, and the announced capacity pipeline.
01 / PACKAGING CAPACITY ACCESS

Wafers Without Packaging Ship Nothing

Advanced packaging now absorbs roughly 27% of finished device cost and delivers the performance gains that transistor scaling no longer provides at anything like the historical rate. Capacity for it has expanded far more slowly than wafer capacity has, and it queues up first whenever demand rises sharply anywhere across the whole industry. Suppliers who secured foundry allocation without matching packaging capacity have discovered that holding wafers and holding genuinely shippable product are entirely different commercial positions to be in.
02 / CUSTOMER TRANSITION COVERAGE

Sell Manufacturing To Former Chip Buyers

Hyperscale operators and large device makers designing their own processors all remain enormous consumers of fabrication, packaging, intellectual property and design services, even while competing directly on architecture against the very suppliers they used to buy their finished devices from. Treating them purely as lost accounts fundamentally misreads what has actually happened across this industry. The revenue simply moved rather than disappearing anywhere, and reaching it now means selling manufacturing access, packaging and design services rather than any finished devices.
03 / MATURE NODE DISCIPLINE

Keep The Unglamorous Volume Running

Some 58% of all wafer starts still run on mature processes, and a microcontroller inside a domestic appliance will simply never need a leading node however the industry chooses to talk about itself. That volume funds fixed costs, keeps fabrication capacity utilised and generates steady reliable margin without any USD 580 million design programme sitting behind it. Suppliers managing mature nodes steadily downward as a legacy business are discarding exactly what makes leading node investment survivable through any demand pause.
04 / INFERENCE MARKET POSITIONING

Efficiency Per Watt Beats Peak Throughput

Inference runs continuously inside every single deployed application, while training work happens only periodically, which makes inference the far larger eventual volume, even though training work is what originally built this whole market in the first place. Inference silicon strongly favours efficiency per watt over absolute throughput, since data centre power availability now constrains deployment considerably more than capital does. That opens genuine competitive space for suppliers who cannot match leading training performance at all but can win decisively on operating cost instead.

Engagement Snapshot From the Field

A live engagement with an industry participant carrying material or product regulatory and market exposure ahead of a defining policy shift, showing how our research translates into a defensible multi-year portfolio strategy.
MARKET MINDS ADVISORY · CLIENT ENGAGEMENT SUMMARY
Computer Microchips Producer Strategic Portfolio Review and Transition Roadmap 2026·Investment Scenario on Computer Microchips Exposure Evaluation 2025-26
CLIENT PROFILE
A systems integration provider building server and accelerator systems for enterprise and research customers, facing delivery slippage on committed orders across three consecutive quarters. Wafer allocation had been secured with two suppliers, yet finished systems still failed to arrive on schedule, and nobody internally had established where in the chain the actual delay was occurring.
STRATEGIC CHALLENGE
Procurement believed the constraint was foundry capacity and wanted to secure additional wafer allocation at premium pricing. Engineering suspected something downstream but could not identify it precisely. Meanwhile customers were cancelling orders, and a further large allocation commitment was scheduled for board approval within the quarter without any of this being resolved.
MMA APPROACH
MMA traced elapsed time across every stage from wafer start through packaging, test and system assembly on the delayed orders. We separated foundry scheduling from packaging queueing, and assessed which of the client's suppliers held contracted packaging capacity as against spot access. Work drew on 47 expert interviews conducted in Q4 2025 with suppliers, foundries and assembly providers across the industry.
KEY FINDINGS
  1. Every one of the delayed orders had queued at advanced packaging rather than at the wafer foundry, which internal reporting had never separated out at all.
  2. Only 1 of the client's two suppliers held contracted advanced packaging capacity, and that supplier had delivered broadly on schedule throughout the whole period.
  3. Additional wafer allocation would have worsened the position by adding inventory the client could not convert into shippable systems (client-reported, unverified by MMA).
  4. Packaging accounted for roughly a quarter of device cost yet had never appeared as a separate line in any supplier evaluation the client conducted.
CLIENT PROFILE
A systems integration provider building server and accelerator systems for enterprise and research customers, facing delivery slippage on committed orders across three consecutive quarters. Wafer allocation had been secured with two suppliers, yet finished systems still failed to arrive on schedule, and nobody internally had established where in the chain the actual delay was occurring.
STRATEGIC CHALLENGE
Procurement believed the constraint was foundry capacity and wanted to secure additional wafer allocation at premium pricing. Engineering suspected something downstream but could not identify it precisely. Meanwhile customers were cancelling orders, and a further large allocation commitment was scheduled for board approval within the quarter without any of this being resolved.
MMA APPROACH
MMA traced elapsed time across every stage from wafer start through packaging, test and system assembly on the delayed orders. We separated foundry scheduling from packaging queueing, and assessed which of the client's suppliers held contracted packaging capacity as against spot access. Work drew on 47 expert interviews conducted in Q4 2025 with suppliers, foundries and assembly providers across the industry.
KEY FINDINGS
  1. Every one of the delayed orders had queued at advanced packaging rather than at the wafer foundry, which internal reporting had never separated out at all.
  2. Only 1 of the client's two suppliers held contracted advanced packaging capacity, and that supplier had delivered broadly on schedule throughout the whole period.
  3. Additional wafer allocation would have worsened the position by adding inventory the client could not convert into shippable systems (client-reported, unverified by MMA).
  4. Packaging accounted for roughly a quarter of device cost yet had never appeared as a separate line in any supplier evaluation the client conducted.
RECOMMENDED STRATEGY
Phase 1: Phase one: cancel the additional wafer allocation commitment, since the constraint sat entirely at packaging rather than anywhere in wafer supply. Phase 2: Phase two: weight supplier selection on contracted packaging capacity rather than on foundry relationships alone, which had proved a poor predictor. Phase 3: Phase three: report elapsed time separately for fabrication, packaging and test, since combined reporting had concealed the constraint for three quarters.
OUTCOME
The provider cancelled the wafer commitment and shifted volume toward the supplier holding contracted packaging capacity (client-reported, unverified by MMA). Delivery against committed orders improved measurably within two quarters. Packaging capacity is now assessed explicitly in every supplier evaluation, which is the change that outlasted the engagement itself.

Frequently Asked Questions

Foundational context covering the market sizes, CAGR, scope, country, region and competition that inform every finding below. This section is provided to cover basics and most often pre-purchase conversations, answered from the MMA Primary Research Dataset.

What is the current size of the Computer Microchips Market?

Global value reaches USD 329.7 billion in 2026, measured as computing logic chip shipment revenue across six device classes. The 2025 base is USD 296.0 billion.

How large will the Computer Microchips Market be by 2036?

The market reaches USD 970.4 billion by 2036, an increase of USD 640.7 billion across the forecast period. That represents 2.94 times expansion from the 2026 base.

What is the CAGR for the Computer Microchips Market 2026 to 2036?

The base case runs at 11.4% annually, with a bull case at 12.7% if inference deployment scales faster than planned and a bear case at 10.1% if accelerator purchases pause for capital digestion.

Which segment is growing fastest?

AI accelerator and parallel compute logic grows at 17.1%, half again the market rate of 11.4%. Workloads moved decisively toward parallel computation across every serious data centre operator.

Who are the major companies in the Computer Microchips Market?

NVIDIA, Intel, AMD, Qualcomm and Broadcom lead on computing logic shipment revenue, together holding 62%. Apple, MediaTek and Marvell Technology hold smaller or captive positions.

Which country is growing fastest?

India leads at 19.6%, on design centres and assembly capacity funded through national semiconductor programmes rather than emerging commercially. Vietnam and Malaysia follow behind it.

Report Segmentation Architecture

The full report scope spans multiple orthogonal segmentation dimensions, with cross-tabulated demand data provided for each dimension pair. Coverage extends further to regional breakdowns, trend trajectories, and the competitive detail needed to support segment-level decision-making.

By Device Class

  • AI Accelerator And Parallel Compute Logic
  • Server And Data Centre Processors
  • Networking And Infrastructure Logic
  • Client Computing Processors
  • Embedded And Edge Compute Processors
  • Mature-Node General Purpose Logic

By End-Use Industry

  • Hyperscale And Cloud Data Centres
  • Enterprise Computing And Servers
  • Personal And Client Computing
  • Automotive And Industrial Systems
  • Telecommunications Infrastructure
  • Consumer Electronics And Devices

By Commercial Dimension

  • Direct Supplier Sales To Systems Makers
  • Custom Silicon Design Partnership
  • Hyperscale Direct Procurement
  • Foundry And Assembly Services
  • Distributor And Channel Supply
  • Original Design Manufacturer Integration

By Region

  • North America
  • Western Europe
  • East Asia
  • South Asia and Pacific
  • Latin America
  • Middle East and Africa
  • Eastern Europe

Scope, Methodology, and Coverage

Every figure in this report is reproducible from documented input assumptions. The scope below maps the historical period, the forecast horizon, the segmentation dimensions, and the countries covered, alongside the underlying primary and qualitative methodology.
Historical Period
2020 to 2025
Forecast Period
2026 to 2036
Base Year
2025 (USD billions; MMA Primary Research Dataset, September 2026)
Market Definition
This report covers computing logic microchips by device class: AI accelerator and parallel compute logic, server and data centre processors, client computing processors, embedded and edge compute processors, networking and infrastructure logic, and mature-node general purpose logic. It excludes memory and storage devices, analogue and mixed-signal components, power semiconductors and discretes, image sensors, semiconductor manufacturing equipment, and design software or intellectual property licensing.
Quantitative Units
USD millions, chip shipment revenue basis; shipped units; leading node design cost in USD millions; wafer starts by node maturity as a percentage; packaging share of device cost; design to volume periods in months.
Segmentation Dimensions
Device class; end-use industry; commercial supply and design route; geography across seven regions.
Regions Covered
North America, Western Europe, East Asia, South Asia and Pacific, Latin America, Middle East and Africa, Eastern Europe
Countries Covered
Taiwan, South Korea, Japan, China, Singapore, Malaysia, India, Vietnam, Australia, United States, Canada, Mexico, Brazil, Germany, Netherlands, France, United Kingdom, Poland, Israel, Saudi Arabia.
Key Companies Profiled
NVIDIA, Intel, AMD, Qualcomm, Broadcom, Apple, MediaTek, Texas Instruments, Marvell Technology, Ampere Computing, Renesas Electronics, NXP Semiconductors, Microchip Technology, Alchip Technologies, Socionext.
Quantitative Methodology
Primary survey, n=3,800 respondents, Q4 2025, six countries; demand-side model with trade association cross-validation
Qualitative Methodology
47 expert interviews, Q4 2025; applied to validate demand model assumptions, identify emerging dynamics, and assess competitive positioning
Report Format
PDF and XLSX data workbook (Word format preview document)
Publisher
Market Minds Advisory
Report Code
MMA-2026-TEC-781
Published
September 2026
Contact
sales@marketmindsadvisory.com | www.marketmindsadvisory.com

Purchase the full Computer Microchips Market Report (2026 to 2036).

This report sizes the global computer microchips market from 2026 to 2036 across six device classes, six end-use industries and seven regions. It explains why leading node design costs near USD 580 million have narrowed the field to a handful of products while 58% of wafer starts still run on mature processes. Advanced packaging at roughly 27% of device cost is analysed as the constraint that decides who can actually ship, alongside the transition that turned the largest customers into silicon designers. Cost composition is sourced to company annual reports. Regional analysis explains why East Asia holds 44% of shipment revenue.
Six device classes sized through to 2036
Leading node design economics quantified against product viability
Advanced packaging assessed as the binding delivery constraint
Twenty named suppliers assessed on computing logic revenue
Four revenue levers with quantified commercial impact
Anonymised systems integrator sourcing engagement documented in full

Built For The People Who Decide

From boardroom strategy to bench-side execution, this report is read cover-to-cover by leaders shaping the next decade of their industry, turning demand scenarios, market dynamics and valuation benchmarks into decisions.
CXOs/ Presidents/ VPs/ Managers
M&A and Corporate Development
Strategy Teams and R&D Heads
Procurement and Product Directors
Regulatory and Compliance Leaders
Investor Relations and Equity Analysts