Market Minds Advisory
Computer Engineering Market

Computer Engineering Market: Computer Engineering: Verification Hours, Utilisation Economics and a Talent Constraint No Amount of Demand Can Solve

Every large technology buyer now wants custom silicon and none of them has the engineers, which makes this a headcount business dressed up as a technology one, priced by the hour.

Lead Analyst

Published

September 2026

Make Smarter Decisions with Customized Research Insights

Request a free sample report and evaluate market opportunities, growth trends, and competitive dynamics relevant to your business needs.

2025 MARKET VALUE$78.0BMarket Size 2025
2036 FORECAST VALUE$205.4BBase Case , 2026 to 2036
CAGR 2026 TO 20369.2 %Bull 10.4% / Bear 8.0%
INCREMENTAL OPPORTUNITY$120.2BNet 10- year value creation
EXPANSION MULTIPLE2.41x2036 value over 2026 base
Strategic Levers
M&A Pipeline
Regional Outlook
Country Rankings
Competitive Intelligence
Segmental Deep-dive
Call-Us : 91 93563 13602

Executive Snapshot and Market Trajectory.

Demand is not the constraint in computer engineering services and has not been for years. Engineers are. Verification alone absorbs roughly 58% of a chip project's hours, and it is the discipline nobody can hire fast enough at any rate anyone will pay. Capacity sets the growth rate.
Custom silicon design and verification grows at 13.8%, half again the market rate of 9.2%, because hyperscale operators, vehicle manufacturers and industrial firms all decided to build their own compute and none of them staffed for it. Embedded software and firmware follows at 11.0%. South Asia and Pacific takes 34% of value, since India holds the largest concentration of design engineers anywhere. Vehicle and industrial manufacturers are buying what they never built internally.
Concentration sits near 24% across the top five on measured engineering services revenue, the most fragmented picture in technology services. The economics are utilisation and rate, exactly like any professional services business, and buyers keep purchasing as though they were buying a product. Bench time between projects decides profitability far more reliably than pricing does. Attrition near 18% is the number that quietly governs everything else here.
Market Definition
This market covers outsourced engineering design and development services for computing hardware and embedded systems, spanning custom silicon design and verification, embedded software and firmware engineering, board and system hardware design, physical design and implementation services, test, validation and compliance engineering, and product lifecycle and sustaining engineering. Revenue is measured as engineering services value at supplier level, including fixed price and time-based delivery. Electronic design automation software licences, semiconductor intellectual property licensing, contract manufacturing, information technology outsourcing, and internal engineering headcount are excluded.
Base Year Value
$78.0B in 2025 (MMA Primary Research Dataset, September 2026)
Forecast Period
2026 to 2036, eleven discrete annual values
CAGR
9.2% base case. Bull 10.4%. Bear 8.0%.
Fastest Growth Segment
Custom Silicon Design and Verification: 13.8% CAGR
Fastest Growth Country
India: 12.4% CAGR
Fastest Growth Region
South Asia and Pacific: 11.4% CAGR
Largest Region
South Asia and Pacific: 34% of 2025 global value
Market Leaders
HCLTech, Capgemini Engineering, Tata Elxsi, Wipro and Cyient lead on measured engineering services revenue. Source: MMA Primary Research Dataset, July 2026.
Primary Survey
n=3,800 procurement and R&D decision-makers, Q4 2025, six countries
Methodology
Demand-side build-up, cross-validated against public data, 47 expert interviews

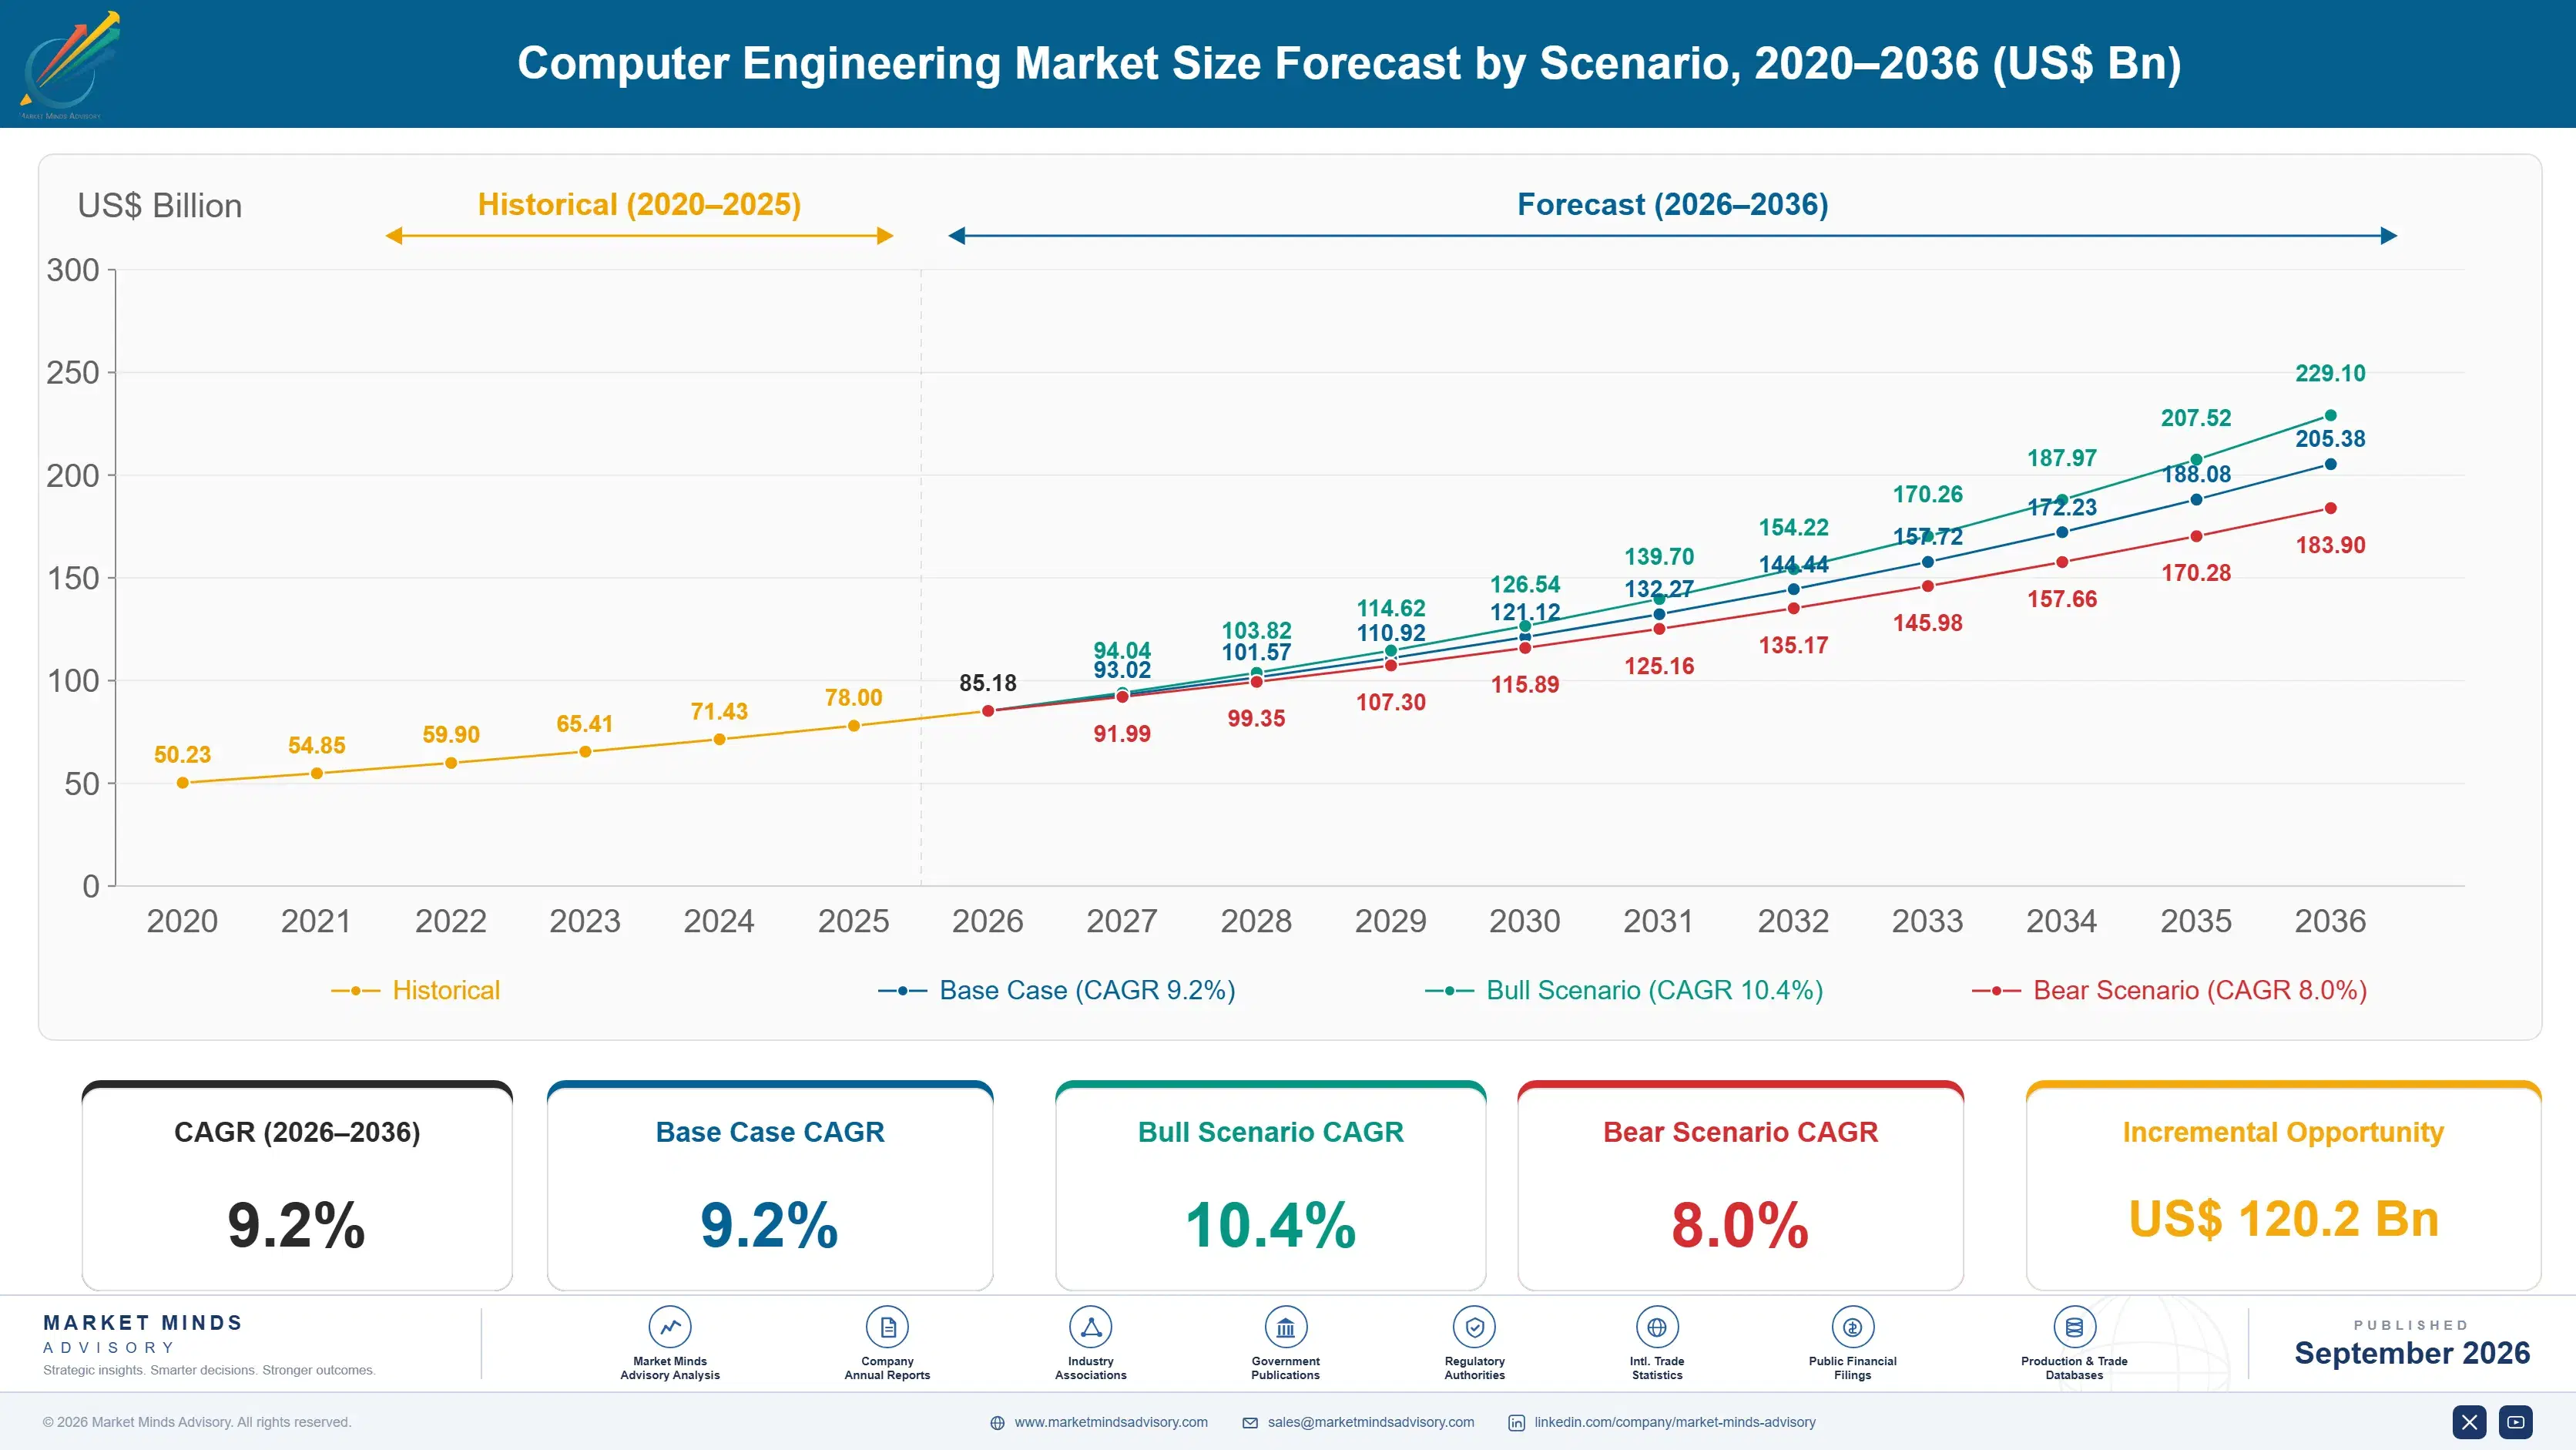
Computer Engineering Market Forecast Scenarios

computer-engineering-market-size-forecast-scenario-1788427234169
Growth ran at 8.0% from 2020 to 2025 and the composition shifted materially inside that period. Early demand came from sustaining engineering and cost reduction work, which is steady, unexciting and priced accordingly. Custom silicon then became something ordinary technology companies attempted rather than something only semiconductor firms did, and that single change pulled the highest-value work into a services market that had been positioned largely as a cost-saving arrangement.
The base case at 9.2% rests on three mechanisms. Custom compute programmes at hyperscale operators, vehicle manufacturers and industrial companies all require design and verification capability that none of those organisations built internally. Verification at roughly 58% of project hours is where the shortage bites hardest, and it scales with design complexity rather than with die count. Third, embedded software content keeps growing inside products whose manufacturers are mechanical engineering organisations by history.
The bull case at 10.4% assumes custom silicon programmes proceed as announced and that offshore engineering capacity expands fast enough to staff them. The bear case at 8.0% is that assisted design tooling reduces the mechanical hours this industry bills for, which would compress a labour arbitrage model considerably faster than the demand growth expands it.

Selling Hours in a Shortage

This is a professional services business and nobody describes it that way. Revenue is engineers times utilisation times rate, and the three move against each other constantly. A provider at 76% utilisation earns; the same provider at 68% does not, and the eight points sit in bench time nobody schedules for because clients commit late and cancel early. Pricing gets the attention and utilisation decides the outcome.
TOP FIVE CONCENTRATION24%Highly fragmented across engineering services providers operating globally
VERIFICATION EFFORT SHARE58%Chip project engineering hours consumed by verification work
BILLABLE UTILISATION RATE76%Engineer hours charged against total available team capacity
OFFSHORE DELIVERY SHARE67%Engineering hours delivered outside the client home market
AVERAGE BLENDED RATEUSD 47 per hourWeighted charge across onshore and offshore delivery mix
ENGINEER ATTRITION RATE18%Annual staff turnover measured across design engineering teams
What changed the demand picture was custom silicon leaving the semiconductor industry. Hyperscale operators, vehicle manufacturers and industrial firms all made the same decision within a few years, and none had the design and verification teams to execute it. Verification absorbs roughly 58% of project hours and is the hardest role to recruit. That shortage rather than any technology shift moved this market's centre of gravity.
Attrition near 18% is the quiet number that governs everything. An engineer leaving mid-project costs handover time, quality risk and frequently the client relationship, and replacing them takes months in the disciplines that matter most. Providers with genuinely lower attrition earn more per engineer because clients pay for continuity rather than for capability alone. Very few report the figure and clients have started asking for it directly.
"Clients buy this like a product and it behaves like a hospital rota. The provider who wins a competitive bid on rate and then staffs it with whoever is free that month will lose the account inside eighteen months, and the client will conclude that outsourcing engineering does not work."
Director, Engineering Services and Semiconductor Practice · MMA Technology Practice · September 2026

Market Trends

Custom Silicon Leaves the Semiconductor Industry

Hyperscale operators, vehicle manufacturers and industrial companies have all begun designing their own compute rather than buying standard parts, and none of them built the design and verification organisations that decision requires. That pushed the highest-value engineering work into a services market previously positioned around cost reduction. Custom silicon design and verification grows at 13.8%, faster than anything else here, and the buyers are organisations with deep budgets and no internal capability. Providers who can staff verification at scale are turning work away rather than competing for it. That is a rare position for any services business.
Market Impact: Consumes 58% of project hours
Assisted Design Tooling Attacks the Billable Hours

Automated testbench generation, assisted place and route and code synthesis genuinely reduce effort on the mechanical portions of a design project, which is precisely the work a time-based services model bills for in volume. Providers selling hours face a shrinking base per project even as project counts rise. Those selling outcomes, fixed-scope deliverables or verification closure commitments keep the value the tooling creates rather than passing it straight to the client. The commercial model rather than the technology decides who benefits from this. Nothing about the tooling itself determines where the value actually lands.
Market Impact: Grows at 11.0% each year

Market Opportunities and Growth Drivers

Verification Talent Cannot Be Recruited Fast Enough

Verification absorbs roughly 58% of chip project engineering hours and requires judgement built over years rather than skills acquired in a training programme, which makes it the binding constraint on how much work this industry can accept. Universities produce design engineers in reasonable numbers and verification engineers in far fewer, because the discipline is taught less and looks less appealing to graduates. Providers compete for the same people and attrition near 18% moves them between competitors continuously. Capacity rather than demand sets the growth rate. Providers with depth here turn work away routinely.
Market Impact: Eight points separates 76% from 68%

Embedded Content Grows Inside Mechanical Companies

Vehicle manufacturers, industrial equipment builders and medical device firms all now ship products where software determines most of the customer-visible behaviour, and their engineering organisations were built around mechanical and electrical disciplines over decades. Building internal software capability at the required scale takes longer than their product cycles allow, so the work moves outside. Embedded software and firmware engineering grows at 11.0% on that mismatch alone. These clients also buy differently, since they are unfamiliar with how engineering services are properly scoped. Early projects with these clients are frequently unprofitable and later ones considerably better.
Market Impact: Loses 33% of project teams

Market Restraints and Challenges

Utilisation Swings Destroy Margin Almost Invisibly

A provider at 76% utilisation is profitable and the same provider at 68% is not, and the difference is bench time between projects that clients create by committing late and cancelling early. The root cause is that engineering demand arrives in lumps while engineering supply must be recruited and retained continuously. Commercially this makes revenue growth a poor guide to profitability, since a growing provider with poor scheduling earns less than a smaller disciplined one. Mitigation runs through pipeline visibility, cross-skilling and deliberately mixed contract structures. Revenue growth is a poor guide to profitability here.
Market Impact: Fastest segment at 13.8% growth

Attrition Costs More Than Any Rate Negotiation Saves

Annual turnover near 18% means a two year project loses roughly a third of its team, and each departure costs handover, quality risk and client confidence that no rate discount compensates for. The root cause is that skilled engineers have many employers competing for them and switching carries almost no penalty. Commercially this makes retention a pricing input rather than a human resources concern. Providers mitigate through project continuity commitments, technical career paths and staffing depth, all of which cost money before they save any. Clients have started asking for the figure in tenders.
Market Impact: Reduces mechanical hours by 20%
4 additional market trends, 3 additional growth drivers, and 2 additional restraints and challenges are covered in the full report. Contact sales@marketmindsadvisory.com to access the complete intelligence.

Segment CAGR and Growth Architecture

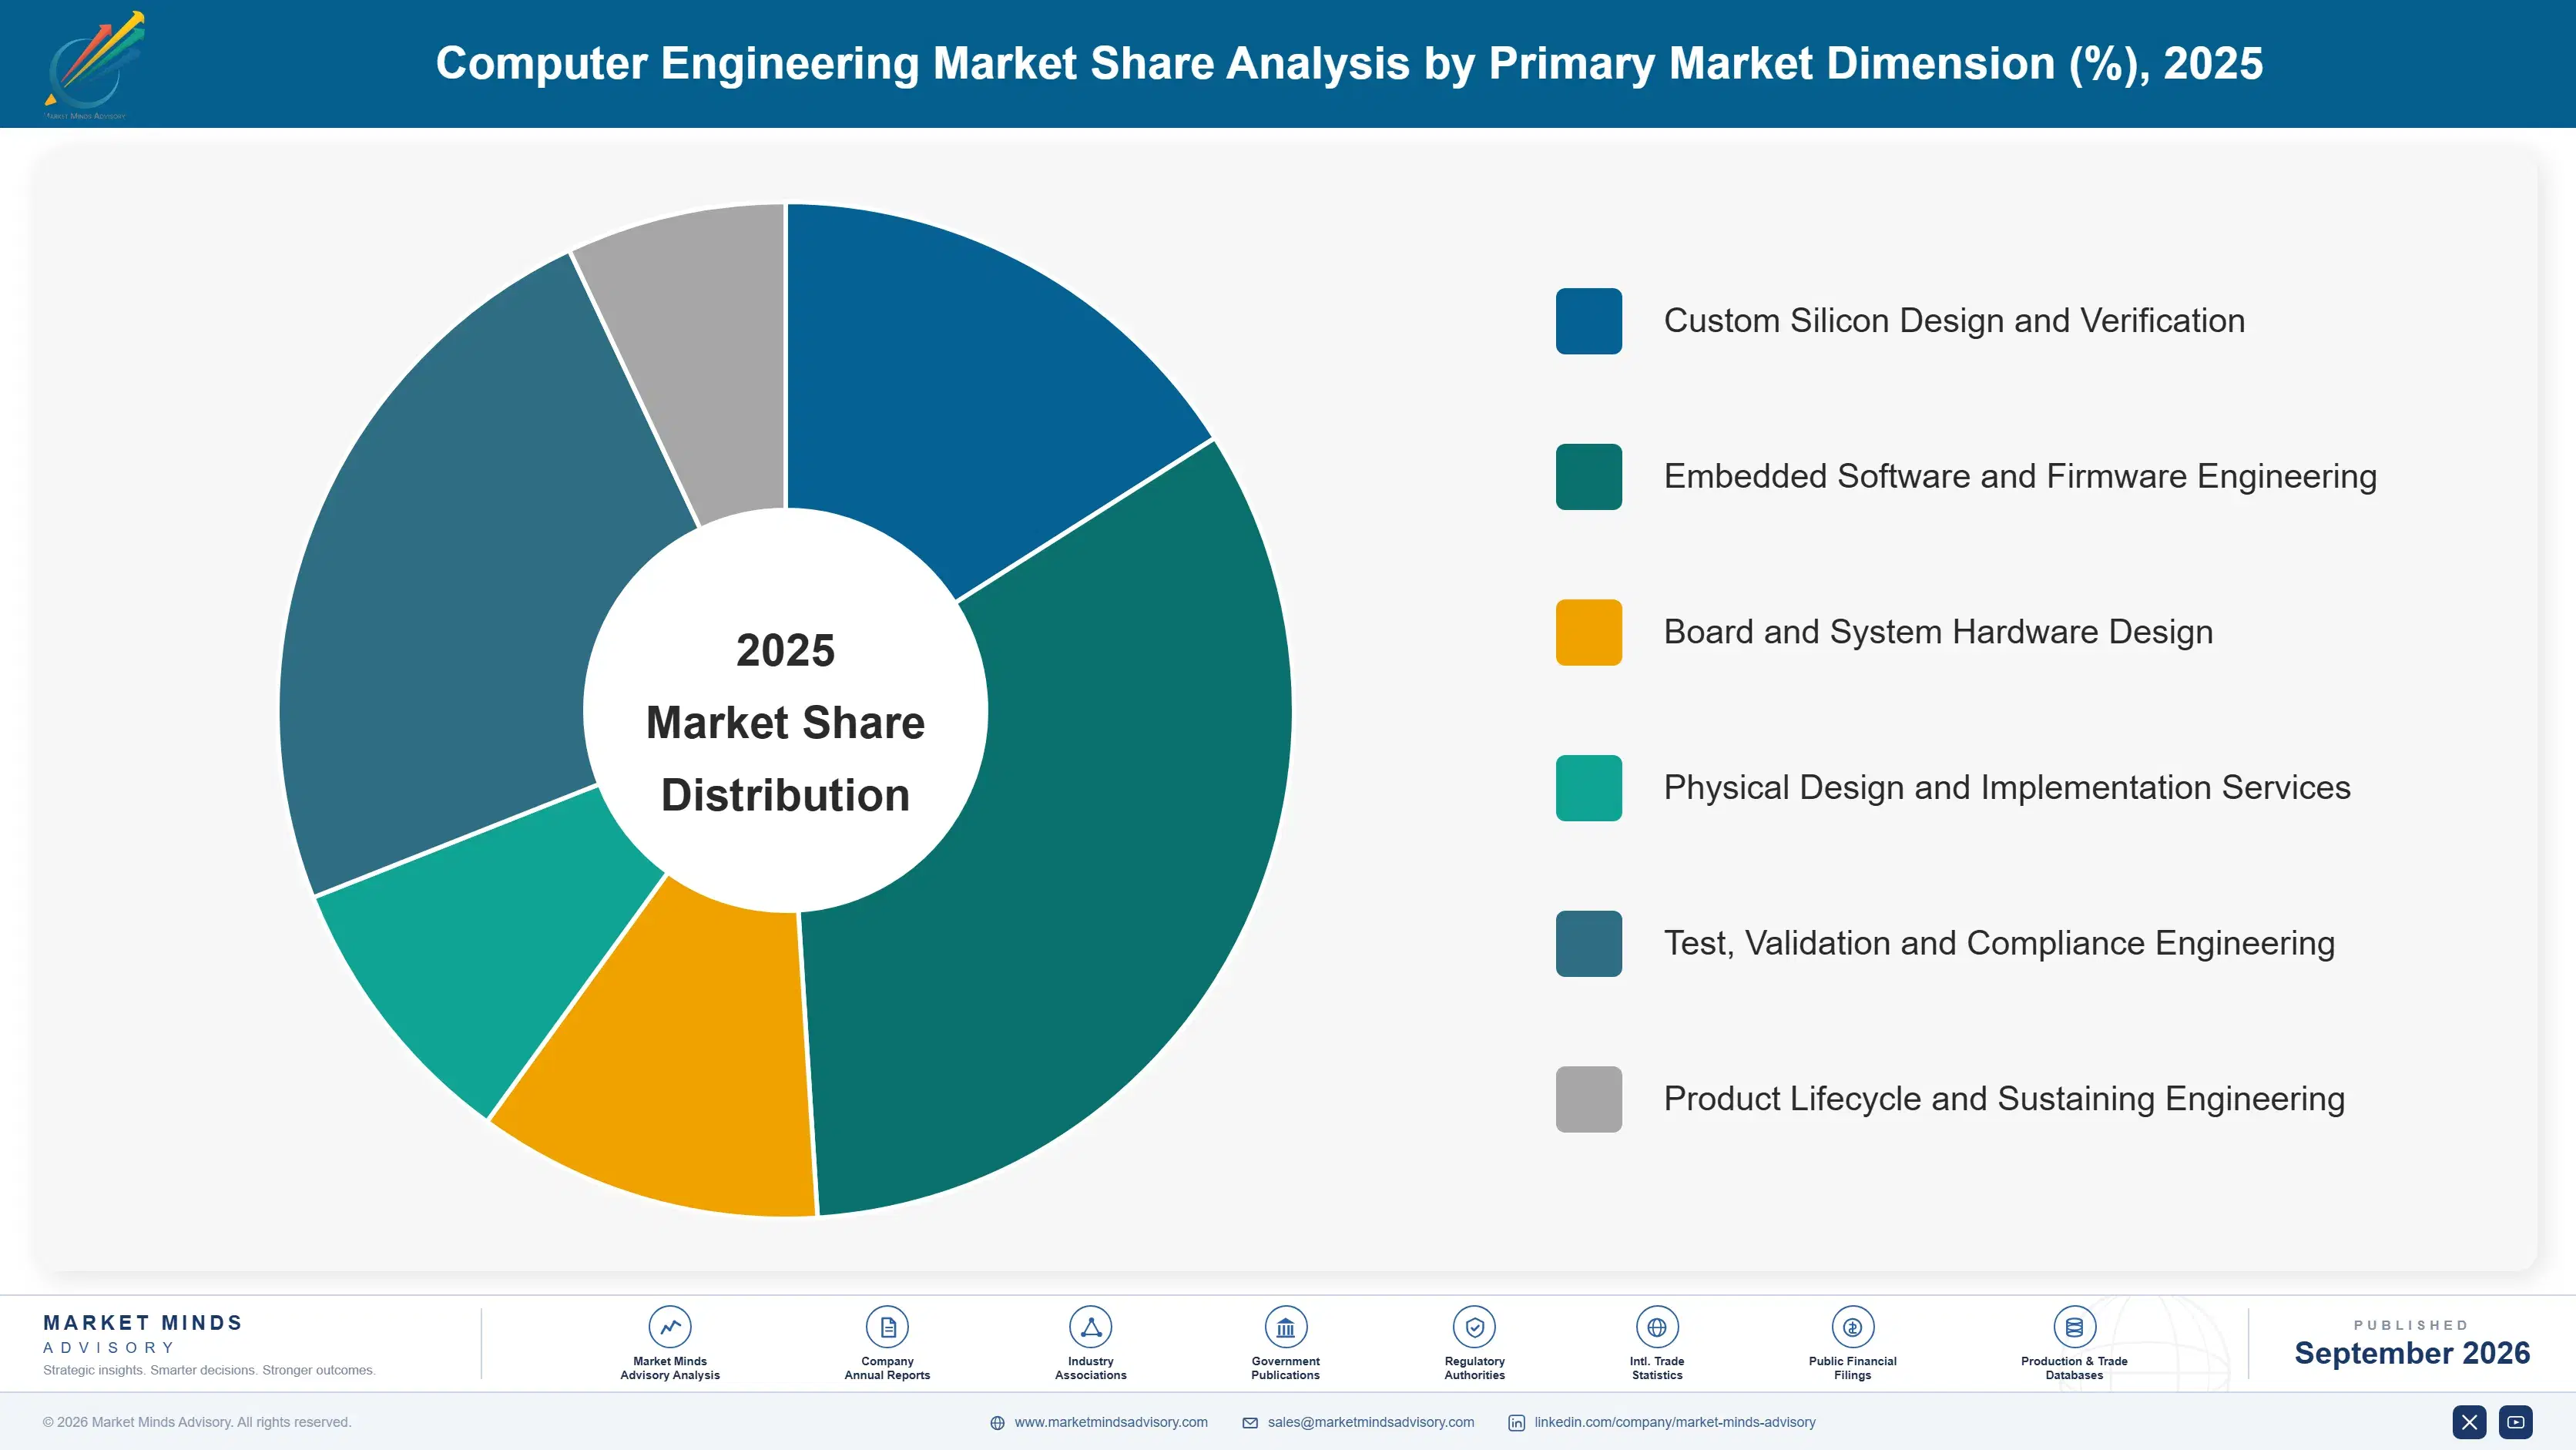
Segmentation follows engineering discipline, because discipline determines scarcity and scarcity determines price. Verification engineers and sustaining engineers are both engineers and the resemblance ends there: one is the constraint on how much work the industry can accept, the other is available, and their rates reflect exactly that difference, which nobody disputes. The work looks similar and is not.
computer-engineering-market-market-share-analysis-1788427234713

Custom Silicon Design and Verification

Custom silicon grows at 13.8%, half again the market rate of 9.2%, because hyperscale operators, vehicle manufacturers and industrial companies all decided to build their own compute without building the organisations required to design it. Verification absorbs roughly 58% of project hours and is the discipline nobody can staff quickly, which means providers with depth here turn work away rather than bidding for it. Rates run well above the blended average and clients accept them, since the alternative is a programme that does not happen. The risk is that these clients eventually build internal teams, which several have started doing quietly. Verification depth rather than design capability decides which providers get invited at all.
CAGR 13.8%

Embedded Software and Firmware Engineering

Embedded engineering grows at 11.0% because vehicle, industrial and medical device manufacturers now ship products where software determines most customer-visible behaviour, while their engineering organisations were built around mechanical and electrical disciplines. Building internal capability at the necessary scale takes longer than product cycles permit, so the work moves outside and generally stays there. These clients scope work poorly at first, since they are unfamiliar with how engineering services are structured, which makes early projects unprofitable and later ones considerably better. Safety certification content in automotive and medical work raises both the rate and the switching cost substantially. Once embedded in a client's platform, providers are renewed across product generations rather than rebid.
CAGR 11.0%
Full segment breakdown across 6 segments available in the complete report.

Regional Architecture and Country Demand Map

Value follows where engineers actually are rather than where clients are headquartered, and those two have diverged further every year. Delivery location decides most of the revenue recognition even where the work is specified elsewhere entirely. The gap between the two is now the industry's defining feature.

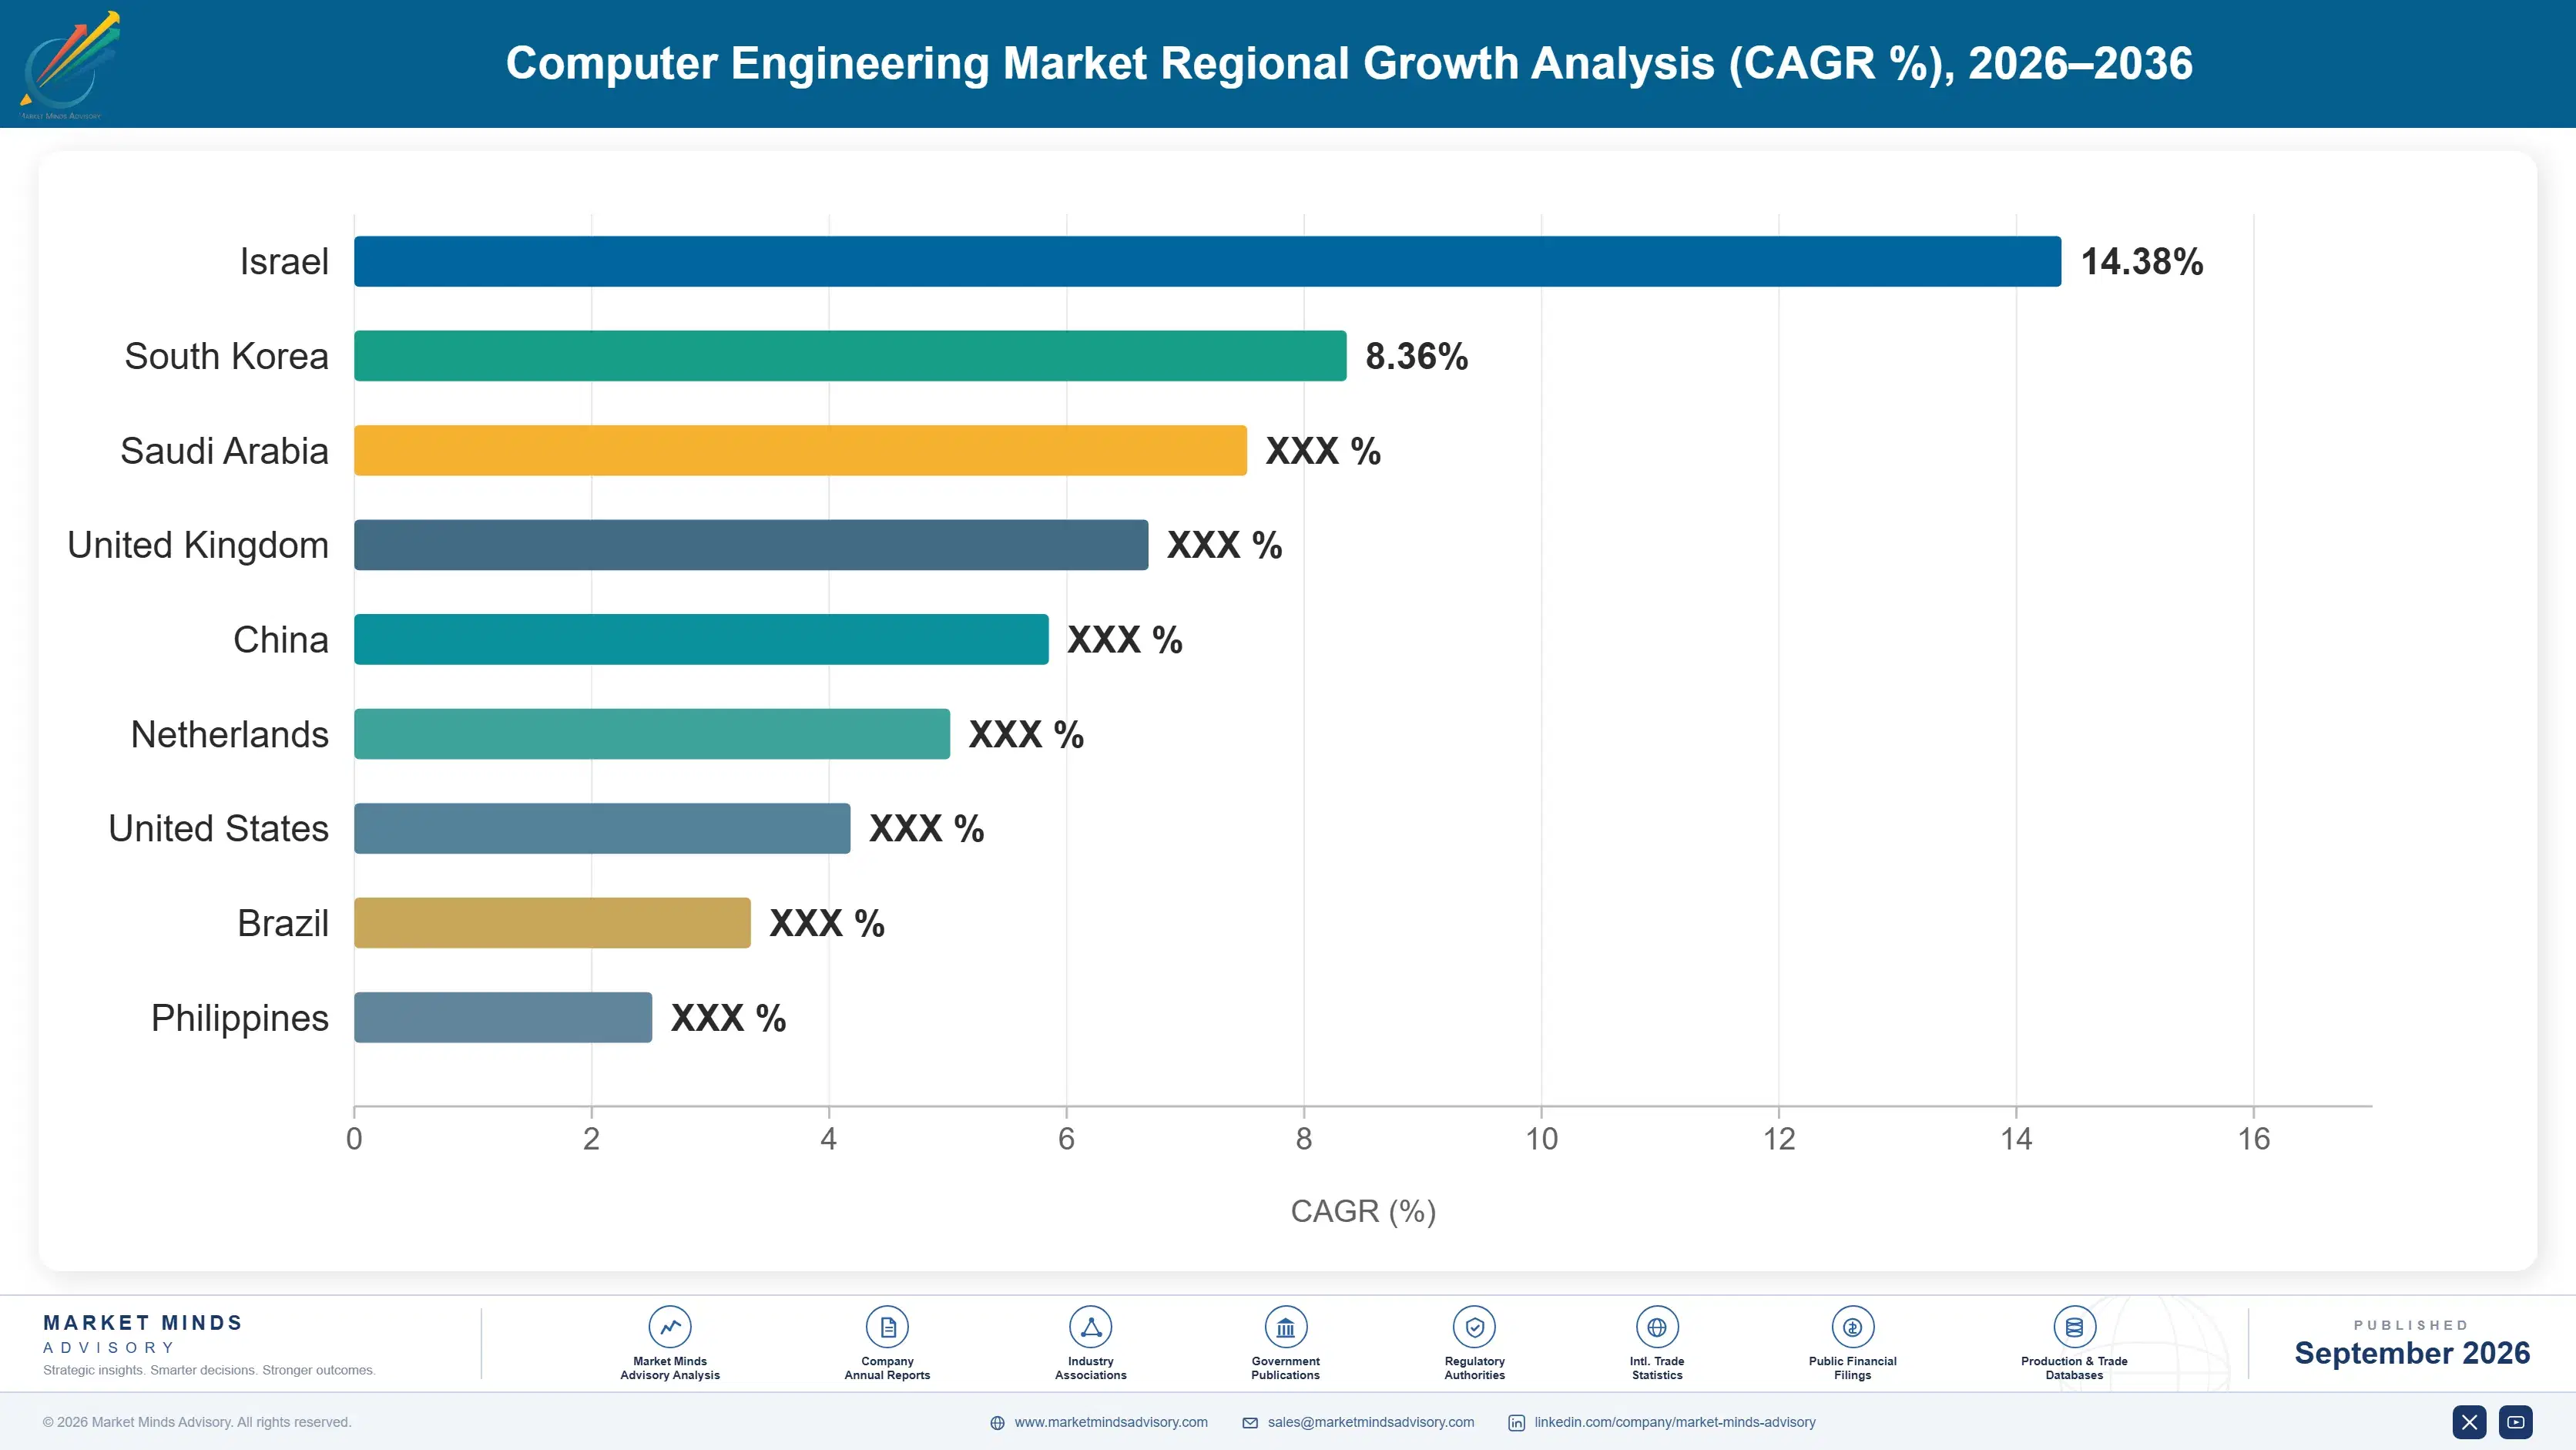
South Asia and Pacific

The region holds 34%, far above the regional band, because India contains the largest concentration of semiconductor and embedded design engineers anywhere and every significant provider runs its principal delivery capacity there. Roughly 67% of global engineering hours are delivered offshore and India takes the majority of them, across verification, physical design and embedded software equally. India is the fastest-growing country at 12.4%, and wage inflation there is narrowing the arbitrage that originally built the model. Australian and Southeast Asian contributions are small and concentrated in embedded work for regional manufacturers. Attrition near 18% is highest in Indian delivery centres, where engineers can change employer without changing city and frequently do so annually.
Share: 34% | CAGR: 11.4% (2026 to 2036)

North America

American value reflects client-side programme management, architecture and the onshore portion of hours rather than the bulk of delivery, which sits elsewhere. Hyperscale custom silicon programmes are specified here and staffed globally, and the specification work commands rates several times the blended average. Defence and aerospace engineering must be performed domestically by regulation, which sustains a genuinely onshore engineering base at prices no commercial application supports. Growth at 10.0% runs ahead of the market on custom compute programmes rather than on any expansion of domestic engineering headcount. Clients here are also furthest ahead in rebuilding internal design teams after years of outsourcing, which removes architecture and verification work from providers first. Sustaining engineering stays outsourced.
Share: 26% | CAGR: 10.0% (2026 to 2036)
Regional intelligence for 5 additional markets available in the complete report: East Asia, Western Europe, Eastern Europe, Latin America, Middle East and Africa. Contact sales@marketmindsadvisory.com.
computer-engineering-market-country-cagr-analysis-1788427235239

Where Engineering Services Actually Earn

Rate negotiation gets the attention in every client conversation and decides comparatively little. Utilisation, attrition and contract structure decide profitability, and all three are managed internally rather than negotiated. Providers who understood that years ago are earning double-digit margins in a market their competitors describe as commoditised and treat accordingly. The description is a choice.

Protect Utilisation Through Real Pipeline Visibility

A provider at 76% utilisation is profitable and the same provider at 68% is not, and the difference is entirely bench time created by clients committing late and cancelling early. Building pipeline visibility, cross-skilling engineers across disciplines and mixing contract structures deliberately recovers most of those eight points. That swing is worth roughly 11 percentage points of operating margin, considerably more than any rate increase a client would accept. Most providers manage rate weekly and utilisation quarterly, which is precisely the wrong way round. Bench time is the single largest controllable cost in this business.
Market Impact: Worth roughly 11 points of operating margin overall

Price Retention Rather Than Absorbing Attrition

Turnover near 18% means a two year project loses about a third of its team, and every departure costs handover, quality and client confidence that no rate discount offsets. Providers offering project continuity commitments, backed by retention bonuses and technical career paths, charge roughly 12% more and win the work anyway because clients have been burned before. Retention spending is a pricing input rather than a human resources cost. Very few providers publish attrition and clients have begun asking for it in tender documents. Retention spending always arrives before the revenue it eventually protects.
Market Impact: Charges roughly 12% more for each engineer supplied

Sell Verification Closure, Not Verification Hours

Verification absorbs roughly 58% of project hours and assisted tooling is steadily reducing the mechanical portion of that work, which erodes a time-based model from underneath while demand still grows. Providers committing to coverage and closure milestones rather than to staffed hours keep the productivity gains the tooling creates. Outcome-based verification contracts carry gross margins around 19 percentage points above time and materials equivalents. It requires estimating discipline most providers have never needed to develop properly. Clients accept closure contracts readily, since they were buying the outcome rather than the hours in the first place.
Market Impact: Adds roughly 19 points of gross margin overall

Build Delivery Where the Engineers Remain Available

About 67% of hours are delivered offshore and Indian wage inflation is narrowing the arbitrage that originally justified it, so location decisions now rest on engineer availability rather than on cost. Eastern European and Latin American nearshore centres suit clients wanting time zone overlap, and they cost roughly 40% more than Indian delivery for that convenience. Providers with a single delivery location carry both wage and geopolitical exposure. Those with three or more can move work rather than negotiate about it. Clients increasingly ask for delivery location options during selection rather than after signing.
Market Impact: Nearshore capacity costs roughly 40% more than offshore

Who Controls the Margin Pool

Concentration sits near 24% across the top five on measured engineering services revenue, the most fragmented picture anywhere in technology services, and fragmentation persists because scale confers less advantage here than in most industries. A provider with 40,000 engineers has no material cost advantage over one with 4,000 on a given project, since the cost is the engineers themselves. What scale buys is the ability to absorb utilisation swings and to staff several disciplines at once.
Competition runs on three dimensions. Verification capacity is first and increasingly decisive, since it is the discipline nobody can recruit quickly enough. Second is retention, because attrition near 18% breaks projects and clients now examine it during selection. Third is domain depth in safety-certified automotive, medical and aerospace work, where certification familiarity commands rates that general engineering never approaches.

Two pressures will move positions. Assisted design tooling reduces the mechanical hours that time-based providers bill, which rewards those who moved to outcome-based contracting and punishes those who did not. Meanwhile several large clients are quietly building internal teams after years of outsourcing, which removes the highest-value work first and leaves providers with the sustaining engineering they were trying to grow away from.
computer-engineering-market-company-positioning-matrix-1788427235767

Competitive Moat and Risk Dimensions

HCLTECH

Moat: Scale across engineering disciplines

HCLTech operates engineering delivery across silicon, embedded, platform and sustaining work at a scale that lets it move engineers between disciplines when a project ends, which protects utilisation in a business where bench time destroys margin. Its client relationships span multiple engineering programmes rather than single projects. Delivery across several countries reduces exposure to any one wage market or jurisdiction.
HCLTECH

Risk: Time-based revenue concentration

A substantial share of revenue is billed against engineering hours, and assisted design tooling is reducing exactly the mechanical work that model depends upon. Moving to outcome-based contracting requires estimating discipline and risk appetite that large services organisations adopt slowly. Clients building internal teams also take the highest-value programmes first, leaving the sustaining work that carries the weakest margins.
TATA ELXSI

Moat: Domain depth in regulated products

Tata Elxsi holds genuine depth in automotive, medical device and broadcast engineering, where safety certification familiarity commands rates that general engineering work never reaches and where switching providers means requalifying evidence. Its design and systems capability sits alongside implementation rather than beneath it. Long relationships with vehicle and medical manufacturers renew across product programmes measured in years.
TATA ELXSI

Risk: Delivery location concentration

Delivery is weighted heavily toward Indian capacity, where wage inflation is narrowing the arbitrage that built the model and where a single wage market carries concentrated exposure. Clients increasingly request nearshore options costing around 40% more. Building comparable depth in other locations takes years, because the domain knowledge commanding the premium is held by people rather than process.

Players Tracked

Prominent Players

HCLTech
Capgemini Engineering
Tata Elxsi
Wipro
Cyient

Other Key Players

Alten
Akkodis
Sasken Technologies
L&T Technology Services
Tessolve
Mistral Solutions
Sondrel
ASICLAND
Alchip Technologies
Global Unichip
Socionext
eInfochips
KPIT Technologies
Persistent Systems
Infosys

Recent Developments

MARCH 2025

Clients begin requesting engineer attrition figures during provider selection

Technology and vehicle buyers added team continuity and turnover disclosure to engineering services tenders, having found that mid-project departures cost more than the rate differences they had been negotiating. Providers unable or unwilling to report attrition were excluded from several shortlists entirely. Rate comparison had dominated selection for years.
Signal: Retention has moved from an internal concern into a selection criterion that decides which providers reach shortlists.
JULY 2025

Providers shift verification work onto coverage and closure commitments

Several engineering services firms moved verification engagements from staffed hours to contracted coverage and closure milestones, keeping the productivity gains that assisted tooling produces rather than passing them to clients. The change required estimating capability most providers had never built properly. Clients received identical outcomes for fewer billed hours.
Signal: Contract structure rather than tooling decides who captures the value that assisted design automation actually creates.
NOVEMBER 2025

Large technology buyers begin rebuilding internal silicon teams

Several hyperscale and automotive buyers started recruiting internal design and verification staff after years of outsourced delivery, targeting the architecture and verification roles rather than implementation work. Providers retained the implementation and sustaining engineering with considerably weaker margins attached. Architecture roles were recruited first and proved hardest to fill.
Signal: Insourcing takes the highest-value engineering first, which is precisely the work providers had been growing toward.

What an Engineering Hour Costs

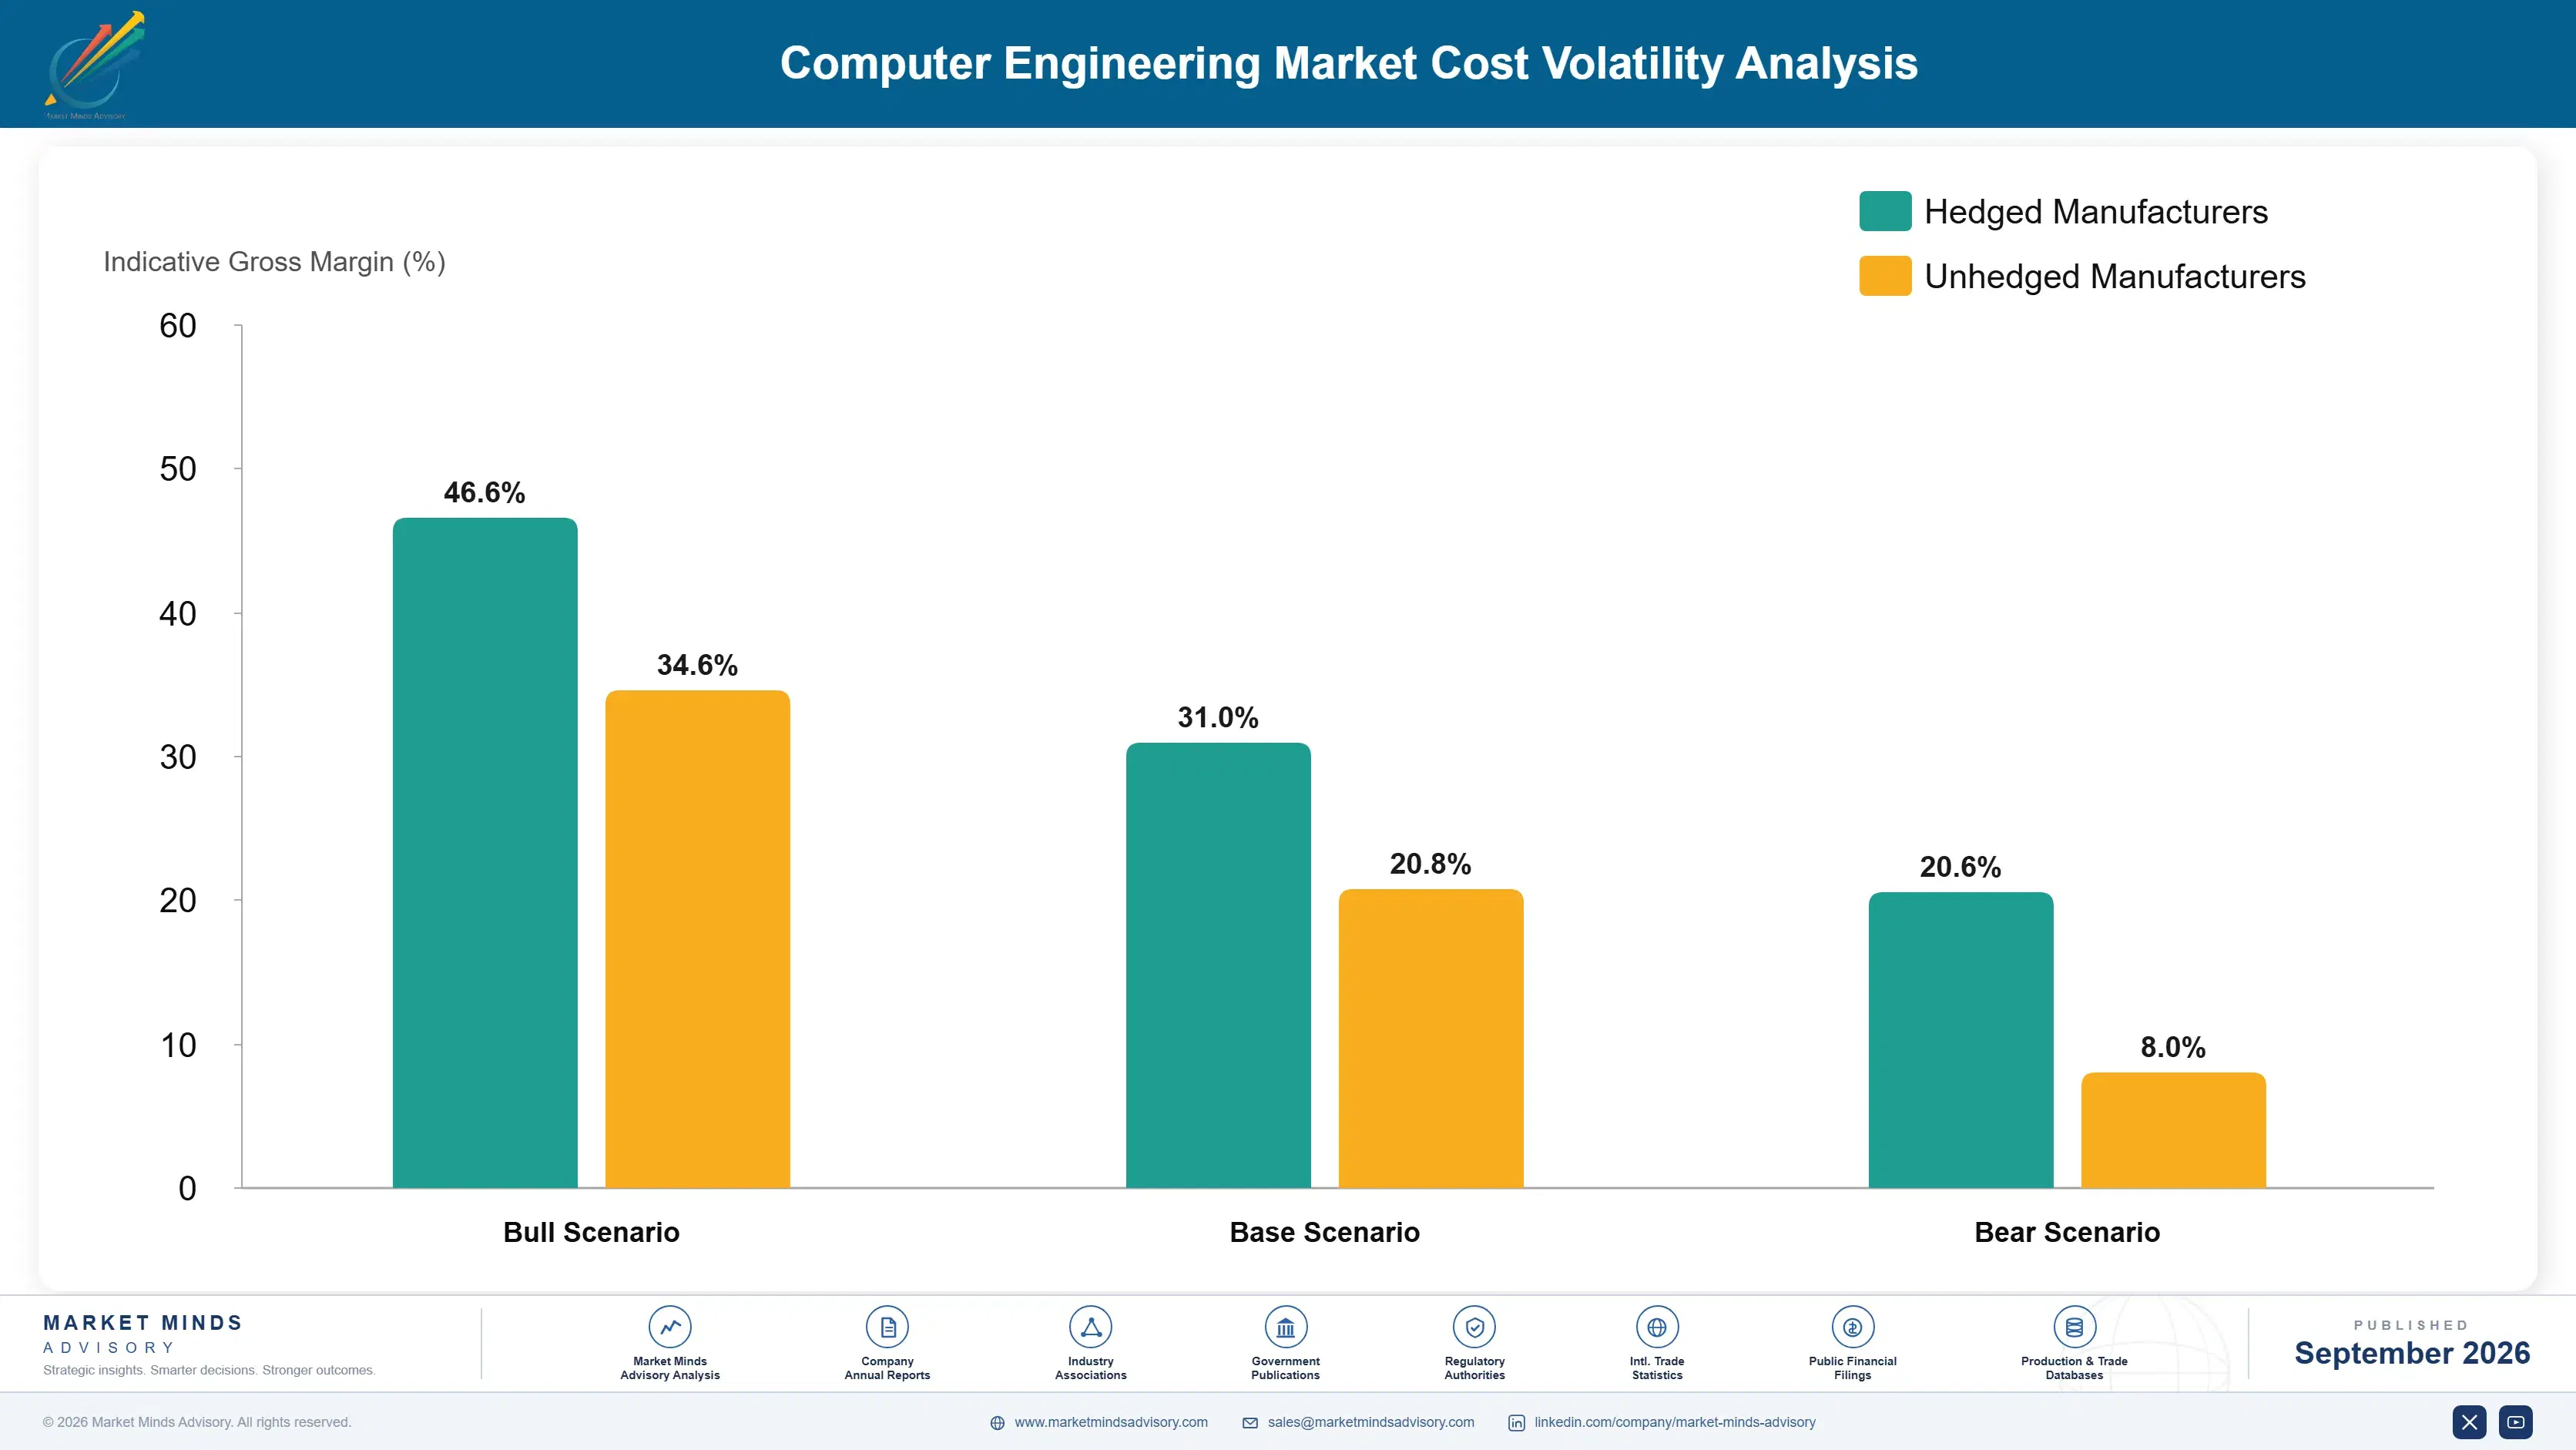
Cost structure is overwhelmingly people. Engineer compensation, employer contributions and recruitment together account for roughly 71% of revenue at typical utilisation, with design tool licences forming a second block that is large and frequently underestimated. Facilities and delivery infrastructure are modest by comparison. The economics turn almost entirely on utilisation, since compensation continues whether an engineer bills or sits between projects.
Wage inflation in delivery locations has been the sharpest pressure. Indian engineering salaries rose faster than blended rates through 2024 and 2025, particularly in verification and physical design, which compressed margins across providers of every size. HCLTech and Tata Elxsi both referenced compensation and attrition cost conditions in recent annual reporting. Providers absorbed most of it, since rate increases require client agreement that arrives slowly if at all.

Exposure varies by contract structure rather than by scale. Time and materials providers pass wage increases through only at renewal, carrying the gap in the meantime. Fixed price providers carry it entirely for the contract duration, which is severe on multi-year programmes. Those with outcome-based verification contracts benefit from assisted tooling reducing hours, since the price was agreed against the deliverable rather than against the effort required.
computer-engineering-market-cost-volatility-analysis-1788427235961

Manage utilisation weekly rather than quarterly

Eight points of utilisation separate a profitable provider from an unprofitable one, and bench time accumulates in the gaps between projects that clients create by committing late. Weekly visibility of committed and probable pipeline against available capacity allows redeployment before the bench forms rather than after. Most providers review rate weekly and utilisation quarterly, which is exactly backwards.

Index multi-year contracts to delivery market wage movement

Wage inflation in Indian delivery locations has repeatedly outpaced contracted rates, and fixed price providers carry the whole gap for the contract duration on programmes running several years. Indexation against published wage measures shifts that exposure to clients better able to absorb it. Buyers resist strongly, which is why it usually becomes achievable only during a shortage.

Convert verification engagements to closure commitments

Assisted tooling is reducing the mechanical portion of verification work, which shrinks billable hours while the client receives the same outcome. Contracting against coverage and closure milestones keeps that productivity gain with the provider who invested in the tooling. It requires estimating discipline hourly billing never demanded, and providers who built it hold margins around 19 points higher.

Portfolio Architecture for Margin Defence

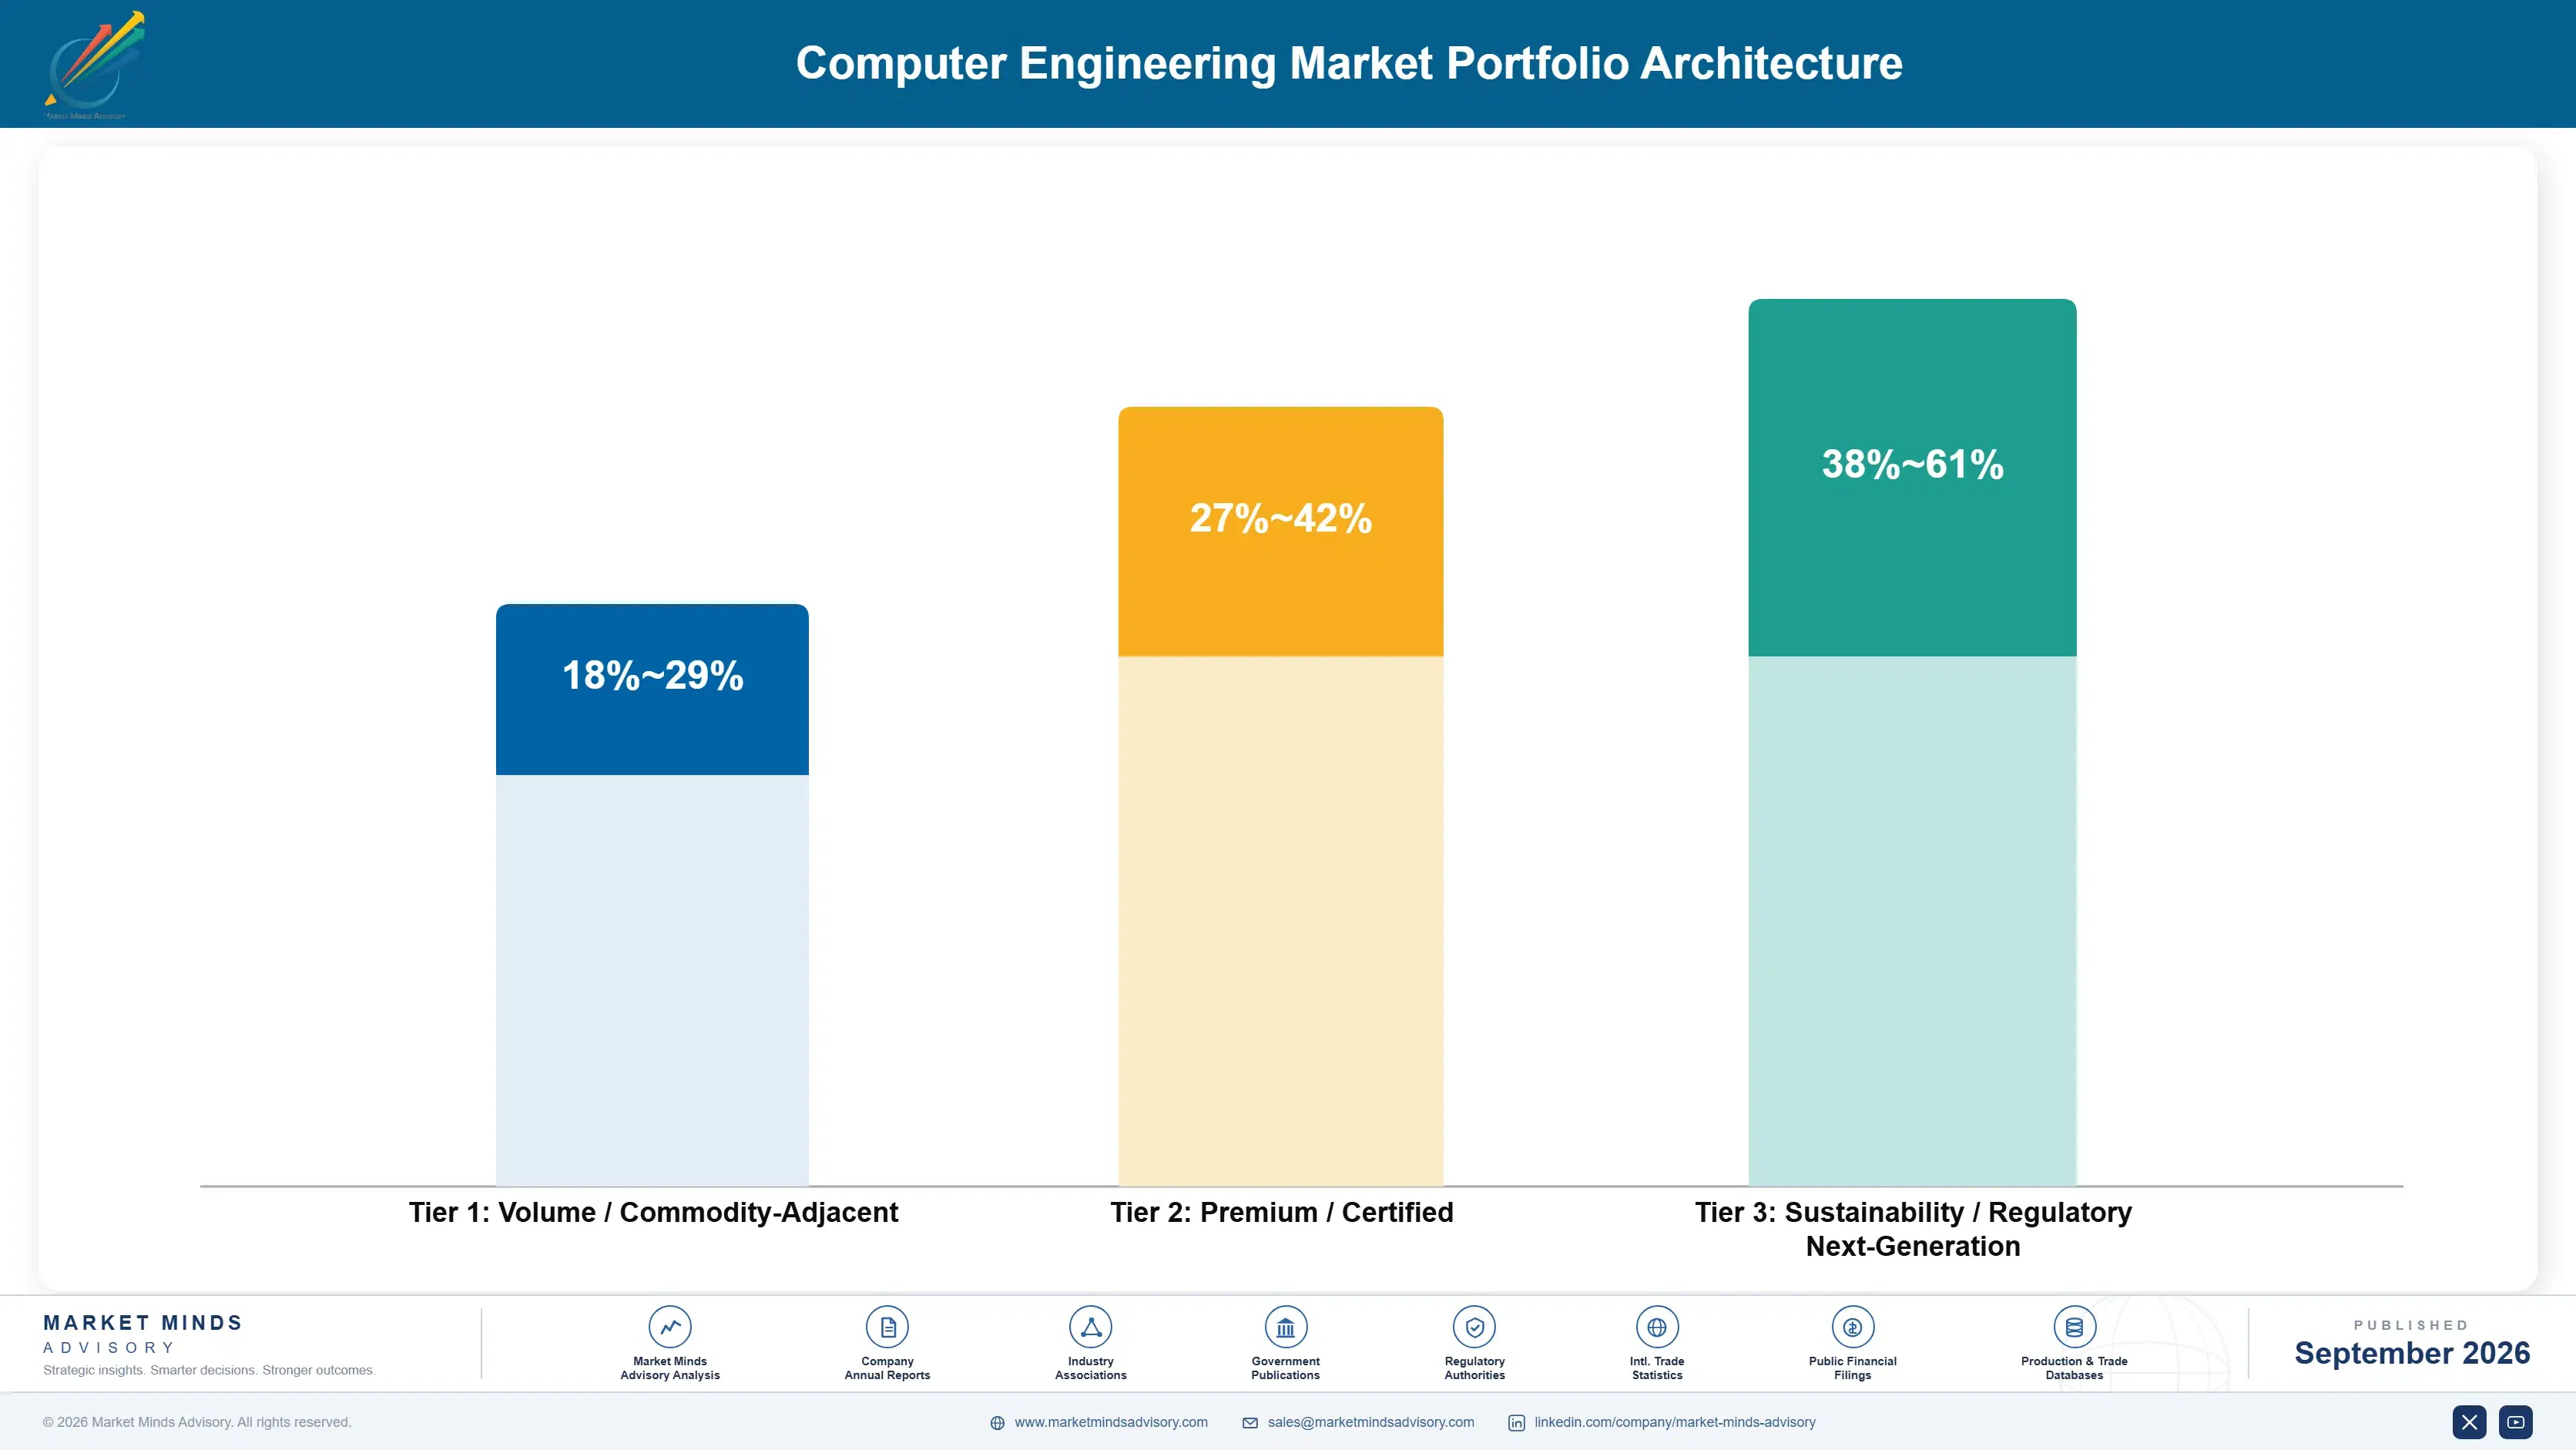
Margin architecture separates on scarcity of the discipline rather than on complexity of the work. Sustaining engineering and board design use skills that are widely available, so rates settle near the blended average and clients treat providers interchangeably. Verification, physical implementation and safety-certified embedded work use skills nobody can recruit quickly, and rates reflect that plainly. The engineering is not harder in any absolute sense; the people are simply scarcer.
The tension runs between volume delivery and scarce disciplines. Volume work fills capacity, absorbs junior engineers and provides the utilisation base that makes the business viable at all. Scarce discipline work earns the margin and cannot be staffed beyond the people available, which caps how much of it any provider can accept. Providers weighted entirely to volume are commoditised; those weighted entirely to scarcity cannot fill their benches between programmes.

High-value revenue concentrates in verification and in safety-certified automotive and medical engineering. Both are defended by capability held in individuals rather than in process, which is why acquisitions in this industry so frequently disappoint. Outcome-based contracting is the emerging third pool, capturing the value assisted tooling creates instead of passing it to clients through reduced billable hours.

Volume / Commodity-Adjacent

Sustaining engineering, board design and test execution using widely available skills at rates near the blended average. The range separates providers with disciplined utilisation from those carrying bench time. Clients treat providers here as substitutable and price accordingly.
Gross Margin: 18-29%

Premium / Certified

Physical implementation, embedded software and validation engineering requiring domain familiarity and tool depth. Margin depends heavily on retention, since project continuity is what clients actually pay the premium for. Rates sit meaningfully above the blended average across most engagements.
Gross Margin: 27-42%

Sustainability / Regulatory / Next-Generation

Verification capacity, safety-certified automotive and medical engineering, and outcome-based closure contracts. The widest range in the portfolio, reflecting certification content and how much productivity gain the contract structure retains. Highest margin and hardest to staff.
Gross Margin: 38-61%
computer-engineering-market-portfolio-architecture-1788427236454

High-value Sub-segments and Strategic Watch-out

Verification Capacity

High value with the fastest growth at 13.8%, constrained by a discipline nobody recruits quickly and consuming roughly 58% of project hours. The range reflects contract structure more than skill level. Providers with depth here turn work away rather than bidding, which almost nobody else in services holds.
Gross Margin: 40-61%

Safety-Certified Engineering

High value with steady growth across automotive, medical and aerospace work, defended because switching providers means requalifying certification evidence. The range reflects standard and jurisdiction. Domain familiarity is held by individuals rather than by process, which makes it valuable and genuinely difficult to acquire through acquisition.
Gross Margin: 37-56%

Sustaining and Platform Engineering

The volume core, filling capacity and absorbing junior engineers who become the scarce specialists later. The range separates disciplined utilisation from bench carrying. It earns little and provides the base load without which the scarce disciplines cannot be staffed economically at all. It earns its keep indirectly.
Gross Margin: 17-28%

Fixed Price Multi-Year Programmes

The strategic watch-out, where wage inflation in delivery locations is carried entirely by the provider across contracts running several years. Several providers signed these during a period of stable wages and have been absorbing the gap since. Indexation is resisted until a shortage makes delivery assurance matter more.
Gross Margin: 0-16%

How This Work Renews

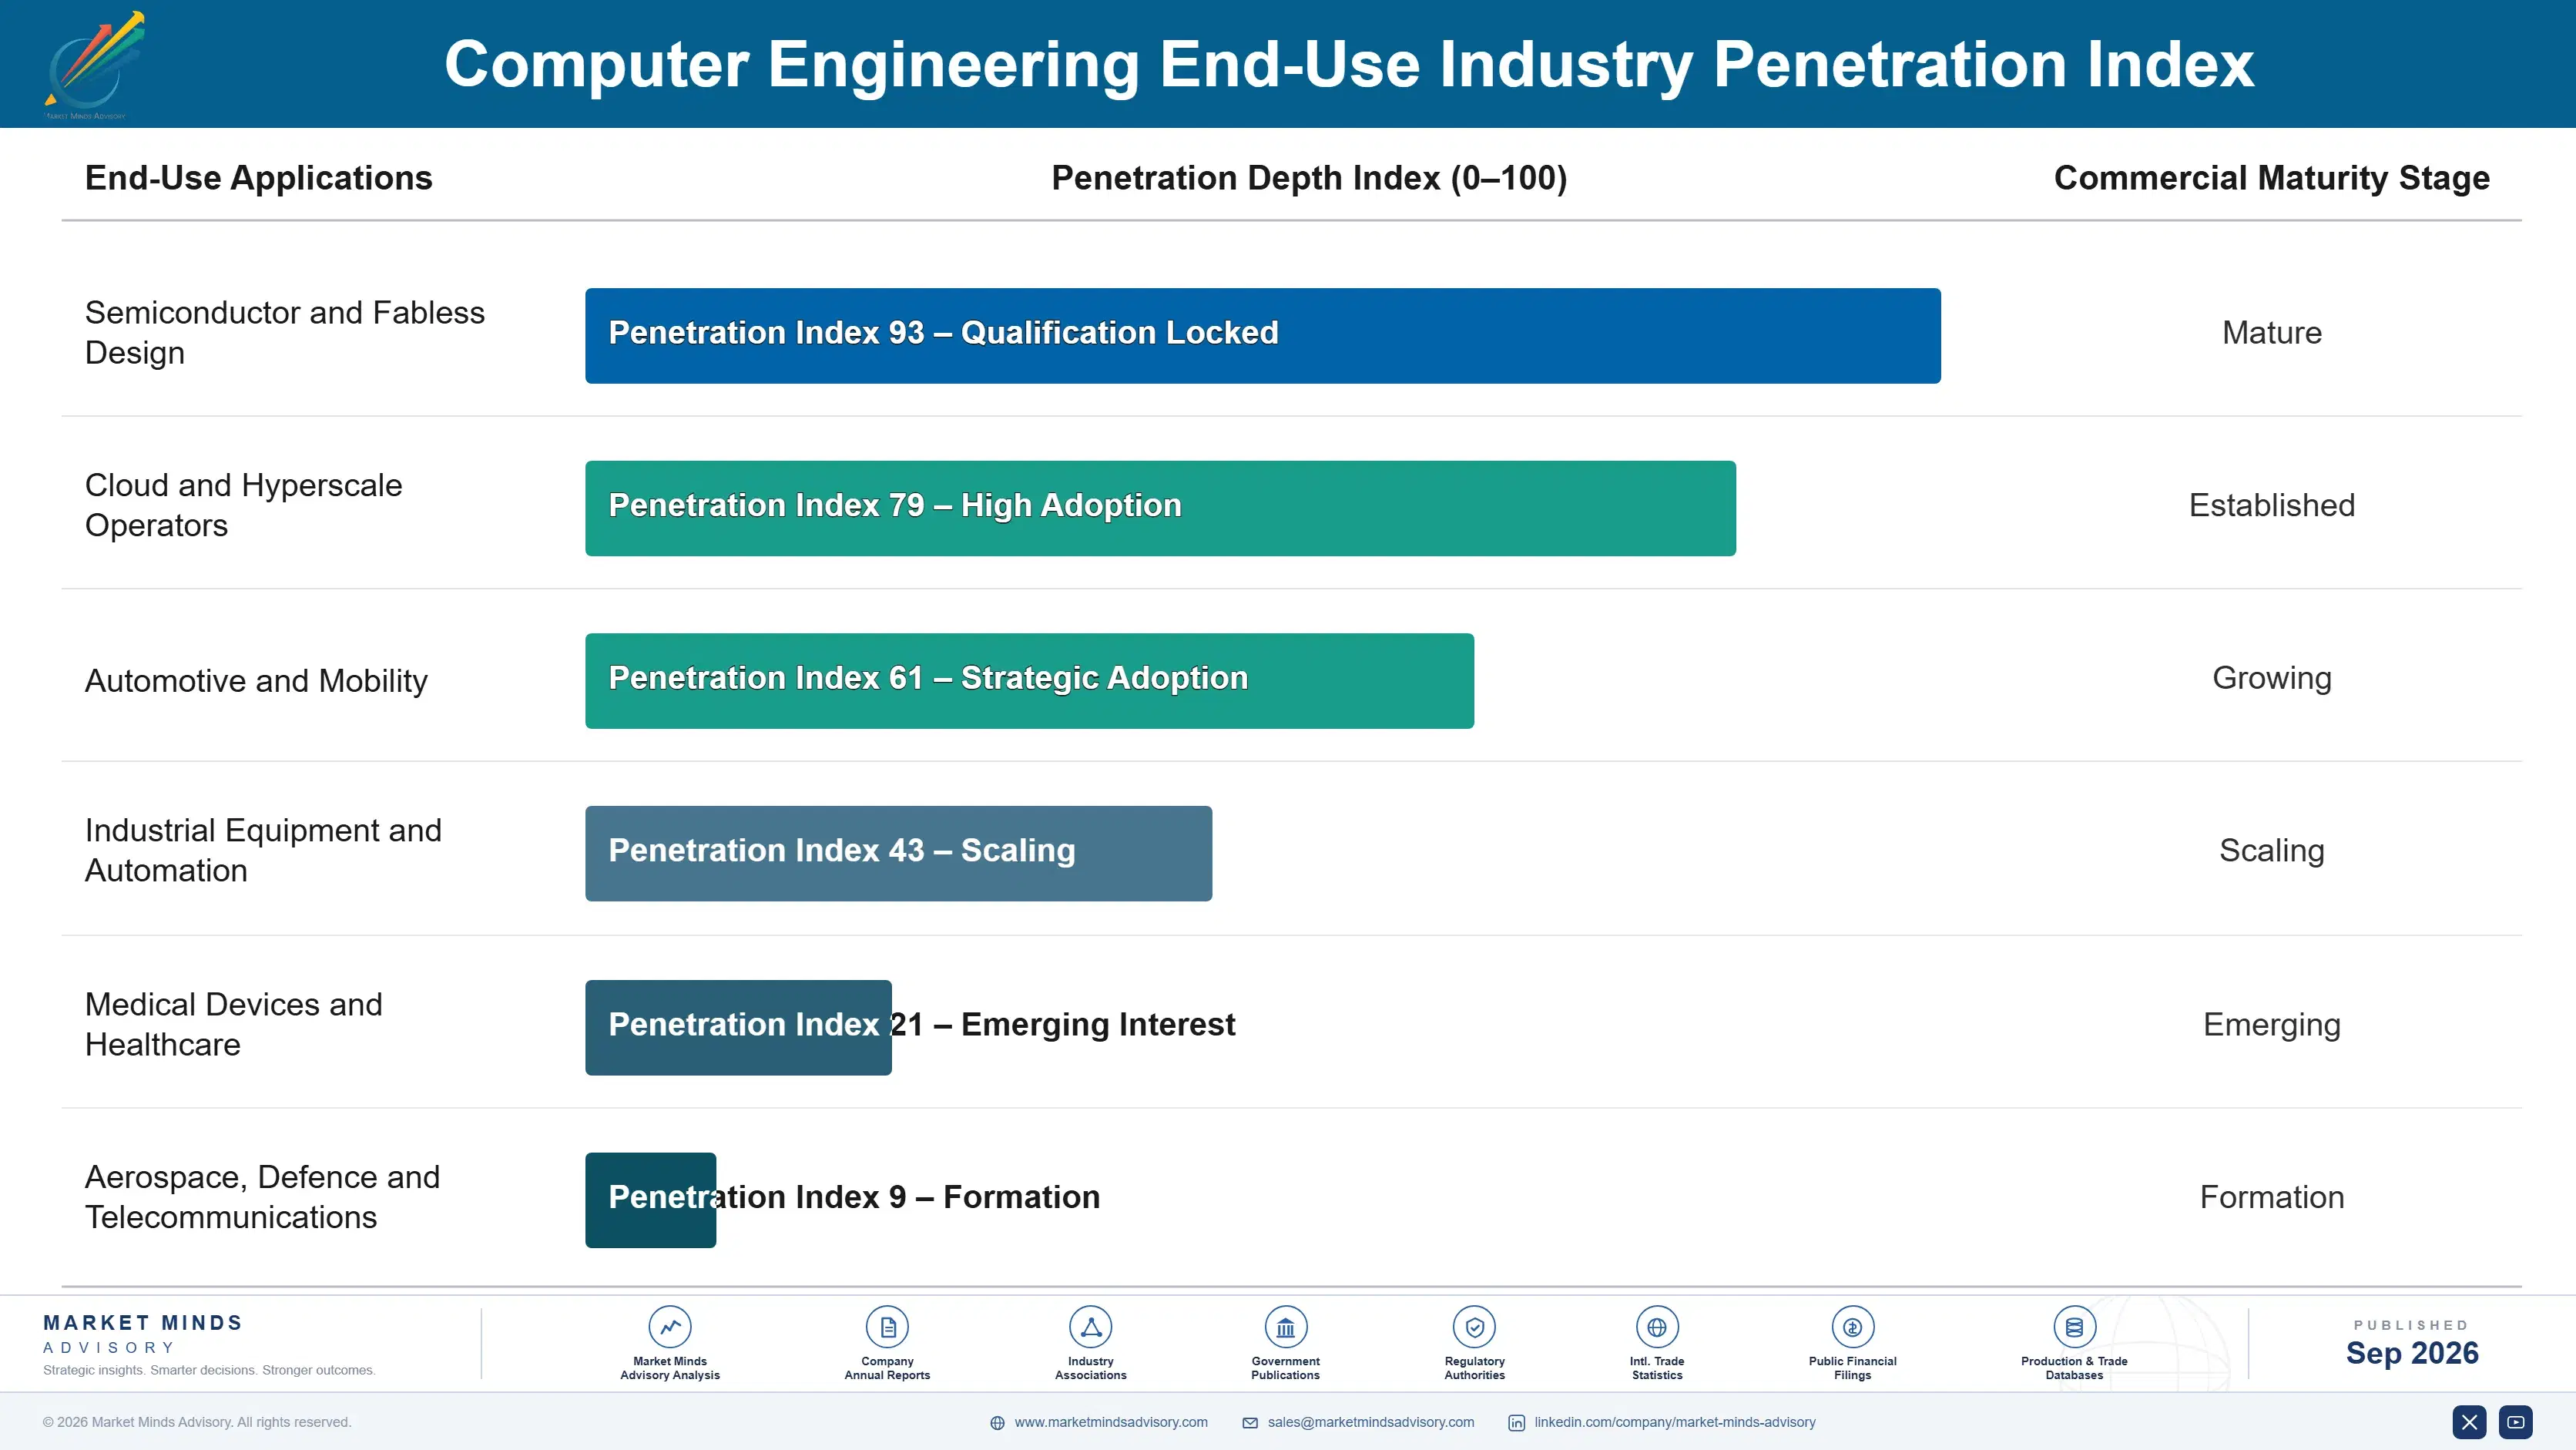
Recurrence works through programme continuity rather than through contracts. A provider embedded in a client's silicon programme is renewed across successive chip generations because the knowledge sits with the team, not in the statement of work. Sustaining engineering renews almost automatically and earns least. Verification engagements are project-shaped and repeat with each design, which makes them lumpy in timing and dependable in aggregate.
Adoption depth varies with how much client knowledge the provider now holds. Teams working on a client's architecture across several generations become genuinely difficult to replace, since the documentation never captured what they know. Teams delivering discrete tasks against clear specifications can be swapped at renewal and periodically are. Safety-certified work sits deepest of all, because changing provider means requalifying evidence that regulators and auditors have already accepted.

The buyer has moved toward engineering leadership and away from procurement. Engineering services were historically bought by sourcing functions comparing rates across a panel, which is how the industry acquired its reputation for commoditisation. Custom silicon and safety-certified work is now specified by engineering directors who care about verification depth, team continuity and attrition. Providers still targeting procurement compete on the only dimension where they all look identical.
computer-engineering-market-end-use-penetration-index-1788427236941

What Decides Margin Here

These are among the four positions where our research anticipates prominent divergence between winners and laggards over the coming forecast period. Each is grounded in the demand model, the regulatory perimeter, and the announced capacity pipeline.
01 / UTILISATION MANAGEMENT DISCIPLINE

Manage the bench weekly, not the rate card

A provider running at 76% utilisation is profitable and the same provider at 68% is not, and those eight points sit entirely in bench time created by clients who commit late and cancel early on their own programmes without warning. Pipeline visibility, cross-skilling and deliberately mixed contract structures recover most of that swing, which is worth roughly 11 percentage points of operating margin every year. Most providers review rate weekly and utilisation quarterly, which is precisely the wrong way round in this business.
02 / RETENTION AS PRICING

Sell continuity and charge properly for it

Turnover near 18% means a two year programme loses about a third of its team, and every departure costs handover time, quality risk and client confidence that no rate discount ever compensates for anywhere. Providers offering genuine continuity commitments, backed by retention spending and technical career paths, charge roughly 12% more and win anyway because clients have been burned before, repeatedly. Retention is a pricing input rather than a human resources expense, and clients now request the figures directly in tender documents.
03 / OUTCOME CONTRACT CONVERSION

Contract for closure before tooling erodes the hours

Verification consumes roughly 58% of project hours and assisted tooling is steadily reducing the mechanical portion, which shrinks a time-based revenue base while client demand continues growing underneath it regardless. Providers contracting against coverage and closure milestones keep the productivity gains rather than handing them straight to the client at renewal, and those contracts carry margins around 19 percentage points above time and materials work. The estimating discipline required is what most providers never had to develop in an hourly business.
04 / DELIVERY LOCATION SPREAD

Hold three delivery locations, not one

About 67% of hours are delivered offshore and Indian wage inflation is steadily narrowing the arbitrage that originally justified the arrangement, so location choice now rests on engineer availability rather than on cost alone any more. Nearshore centres in Eastern Europe and Latin America cost roughly 40% more and clients pay it for time zone overlap. Providers with a single delivery location carry wage and geopolitical exposure together, while those with three can move work rather than negotiate about it with anyone.

Engagement Snapshot From the Field

A live engagement with an industry participant carrying material or product regulatory and market exposure ahead of a defining policy shift, showing how our research translates into a defensible multi-year portfolio strategy.
MARKET MINDS ADVISORY · CLIENT ENGAGEMENT SUMMARY
Computer Engineering Producer Strategic Portfolio Review and Transition Roadmap 2026·Investment Scenario on Computer Engineering Exposure Evaluation 2025-26
CLIENT PROFILE
An industrial equipment manufacturer with approximately 4,200 engineers, of whom about 900 worked on embedded software and control systems (client-reported, unverified by MMA). It used four engineering services providers selected largely on hourly rate, and three consecutive product programmes had run late with quality problems traced to supplier teams rather than to its own engineers. Nobody had examined why.
STRATEGIC CHALLENGE
Engineering services spend approached USD 61 million annually and the board was pressing for reductions (client-reported, unverified by MMA). Procurement proposed consolidating onto the two lowest-rate providers. Nobody had examined whether rate differences explained the delays, or whether team turnover on the supplier side was the actual cause of the recurring quality failures.
MMA APPROACH
MMA measured supplier team continuity across the three delayed programmes rather than comparing rate cards, which the client had already done twice. We reconstructed staffing histories, traced defect origin against engineer tenure, interviewed 26 engineering and procurement staff, and requested attrition disclosure from all four providers directly, which none had offered.
KEY FINDINGS
  1. Supplier attrition across the three delayed programmes ranged between 21% and 34% annually, and the two lowest-rate providers carried the highest turnover by some margin.
  2. Roughly 62% of defects requiring rework originated in work completed within three months of an engineer joining the programme team for the first time.
  3. The highest-rate provider delivered its programme on schedule with team turnover near 9%, and had been shortlisted for removal on cost grounds alone.
  4. No provider contract contained any continuity commitment, so suppliers carried no consequence at all for rotating staff off the client's programmes at any point.
CLIENT PROFILE
An industrial equipment manufacturer with approximately 4,200 engineers, of whom about 900 worked on embedded software and control systems (client-reported, unverified by MMA). It used four engineering services providers selected largely on hourly rate, and three consecutive product programmes had run late with quality problems traced to supplier teams rather than to its own engineers. Nobody had examined why.
STRATEGIC CHALLENGE
Engineering services spend approached USD 61 million annually and the board was pressing for reductions (client-reported, unverified by MMA). Procurement proposed consolidating onto the two lowest-rate providers. Nobody had examined whether rate differences explained the delays, or whether team turnover on the supplier side was the actual cause of the recurring quality failures.
MMA APPROACH
MMA measured supplier team continuity across the three delayed programmes rather than comparing rate cards, which the client had already done twice. We reconstructed staffing histories, traced defect origin against engineer tenure, interviewed 26 engineering and procurement staff, and requested attrition disclosure from all four providers directly, which none had offered.
KEY FINDINGS
  1. Supplier attrition across the three delayed programmes ranged between 21% and 34% annually, and the two lowest-rate providers carried the highest turnover by some margin.
  2. Roughly 62% of defects requiring rework originated in work completed within three months of an engineer joining the programme team for the first time.
  3. The highest-rate provider delivered its programme on schedule with team turnover near 9%, and had been shortlisted for removal on cost grounds alone.
  4. No provider contract contained any continuity commitment, so suppliers carried no consequence at all for rotating staff off the client's programmes at any point.
RECOMMENDED STRATEGY
Phase 1: Rewrite provider contracts to include named team continuity commitments with financial consequences, since no supplier currently carries any consequence at all. Phase 2: Consolidate onto providers demonstrating turnover below 15% rather than onto the lowest rates, and pay the resulting premium deliberately rather than reluctantly. Phase 3: Measure supplier performance on defect origin against engineer tenure, which is the relationship the three delayed programmes actually revealed clearly.
OUTCOME
Annual spend rose to roughly USD 64 million against higher rates, while the following programme delivered on schedule and rework fell by about 47% (client-reported, unverified by MMA). Total cost including internal rework effort fell despite the higher rates, which was the opposite of what procurement had proposed.

Frequently Asked Questions

Foundational context covering the market sizes, CAGR, scope, country, region and competition that inform every finding below. This section is provided to cover basics and most often pre-purchase conversations, answered from the MMA Primary Research Dataset.

What is the current size of the Computer Engineering Market?

The market was worth USD 78.0 billion in 2025 and reaches USD 85.18 billion in 2026. Roughly 67% of engineering hours are delivered outside the client's home market.

How large will the Computer Engineering Market be by 2036?

MMA forecasts USD 205.37 billion by 2036, an expansion of 2.41 times over the forecast period. That represents USD 120.19 billion of incremental annual revenue against 2026.

What is the CAGR for the Computer Engineering Market 2026 to 2036?

The base case is 9.2% compound annual growth, with a bull case at 10.4% and a bear case at 8.0%. Whether assisted tooling erodes billable hours separates the scenarios.

Which segment is growing fastest?

Custom silicon design and verification grows at 13.8%, half again the market rate of 9.2%. Buyers outside the semiconductor industry decided to build their own compute without staffing for it.

Who are the major companies in the Computer Engineering Market?

HCLTech, Capgemini Engineering, Tata Elxsi, Wipro and Cyient lead on measured engineering services revenue. Together they hold roughly 24%, the most fragmented picture in technology services.

Which country is growing fastest?

India grows fastest at 12.4%, holding the largest concentration of semiconductor and embedded design engineers anywhere, though wage inflation is narrowing the original cost advantage.

Report Segmentation Architecture

The full report scope spans multiple orthogonal segmentation dimensions, with cross-tabulated demand data provided for each dimension pair. Coverage extends further to regional breakdowns, trend trajectories, and the competitive detail needed to support segment-level decision-making.

By Primary Market Dimension

  • Custom Silicon Design and Verification
  • Embedded Software and Firmware Engineering
  • Board and System Hardware Design
  • Physical Design and Implementation Services
  • Test, Validation and Compliance Engineering
  • Product Lifecycle and Sustaining Engineering

By End-Use Industry

  • Semiconductor and Fabless Design
  • Cloud and Hyperscale Operators
  • Automotive and Mobility
  • Industrial Equipment and Automation
  • Medical Devices and Healthcare
  • Aerospace, Defence and Telecommunications

By Commercial Dimension

  • Time and Materials Engagements
  • Fixed Price Programmes
  • Outcome and Closure Contracts
  • Dedicated Offshore Delivery Centres
  • Nearshore Delivery Arrangements
  • Build Operate Transfer Agreements

By Region

  • South Asia and Pacific
  • North America
  • East Asia
  • Western Europe
  • Eastern Europe
  • Latin America
  • Middle East and Africa

Scope, Methodology, and Coverage

Every figure in this report is reproducible from documented input assumptions. The scope below maps the historical period, the forecast horizon, the segmentation dimensions, and the countries covered, alongside the underlying primary and qualitative methodology.
Historical Period
2020 to 2025
Forecast Period
2026 to 2036
Base Year
2025 (USD billions; MMA Primary Research Dataset, September 2026)
Market Definition
This market covers outsourced engineering design and development services for computing hardware and embedded systems, spanning custom silicon design and verification, embedded software and firmware engineering, board and system hardware design, physical design and implementation services, test, validation and compliance engineering, and product lifecycle and sustaining engineering. Revenue is measured as engineering services value at supplier level across time-based, fixed price and outcome-based delivery, including dedicated offshore and nearshore centres. Electronic design automation software licences, semiconductor intellectual property licensing, contract electronics manufacturing, information technology infrastructure outsourcing, staffing supply without engineering accountability, and internal client engineering headcount are excluded from scope.
Quantitative Units
USD billions, engineering services revenue at supplier level
Segmentation Dimensions
Engineering discipline, end-use industry, commercial model, region
Regions Covered
South Asia and Pacific, North America, East Asia, Western Europe, Eastern Europe, Latin America, Middle East and Africa
Countries Covered
India, Sri Lanka, Vietnam, Philippines, Malaysia, Singapore, Australia, China, Japan, South Korea, Taiwan, United States, Canada, Mexico, Brazil, Argentina, Colombia, Germany, France, United Kingdom, Netherlands, Sweden, Italy, Poland, Romania, Czechia, Hungary, Israel, United Arab Emirates, Morocco, Egypt
Key Companies Profiled
HCLTech, Capgemini Engineering, Tata Elxsi, Wipro, Cyient, Alten, Akkodis, Sasken Technologies, L&T Technology Services, Tessolve, Mistral Solutions, Sondrel, ASICLAND, Alchip Technologies, Global Unichip, Socionext, eInfochips, KPIT Technologies, Persistent Systems, Infosys
Quantitative Methodology
Primary survey, n=3,800 respondents, Q4 2025, six countries; demand-side model with trade association cross-validation
Qualitative Methodology
47 expert interviews, Q4 2025; applied to validate demand model assumptions, identify emerging dynamics, and assess competitive positioning
Report Format
PDF and XLSX data workbook (Word format preview document)
Publisher
Market Minds Advisory
Report Code
MMA-2026-TEC-101
Published
September 2026
Contact
sales@marketmindsadvisory.com | www.marketmindsadvisory.com

Purchase the full Computer Engineering Market Report (2026 to 2036).

The full MMA report treats computer engineering as the professional services business it actually is, and works through why utilisation and attrition decide margin while rate negotiation decides very little. It sizes the market to 2036 across six engineering disciplines, seven regions and 31 countries, with segment growth rates and regional delivery mechanisms set out throughout. Competitive analysis covers 20 providers assessed on measured engineering services revenue, with moat and risk assessment for the two leaders. The report quantifies compensation cost structure, contract structure economics and margin architecture across three portfolio tiers. It closes with four verdicts and an anonymised industrial manufacturer engagement.
Six engineering disciplines sized through 2036
Seven regions with delivery mechanism analysis
Twenty providers on consistent revenue basis
Utilisation, attrition and blended rate benchmarks
Margin architecture across three portfolio tiers
Anonymised industrial engineering sourcing review engagement

Built For The People Who Decide

From boardroom strategy to bench-side execution, this report is read cover-to-cover by leaders shaping the next decade of their industry, turning demand scenarios, market dynamics and valuation benchmarks into decisions.
CXOs/ Presidents/ VPs/ Managers
M&A and Corporate Development
Strategy Teams and R&D Heads
Procurement and Product Directors
Regulatory and Compliance Leaders
Investor Relations and Equity Analysts