Market Minds Advisory
Computer-aided Engineering Market

Computer-aided Engineering Market: Computer-aided Engineering Market: Solver Licensing, Simulation Expertise Scarcity and Analysis Nobody Trusts 2026 to 2036

Every manufacturer wants more simulation and almost none can hire the people to run it. The software stopped being the constraint about fifteen years ago and the industry still prices as though it were.

Lead Analyst

Published

September 2026

Make Smarter Decisions with Customized Research Insights

Request a free sample report and evaluate market opportunities, growth trends, and competitive dynamics relevant to your business needs.

2025 MARKET VALUE$11.6BMarket Size 2025
2036 FORECAST VALUE$31.5BBase Case , 2026 to 2036
CAGR 2026 TO 20369.5 %Bull 10.8% / Bear 8.3%
INCREMENTAL OPPORTUNITY$18.8BNet 10- year value creation
EXPANSION MULTIPLE2.48x2036 value over 2026 base
Strategic Levers
M&A Pipeline
Regional Outlook
Country Rankings
Competitive Intelligence
Segmental Deep-dive
Call-Us : 91 93563 13602

Executive Snapshot and Market Trajectory.

Every manufacturer wants more simulation and almost none can hire the people to run it. The software stopped being the binding constraint about fifteen years ago, and this industry still prices and positions as though it were the scarce thing. Solver capacity runs near 47% utilisation.
The market reaches USD 12.7 billion in 2026 and USD 31.5 billion by 2036, a 2.48 times expansion at 9.5% annually. Embedded simulation for design engineers grows at 14.3%, half again the market rate of 9.5%, because a tool a designer can run without an analyst removes the actual bottleneck. East Asia holds 32% of spending, above the usual band, on manufacturing concentration. Validation history holds solver positions.
Five vendors hold 61% of spending, and the position rests on solver validation history rather than on any interface or workflow advantage. Ansys, Siemens Digital Industries Software, Dassault Systemes, Altair Engineering and Hexagon lead. Analyst availability decides how much software a manufacturer can actually use. Purchased solver capacity runs at around 47% utilisation across a licence year, and a manufacturer employs 23 design engineers for every dedicated simulation specialist it manages to keep on staff.
Market Definition
This report covers computer-aided engineering software: numerical simulation tools predicting physical behaviour before manufacture. It spans structural and mechanical simulation solvers, computational fluid dynamics, electromagnetic and thermal simulation, multiphysics and systems simulation, embedded simulation delivered inside design tools for non-specialists, and simulation data and process management platforms. It excludes computer-aided design and modelling software, computer-aided manufacturing and toolpath software, product lifecycle management systems, physical testing equipment, and engineering consultancy services delivered as projects.
Base Year Value
$11.6B in 2025 (MMA Primary Research Dataset, September 2026)
Forecast Period
2026 to 2036, eleven discrete annual values
CAGR
9.5% base case. Bull 10.8%. Bear 8.3%.
Fastest Growth Segment
Embedded Simulation For Design Engineers: 14.3% CAGR
Fastest Growth Country
India: 15.9% CAGR
Fastest Growth Region
South Asia and Pacific: 11.7% CAGR
Largest Region
East Asia: 32% of 2025 global value
Market Leaders
Ansys, Siemens Digital Industries Software, Dassault Systemes, Altair Engineering and Hexagon lead on computer-aided engineering software revenue. Source: MMA Analysis.
Primary Survey
n=3,800 procurement and R&D decision-makers, Q4 2025, six countries
Methodology
Demand-side build-up, cross-validated against public data, 47 expert interviews

Computer-aided Engineering Market Forecast Scenarios

computer-aided-engineering-market-size-forecast-scenario-1790000715227
Between 2020 and 2025 the category compounded at 8.4%, and licence revenue grew faster than usage did. Manufacturers bought capacity they could not staff, because the software was easier to approve than the headcount required to operate it. Vendors reported growth while a considerable share of purchased solver capacity sat idle, and several customers reached renewal having never used what they had already paid for.
The base case holds 9.5% on three mechanisms. Embedded simulation keeps putting analysis into the hands of design engineers who outnumber specialists heavily, which converts a staffing constraint into a software one. Electrification and thermal management keep demanding multiphysics work that hand calculation cannot approach. And manufacturing capacity additions in Asia keep creating engineering organisations that buy simulation from the outset rather than adding it later. Those three mechanisms run largely independently of one another.
The bull case at 10.8% assumes embedded simulation accuracy reaches the point where design engineers act on results without analyst review, which would remove the bottleneck rather than merely widen it. The bear case at 8.3% is procurement rationalisation, where manufacturers audit idle solver capacity and cut licences they were never able to staff in the first place.

The People Are The Constraint

Purchased solver capacity runs at around 47% utilisation across a licence year, and the reason is people rather than demand. A typical manufacturer employs 23 design engineers for every dedicated simulation specialist, and filling a vacant analyst position takes around eight months. Manufacturers keep buying capacity they cannot staff because software is easier to approve than headcount, and vendors keep reporting the resulting licence growth as adoption.
TOP FIVE CONCENTRATION61%Held by vendors whose solvers carry decades of validation history
SOLVER LICENCE UTILISATION47%Purchased simulation capacity actually consumed across a licence year
DESIGN ENGINEERS PER ANALYST23Designers for every dedicated simulation specialist in a typical manufacturer
ANALYST RECRUITMENT PERIOD8 monthsTypical time to fill a vacant simulation specialist position
RESULTS REQUIRING REVIEW79%Embedded simulation output still checked by a specialist before use
VALIDATION CORRELATION EFFORT14%Engineering time spent correlating simulation against physical test results
Embedded simulation is the obvious answer and it is not there yet. Around 79% of embedded simulation output still gets checked by a specialist before anybody acts on it, which means the bottleneck has been widened rather than removed. Embedded simulation for design engineers grows at 14.3% against 9.5% for the market, and the gap between that growth and genuine autonomy is where the next decade of this category will be decided.
Validation history is what actually holds position. Roughly 14% of engineering time goes to correlating simulation against physical test, and a solver with decades of correlation behind it carries credibility a newer one cannot claim at any price. Five vendors hold 61% of spending on that basis rather than on interface quality.
"I have sat in procurement meetings where a manufacturer bought forty more solver seats while three analyst positions had been open for a year. Nobody in the room found that strange. The licence goes through capital approval and the headcount goes through a hiring freeze, and the simulation never happens either way."
Director, Engineering Simulation and Design Technology Practice · MMA Technology Practice · September 2026

Market Trends

Analyst Scarcity Caps What Software Can Deliver

Purchased solver capacity runs near 47% utilisation because a typical manufacturer employs 23 design engineers for every simulation specialist and filling a vacant analyst role takes around eight months. Manufacturers keep buying capacity they cannot staff, since a licence clears capital approval more easily than headcount clears a hiring freeze. Vendors report that licence growth as adoption, and a considerable share of customers reach renewal having never used what they already paid for. Procurement functions examining consumption at renewal find exactly that, which creates renewal risk entirely disconnected from product quality or customer satisfaction.
Market Impact: Ratio runs 23 designers per analyst

Embedded Simulation Widened The Bottleneck Without Removing It

Around 79% of embedded simulation output is still checked by a specialist before anybody acts on it, which means design engineers can now generate results faster than analysts can review them. Embedded simulation grows at 14.3% against 9.5% for the market on that promise. The gap between generating results and trusting them is where this category will be decided, and vendors claiming the bottleneck is solved are describing an outcome nobody has reached. Closing the gap requires deciding what the product will refuse to do, which capability-led vendors find genuinely difficult to accept internally.
Market Impact: India compounds at 15.9% yearly

Market Opportunities and Growth Drivers

Electrification Demands Multiphysics Nobody Can Hand Calculate

Battery thermal behaviour, electromagnetic interference and structural response under new load cases all interact in ways that hand calculation and single-physics analysis cannot approach at all. That forces simulation into programmes that previously relied on physical prototypes and engineering judgement. Multiphysics work also demands the most experienced analysts, which collides directly with the 23 design engineers per specialist ratio that already constrains what manufacturers can execute. Manufacturers therefore buy multiphysics capability they can only partly staff, and the segment grows on programme necessity rather than on any comfortable expansion of engineering capacity anywhere.
Market Impact: Utilisation sits at just 47%

Asian Engineering Capacity Buys Simulation From The Outset

India compounds at 15.9%, ahead of every other market, because engineering organisations are being built rather than maintained and they specify simulation from the start rather than adding it to established practice. East Asia holds 32% of spending on the same mechanism at larger scale. Those organisations also train analysts internally rather than competing for scarce experienced hires, which partly avoids the recruitment constraint mature markets face. Indian engineering services firms also perform simulation for manufacturers elsewhere, which concentrates analyst capability well beyond what domestic manufacturing alone would support. Training beats hiring here.
Market Impact: Correlation absorbs 14% of time

Market Restraints and Challenges

Idle Licence Capacity Invites Procurement Rationalisation

Solver licence utilisation near 47% is visible to any procurement function that examines it, and manufacturers under cost pressure increasingly do. The root cause is that licences were bought against ambition rather than against staffed capability. Commercially this creates renewal risk disconnected from product quality. Mitigation runs through usage reporting that vendors surface proactively, through flexible token licensing that matches consumption, and through embedded simulation that lifts utilisation by widening the user base. None of those creates analysts; they align what is purchased with what can realistically be consumed. Alignment is the only lever.
Market Impact: Utilisation runs near 47% only

Validation Burden Slows Any Solver Substitution

Roughly 14% of engineering time goes to correlating simulation against physical test, and a manufacturer switching solvers must repeat that correlation before trusting results. The root cause is that certification and internal sign-off rest on demonstrated correlation rather than on solver reputation. Commercially this entrenches incumbents heavily. Mitigation runs through correlation transfer studies, through solver benchmarking against published cases, and through entry on new programmes where no correlation history exists yet. New programmes are the only point at which solver selection is genuinely open to a competitor at all. Timing matters more than merit.
Market Impact: Some 79% still need review
3 additional market trends, 4 additional growth drivers, and 2 additional restraints and challenges are covered in the full report. Contact sales@marketmindsadvisory.com to access the complete intelligence.

Segment CAGR and Growth Architecture

Segmentation follows simulation discipline and delivery model, since each carries quite different expertise requirements, validation burden and licensing behaviour. Six classes cover the market: embedded simulation for design engineers, multiphysics and systems simulation, computational fluid dynamics, structural and mechanical solvers, electromagnetic and thermal simulation, and simulation data and process management. Industry and licensing route are separate dimensions handled elsewhere here.
computer-aided-engineering-market-market-share-analysis-1790000715765

Embedded Simulation For Design Engineers

Embedded simulation for design engineers grows at 14.3%, half again the market rate of 9.5%, because a manufacturer employs 23 designers for every simulation specialist and putting analysis in the hands of the larger group addresses the actual constraint. The promise is not yet fully delivered: around 79% of embedded output still gets checked by a specialist before anybody acts on it, which widens the bottleneck rather than removing it. Closing that gap is where the next decade of competitive position in this category will be decided. Whoever reaches genuine design engineer autonomy first takes a market that has been waiting fifteen years for it. Nobody has managed it yet at any scale.
CAGR 14.3%

Multiphysics And Systems Simulation

Multiphysics and systems simulation compounds at 12.1% because electrification forces thermal, electromagnetic and structural behaviour to be analysed together rather than separately, and hand calculation cannot approach those interactions at all. This work demands the most experienced analysts available, which collides directly with the scarcity constraining everything else in this market. Manufacturers therefore buy multiphysics capability they can only partly staff, and the segment grows on programme necessity rather than on any comfortable expansion of engineering capacity. Physics domains have to be coupled that individual solver teams originally built entirely separately, which is why incumbents find this work harder to execute than their own product breadth suggests. Necessity rather than efficiency drives it.
CAGR 12.1%
Full segment breakdown across 6 segments available in the complete report.

Regional Architecture and Country Demand Map

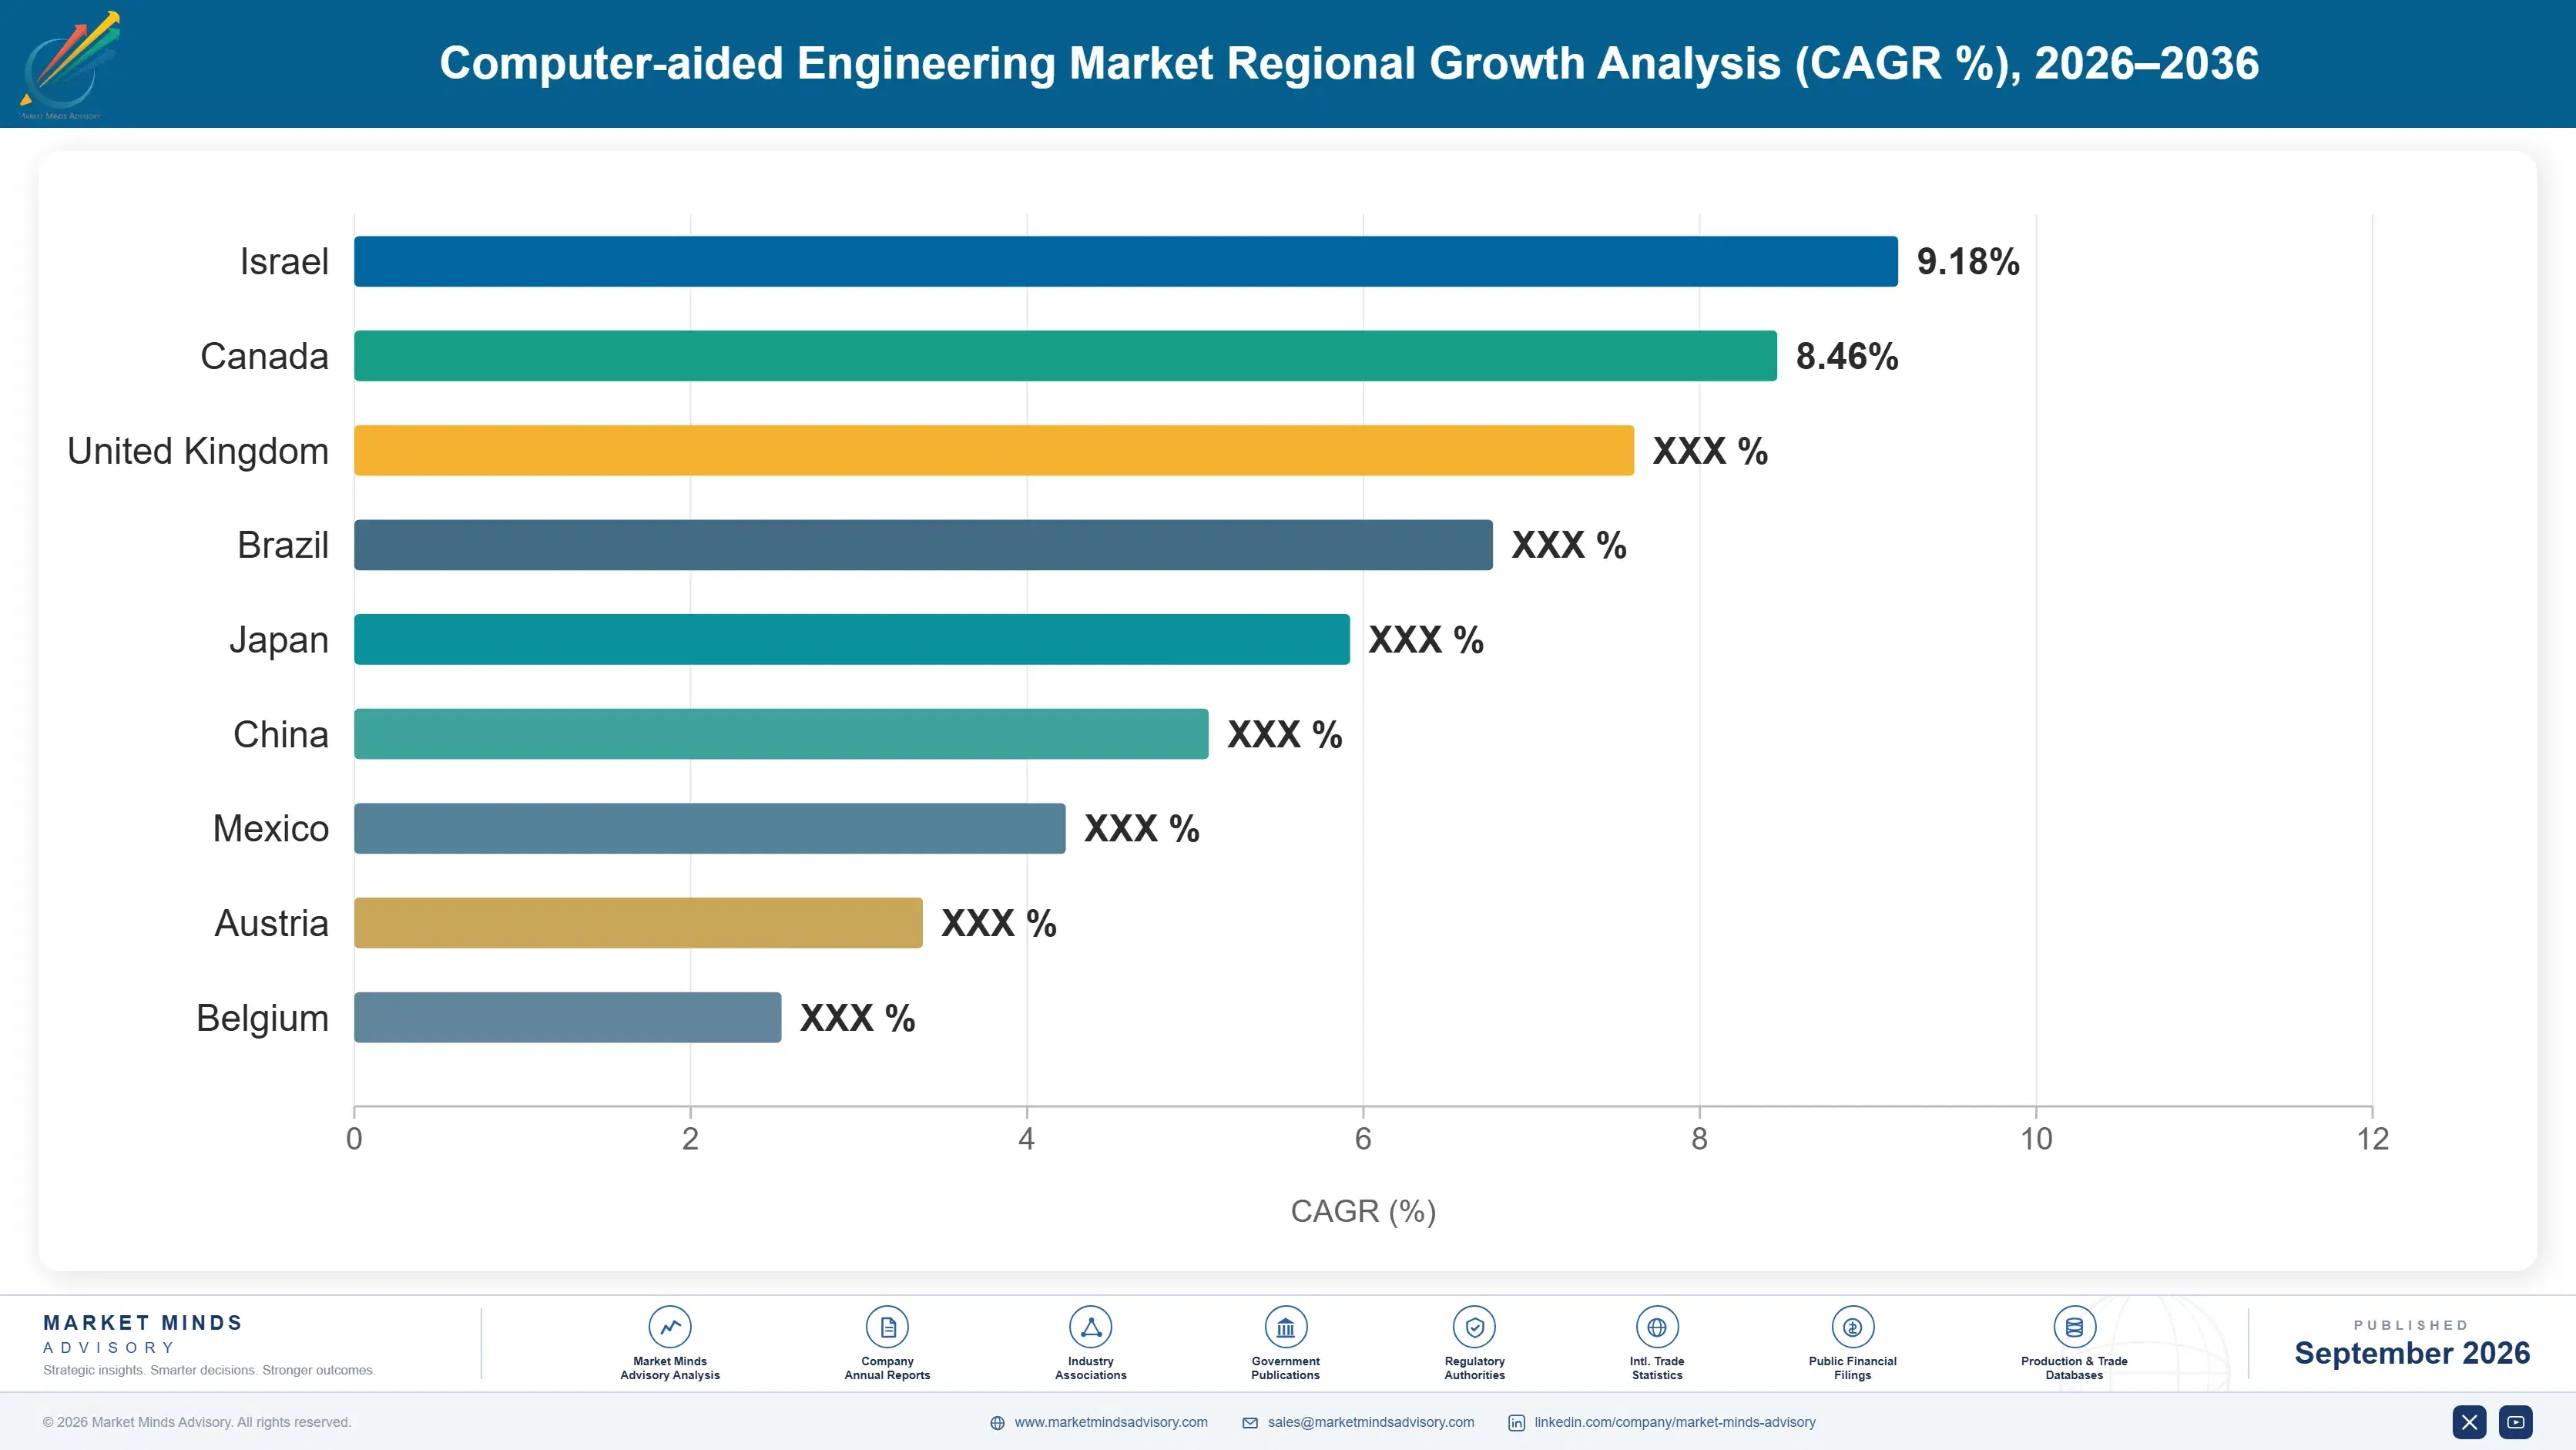
East Asia holds 32% of spending, above the usual band, because manufacturing engineering capacity concentrates there and new organisations specify simulation from the outset. North America follows at 24% on aerospace, automotive and defence validation depth. India compounds fastest at 15.9% on new engineering capacity.

East Asia

East Asia takes 32% of spending, above the 30% band ceiling, because manufacturing engineering capacity concentrates here and organisations built recently specify simulation from the outset rather than adding it to established practice. Chinese, Japanese and South Korean automotive and electronics manufacturers all run substantial internal analyst groups, which lifts licence utilisation above the 47% global figure. Analyst training happens internally rather than through competitive hiring. Growth at 10.5% runs above the global rate on engineering capacity addition. Regional manufacturers also correlate solvers against their own physical test programmes, which builds the validation history that makes incumbent positions difficult to displace later on. Utilisation runs above the global figure. Displacement is correspondingly rare.
Share: 32% | CAGR: 10.5% (2026 to 2036)

North America

North America accounts for 24% of spending, where aerospace, automotive and defence programmes carry certification obligations that make validation history decisive in solver selection. Ansys and Altair Engineering both built positions here on exactly that basis. Analyst scarcity is most acute in this region, with recruitment periods running beyond the eight month global average and licence utilisation correspondingly poor. Growth at 10.0% sits above the global rate on embedded simulation adoption rather than on any analyst capacity expansion. Certification obligations here make validation history decisive in a way commercial programmes elsewhere never require, which entrenches incumbents further than anywhere else. Recruitment periods here exceed the global average. Embedded adoption is fastest here.
Share: 24% | CAGR: 10.0% (2026 to 2036)
Regional intelligence for 5 additional markets available in the complete report: Western Europe, South Asia and Pacific, Latin America, Middle East and Africa, Eastern Europe. Contact sales@marketmindsadvisory.com.
computer-aided-engineering-market-country-cagr-analysis-1790000716296

Where Simulation Revenue Is Won

Analyst scarcity rather than software capability caps what manufacturers can execute, idle licence capacity invites procurement audits, and validation history rather than interface quality holds solver positions. The four levers below follow those conditions rather than any argument about numerical method sophistication. Each addresses a commercial condition rather than a technical one. Method quality comes last.

Sell Analyst Capacity Alongside Solver Capacity

Licence utilisation near 47% exists because manufacturers employ 23 designers for every specialist and cannot fill vacancies inside 8 months. Vendors supplying trained capacity alongside software convert a licence a customer cannot use into one they can. That is a services attach most software vendors resist on margin grounds, and it protects renewals that idle capacity otherwise loses when procurement examines what was actually consumed. A licence nobody can operate produces no value at renewal, whatever the contract says about entitlement. Margin objections miss the renewal risk. Idle capacity loses renewals.
Market Impact: Utilisation now runs near just 47% each year

Report Usage Before Procurement Discovers It

Solver utilisation near 47% is visible to any procurement function that looks, and manufacturers under cost pressure increasingly do look. Vendors surfacing usage proactively and proposing token licensing that matches consumption reach the conversation first and shape it. Those who wait are defending a renewal against a number the customer discovered independently, which is a considerably worse position than having raised it themselves. Token licensing matched to consumption gives procurement something constructive to move toward rather than simply a number to cut. Raising it first is far better. Shaping it beats defending it.
Market Impact: Renewal risk now covers 47% of idle capacity

Close The Gap Between Generating And Trusting Results

Around 79% of embedded simulation output still gets checked by a specialist, which means design engineers generate results faster than analysts can review them. Vendors closing that gap through validated templates and bounded application scope remove the bottleneck rather than widening it. Whoever reaches genuine design engineer autonomy first takes a market that has been waiting fifteen years for it, and the current 14.3% growth understates what that would produce. The current 14.3% growth understates what genuine autonomy would produce. Bounded scope is the mechanism. Templates carry the validation. Scope discipline decides it.
Market Impact: Fully 79% of all output still needs review

Enter On New Programmes Without Correlation History

Roughly 14% of engineering time goes to correlating simulation against physical test, and a manufacturer switching solvers must repeat that work before trusting anything. Displacing an incumbent on an established programme therefore almost never happens. New programmes carry no correlation history, which is the only point at which solver selection is genuinely open, and vendors timing entry to programme starts reach decisions others cannot influence. Timing entry to programme starts reaches decisions that no commercial argument can influence afterwards, which makes programme calendars more useful than any competitive comparison. Displacement almost never happens.
Market Impact: Correlation now absorbs a full 14% of time

Who Controls the Margin Pool

Five vendors hold 61% of computer-aided engineering spending, and that position rests on solver validation history rather than on interface, workflow or numerical method advantage. Ansys, Siemens Digital Industries Software, Dassault Systemes, Altair Engineering and Hexagon lead. All participants are assessed on computer-aided engineering software revenue rather than on broader design, lifecycle or measurement businesses they also operate. Concentration has held for years, since correlation history accumulates only through programmes actually run.
Competition runs on validation credibility and programme timing far more than on solver capability, which converges across serious vendors. The second dimension is embedded simulation delivery, because that is where user counts expand and where the analyst constraint is either widened or genuinely addressed depending on how well the vendor bounds the application scope. Numerical method quality competes a distant third behind both of those.

Pressure is emerging from open source solvers in academic and services use, which reach organisations that cannot fund commercial licences. Rankings shift where new engineering organisations specify from scratch and where electrification forces multiphysics, particularly across India, China and Western Europe. Vendors concentrated among dedicated specialists carry the most exposure to a population that recruitment cannot expand.
computer-aided-engineering-market-company-positioning-matrix-1790000716820

Competitive Moat and Risk Dimensions

ANSYS

Moat: Solver Validation History

Ansys holds correlation history across decades of certified aerospace, automotive and electronics programmes, which matters because roughly 14% of engineering time goes to correlating simulation against physical test. A manufacturer switching solvers repeats that work before trusting any result. Competitors with equivalent numerical capability and no correlation record cannot displace an incumbent on an established programme at all.
ANSYS

Risk: Specialist User Concentration

Validation depth serves dedicated analysts, and that population is capped by a ratio of 23 designers per specialist that recruitment cannot fix inside eight months. Growth sits with embedded simulation reaching the larger design population instead. A position strong among specialists grows only as fast as specialist headcount does, which is barely at all.
ALTAIR ENGINEERING

Moat: Flexible Licensing Model

Altair built token-based licensing that lets customers consume across solvers rather than buying dedicated seats, which addresses utilisation near 47% more directly than any competitor's pricing does. That model reaches procurement functions examining idle capacity and gives them something to move toward. It also lowers the barrier to using a second solver alongside an incumbent on the same programme.
ALTAIR ENGINEERING

Risk: Validation Depth Gap

Licensing flexibility does not substitute for correlation history on certified programmes, where sign-off rests on demonstrated agreement with physical test rather than on commercial terms. Customers with certification obligations weigh validation above pricing every time. A model strong on consumption economics and thinner on programme correlation reaches the less regulated half of the market.

Players Tracked

Prominent Players

Ansys
Siemens Digital Industries Software
Dassault Systemes
Altair Engineering
Hexagon

Other Key Players

Autodesk
PTC
MSC Software
COMSOL
ESI Group
Cadence Design Systems
Synopsys
Bentley Systems
Aspen Technology
Flexcompute
SimScale
OnScale
Luminary Cloud
Cascade Technologies
Beta CAE Systems

Recent Developments

FEBRUARY 2025

Manufacturers Audit Idle Solver Licence Capacity

Manufacturing procurement functions increasingly audited solver licence utilisation during renewal, a procurement development rather than any corporate transaction. Utilisation near 47% is visible to anybody who examines consumption records, and licences bought against ambition rather than staffed capability are what those audits reliably find first.
Signal: Vendors surfacing usage first now shape the renewal conversation that procurement would otherwise open by itself.
AUGUST 2024

Embedded Simulation Adoption Outpaces Analyst Review Capacity

Design engineer adoption of embedded simulation grew faster than specialist review capacity across several manufacturers, an operational development rather than any acquisition. Around 79% of embedded output still requires specialist checking, so results are now generated considerably faster than anybody available can validate them for use.
Signal: Widening a bottleneck is not the same as removing it, and customers have noticed the difference.
JUNE 2025

Electrification Programmes Force Multiphysics Into Standard Practice

Vehicle and industrial electrification programmes moved multiphysics simulation from specialist exception into standard engineering practice, a technical development rather than any corporate event. Thermal, electromagnetic and structural behaviour interact in ways that hand calculation cannot approach, and the work demands the most experienced analysts available anywhere.
Signal: Necessity rather than efficiency is now what drives the fastest growing simulation work almost everywhere today.

What Simulation Software Costs

Research and development absorbs roughly 27% of vendor cost in this category, weighted toward solver physics and numerical methods that require specialist doctoral-level staff. Sales and marketing take around 31%, since enterprise engineering software sells through long technical evaluations. Customer support and applications engineering absorb about 18%, and cloud compute for hosted solving takes most of the remaining balance.
Specialist engineering salaries rose sharply through 2023 and 2024 as manufacturers, vendors and services firms competed for the same scarce simulation expertise across every major market. Ansys Annual Report 2024 and Hexagon Annual Report 2024 both record engineering talent cost and cloud infrastructure among principal operating variables. Vendors with established graduate development programmes absorbed considerably less of that increase than those hiring experienced specialists competitively.

The competitive disadvantage mechanism is applications engineering load rather than development cost. A vendor whose product requires heavy customer hand-holding carries support cost scaling with account count, while one delivering bounded embedded workflows does not. Exposure concentrates among vendors selling deep specialist tools, since those are precisely the products that need applications engineers the market cannot supply at any reasonable price.
computer-aided-engineering-market-cost-volatility-analysis-1790000717017

Develop Analysts Internally Rather Than Hiring Competitively

Specialist engineering salaries rose sharply as manufacturers, vendors and services firms competed for the same scarce expertise across every market. Graduate development programmes cost less per analyst and produce staff who know the products from the outset. The programme takes years to pay back, which is why competitors under quarterly pressure keep bidding for experienced hires instead.

Bound Embedded Workflows To Reduce Support Load

Applications engineering absorbs about 18% of vendor cost and scales with account count rather than with revenue in most vendor portfolios. Embedded workflows with bounded application scope need far less hand-holding than open specialist tools do. The engineering discipline is in deciding what the product will refuse to do, which vendors selling capability breadth find genuinely difficult to accept.

Match Compute Pricing To Actual Solving Consumption

Cloud compute for hosted solving is the fastest growing cost line and varies enormously by customer, since simulation workloads are spiky rather than steady across any licence year. Consumption-based pricing passes that variance through rather than absorbing it. It also matches how customers experience the work, which makes renewal conversations about value delivered instead of capacity purchased.

Portfolio Architecture for Margin Defence

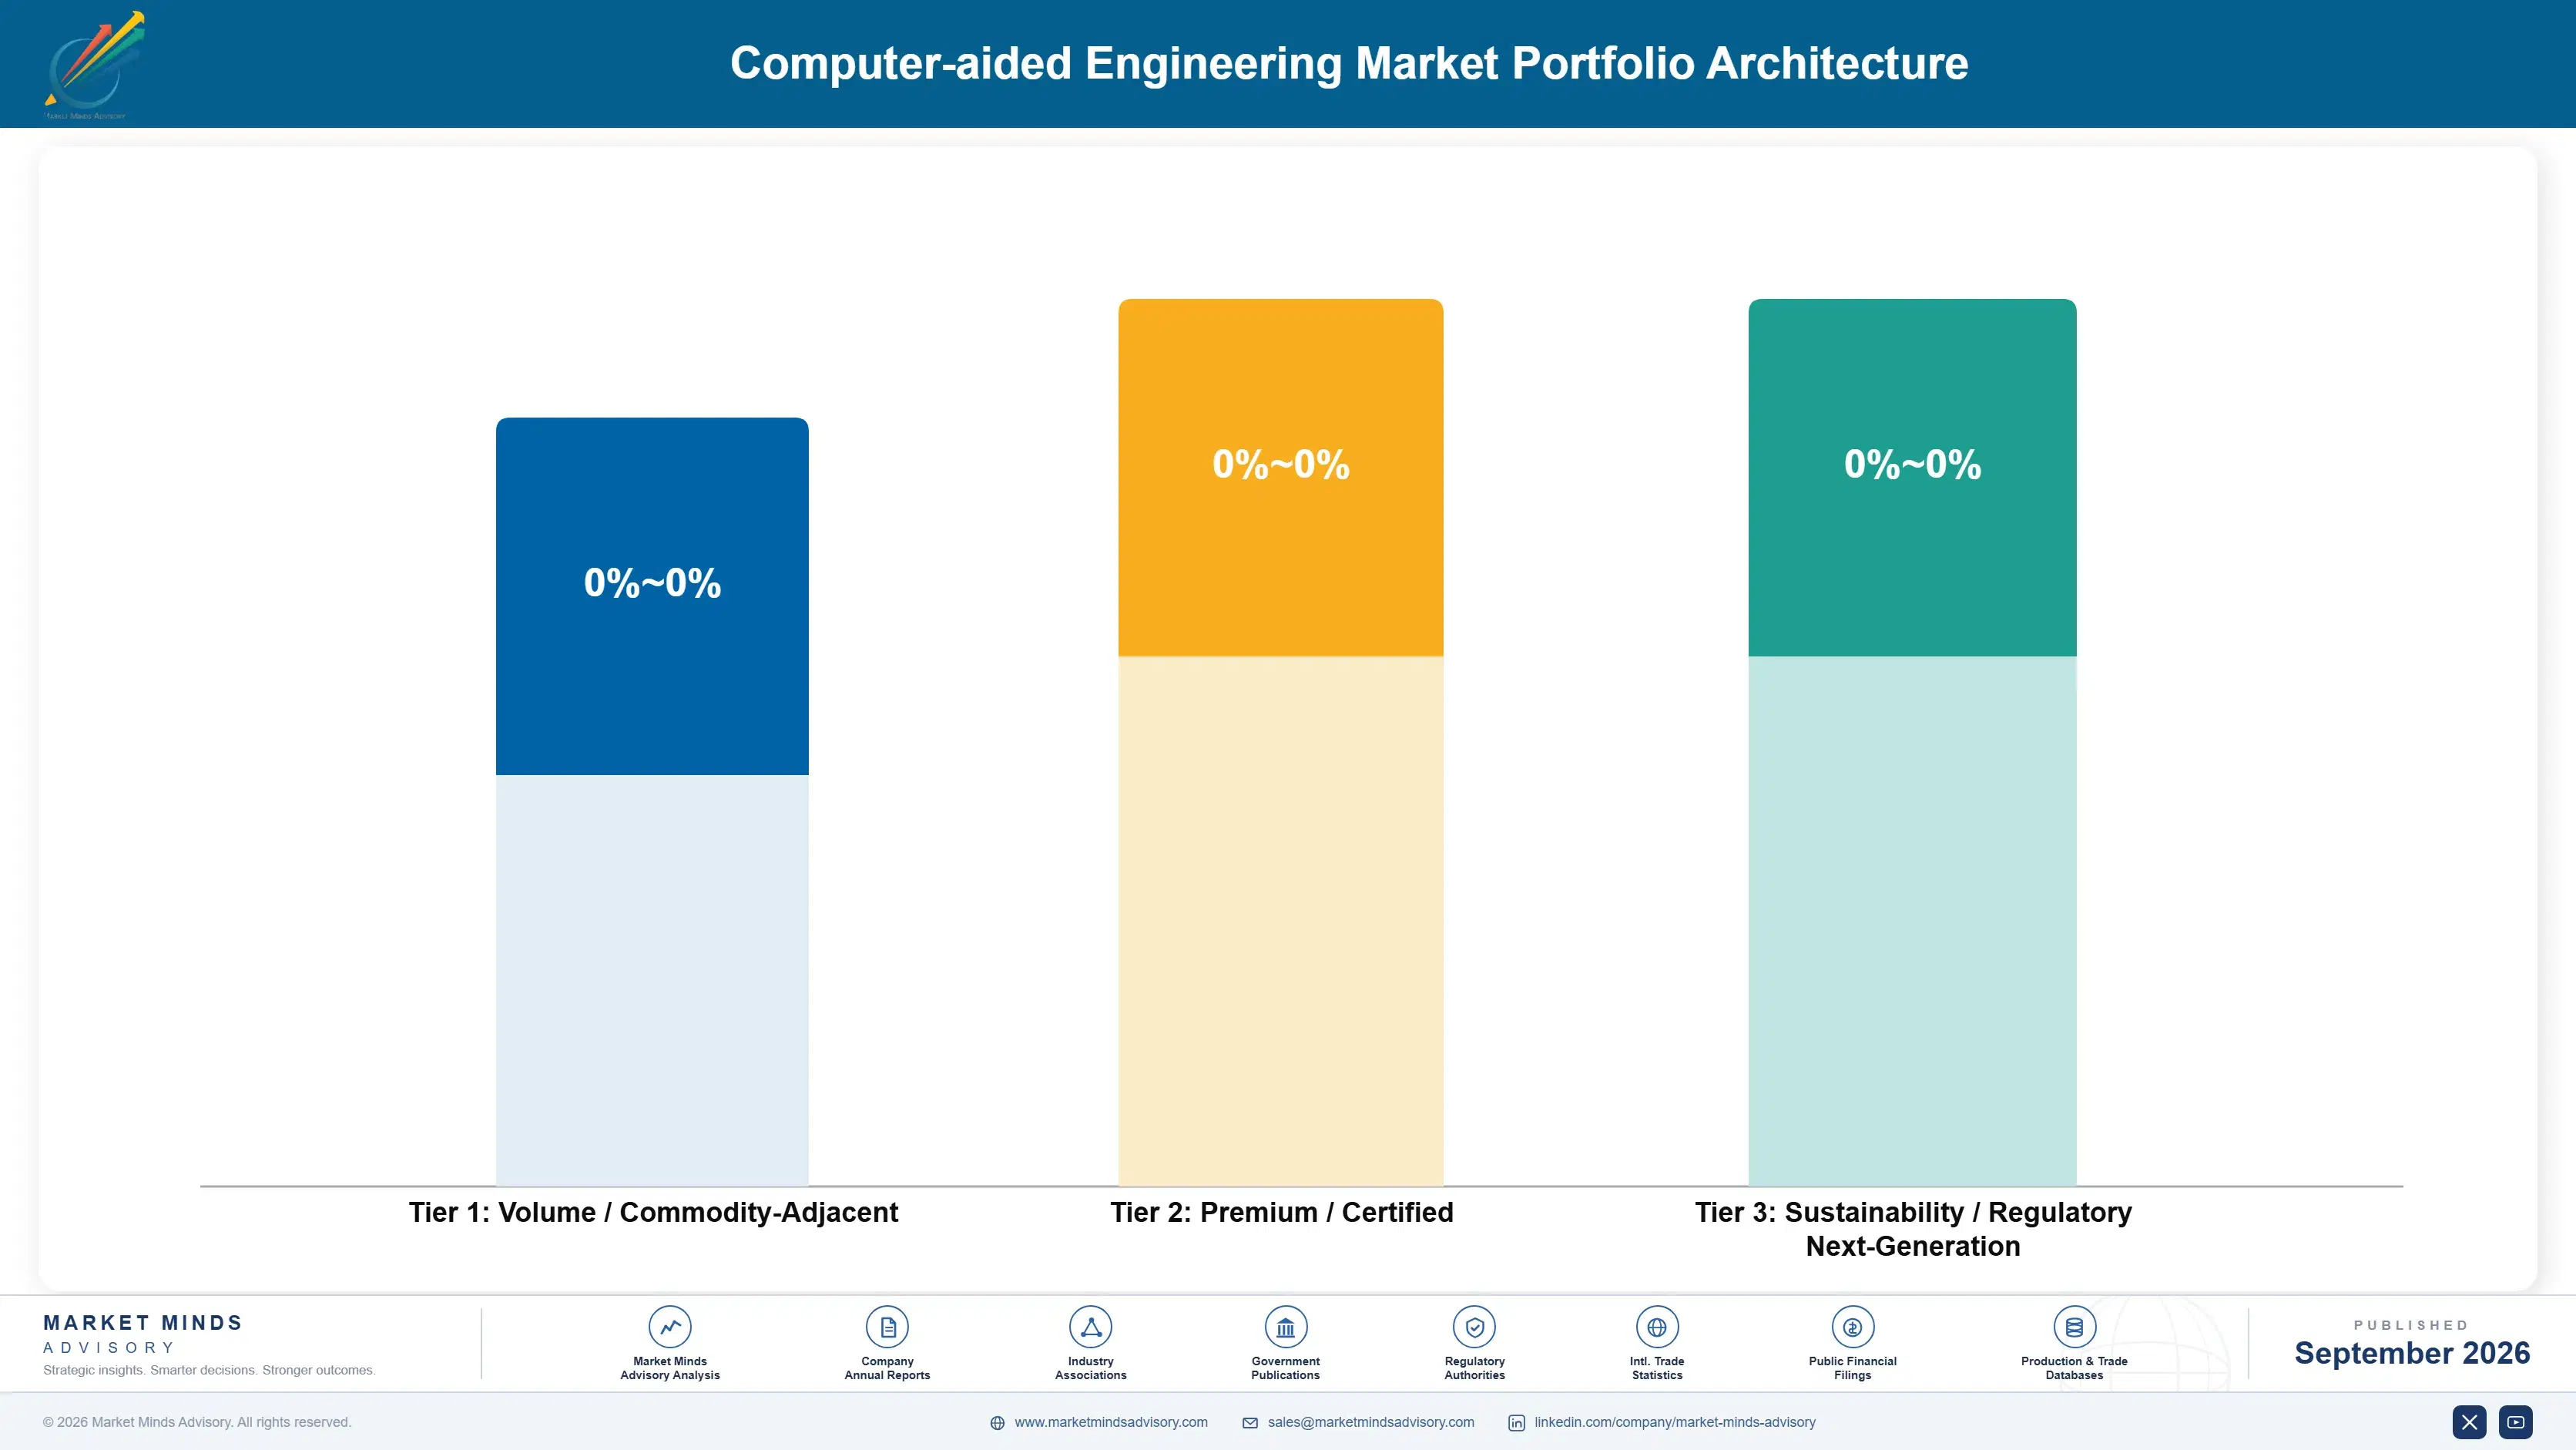
Margin architecture separates on expertise dependency rather than on solver difficulty. Simulation data and process management earns least, since it competes against lifecycle management platforms and carries integration services. Structural and computational fluid dynamics solvers sit above on validation credibility. Embedded simulation, multiphysics and electromagnetic tools earn most, because each combines scarce capability with demand that programme requirements rather than budgets create.
The volume versus premium tension runs between embedded design tools and specialist solvers, which reward opposite product decisions entirely. Embedded requires bounded scope, low support load and pricing a design population can absorb. Specialist requires depth, applications engineering and pricing that only dedicated analysts justify. Vendors attempting both frequently ship an embedded product too open to support cheaply and too shallow for specialists.

High-value pools concentrate in embedded simulation and in multiphysics, and neither is reached through solver development alone. Embedded requires deciding what the product will refuse to do, which capability-led vendors resist. Multiphysics requires coupling physics domains that individual solver teams built separately. Both explain why five vendors hold 61% while the growth sits in the two areas incumbents find hardest to execute internally.

Volume / Commodity-Adjacent

Simulation data and process management platforms, which compete against product lifecycle management systems and carry integration services scaling directly with each deployment. The thirteen point spread separates vendors delivering configured products from those handling every deployment as a bespoke integration project.
Gross Margin: 48% to 61%

Premium / Certified

Structural and mechanical solvers and computational fluid dynamics, where validation credibility on certified programmes determines selection rather than any pricing comparison between vendors. The twelve point spread tracks applications engineering load per account against products needing less hand-holding.
Gross Margin: 66% to 78%

Sustainability / Regulatory / Next-Generation

Embedded simulation for design engineers, multiphysics and systems simulation and electromagnetic and thermal tools, each combining scarce capability with demand created by programme requirements. The ten point spread reflects how tightly each vendor bounds embedded scope to reduce support load.
Gross Margin: 81% to 91%
computer-aided-engineering-market-portfolio-architecture-1790000717521

High-value Sub-segments and Strategic Watch-out

Embedded Simulation For Design Engineers

Grows at 14.3% because manufacturers employ 23 designers for every specialist and the larger group is where capacity sits. The ten point spread reflects scope discipline. Around 79% of output still needs specialist review before anybody acts on it. Autonomy is the unsolved problem. Review capacity binds.
Gross Margin: 81% to 91%

Multiphysics And Systems Simulation

Grows at 12.1% because electrification forces thermal, electromagnetic and structural behaviour to be analysed together rather than separately. The ten point spread reflects physics coupling depth. The work demands the most experienced analysts, which are scarcest of all. Programme necessity drives it. Coupling depth decides.
Gross Margin: 81% to 91%

Computational Fluid Dynamics

Grows at 9.1% on thermal management, aerodynamics and process applications across manufacturing and energy engineering. The twelve point spread reflects applications engineering load. Validation history on certified programmes decides selection more than solver speed does. Correlation history decides these awards outright. Speed matters less. Speed matters less.
Gross Margin: 66% to 78%

Simulation Data And Process Management

Grows at 6.4%, slowest of the six classes, competing against lifecycle management platforms that manufacturers already run for other reasons. The thirteen point spread reflects deployment configurability. Integration services consume much of what the licence appears to earn. Lifecycle platforms compete directly. Services consume the margin.
Gross Margin: 48% to 61%

Why Correlation Holds Solvers

The annuity here is correlation history rather than any licence agreement. A solver correlated against physical test on a certified programme supplies that programme for its whole life, because switching means repeating roughly 14% of engineering time spent establishing agreement in the first place. Sign-off rests on demonstrated correlation rather than on solver reputation. Manufacturers decline that work almost every time it is proposed to them.
Depth varies by whether the programme carries certification obligations. An aerospace or medical device programme cannot change solvers without regulatory consequence, which makes those positions effectively permanent. A consumer product programme can move if the commercial case is strong. Vendors concentrated in certified industries hold accounts that competitors do not seriously attempt, and vendors elsewhere face renewal contests every cycle.

The buyer has changed more than the software has. A simulation manager evaluated solver capability and correlation record against a programme requirement. A procurement function evaluates licence utilisation against what was purchased and finds 47%. A design engineering leader evaluates whether analysis can happen without waiting eight months for a specialist. The last two buyers are newer and neither one weighs solver capability heavily.
computer-aided-engineering-market-end-use-penetration-index-1790000718041

What Wins Simulation Accounts

These are among the four positions where our research anticipates prominent divergence between winners and laggards over the coming forecast period. Each is grounded in the demand model, the regulatory perimeter, and the announced capacity pipeline.
01 / CAPACITY ATTACH STRATEGY

Sell The People With The Licence

Licence utilisation near 47% exists because manufacturers employ 23 designers for every specialist and cannot fill a vacant analyst role inside eight months of trying. Vendors supplying trained capacity alongside software convert a licence the customer cannot use into one they can actually consume. That is a services attach most software vendors resist on margin grounds, and it protects exactly the renewals that idle capacity otherwise loses when procurement finally examines consumption against what was actually entitled across the licence year.
02 / USAGE TRANSPARENCY DISCIPLINE

Show The Numbers Before Procurement Finds Them

Solver utilisation near 47% is visible to any procurement function that examines consumption records, and manufacturers under cost pressure are increasingly examining them at renewal. Vendors surfacing usage proactively and proposing consumption-matched licensing reach that conversation first and get to shape what it concludes. Those who wait defend a renewal against a number the customer discovered independently, which is a materially worse position to argue from without any prior warning or opportunity to respond from the vendor beforehand or any chance to prepare a response.
03 / AUTONOMY GAP CLOSURE

Make Results Trustworthy Without An Analyst

Around 79% of embedded simulation output still gets checked by a specialist, which means design engineers now generate results considerably faster than anybody available can review them for use. Vendors closing that gap through validated templates and bounded application scope remove the bottleneck rather than widening it further. Whoever reaches genuine design engineer autonomy first takes a market that has been waiting fifteen years for exactly that, and the current growth rate understates it considerably against what autonomy would produce.
04 / PROGRAMME ENTRY TIMING

Bid New Programmes, Not Established Ones

Roughly 14% of engineering time goes to correlating simulation against physical test, and switching solvers on an established programme means repeating all of that before anybody trusts a result. Displacement therefore almost never happens whatever the commercial or technical case looks like on paper. New programmes carry no correlation history at all, which is the only moment solver selection is genuinely open to a competitor, which makes programme calendars more valuable than competitive analysis for any vendor attempting entry at that moment.

Engagement Snapshot From the Field

A live engagement with an industry participant carrying material or product regulatory and market exposure ahead of a defining policy shift, showing how our research translates into a defensible multi-year portfolio strategy.
MARKET MINDS ADVISORY · CLIENT ENGAGEMENT SUMMARY
Computer-aided Engineering Producer Strategic Portfolio Review and Transition Roadmap 2026·Investment Scenario on Computer-aided Engineering Exposure Evaluation 2025-26
CLIENT PROFILE
An industrial equipment manufacturer holding substantial solver licences across three vendors while three analyst positions had stayed vacant for more than a year. Engineering leadership had requested additional licence capacity for an electrification programme, without anybody establishing how much of the existing capacity was actually being consumed each year. Nobody had measured consumption against entitlement at all.
STRATEGIC CHALLENGE
Engineering wanted more licences for the electrification programme's multiphysics requirements. Procurement wanted the software budget cut, having noticed renewals rising while headcount stayed flat. Nobody had measured consumption against entitlement, and two of the three vendor renewals fell within the following two quarters alongside the new licence request. Both positions assumed software was the binding constraint.
MMA APPROACH
MMA measured solver consumption against licensed entitlement across all three vendors, and mapped which analyses were waiting on analyst availability rather than on software. We assessed whether embedded simulation could move routine work to design engineers and what review capacity that would require. Work drew on 47 expert interviews conducted in Q4 2025 with manufacturers, simulation vendors and engineering services firms.
KEY FINDINGS
  1. Consumption ran at roughly 41% of licensed entitlement across the 3 vendors, and the electrification programme could have been run inside existing capacity.
  2. Analyses were queued behind analyst availability rather than software availability in almost every single case the review examined across the full year.
  3. Routine structural checks representing around a third of analyst workload could move to design engineers with bounded embedded workflows (client-reported, unverified by MMA).
  4. Consolidating from 3 vendors to 2 would have released budget sufficient to fund 2 additional analyst positions at prevailing regional salary levels.
CLIENT PROFILE
An industrial equipment manufacturer holding substantial solver licences across three vendors while three analyst positions had stayed vacant for more than a year. Engineering leadership had requested additional licence capacity for an electrification programme, without anybody establishing how much of the existing capacity was actually being consumed each year. Nobody had measured consumption against entitlement at all.
STRATEGIC CHALLENGE
Engineering wanted more licences for the electrification programme's multiphysics requirements. Procurement wanted the software budget cut, having noticed renewals rising while headcount stayed flat. Nobody had measured consumption against entitlement, and two of the three vendor renewals fell within the following two quarters alongside the new licence request. Both positions assumed software was the binding constraint.
MMA APPROACH
MMA measured solver consumption against licensed entitlement across all three vendors, and mapped which analyses were waiting on analyst availability rather than on software. We assessed whether embedded simulation could move routine work to design engineers and what review capacity that would require. Work drew on 47 expert interviews conducted in Q4 2025 with manufacturers, simulation vendors and engineering services firms.
KEY FINDINGS
  1. Consumption ran at roughly 41% of licensed entitlement across the 3 vendors, and the electrification programme could have been run inside existing capacity.
  2. Analyses were queued behind analyst availability rather than software availability in almost every single case the review examined across the full year.
  3. Routine structural checks representing around a third of analyst workload could move to design engineers with bounded embedded workflows (client-reported, unverified by MMA).
  4. Consolidating from 3 vendors to 2 would have released budget sufficient to fund 2 additional analyst positions at prevailing regional salary levels.
RECOMMENDED STRATEGY
Phase 1: Phase one: reject the additional licence request, since consumption ran at roughly 41% of entitlement and the programme fits inside existing capacity. Phase 2: Phase two: consolidate from three vendors to two and redirect the released budget into the analyst positions that have stayed vacant. Phase 3: Phase three: move routine structural checks to design engineers through bounded embedded workflows, freeing specialist time for the multiphysics work.
OUTCOME
The manufacturer rejected the licence increase, consolidated to two vendors and funded two analyst positions instead (client-reported, unverified by MMA). Analysis throughput improved materially once the staffing rather than the software constraint was addressed. Consumption against entitlement is now reported before any licence request, which is the change that outlasted the engagement.

Frequently Asked Questions

Foundational context covering the market sizes, CAGR, scope, country, region and competition that inform every finding below. This section is provided to cover basics and most often pre-purchase conversations, answered from the MMA Primary Research Dataset.

What is the current size of the Computer-aided Engineering Market?

Global value reaches USD 12.7 billion in 2026, measured as simulation software revenue across six disciplines. The 2025 base was USD 11.6 billion on the same basis.

How large will the Computer-aided Engineering Market be by 2036?

The market reaches USD 31.5 billion by 2036, an increase of USD 18.8 billion across the forecast period. That represents 2.48 times expansion from the 2026 base.

What is the CAGR for the Computer-aided Engineering Market 2026 to 2036?

The base case runs at 9.5% annually, with a bull case at 10.8% if embedded simulation reaches design engineer autonomy and a bear case at 8.3% if procurement rationalises idle licence capacity.

Which segment is growing fastest?

Embedded simulation for design engineers grows at 14.3%, half again the market rate of 9.5%. Manufacturers employ 23 designers for every dedicated simulation specialist they have.

Who are the major companies in the Computer-aided Engineering Market?

Ansys, Siemens Digital Industries Software, Dassault Systemes, Altair Engineering and Hexagon lead on software revenue, holding 61% between them. MSC Software and COMSOL hold smaller positions.

Which country is growing fastest?

India leads at 15.9%, because engineering organisations are being built rather than maintained and specify simulation from the outset. China and Vietnam follow behind it.

Report Segmentation Architecture

The full report scope spans multiple orthogonal segmentation dimensions, with cross-tabulated demand data provided for each dimension pair. Coverage extends further to regional breakdowns, trend trajectories, and the competitive detail needed to support segment-level decision-making.

By Simulation Discipline And Delivery

  • Embedded Simulation For Design Engineers
  • Multiphysics And Systems Simulation
  • Electromagnetic And Thermal Simulation
  • Computational Fluid Dynamics
  • Structural And Mechanical Solvers
  • Simulation Data And Process Management

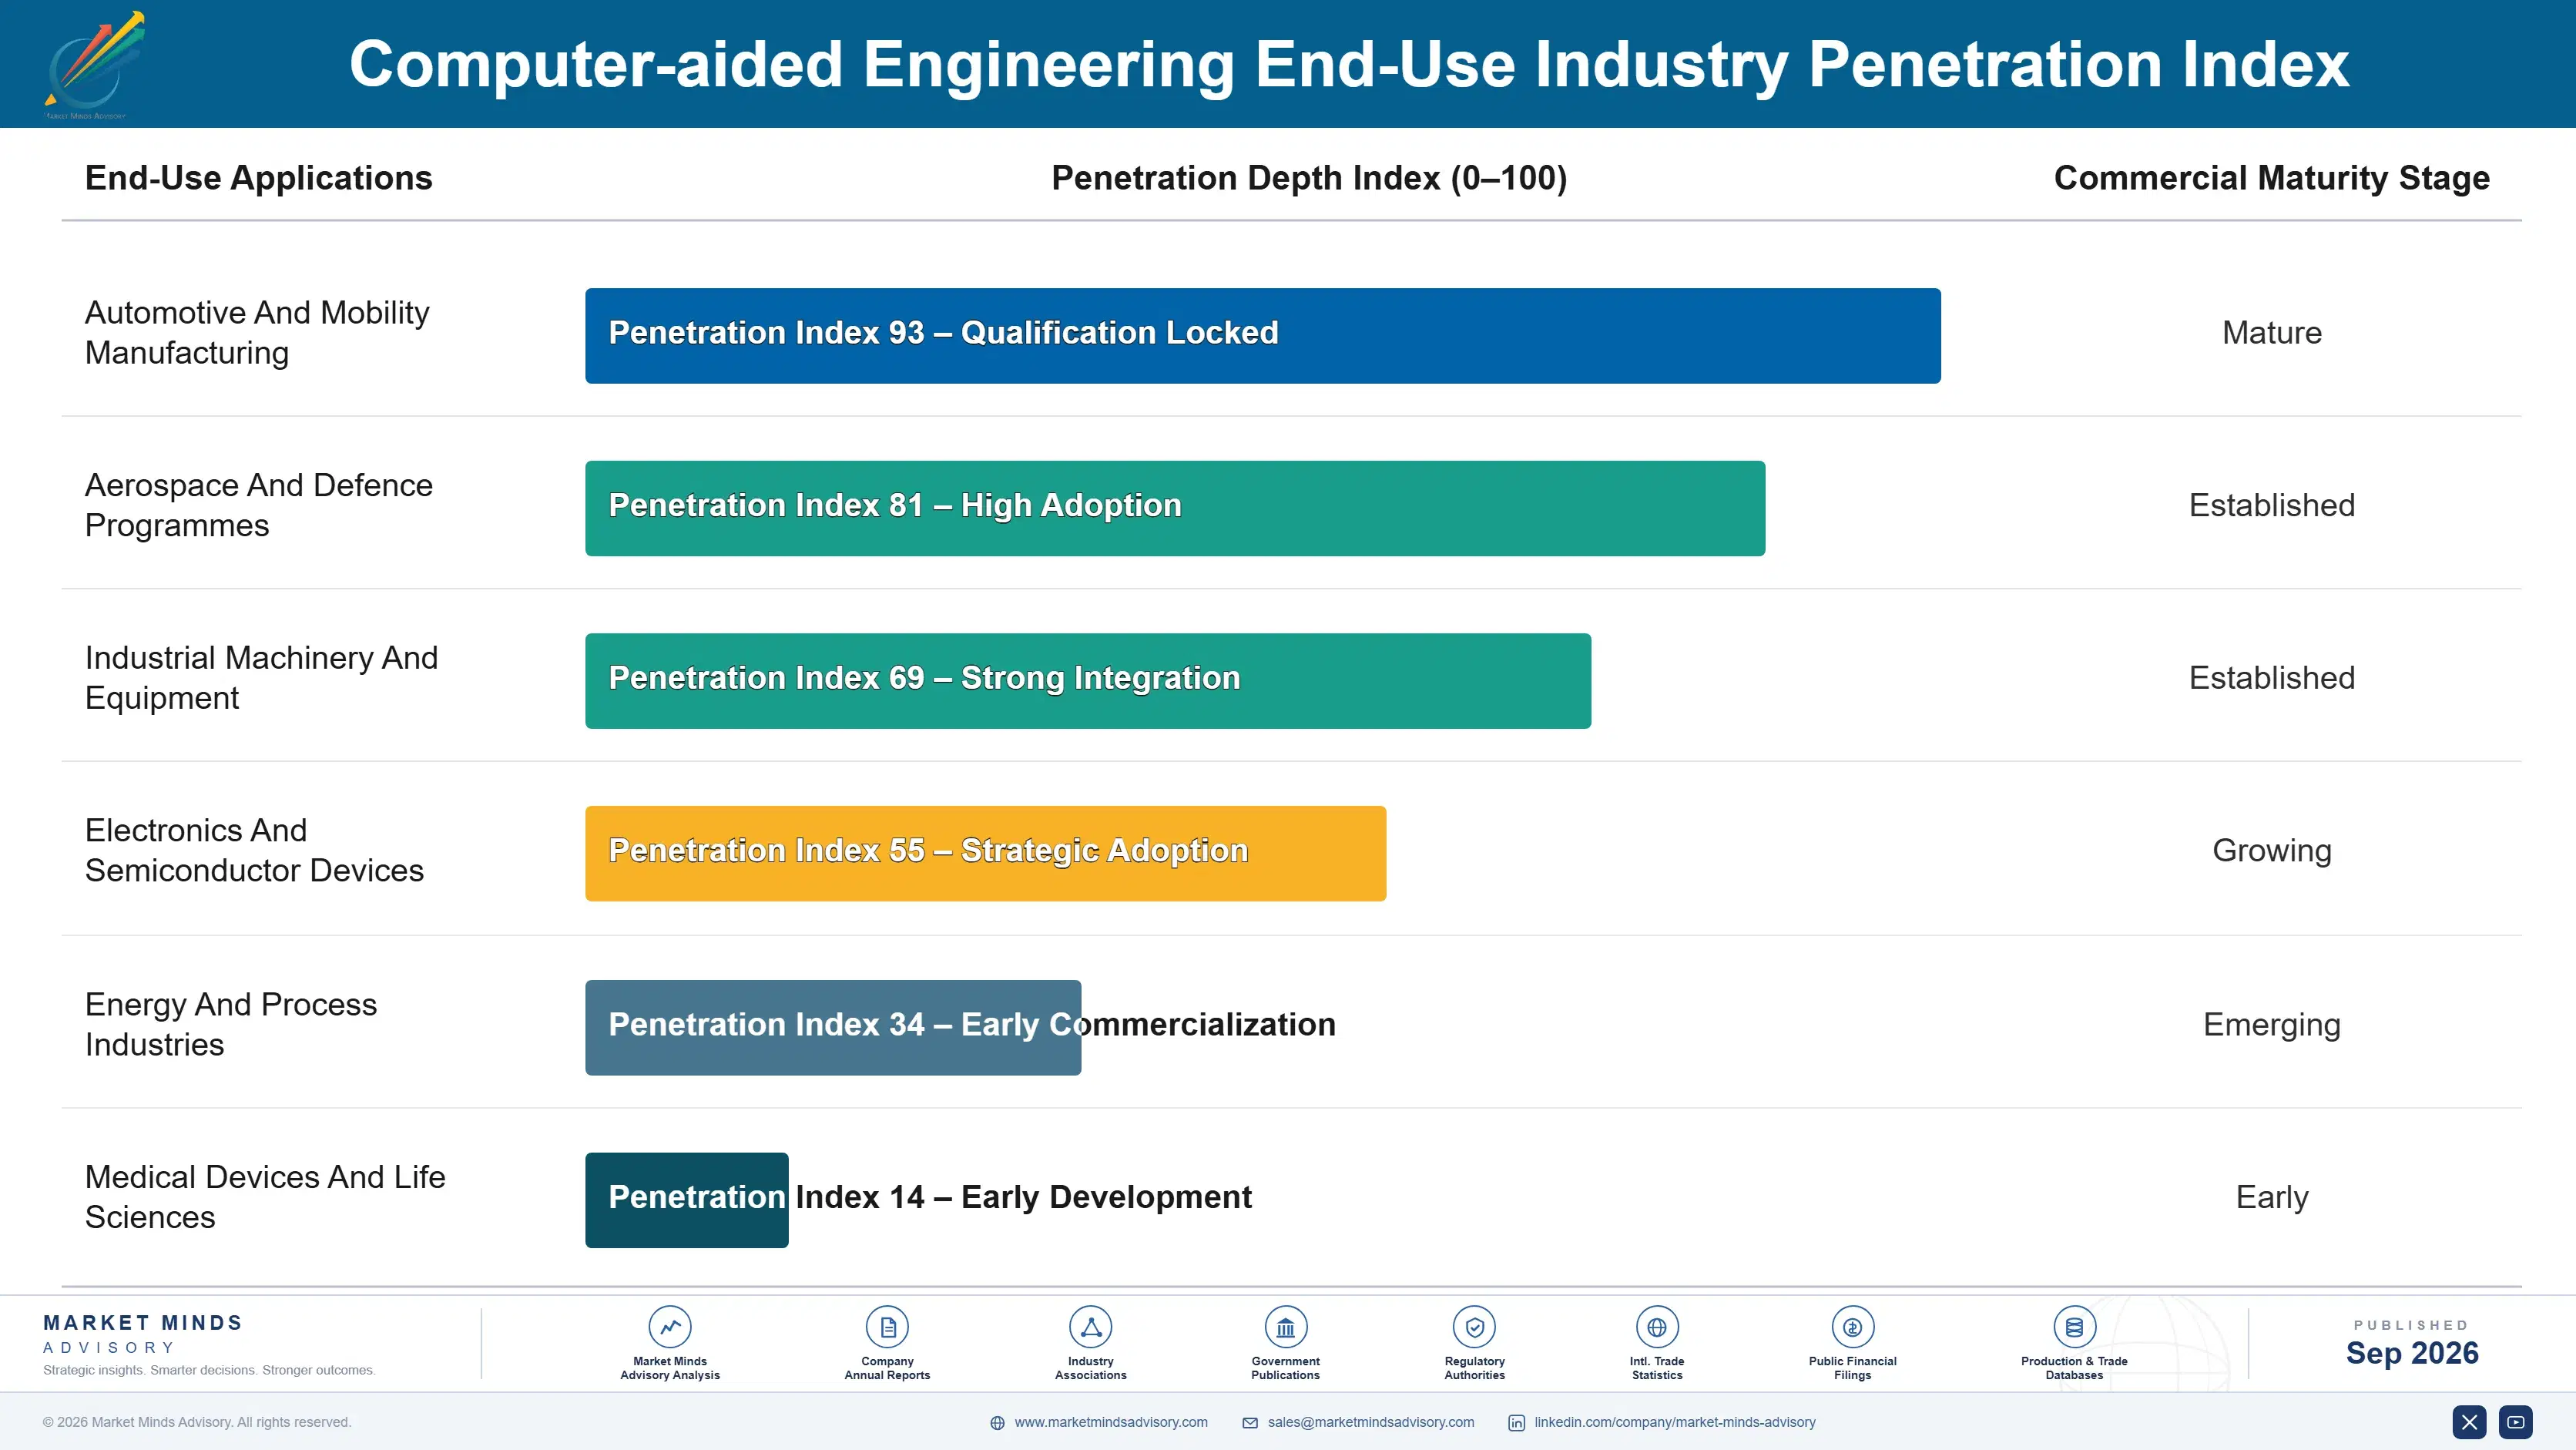
By End-Use Industry

  • Automotive And Mobility Manufacturing
  • Aerospace And Defence Programmes
  • Industrial Machinery And Equipment
  • Electronics And Semiconductor Devices
  • Energy And Process Industries
  • Medical Devices And Life Sciences

By Commercial Dimension

  • Perpetual Licence With Maintenance
  • Subscription And Token Licensing
  • Consumption Based Cloud Solving
  • Academic And Research Licensing
  • Engineering Services Firm Licensing
  • Original Equipment Manufacturer Embedded Licensing

By Region

  • North America
  • Western Europe
  • East Asia
  • South Asia and Pacific
  • Latin America
  • Middle East and Africa
  • Eastern Europe

Scope, Methodology, and Coverage

Every figure in this report is reproducible from documented input assumptions. The scope below maps the historical period, the forecast horizon, the segmentation dimensions, and the countries covered, alongside the underlying primary and qualitative methodology.
Historical Period
2020 to 2025
Forecast Period
2026 to 2036
Base Year
2025 (USD billions; MMA Primary Research Dataset, September 2026)
Market Definition
This report covers computer-aided engineering software: numerical simulation tools predicting physical behaviour before manufacture, spanning structural and mechanical solvers, computational fluid dynamics, electromagnetic and thermal simulation, multiphysics and systems simulation, embedded simulation for non-specialists, and simulation data and process management platforms. It excludes computer-aided design software, computer-aided manufacturing software, product lifecycle management systems, physical testing equipment, and engineering consultancy delivered as projects.
Quantitative Units
USD millions, simulation software revenue basis; licensed solver seats and tokens; licence utilisation as a percentage of entitlement; design engineers per simulation specialist; analyst recruitment periods in months; share of embedded output requiring specialist review.
Segmentation Dimensions
Simulation discipline and delivery model; end-use industry; commercial licensing route; geography across seven regions.
Regions Covered
North America, Western Europe, East Asia, South Asia and Pacific, Latin America, Middle East and Africa, Eastern Europe
Countries Covered
China, Japan, South Korea, Taiwan, India, Singapore, Australia, Vietnam, Germany, France, Italy, United Kingdom, Sweden, Netherlands, Poland, Czechia, United States, Canada, Brazil, Saudi Arabia.
Key Companies Profiled
Ansys, Siemens Digital Industries Software, Dassault Systemes, Altair Engineering, Hexagon, Autodesk, PTC, MSC Software, COMSOL, ESI Group, Cadence Design Systems, Synopsys, Aspen Technology, SimScale, Beta CAE Systems.
Quantitative Methodology
Primary survey, n=3,800 respondents, Q4 2025, six countries; demand-side model with trade association cross-validation
Qualitative Methodology
47 expert interviews, Q4 2025; applied to validate demand model assumptions, identify emerging dynamics, and assess competitive positioning
Report Format
PDF and XLSX data workbook (Word format preview document)
Publisher
Market Minds Advisory
Report Code
MMA-2026-TEC-151
Published
September 2026
Contact
sales@marketmindsadvisory.com | www.marketmindsadvisory.com

Purchase the full Computer-aided Engineering Market Report (2026 to 2036).

This report sizes the global computer-aided engineering market from 2026 to 2036 across six simulation disciplines, six industries and seven regions. It explains why solver licence utilisation near 47% reflects analyst scarcity rather than weak demand, with manufacturers employing 23 design engineers for every simulation specialist. Around 79% of embedded simulation output still requiring specialist review is analysed as a bottleneck widened rather than removed. Correlation effort absorbing roughly 14% of engineering time is examined as the barrier entrenching incumbent solvers. Regional analysis explains why East Asia holds 32% of spending.
Six simulation disciplines sized through to 2036
Licence utilisation quantified against analyst availability constraints
Embedded simulation autonomy gap analysed across manufacturers
Twenty named vendors assessed on simulation software revenue
Four revenue levers with quantified commercial impact
Anonymised manufacturer capability review engagement documented in full

Built For The People Who Decide

From boardroom strategy to bench-side execution, this report is read cover-to-cover by leaders shaping the next decade of their industry, turning demand scenarios, market dynamics and valuation benchmarks into decisions.
CXOs/ Presidents/ VPs/ Managers
M&A and Corporate Development
Strategy Teams and R&D Heads
Procurement and Product Directors
Regulatory and Compliance Leaders
Investor Relations and Equity Analysts