Market Minds Advisory
Compostable Packaging Market

Compostable Packaging Market: The Material Works, But Most Cities Still Have Nowhere To Send It

A commercial reading of compostable packaging, where the material itself performs as promised, but most cities lack the industrial composting infrastructure needed to actually process it at end of life.

Lead Analyst

Bilal Shaikh

Published

September 2026

Make Smarter Decisions with Customized Research Insights

Request a free sample report and evaluate market opportunities, growth trends, and competitive dynamics relevant to your business needs.

2025 MARKET VALUE$9.2BMarket Size 2025
2036 FORECAST VALUE$25.2BBase Case , 2026 to 2036
CAGR 2026 TO 20369.6 %Bull 10.8% / Bear 8.4%
INCREMENTAL OPPORTUNITY$15.1BNet 10- year value creation
EXPANSION MULTIPLE2.50x2036 value over 2026 base
Strategic Levers
M&A Pipeline
Regional Outlook
Country Rankings
Competitive Intelligence
Segmental Deep-dive
Call-Us : 91 93563 13602

Executive Snapshot and Market Trajectory

A compostable package can perform exactly as certified and still end up in a landfill, because most cities never built the industrial composting infrastructure needed to process it properly at end of life. That infrastructure gap, not the material science, is what actually limits this market's growth today.
The market stands at USD 9.2 billion in 2025 and reaches USD 25.22 billion by 2036 at a 9.6% CAGR. PHA and marine-degradable polymers grow fastest at 15.8%, roughly 1.65 times the overall rate, as brands seek materials that degrade even without industrial composting access anywhere at all. Western Europe holds 27% of value on mature composting infrastructure and strict single-use plastic regulation, while Italy posts the fastest national growth.
Concentration is moderate at roughly 24%, split between resin producers and converters manufacturing finished packaging for brand customers worldwide across most regions. Two forces dominate here. Composting infrastructure gaps are steering demand toward materials that degrade in ordinary soil or marine conditions rather than requiring industrial facilities, and extended producer responsibility fees are beginning to reward genuinely compostable formats over conventional plastic alternatives explicitly across several major jurisdictions currently expanding this specific policy approach.
Market Definition
The compostable packaging market covers packaging materials certified to break down into carbon dioxide, water, and biomass under defined composting conditions, spanning industrially compostable rigid and flexible packaging, home compostable formats, molded fibre packaging, and PHA and other marine-degradable polymers, valued at converter and resin producer selling prices. Conventional recyclable plastic packaging, oxo-degradable plastics not meeting compostability standards, paper packaging without compostability certification, and food-contact regulatory testing services are excluded.
Base Year Value
$9.2B in 2025 (MMA Primary Research Dataset, August 2026)
Forecast Period
2026 to 2036, eleven discrete annual values
CAGR
9.6% base case. Bull 10.8%. Bear 8.4%.
Fastest Growth Segment
PHA and Marine-Degradable Polymers: 15.8% CAGR
Fastest Growth Country
Italy: 11.2% CAGR
Fastest Growth Region
South Asia and Pacific: 11.6% CAGR
Largest Region
Western Europe: 27% of 2025 global value
Market Leaders
NatureWorks, Novamont, BASF, TIPA, Huhtamaki. Source: MMA Analysis based on company annual reports.
Primary Survey
n=3,800 procurement and R&D decision-makers, Q4 2025, six countries
Methodology
Demand-side build-up, cross-validated against public data, 47 expert interviews

Compostable Packaging Market Forecast Scenarios

compostable-packaging-market-size-forecast-scenario-1787324925978
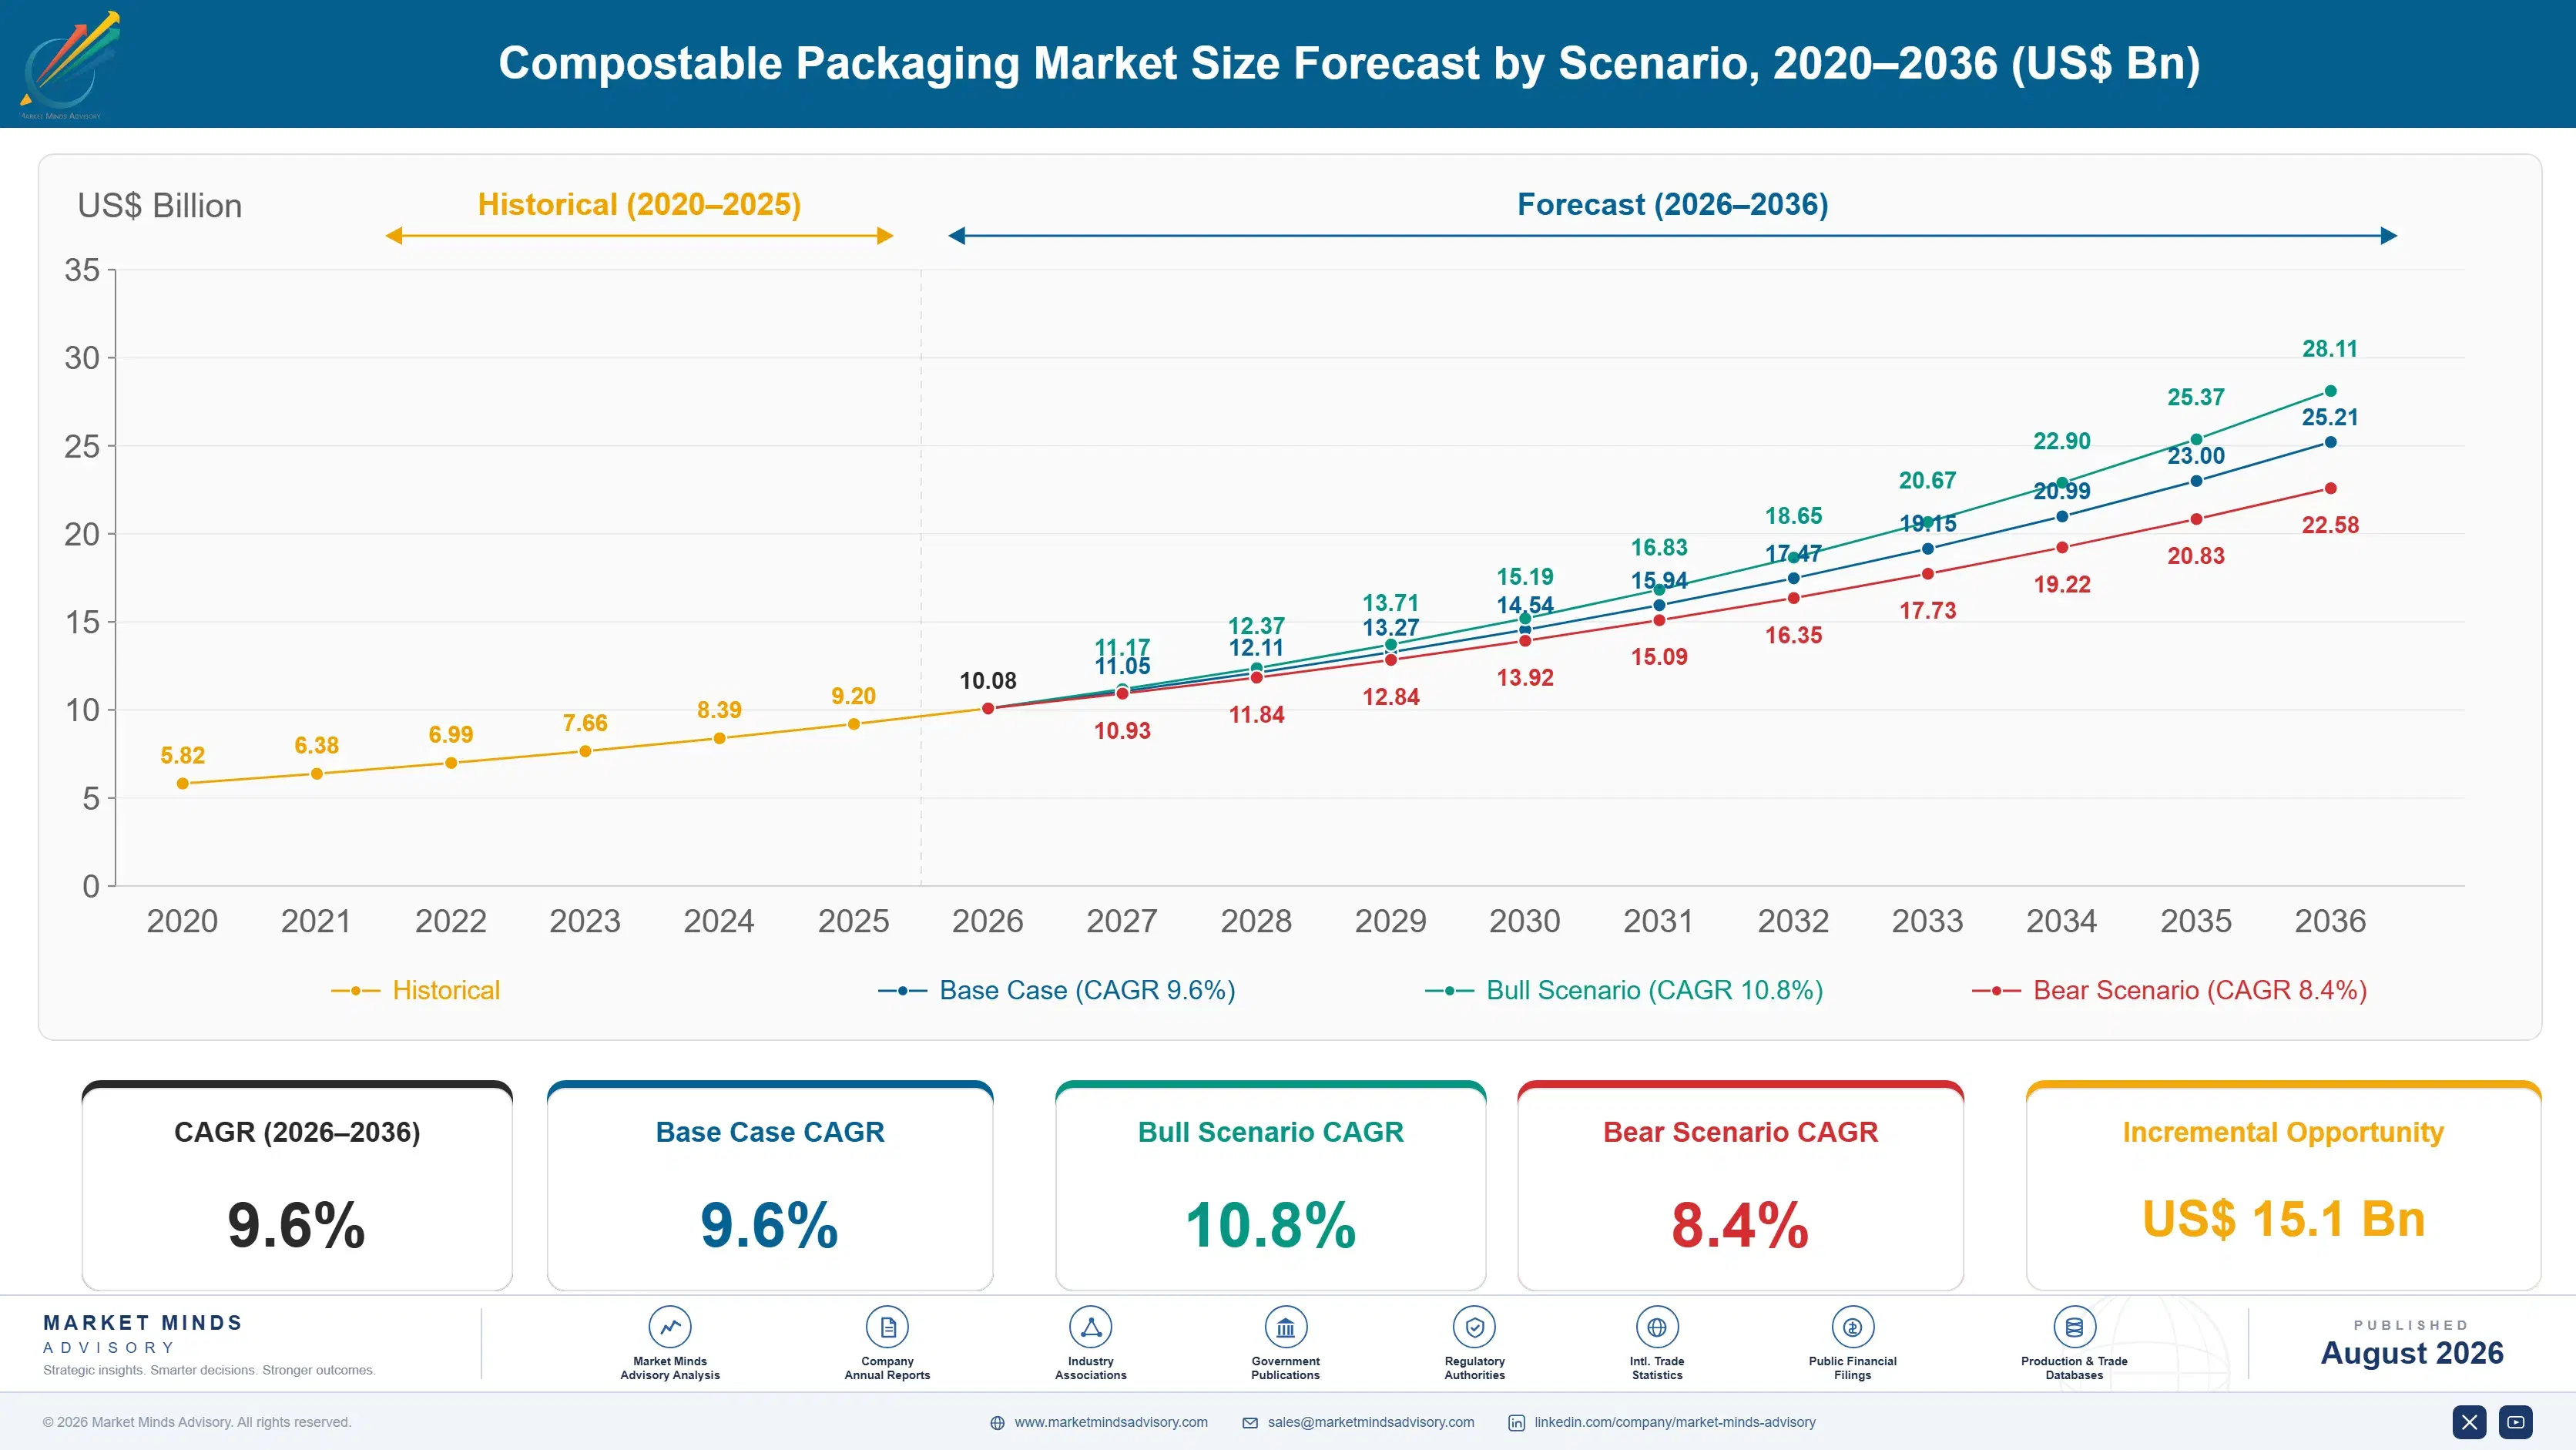
Growth from 2020 to 2025 compounded near 8.3%, and single-use plastic bans across a growing number of jurisdictions did most of the work. European Union restrictions on specific single-use plastic items pushed foodservice and retail packaging toward compostable alternatives, while several major cities introduced comparable bans independently of any national framework. Composting infrastructure investment lagged behind material adoption throughout the period, creating the certification-versus-processing gap that still defines the category.
Three mechanisms carry the base case to 9.6%. First, continued single-use plastic regulation spreading to jurisdictions that have not yet acted, converting compostable packaging from a premium choice into a compliance requirement. Second, extended producer responsibility fee structures rewarding compostable formats with lower rates than conventional plastic. Third, marine-degradable polymer development addressing the infrastructure gap directly, since materials degrading without industrial composting access reach a far larger addressable market immediately.
The bull case at 10.8% assumes plastic bans accelerate further and marine-degradable polymer costs fall enough to broaden adoption beyond premium applications. The bear case at 8.4% assumes composting infrastructure investment continues lagging material adoption, consumer confusion over which materials actually compost properly undermines category credibility, and regulatory enforcement proves inconsistent across jurisdictions that enacted bans without funding collection infrastructure.

Why Certification Alone Does Not Guarantee A Compost Bin

Three forces set demand. Regulatory mandate drives the most durable volume, as single-use plastic bans across a growing number of jurisdictions leave compostable materials among the few compliant alternatives available. Brand sustainability commitment drives a second stream, since packaging carries visible signalling that consumers increasingly notice. Extended producer responsibility fee structures drive a third stream, as several jurisdictions now charge lower disposal fees for genuinely compo
MARKET CONCENTRATIONCR5: 24%Moderately fragmented split between resin producers and packaging converters
PRICE PREMIUM OVER PLASTIC30 to 80%Compostable packaging cost premium against equivalent conventional plastic material
INDUSTRIAL COMPOSTING ACCESSAbout 40%Share of population with access to industrial composting collection
CERTIFICATION TIMELINE6 to 18 monthsTime to secure compostability certification for a new formulation
DECOMPOSITION WINDOW90 to 180 daysTypical certified breakdown period under industrial composting conditions
CONTAMINATION REJECTION RATEUp to 25%Compost batches rejected due to non-compostable material contamination
The commercial character is defined by an infrastructure gap that certification alone cannot close. A package can pass every industrial compostability test and still lack anywhere to actually go, since only a minority of the population has access to municipal composting collection matching the material's requirements. That mismatch has produced consumer confusion, contaminated compost batches, and genuine scepticism from operators who increasingly reject loads they cannot process.
The decade turns on whether materials can degrade without requiring specialised infrastructure at all. Marine-degradable and home-compostable formats sidestep the collection problem entirely, breaking down in ordinary conditions rather than depending on industrial facilities most consumers cannot access. That shift matters more than any certification label, because it addresses the actual bottleneck rather than optimising further around a collection system that remains underbuilt almost everywhere.
"Everyone focuses on whether the material composts and almost nobody asks whether the customer has anywhere to put it. That infrastructure question, not the chemistry, is what has actually held this category back for a decade."
Director, Sustainable Packaging and Materials Practice · MMA Packaging / Sustain

Market Trends

Marine-Degradable Polymers Bypass The Infrastructure Problem

PHA and related marine-degradable polymers break down in ordinary soil, freshwater, and marine environments without requiring the elevated temperatures and controlled conditions industrial composting facilities provide, which directly answers the infrastructure gap limiting conventional compostable materials. That capability matters enormously in markets where composting collection barely exists, since the material degrades regardless of what happens after disposal rather than depending on a system most consumers cannot access. Production cost remains higher than conventional compostable plastics, but brands serving weak-infrastructure markets increasingly view that premium as the price of a claim that holds up under real disposal conditions.
Market Impact: Bans now cover 100 plus jurisdictio
Contamination Rejection Is Forcing Better Consumer Labelling

Composting facility operators increasingly reject entire batches contaminated with non-compostable material that consumers mistakenly placed in compost collection, a problem that has grown as compostable packaging adoption spread faster than consumer education about which materials actually qualify. That rejection risk has pushed brands and converters toward clearer, more standardised labelling distinguishing compostable packaging from conventional plastic that merely looks similar. The commercial consequence is that packaging design now incorporates compostability signalling as a functional requirement rather than a marketing afterthought, since facility operators are becoming more willing to reject entire loads rather than risk processing contaminated material.
Market Impact: Fees vary up to 200 euros

Market Opportunities and Growth Drivers

Single-Use Plastic Bans Are Spreading Across Jurisdictions

The European Union's single-use plastics directive restricted specific conventional plastic items across member states, and a growing number of cities and states elsewhere have enacted comparable bans independently, converting compostable packaging from a premium choice into one of the few compliant alternatives available to foodservice and retail brands. That regulatory structure creates demand regardless of underlying material cost, since brands facing a ban simply cannot continue using the restricted conventional plastic format at all. Each new jurisdiction enacting a ban adds directly to addressable demand without requiring any additional sales effort from suppliers already serving comparable markets elsewhere.
Market Impact: Only 40% have composting access

Extended Producer Responsibility Fees Now Reward Compostable Formats

Several European jurisdictions have restructured extended producer responsibility fee schedules to charge lower rates for genuinely compostable packaging than for conventional plastic, converting a sustainability preference into a direct financial calculation that finance functions can model explicitly. That fee differential offsets some of the price premium compostable materials still carry over conventional plastic, improving the total cost comparison for brands weighing the switch. The commercial effect reaches beyond the jurisdictions imposing the fee directly, since multinational brands increasingly standardise packaging globally around whatever specification satisfies their most demanding regulatory market.
Market Impact: Premiums reach 30 to 80%

Market Restraints and Challenges

Composting Infrastructure Coverage Remains Genuinely Limited

Only a minority of the population in most major markets has access to municipal composting collection capable of processing industrially compostable packaging, which means a certified material frequently has nowhere appropriate to actually go once discarded. The root cause is that composting infrastructure requires municipal investment that has lagged material adoption considerably, since building processing capacity takes years and meaningful capital that packaging regulation alone does not fund. The commercial impact is consumer confusion and packaging that ends up in landfill or contaminating recycling streams instead. Mitigation runs through marine-degradable materials, expanded municipal composting investment, and clearer consumer labelling standards.
Market Impact: Costs 40 to 70% above PLA

Price Premium Limits Adoption Beyond Regulated Categories

Compostable packaging typically costs 30% to 80% more than equivalent conventional plastic, a premium that price-sensitive categories cannot absorb without regulatory compulsion or genuine brand sustainability commitment behind the decision. The root cause is that compostable resin production remains a smaller-scale, less mature manufacturing category than commodity plastic production, which has benefited from decades of scale-driven cost reduction the newer materials have not yet achieved. The commercial impact is that adoption concentrates in regulated jurisdictions and premium brand categories rather than spreading broadly. Mitigation runs through production scale-up, feedstock diversification, and continued process efficiency investment.
Market Impact: Rejection rates reach 25% of loads
3 additional market trends, 4 additional growth drivers, and 2 additional restraints and challenges are covered in the full report. Contact sales@marketmindsadvisory.com to access the complete intelligence.

Segment CAGR and Growth Architecture

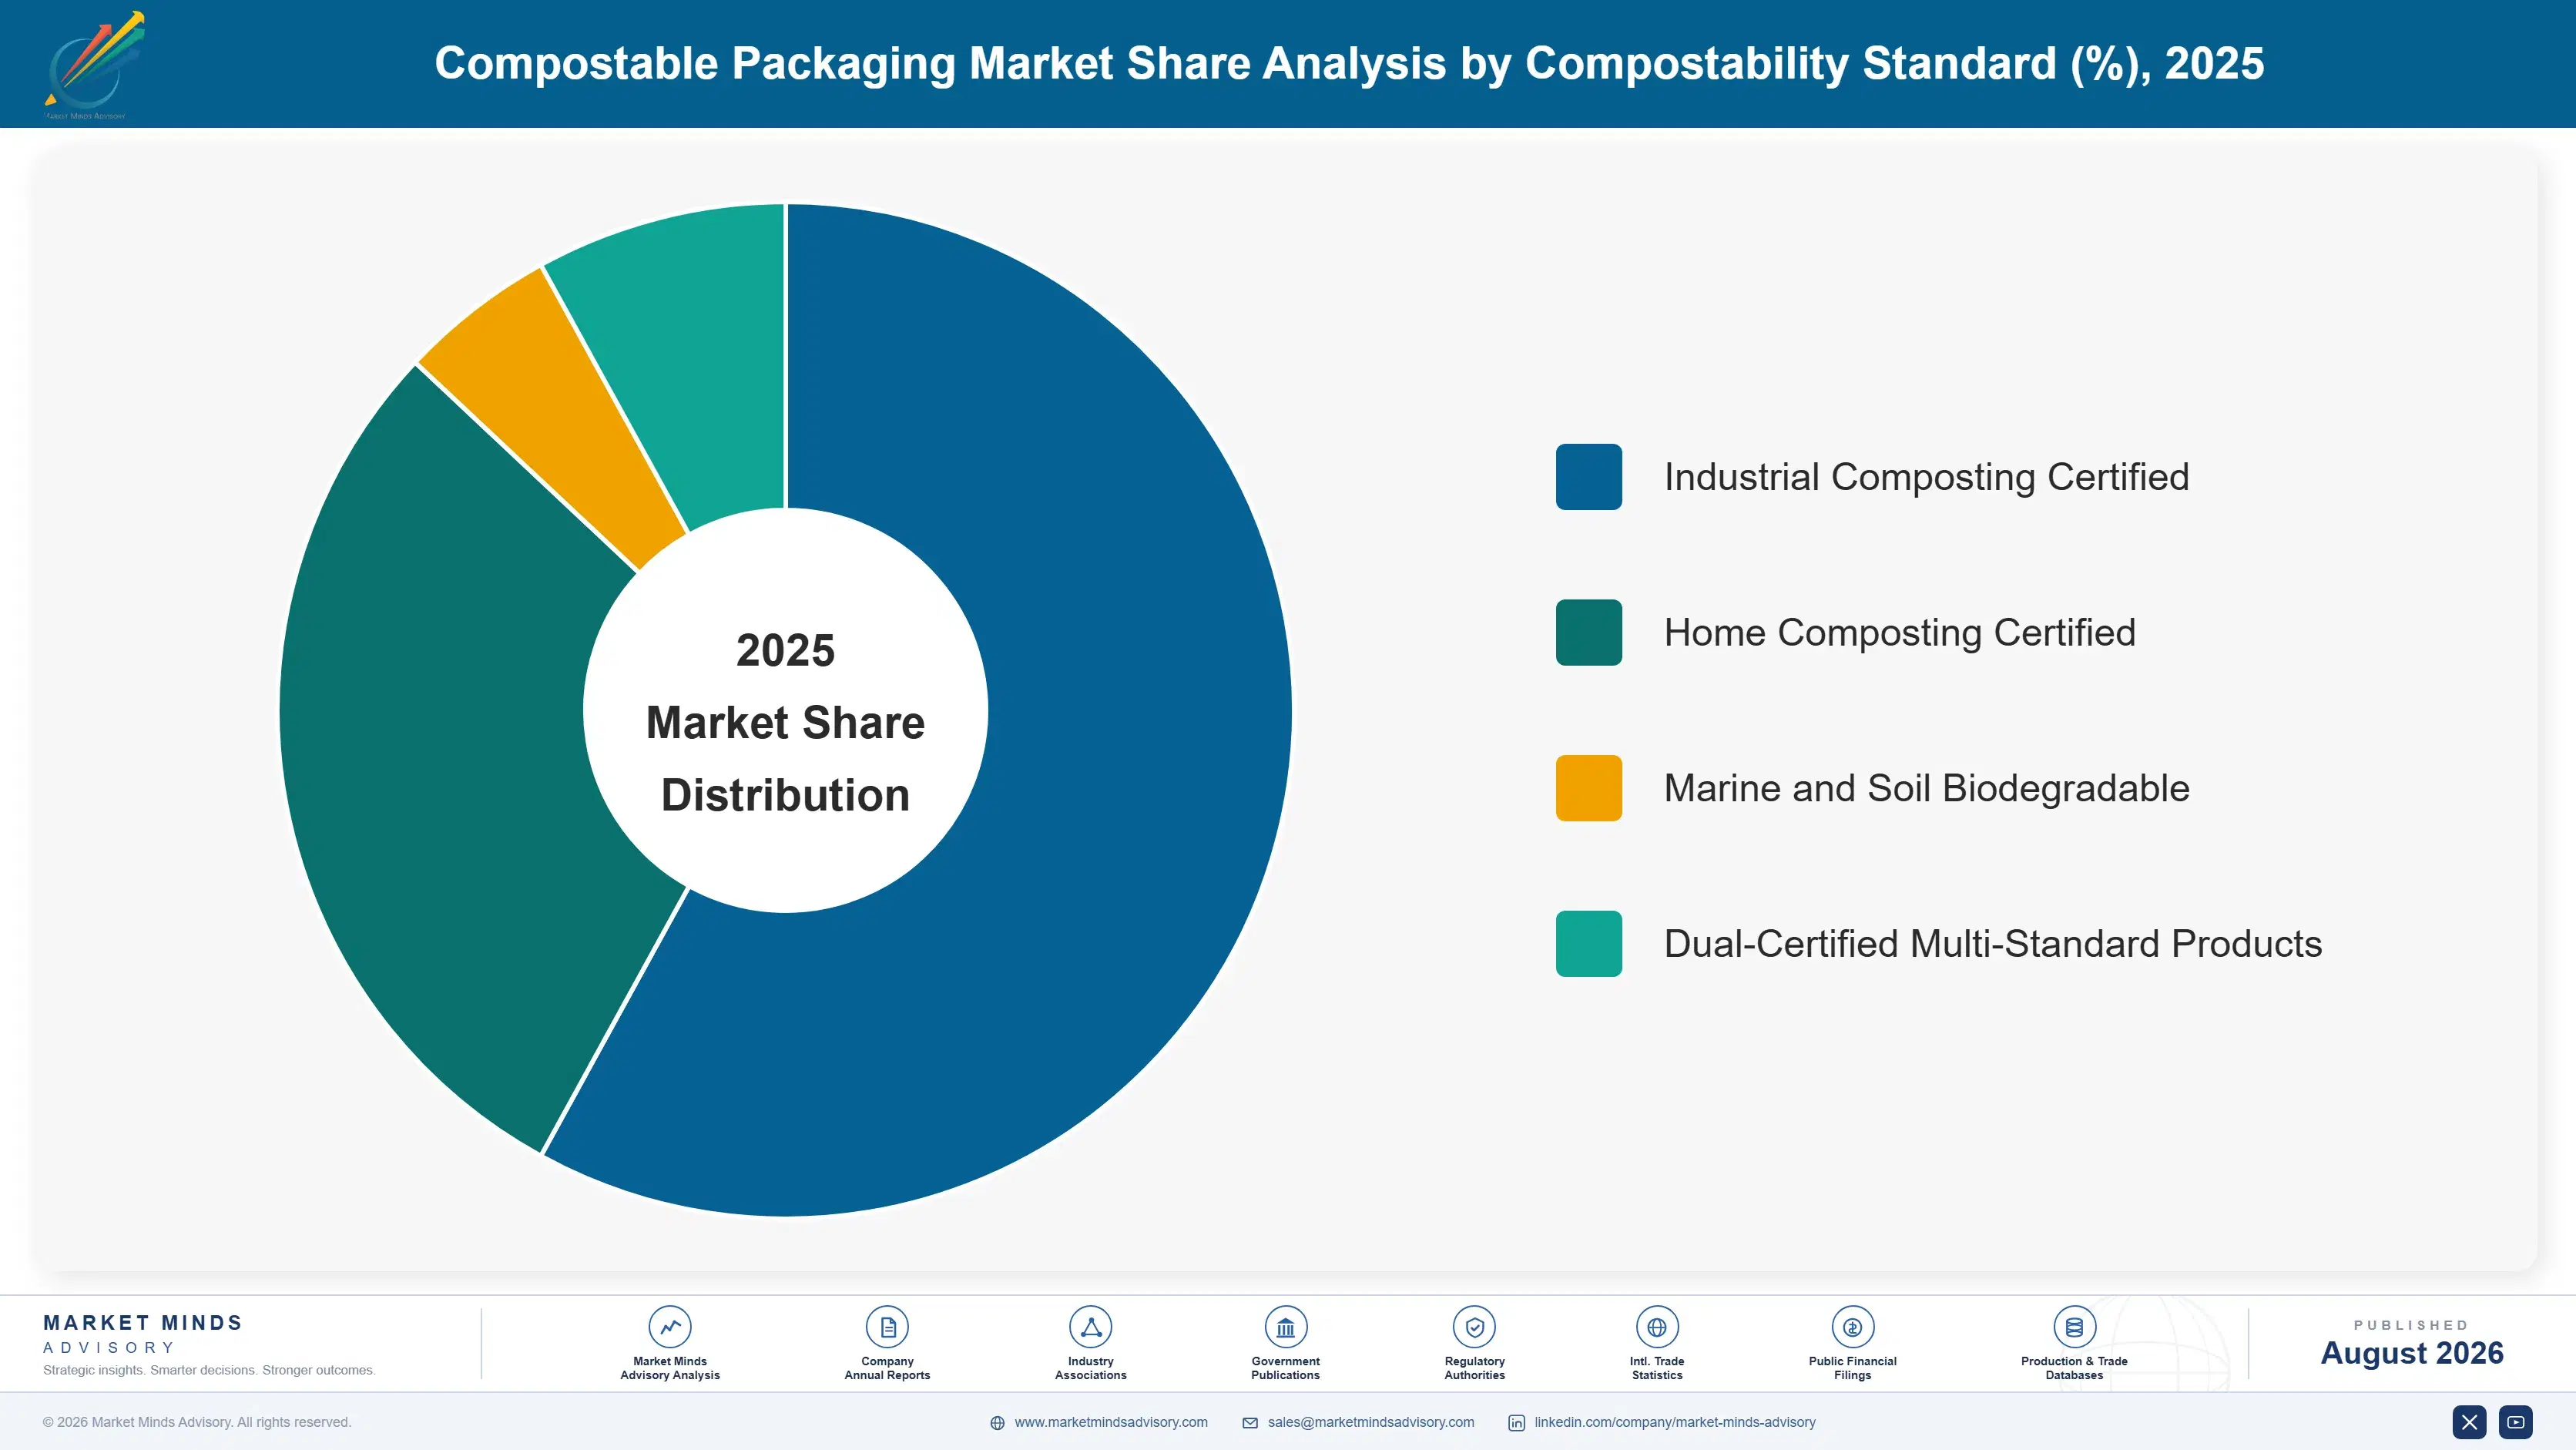
Segmentation follows material chemistry, a single formulation logic describing what the packaging is actually made from and how it breaks down at end of life under real disposal conditions. Each chemistry carries its own cost structure, degradation pathway, and certification requirement, so commercial position tracks the material rather than the end-use industry buying it.
compostable-packaging-market-market-share-analysis-1787324926514

PHA and Marine-Degradable Polymers

PHA and marine-degradable polymers grow fastest at 15.8%, about 1.65 times the overall 9.6% rate, from the smallest base of any material category as brands seek genuine degradability that does not depend on industrial composting infrastructure most consumers cannot access. Growth is concentrated in markets with weak composting collection, where marine-degradable materials answer the infrastructure gap that conventional compostable plastics cannot solve on their own. Production cost remains meaningfully higher than established compostable plastics, limiting near-term adoption to premium and regulation-driven applications specifically. Danimer Scientific, Newlight Technologies, and several specialist producers hold established positions here. Fermentation feedstock cost and production scale remain the primary barriers to broader commercial adoption across most markets today.
CAGR 15.8%

Molded Fibre Packaging

Molded fibre packaging grows at 9.1%, using recycled paper pulp and agricultural residue formed into rigid packaging shapes that compost readily under both industrial and often home composting conditions without requiring specialised polymer chemistry at all. The category benefits from genuinely low material cost and wide consumer familiarity, since moulded fibre egg cartons and food trays have existed commercially for decades before the current compostable packaging wave began in earnest. Huhtamaki, Genpak, and numerous regional converters compete on this basis, with growth tracking foodservice and protective packaging applications specifically across developed and emerging markets alike. Production capacity has expanded steadily to meet rising demand from both regulation and voluntary brand adoption worldwide.
CAGR 9.1%
Full segment breakdown across 5 segments available in the complete report.

Regional Architecture and Country Demand Map

Composting infrastructure maturity and regulatory intensity, rather than population size, set this seven-region value distribution across the market. Western Europe leads on decades of composting policy and mature collection infrastructure, East Asia follows on manufacturing and foodservice volume, and Italy grows fastest on continued national policy leadership.

North America

North America holds 22% of value at 9.8% growth, sitting at the bottom of its band on composting infrastructure that remains considerably less developed than Western Europe's despite growing state-level plastic bans and rising brand commitment. California, New York, and several other states have enacted single-use plastic restrictions that drive compostable packaging adoption regardless of composting collection availability in the affected jurisdictions specifically. NatureWorks holds a strong domestic position built on its polylactic acid resin manufacturing base. Composting infrastructure investment is expanding in major metropolitan areas specifically, though rural and smaller-city coverage remains genuinely limited across most states. Canadian demand follows broadly similar patterns, driven by comparable provincial-level plastic restrictions and brand commitments.
Share: 22% | CAGR: 9.8% (2026 to 2036)

Western Europe

Decades of composting policy leadership give Western Europe 27% of value, above the 18 to 26% band, at 8.0% growth, the slowest of the seven regions on a market where the easiest regulatory-driven adoption has already largely occurred. The European Union's single-use plastics directive and packaging waste regulation together create the most demanding compliance environment anywhere, and composting collection infrastructure is correspondingly the most mature globally. Novamont and TIPA hold strong positions built on decades of material science investment and deep composting industry relationships across the continent. Italian and German composting infrastructure leads regionally by a wide margin. Growth reflects incremental expansion into remaining categories rather than any broad new adoption wave emerging.
Share: 27% | CAGR: 8.0% (2026 to 2036)
Regional intelligence for 5 additional markets available in the complete report: East Asia, South Asia and Pacific, Latin America, Middle East and Africa, Eastern Europe. Contact sales@marketmindsadvisory.com.
compostable-packaging-market-country-cagr-analysis-1787324927027

Where Compostable Packaging Suppliers Hold Margin

Selling a certified compostable material into a market with nowhere for it to actually go concedes the whole commercial argument before the sale even starts. The four moves below shift earnings toward what actually solves the real problem: marine-degradable chemistry, EPR fee positioning, contamination-proof labelling, and regulatory-driven category leadership built early and defended firmly.

Develop Marine-Degradable Chemistry Ahead Of Infrastructure

Composting infrastructure investment lags material adoption by years in nearly every market, and suppliers who develop materials degrading without requiring industrial facilities at all bypass the collection bottleneck that limits conventional compostable plastic adoption entirely. That capability commands a genuine 40 to 70% premium in markets where composting collection barely exists, since it is the only material category actually solving the infrastructure problem rather than depending on a system still being built out slowly. Early movers in marine-degradable chemistry are securing brand relationships years before mainstream cost parity arrives, locking in category leadership.
Market Impact: Commands a 40 to 70% price premium

Position Explicitly Against EPR Fee Differentials

Several jurisdictions now charge meaningfully lower extended producer responsibility fees, worth up to 200 euros per tonne, for genuinely compostable packaging than for conventional plastic, converting a sustainability preference into a direct financial calculation that finance functions can model explicitly. That fee differential offsets some of the price premium compostable materials still carry over conventional plastic, improving the total cost comparison for brands weighing the switch seriously. The commercial effect reaches beyond the jurisdictions imposing the fee directly, since multinational brands increasingly standardise packaging globally around whatever specification satisfies their most demanding regulatory market.
Market Impact: Fee savings reach 200 euros per ton

Build Contamination-Proof Labelling And Design Standards

Composting facility operators increasingly reject entire batches contaminated by non-compostable material, with rejection rates reaching up to 25% of loads, and suppliers who invest in clear, standardised, hard-to-confuse labelling reduce the rejection risk that damages the entire category's credibility with facility operators and consumers alike. That investment protects not just an individual supplier's reputation but the broader market's access to composting infrastructure that facility operators could otherwise simply refuse to serve at all. Suppliers leading on labelling standards increasingly shape industry-wide certification requirements that competitors must eventually follow regardless of their own preference.
Market Impact: Cuts contamination rejection by up

Establish Category Leadership In Newly Regulated Jurisdictions

Each jurisdiction enacting a single-use plastic ban creates a compressed window during which brands must rapidly qualify compliant alternatives, and suppliers positioned with regulatory approval and local supply chain readiness before the ban takes effect capture disproportionate early share that later entrants struggle to displace afterward. That first-mover position, once established through initial brand contracts, tends to persist well beyond the immediate compliance rush as switching costs and proven performance both favour the incumbent supplier. Over 100 jurisdictions have already enacted restrictions, and considerably more are actively weighing comparable measures right now.
Market Impact: Over 100 jurisdictions now restrict

Who Controls the Margin Pool

Concentration is moderate at roughly 24% for the top five, split between resin producers supplying base material and converters manufacturing finished packaging for brand customers directly. The gap between leaders and challengers is regulatory positioning and marine-degradable chemistry depth rather than manufacturing scale, broadly comparable across established suppliers. All participants are assessed on one basis, revenue from certified compostable packaging materials and finished products, e
Competition runs along three lines. First, marine-degradable chemistry capability, since that increasingly determines which suppliers can serve markets with weak composting infrastructure at all. Second, regulatory positioning and first-mover advantage in newly restricted jurisdictions, which shapes brand relationships for years afterward. Third, contamination-proof labelling and design standards, since facility rejection risk threatens category credibility more than any individual competitive dynamic.

Pressure is building from two directions. Established plastic packaging converters are entering compostable materials directly, bringing manufacturing scale pure-play specialists cannot match on cost. Meanwhile emerging marine-degradable polymer specialists are capturing premium positioning in infrastructure-weak markets established players have been slower to address. Rankings should favour suppliers combining marine-degradable capability with genuine regulatory positioning over those competing on conventional compostable plastic scale alone.
compostable-packaging-market-company-positioning-matrix-1787324927551

Competitive Moat and Risk Dimensions

NATUREWORKS

Moat: Polylactic acid manufacturing scale

NatureWorks operates substantial polylactic acid resin manufacturing capacity, giving it cost and supply reliability advantages that smaller specialist producers cannot easily match across large brand contracts. Its established position across foodservice and packaging applications provides deep customer relationships built over two decades. Continued investment in next-generation chemistry positions it against emerging marine-degradable competitors directly.
NATUREWORKS

Risk: Composting dependence limits reach

Its core polylactic acid chemistry still depends substantially on industrial composting access, limiting its addressable market in regions where that infrastructure remains genuinely underdeveloped relative to material adoption. Marine-degradable competitors are capturing share in exactly the infrastructure-weak markets where its core technology performs least effectively. Scale advantages matter less as brands increasingly specify degradation performance over supplier manufacturing capacity.
NOVAMONT

Moat: European regulatory relationship depth

Novamont built genuine relationships with European regulators and composting infrastructure operators over decades, positioning it deeply within the market carrying the world's most demanding compliance requirements and mature collection systems. Its Mater-Bi material family spans multiple applications and certification standards. Deep agronomic and feedstock expertise supports continued material innovation that newer entrants struggle to replicate quickly.
NOVAMONT

Risk: Slower growth in core market

Heavy European concentration exposes it to the slowest-growing region in this market, where the easiest regulatory-driven adoption has already substantially occurred across most applicable categories. Expansion into faster-growing Asian and emerging markets requires competing against domestic producers with lower cost structures. Marine-degradable technology investment lags some specialist competitors focused entirely on that emerging chemistry.

Players Tracked

Prominent Players

NatureWorks
Novamont
BASF
TIPA
Huhtamaki

Other Key Players

Danimer Scientific
Newlight Technologies
Genpak
Eastman Chemical
Total Corbion PLA
FKuR
BioPak
Vegware
World Centric
Sulapac
Notpla
Mango Materials
Kaneka
Plantic Technologies
Futamura Group

Recent Developments

JULY 2021

European Union single-use plastics directive reaches full application

The European Union's single-use plastics directive reached full application across member states, restricting specific plastic items and creating substantial demand for compliant compostable alternatives. This was regulatory implementation rather than any corporate transaction, and it converted compostable packaging into a compliance requirement across an enormous addressable market.
Signal: Regional regulation creating direct compli
FEBRUARY 2024

Major converter expands marine-degradable polymer production capacity

A leading marine-degradable polymer producer announced substantial capacity expansion to meet growing demand from brands serving markets with limited composting infrastructure. This was organic capacity investment rather than an acquisition or joint venture, and it addressed a supply constraint that had been limiting broader commercial adoption.
Signal: Capacity investment in infrastructure-inde
SEPTEMBER 2025

India extends single-use plastic restrictions to additional product categories

Indian regulators extended single-use plastic restrictions to cover additional packaging categories beyond the original scope, expanding compliant compostable material demand substantially. This was a regulatory expansion rather than a corporate transaction, and it converted a large share of previously unregulated packaging into a compliance-driven category.
Signal: Large emerging markets extending plastic r

Feedstock, Fermentation, Certification, Converting Capacity

Feedstock and processing dominate cost structure here. Agricultural feedstock, whether corn starch for polylactic acid or specialised fermentation substrates for PHA, accounts for a substantial share of resin production cost, priced against agricultural commodity markets that move independently of packaging demand entirely. Fermentation and polymerisation energy costs add a further meaningful share, particularly for marine-degradable polymers requiring more complex production processes.
Agricultural commodity prices moved considerably through 2021 and 2022 as global grain markets tightened following weather disruption and geopolitical supply concerns, lifting polylactic acid feedstock costs faster than the broader packaging market moved during the same period. Several producers disclosed the resulting margin pressure across their annual reporting through that window, and EIA data recorded the parallel energy cost movement that raised fermentation and polymerisation costs across the industry.

Exposure divides sharply by feedstock source and production integration rather than by geography specifically. Producers with agricultural supply agreements or diversified feedstock sourcing held cost considerably better than those buying corn or specialised substrates on open markets into a tightening cycle. The disadvantage compounds, because a producer unable to deliver against brand contracts during a shortage loses shelf space that competitors permanently retain once established with that customer relationship.
compostable-packaging-market-cost-volatility-analysis-1787324927746

Diversify feedstock sources across multiple agricultural regions

Concentrating feedstock sourcing in a single agricultural region ties production cost directly to that region's specific weather and market conditions, which recent grain price volatility demonstrated expensively across the industry. Diversifying sourcing across regions and, where feasible, feedstock types spreads that exposure and improves supply reliability during any single region's disruption or shortfall considerably.

Secure agricultural supply agreements ahead of tight cycles

Spot buying agricultural feedstock exposes producers to price spikes precisely when demand for compostable materials is also rising across the industry simultaneously and unpredictably. Multi-year supply agreements with agricultural producers, even at modest committed volume, provide pricing stability and delivery priority that spot buyers competing during a tight market cannot access as readily or as cheaply.

Invest in feedstock-flexible production processes

Production processes locked to a single feedstock type cannot pivot when that specific input tightens, leaving no alternative but to absorb cost increases directly and pass them downstream regardless. Processes engineered to accept multiple feedstock inputs preserve production flexibility and negotiating leverage across agricultural cycles that single-feedstock competitors simply cannot access or replicate quickly enough.

Portfolio Architecture for Margin Defence

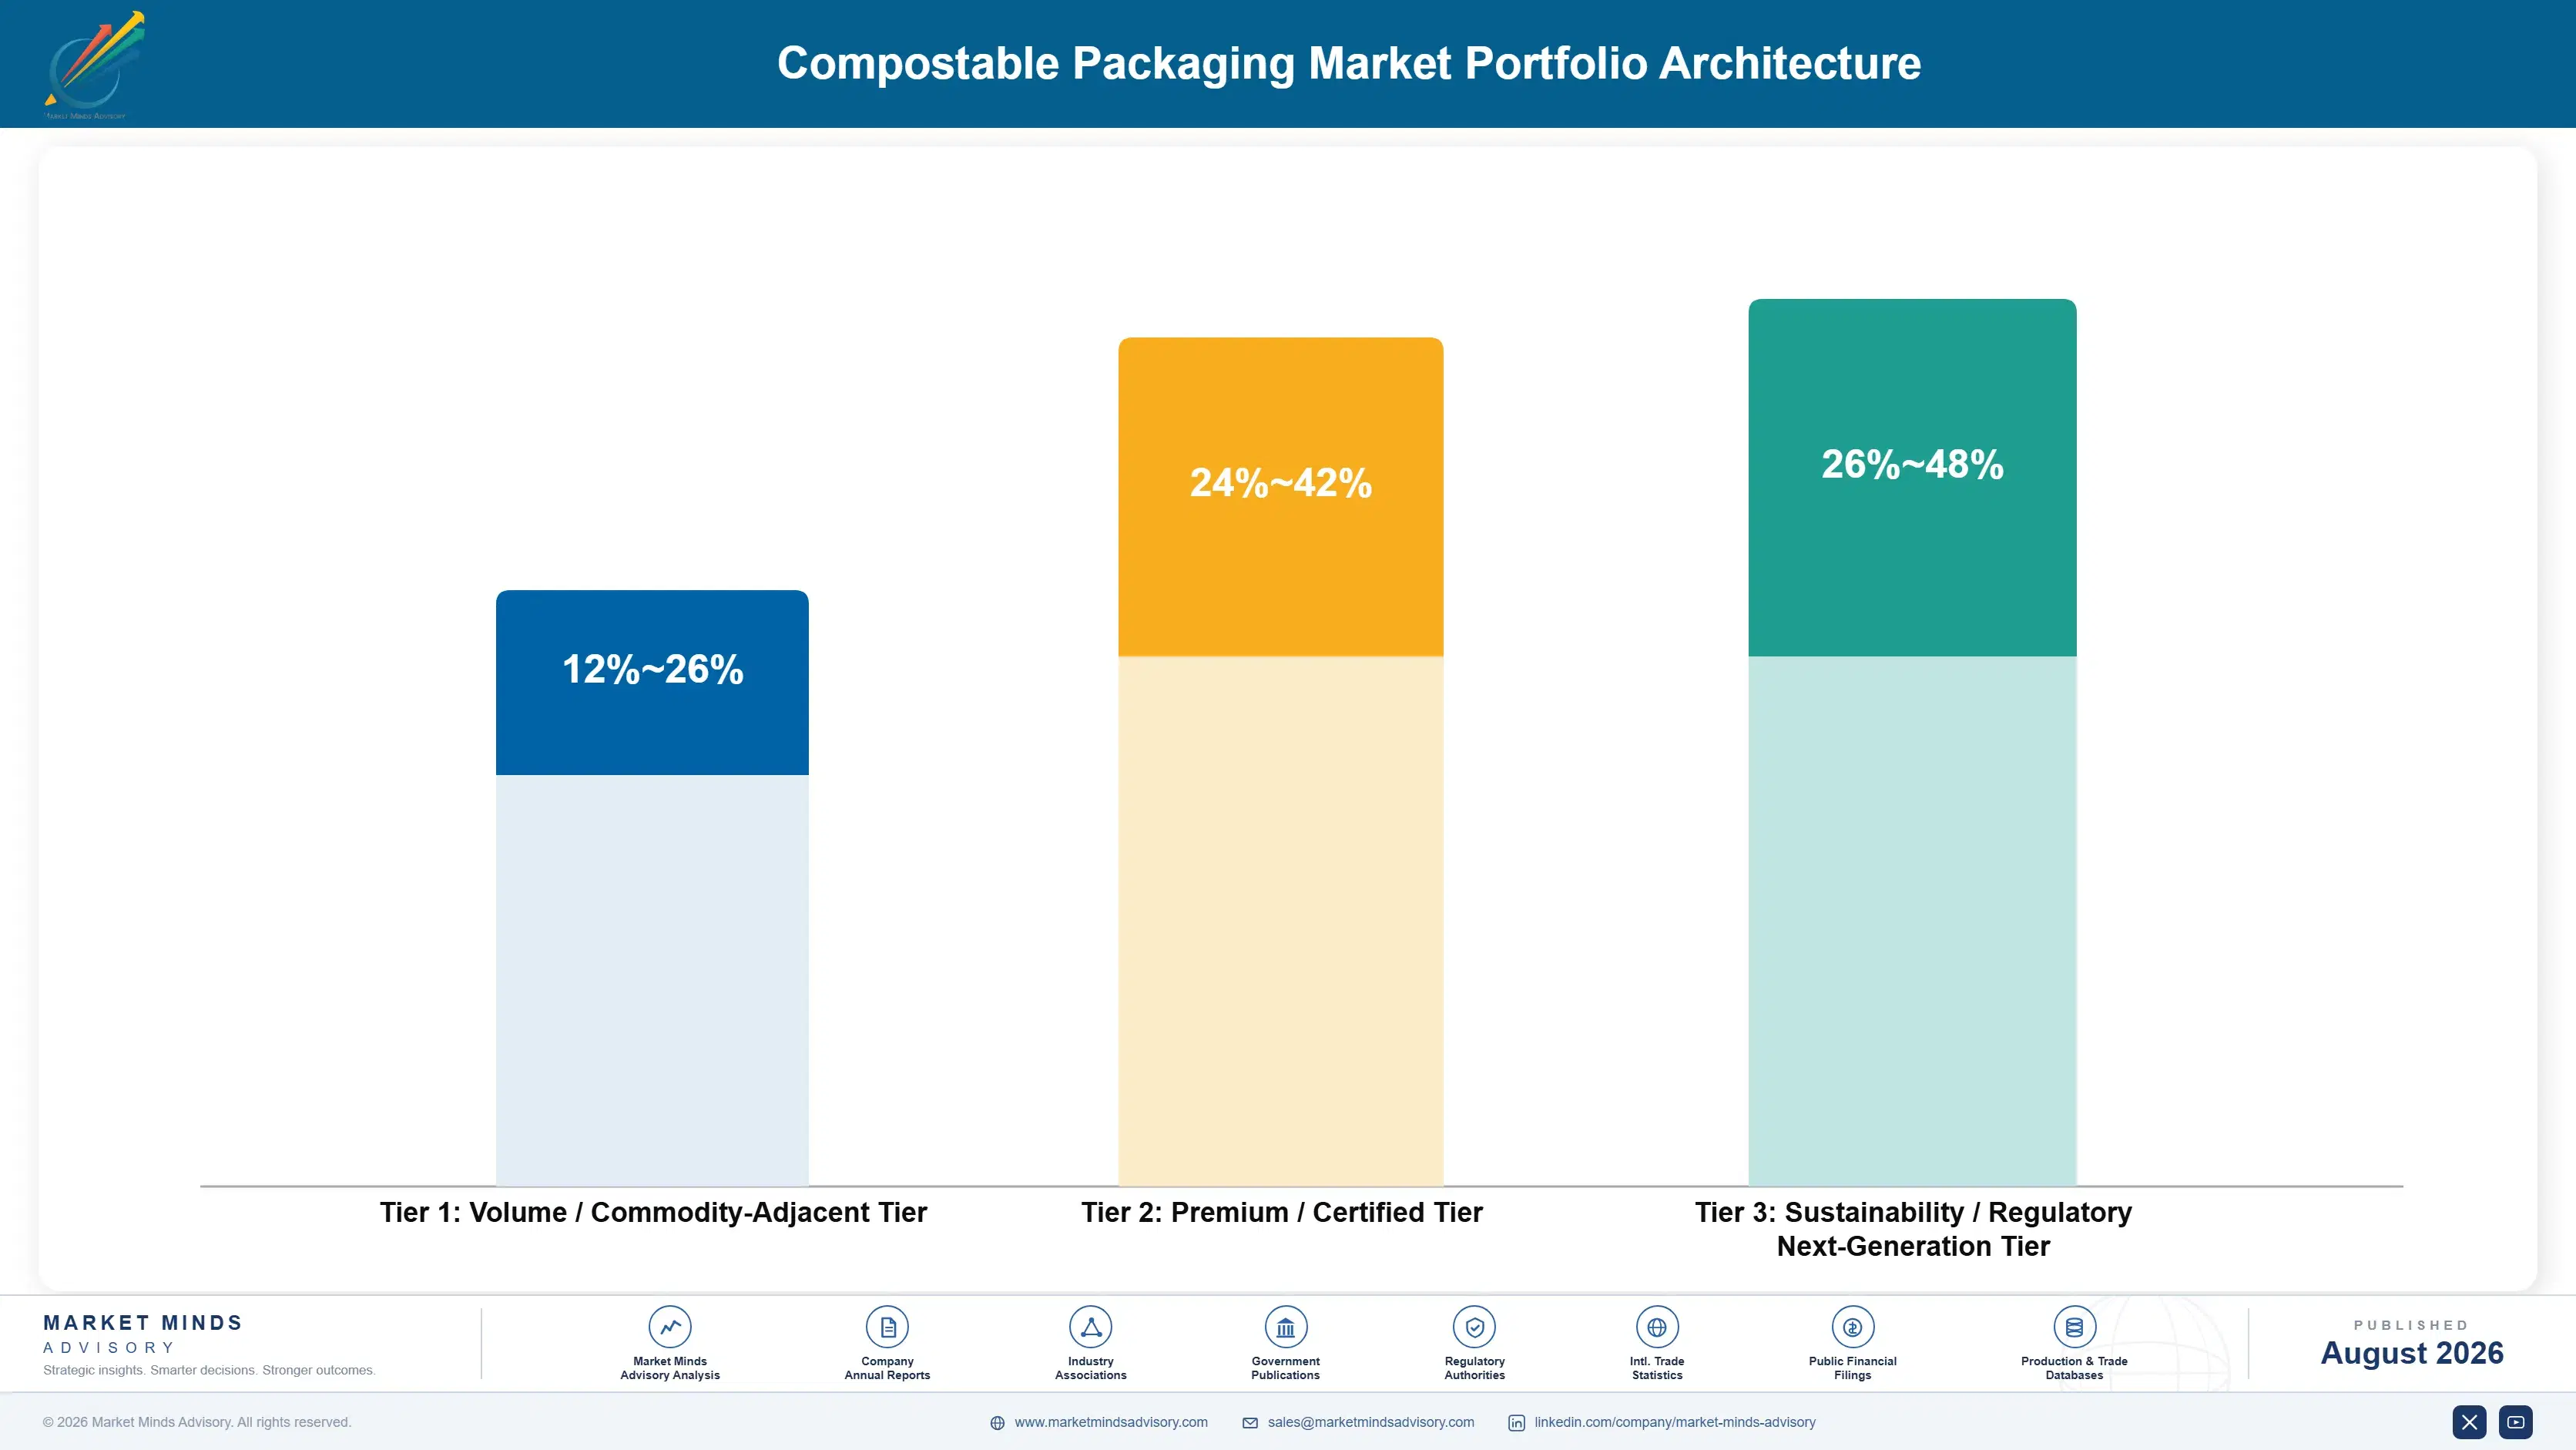
The portfolio splits into three tiers with genuinely different economics. Standard industrially compostable plastics and molded fibre are the volume tier, where material cost and manufacturing scale drive competition directly. Regulatory-compliant premium formats earn considerably more, because certification depth and brand relationships narrow the qualified field substantially. Marine-degradable and home-compostable materials sit differently again, priced against the infrastructure problem they
The tension runs between standard compostable volume that fills converting capacity and premium marine-degradable work that earns the return. Molded fibre and polylactic acid packaging generate the tonnage that keeps converting lines loaded and maintains brand relationships through which higher-value conversations eventually happen. Yet this material competes on cost against every qualified supplier serving the same regulatory-driven demand. Suppliers managing this well treat standard volume as capacity utilisation and direct investment toward marine-degradable chemistry.

High-value pools concentrate where infrastructure limitation or regulatory urgency limits competition genuinely: marine-degradable materials solving the composting access problem directly, first-mover positions in newly restricted jurisdictions, and contamination-proof designs that facility operators actively prefer. All three resist the price competition defining standard compostable plastic, because the customer is purchasing a solved problem rather than comparing interchangeable certified materials across suppliers.

Volume / Commodity-Adjacent Tier

Standard polylactic acid packaging and molded fibre products sold into regulatory-driven foodservice and retail demand. The range is wide because feedstock-integrated producers earn respectably while those buying on spot markets frequently do not.
Gross Margin: 12-26%

Premium / Certified Tier

Regulatory-compliant premium formats carrying deep certification and established brand relationships in the most demanding jurisdictions worldwide. The range is wide because certification depth and brand exclusivity arrangements vary considerably by supplier and by market.
Gross Margin: 24-42%

Sustainability / Regulatory / Next-Generation Tier

Marine-degradable polymers, home-compostable formats, and contamination-proof design systems addressing the infrastructure gap directly and durably. The range is wide because marine-degradable production scale still varies enormously by producer currently across the industry.
Gross Margin: 26-48%
compostable-packaging-market-portfolio-architecture-1787324928242

High-value Sub-segments and Strategic Watch-out

PHA and Marine-Degradable Polymers

High value and the fastest growth at 15.8%, from the smallest base as brands seek genuine degradability independent of composting infrastructure entirely and permanently. Production cost remains meaningfully higher than established compostable plastics, limiting near-term adoption to premium and regulation-driven applications specifically for now across most markets.
Gross Margin: 28-48%

Regulatory-Compliant Premium Formats

High value with strong growth, protected by certification depth and brand relationships built during initial compliance rushes in newly restricted jurisdictions worldwide over time. First-mover positions persist well beyond the immediate regulatory deadline that created them, often for years afterward across an entire product category.
Gross Margin: 24-42%

Molded Fibre Packaging

The volume core across foodservice and protective packaging worldwide, and the category with the longest commercial history of the five segments listed in this section. Growth is steady at 9.1% but competition on cost is direct, holding margin below the marine-degradable tier positioned above it consistently.
Gross Margin: 12-26%

Industrially Compostable Rigid Plastics

The strategic watch-out, growing slowest as the infrastructure gap increasingly steers demand toward marine-degradable alternatives instead of conventional compostable plastics across most markets. Composting access dependence limits addressable markets exactly where growth in the broader category is fastest, exposing this segment to share loss over time.
Gross Margin: 14-28%

How Compostable Packaging Specifications Actually Commit

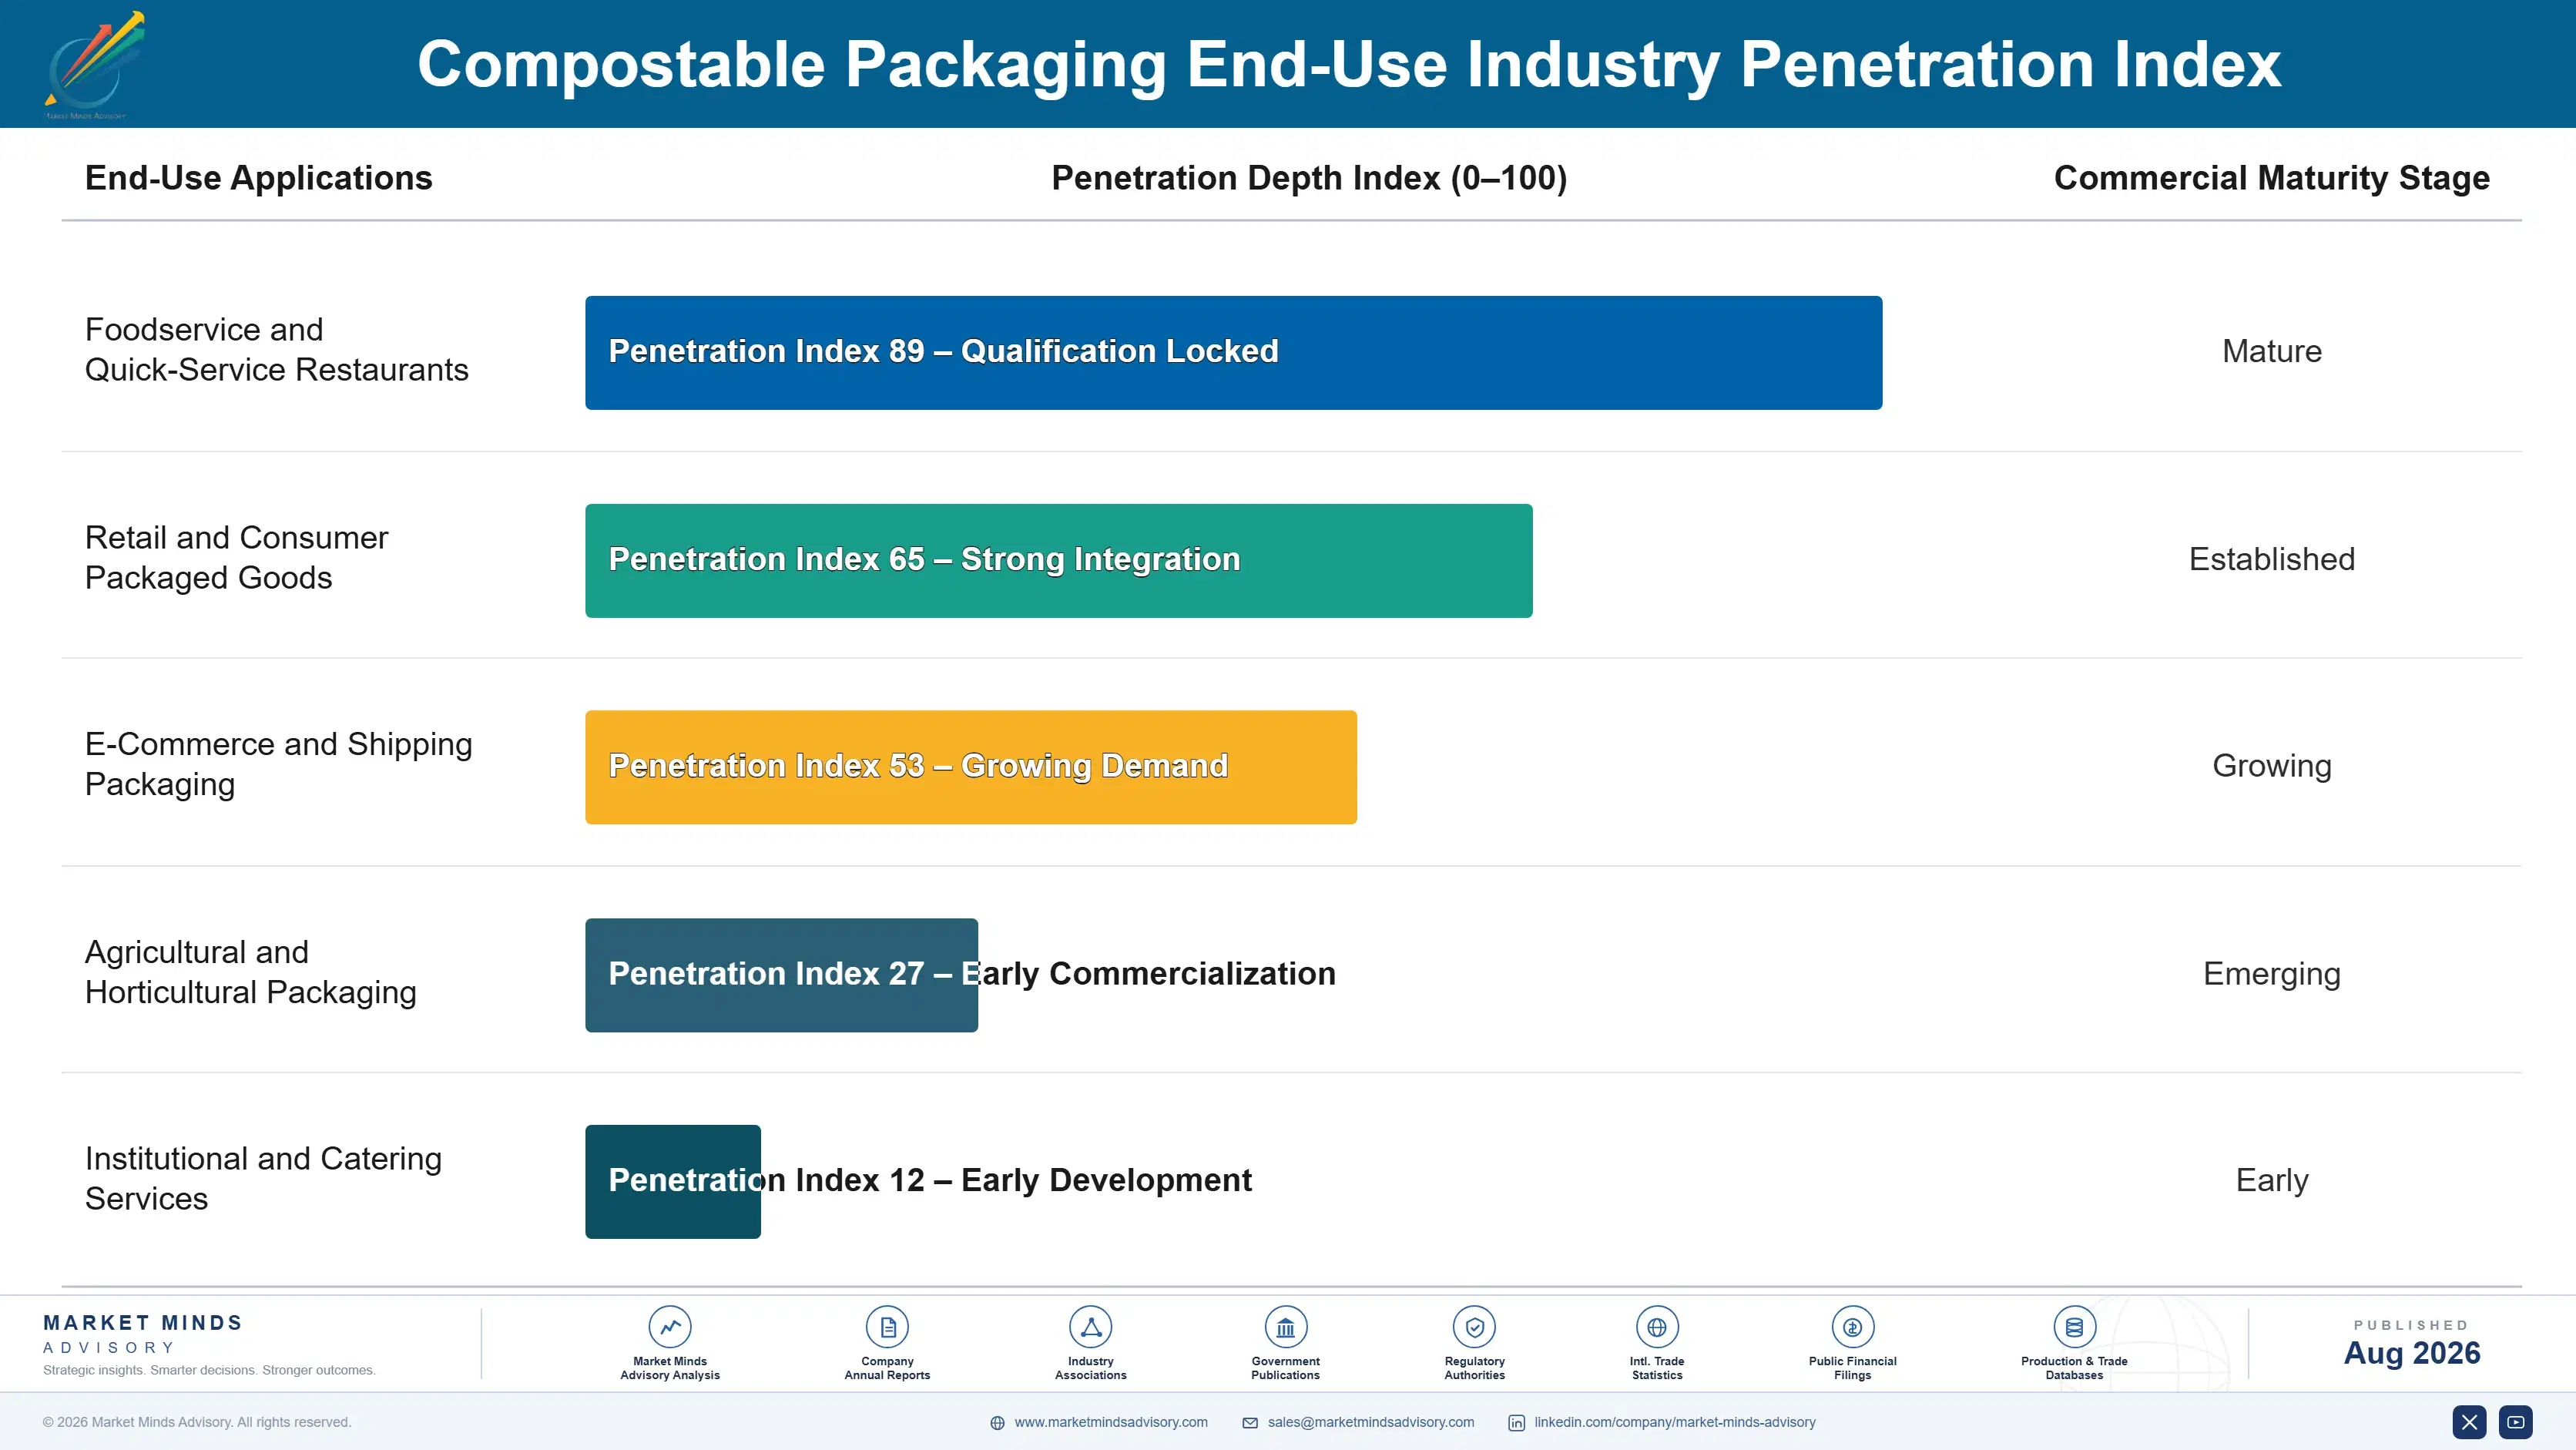
Revenue commits differently depending on the demand driver behind it. Regulatory-driven adoption locks in quickly once a ban takes effect, since brands have no alternative but compliant materials and reorder without further evaluation. Voluntary brand sustainability adoption moves more slowly and remains genuinely reversible if cost pressure or sentiment shifts, since nothing legally compels the purchasing decision. Understanding which driver applies shapes both pricing power and retention expec
Adoption depth varies sharply by buyer type. Foodservice chains facing direct regulatory restriction go deepest, standardising packaging across their network once compliance becomes mandatory. Consumer packaged goods brands adopt more selectively, often piloting compostable formats in specific product lines before broader rollout. E-commerce and shipping packaging buyers weigh cost more heavily, since sustainability signalling matters less in materials consumers rarely see.

Buyer profiles have shifted from packaging engineers toward sustainability officers and compliance functions with distinct priorities. A packaging engineer once compared material cost and performance directly; a sustainability officer now tracks brand commitment progress, and a compliance function drives specification against jurisdiction-specific restrictions a purely commercial evaluation would never have prioritised. Suppliers selling on performance alone find decisions made by people who never saw their spec sheet.
compostable-packaging-market-end-use-penetration-index-1787324928733

Our Call On Compostable Packaging

These are among the four positions where our research anticipates prominent divergence between winners and laggards over the coming forecast period. Each is grounded in the demand model, the regulatory perimeter, and the announced capacity pipeline.
01 / INFRASTRUCTURE INDEPENDENCE STRATEGY

Marine-degradable chemistry solves the real problem

Composting infrastructure investment lags material adoption by years in nearly every market, and suppliers who develop materials degrading without requiring industrial facilities at all bypass the collection bottleneck limiting conventional compostable plastic adoption entirely. That capability commands a genuine premium in markets where composting collection barely exists, since it solves the infrastructure problem directly rather than depending on a system still being built out slowly. Suppliers should prioritise marine-degradable development, because it addresses the actual constraint rather than optimising further around a broken collection system.
02 / EPR FEE POSITIONING

Fee differentials convert sustainability into a finance argument

Several jurisdictions now charge meaningfully lower extended producer responsibility fees for genuinely compostable packaging than for conventional plastic, and suppliers who quantify that fee saving directly for prospective customers convert an abstract sustainability argument into a concrete finance-function calculation instead. That framing reaches budget holders who never responded to environmental messaging alone, opening conversations pure sustainability positioning could never access on its own. Fee differentials worth up to 200 euros per tonne meaningfully offset the material cost premium compostable formats still carry.
03 / LABELLING STANDARDS LEADERSHIP

Contamination risk threatens the whole category, not one supplier

Composting facility operators increasingly reject entire batches contaminated by non-compostable material, and suppliers who invest in clear, standardised labelling reduce rejection risk that damages the entire category's credibility with facility operators and consumers alike. That investment protects not just an individual supplier's reputation but the broader market's access to composting infrastructure that facility operators could otherwise simply refuse to serve entirely going forward. Suppliers leading on labelling standards increasingly shape industry-wide certification requirements that competitors must eventually follow regardless, cementing durable category influence.
04 / FIRST-MOVER REGULATORY TIMING

Early positioning in new bans outlasts the compliance rush itself

Each jurisdiction enacting a single-use plastic ban creates a compressed window during which brands must rapidly qualify compliant alternatives, and suppliers positioned with regulatory approval and local supply chain readiness before the ban takes effect capture disproportionate early share that later entrants struggle to displace afterward. That first-mover position, once established through initial brand contracts, tends to persist well beyond the immediate compliance rush as switching costs and proven performance both favour the incumbent. Suppliers should track legislative pipelines closely, positioning ahead of enactment rather than reacting after the deadline.

Engagement Snapshot From the Field

A live engagement with an industry participant carrying material or product regulatory and market exposure ahead of a defining policy shift, showing how our research translates into a defensible multi-year portfolio strategy.
MARKET MINDS ADVISORY · CLIENT ENGAGEMENT SUMMARY
Compostable Packaging Producer Strategic Portfolio Review and Transition Roadmap 2026·Investment Scenario on Compostable Packaging Exposure Evaluation 2025-26
CLIENT PROFILE
A multinational foodservice chain operating across 30 countries engaged MMA while planning a global packaging transition ahead of expanding single-use plastic restrictions. The client reported annual packaging spend near USD 210 million and faced compliance deadlines in twelve markets within an eighteen-month window, with packaging specifications currently varying considerably by country (client-reported, unverified by MMA).
STRATEGIC CHALLENGE
Standardising packaging globally would simplify procurement, but the client's markets varied enormously in composting infrastructure maturity, meaning a single specification risked failing entirely in markets with weak collection systems. The board wanted cost certainty across the transition, but material pricing and supplier readiness both varied considerably between regions facing near-term compliance deadlines.
MMA APPROACH
MMA mapped the client's twelve compliance-deadline markets against composting infrastructure maturity, identifying where conventional compostable materials would function adequately versus where marine-degradable alternatives were genuinely necessary. We modelled total cost including EPR fee differentials rather than material price alone. We then assessed supplier readiness in each market against the client's compressed compliance timeline specifically.
KEY FINDINGS
  1. Four of the twelve markets lacked adequate composting infrastructure to support conventional compostable packaging, requiring marine-degradable alternatives despite their higher material cost.
  2. EPR fee differentials in six markets offset roughly 40% of the compostable material premium, materially changing the total cost comparison against conventional plastic (client-reported, unverified by MMA).
  3. Only three of eight assessed suppliers could realistically deliver certified marine-degradable packaging at the client's required volume within the eighteen-month compliance window.
  4. A single global specification would have failed compliance testing in the four infrastructure-weak markets, confirming the need for a differentiated regional approach instead.
CLIENT PROFILE
A multinational foodservice chain operating across 30 countries engaged MMA while planning a global packaging transition ahead of expanding single-use plastic restrictions. The client reported annual packaging spend near USD 210 million and faced compliance deadlines in twelve markets within an eighteen-month window, with packaging specifications currently varying considerably by country (client-reported, unverified by MMA).
STRATEGIC CHALLENGE
Standardising packaging globally would simplify procurement, but the client's markets varied enormously in composting infrastructure maturity, meaning a single specification risked failing entirely in markets with weak collection systems. The board wanted cost certainty across the transition, but material pricing and supplier readiness both varied considerably between regions facing near-term compliance deadlines.
MMA APPROACH
MMA mapped the client's twelve compliance-deadline markets against composting infrastructure maturity, identifying where conventional compostable materials would function adequately versus where marine-degradable alternatives were genuinely necessary. We modelled total cost including EPR fee differentials rather than material price alone. We then assessed supplier readiness in each market against the client's compressed compliance timeline specifically.
KEY FINDINGS
  1. Four of the twelve markets lacked adequate composting infrastructure to support conventional compostable packaging, requiring marine-degradable alternatives despite their higher material cost.
  2. EPR fee differentials in six markets offset roughly 40% of the compostable material premium, materially changing the total cost comparison against conventional plastic (client-reported, unverified by MMA).
  3. Only three of eight assessed suppliers could realistically deliver certified marine-degradable packaging at the client's required volume within the eighteen-month compliance window.
  4. A single global specification would have failed compliance testing in the four infrastructure-weak markets, confirming the need for a differentiated regional approach instead.
RECOMMENDED STRATEGY
Phase 1: Phase 1 (0 to 6 months): Qualify marine-degradable suppliers for the four infrastructure-weak markets immediately, given the limited qualified supplier pool available. Phase 2: Phase 2 (6 to 18 months): Deploy conventional compostable packaging across the remaining eight compliance-deadline markets, prioritising EPR fee-advantaged formats. Phase 3: Phase 3 (18 to 36 months): Extend the differentiated specification approach across the client's remaining markets ahead of anticipated future regulatory expansion.
OUTCOME
The client met compliance deadlines across all twelve markets using a differentiated regional specification rather than a single global standard that would have failed in infrastructure-weak markets. EPR fee positioning reduced the transition's total cost meaningfully below the original budget, and the approach is now the client's standard framework for future market entries (client-reported, unverified by MMA).

Frequently Asked Questions

Foundational context covering the market sizes, CAGR, scope, country, region and competition that inform every finding below. This section is provided to cover basics and most often pre-purchase conversations, answered from the MMA Primary Research Dataset.

What is the current size of the Compostable Packaging Market?

The global compostable packaging market is valued at USD 9.2 billion in 2025, covering industrially compostable, home compostable, molded fibre, and marine-degradable packaging materials. Conventional recyclable plastic and uncertified biodegradable claims are excluded.

How large will the Compostable Packaging Market be by 2036?

The market is forecast to reach USD 25.22 billion by 2036 in the base case, about 2.50 times the 2026 level. That represents incremental value of roughly USD 15.13 billion across the forecast decade.

What is the CAGR for the Compostable Packaging Market 2026 to 2036?

The market grows at a 9.6% CAGR in the base case, with bull and bear scenarios at 10.8% and 8.4%. The spread turns mainly on plastic ban expansion and whether marine-degradable polymer costs fall enough to broaden adoption.

Which segment is growing fastest?

PHA and marine-degradable polymers grow fastest at 15.8%, about 1.65 times the overall rate, as brands seek materials degrading without industrial composting access. Molded fibre packaging follows at 9.1% on established foodservice demand.

Who are the major companies in the Compostable Packaging Market?

Leading suppliers include NatureWorks, Novamont, BASF, TIPA, and Huhtamaki, holding roughly 24% between them. Marine-degradable polymer specialists are increasingly capturing premium positioning in infrastructure-weak markets.

Which country is growing fastest?

Italy grows fastest at an 11.2% CAGR, building on decades of composting policy leadership and mature collection infrastructure. India follows on substantial single-use plastic restrictions extending across additional packaging categories.

Report Segmentation Architecture

The full report scope spans multiple orthogonal segmentation dimensions, with cross-tabulated demand data provided for each dimension pair. Coverage extends further to regional breakdowns, trend trajectories, and the competitive detail needed to support segment-level decision-making.

By Material Chemistry

  • Polylactic Acid and Starch-Based Plastics
  • PHA and Marine-Degradable Polymers
  • Molded Fibre Packaging
  • Home Compostable Flexible Films
  • Compostable Coatings and Laminates

By End-Use Industry

  • Foodservice and Quick-Service Restaurants
  • Retail and Consumer Packaged Goods
  • E-Commerce and Shipping Packaging
  • Agricultural and Horticultural Packaging
  • Institutional and Catering Services

By Compostability Standard

  • Industrial Composting Certified
  • Home Composting Certified
  • Marine and Soil Biodegradable
  • Dual-Certified Multi-Standard Products

By Region

  • North America
  • Western Europe
  • East Asia
  • South Asia and Pacific
  • Latin America
  • Middle East and Africa
  • Eastern Europe

Scope, Methodology, and Coverage

Every figure in this report is reproducible from documented input assumptions. The scope below maps the historical period, the forecast horizon, the segmentation dimensions, and the countries covered, alongside the underlying primary and qualitative methodology.
Historical Period
2020 to 2025
Forecast Period
2026 to 2036
Base Year
2025 (USD billions; MMA Primary Research Dataset, August 2026)
Market Definition
The compostable packaging market comprises packaging materials certified to break down into carbon dioxide, water, and biomass within a defined timeframe under specified composting or biodegradation conditions, valued at resin producer and converter selling prices. It spans industrially compostable rigid and flexible packaging including polylactic acid and starch-based plastics, home compostable formats certified for ambient composting conditions, molded fibre packaging from recycled paper and agricultural residue, and PHA and other marine-degradable polymers that break down without requiring industrial composting infrastructure. Conventional recyclable plastic packaging without compostability certification, oxo-degradable plastics that fragment rather than genuinely compost, paper packaging lacking formal compostability certification, and food-contact safety testing services sold separately are excluded.
Quantitative Units
USD billions (current prices); packaging volume in metric tonnes by material chemistry where applicable
Segmentation Dimensions
By Material Chemistry; By End-Use Industry; By Compostability Standard; By Region
Regions Covered
North America, Western Europe, East Asia, South Asia and Pacific, Latin America, Middle East and Africa, Eastern Europe
Countries Covered
USA, Canada, Germany, France, UK, Italy, Spain, Netherlands, Sweden, Austria, China, Japan, South Korea, India, Australia, Thailand, Vietnam, Indonesia, Brazil, Chile, Mexico, Argentina, UAE, Saudi Arabia, South Africa, Egypt, Poland, Czechia, Hungary, Romania, and additional markets relevant to this sector
Key Companies Profiled
NatureWorks, Novamont, BASF, TIPA, Huhtamaki, Danimer Scientific, Newlight Technologies, Genpak, Eastman Chemical, Total Corbion PLA, FKuR, BioPak, Vegware, World Centric, Sulapac, Notpla, Mango Materials, Kaneka, Plantic Technologies, Futamura Group
Quantitative Methodology
Primary survey, n=3,800 respondents, Q4 2025, six countries; demand-side model with trade association cross-validation
Qualitative Methodology
47 expert interviews, Q4 2025; applied to validate demand model assumptions, identify emerging dynamics, and assess competitive positioning
Report Format
PDF and XLSX data workbook (Word format preview document)
Publisher
Market Minds Advisory
Report Code
MMA-2026-PAC-196
Published
August 2026
Contact
sales@marketmindsadvisory.com | www.marketmindsadvisory.com

Purchase the full Compostable Packaging Market Report (2026 to 2036).

The full MMA Compostable Packaging report sizes the market across five material chemistries, five end-use industries, four compostability standards, and seven regions through 2036. It profiles 20 suppliers on a consistent basis of compostable packaging revenue, scoring each on marine-degradable chemistry depth, regulatory positioning and first-mover advantage, contamination-proof design capability, and feedstock integration. Scenario models quantify how single-use plastic regulation, composting infrastructure investment, and extended producer responsibility fees move both volume and achievable margin by material chemistry. The report also includes composting infrastructure coverage mapping by market, EPR fee differential tracking across jurisdictions, and marine-degradable polymer cost curve analysis.
Five-chemistry and four-standard market sizing through 2036
Twenty-supplier benchmark on compostable packaging revenue
Composting infrastructure coverage mapping by major market
Extended producer responsibility fee differential tracking
Marine-degradable polymer cost curve and adoption analysis
Single-use plastic regulation tracking across jurisdictions

Built For The People Who Decide

From boardroom strategy to bench-side execution, this report is read cover-to-cover by leaders shaping the next decade of their industry, turning demand scenarios, market dynamics and valuation benchmarks into decisions.
CXOs/ Presidents/ VPs/ Managers
M&A and Corporate Development
Strategy Teams and R&D Heads
Procurement and Product Directors
Regulatory and Compliance Leaders
Investor Relations and Equity Analysts