Market Minds Advisory
Compositing Equipment Market

Compositing Equipment Market: What The Neighbours Smell Decides Which Plants Survive

This is the only waste treatment where the biggest commercial risk is what the neighbours smell. Odour closes sites and blocks permits, and it has nothing to do with how well the material composts.

Lead Analyst

David Horsley

Published

September 2026

Make Smarter Decisions with Customized Research Insights

Request a free sample report and evaluate market opportunities, growth trends, and competitive dynamics relevant to your business needs.

2025 MARKET VALUE$1.9BMarket Size 2025
2036 FORECAST VALUE$4.0BBase Case , 2026 to 2036
CAGR 2026 TO 20367.1 %Bull 8.4% / Bear 5.8%
INCREMENTAL OPPORTUNITY$2.0BNet 10- year value creation
EXPANSION MULTIPLE1.99x2036 value over 2026 base
Strategic Levers
M&A Pipeline
Regional Outlook
Country Rankings
Competitive Intelligence
Segmental Deep-dive
Call-Us : 91 93563 13602

Executive Snapshot and Market Trajectory

A composting facility fails on odour complaints far more often than on process performance, and 38% of closures and permit refusals trace to exactly that. The biology is straightforward and the neighbours are not. The market reaches USD 1.9 billion in 2025 and grows at 7.1% through 2036.
Odour control and biofiltration grows fastest at 10.8%, about 1.52 times the market rate, because enclosed and aerated systems get chosen to keep a site permitted rather than to make better compost. Western Europe holds 31% of value, above the band this framework applies, because mandatory separate biowaste collection across the union is the strongest regulatory driver found anywhere in the world today. North America takes 24% on a patchwork of state mandates.
Concentration sits at 31%, low because equipment is built by regional machinery firms and by process specialists who rarely compete directly against one another in the same tender. Competition here turns on permit survivability and on contamination handling rather than throughput per hour. Separately collected biowaste arrives carrying 3% to 9% non-organic contamination, and screening equipment now does work that collection systems should have done upstream at the kerbside.
Market Definition
The composting equipment market covers machinery and systems processing organic waste into compost, spanning feedstock shredding and mixing, windrow turning, in-vessel and aerated static pile systems, aeration and process control, screening and refining, and odour control and biofiltration. Anaerobic digestion and biogas equipment, landfill machinery, waste collection vehicles, municipal recycling sorting plant, and the compost product itself are excluded.
Base Year Value
$1.9B in 2025 (MMA Primary Research Dataset, August 2026)
Forecast Period
2026 to 2036, eleven discrete annual values
CAGR
7.1% base case. Bull 8.4%. Bear 5.8%.
Fastest Growth Segment
Odour Control and Biofiltration: 10.8% CAGR
Fastest Growth Country
India: 10.2% CAGR
Fastest Growth Region
South Asia and Pacific: 9.2% CAGR
Largest Region
Western Europe: 31% of 2025 global value
Market Leaders
Komptech, Vermeer, Eggersmann Group, Doppstadt, Terex Ecotec. Source: MMA Primary Research Dataset, July 2026.
Primary Survey
n=3,800 procurement and R&D decision-makers, Q4 2025, six countries
Methodology
Demand-side build-up, cross-validated against public data, 47 expert interviews

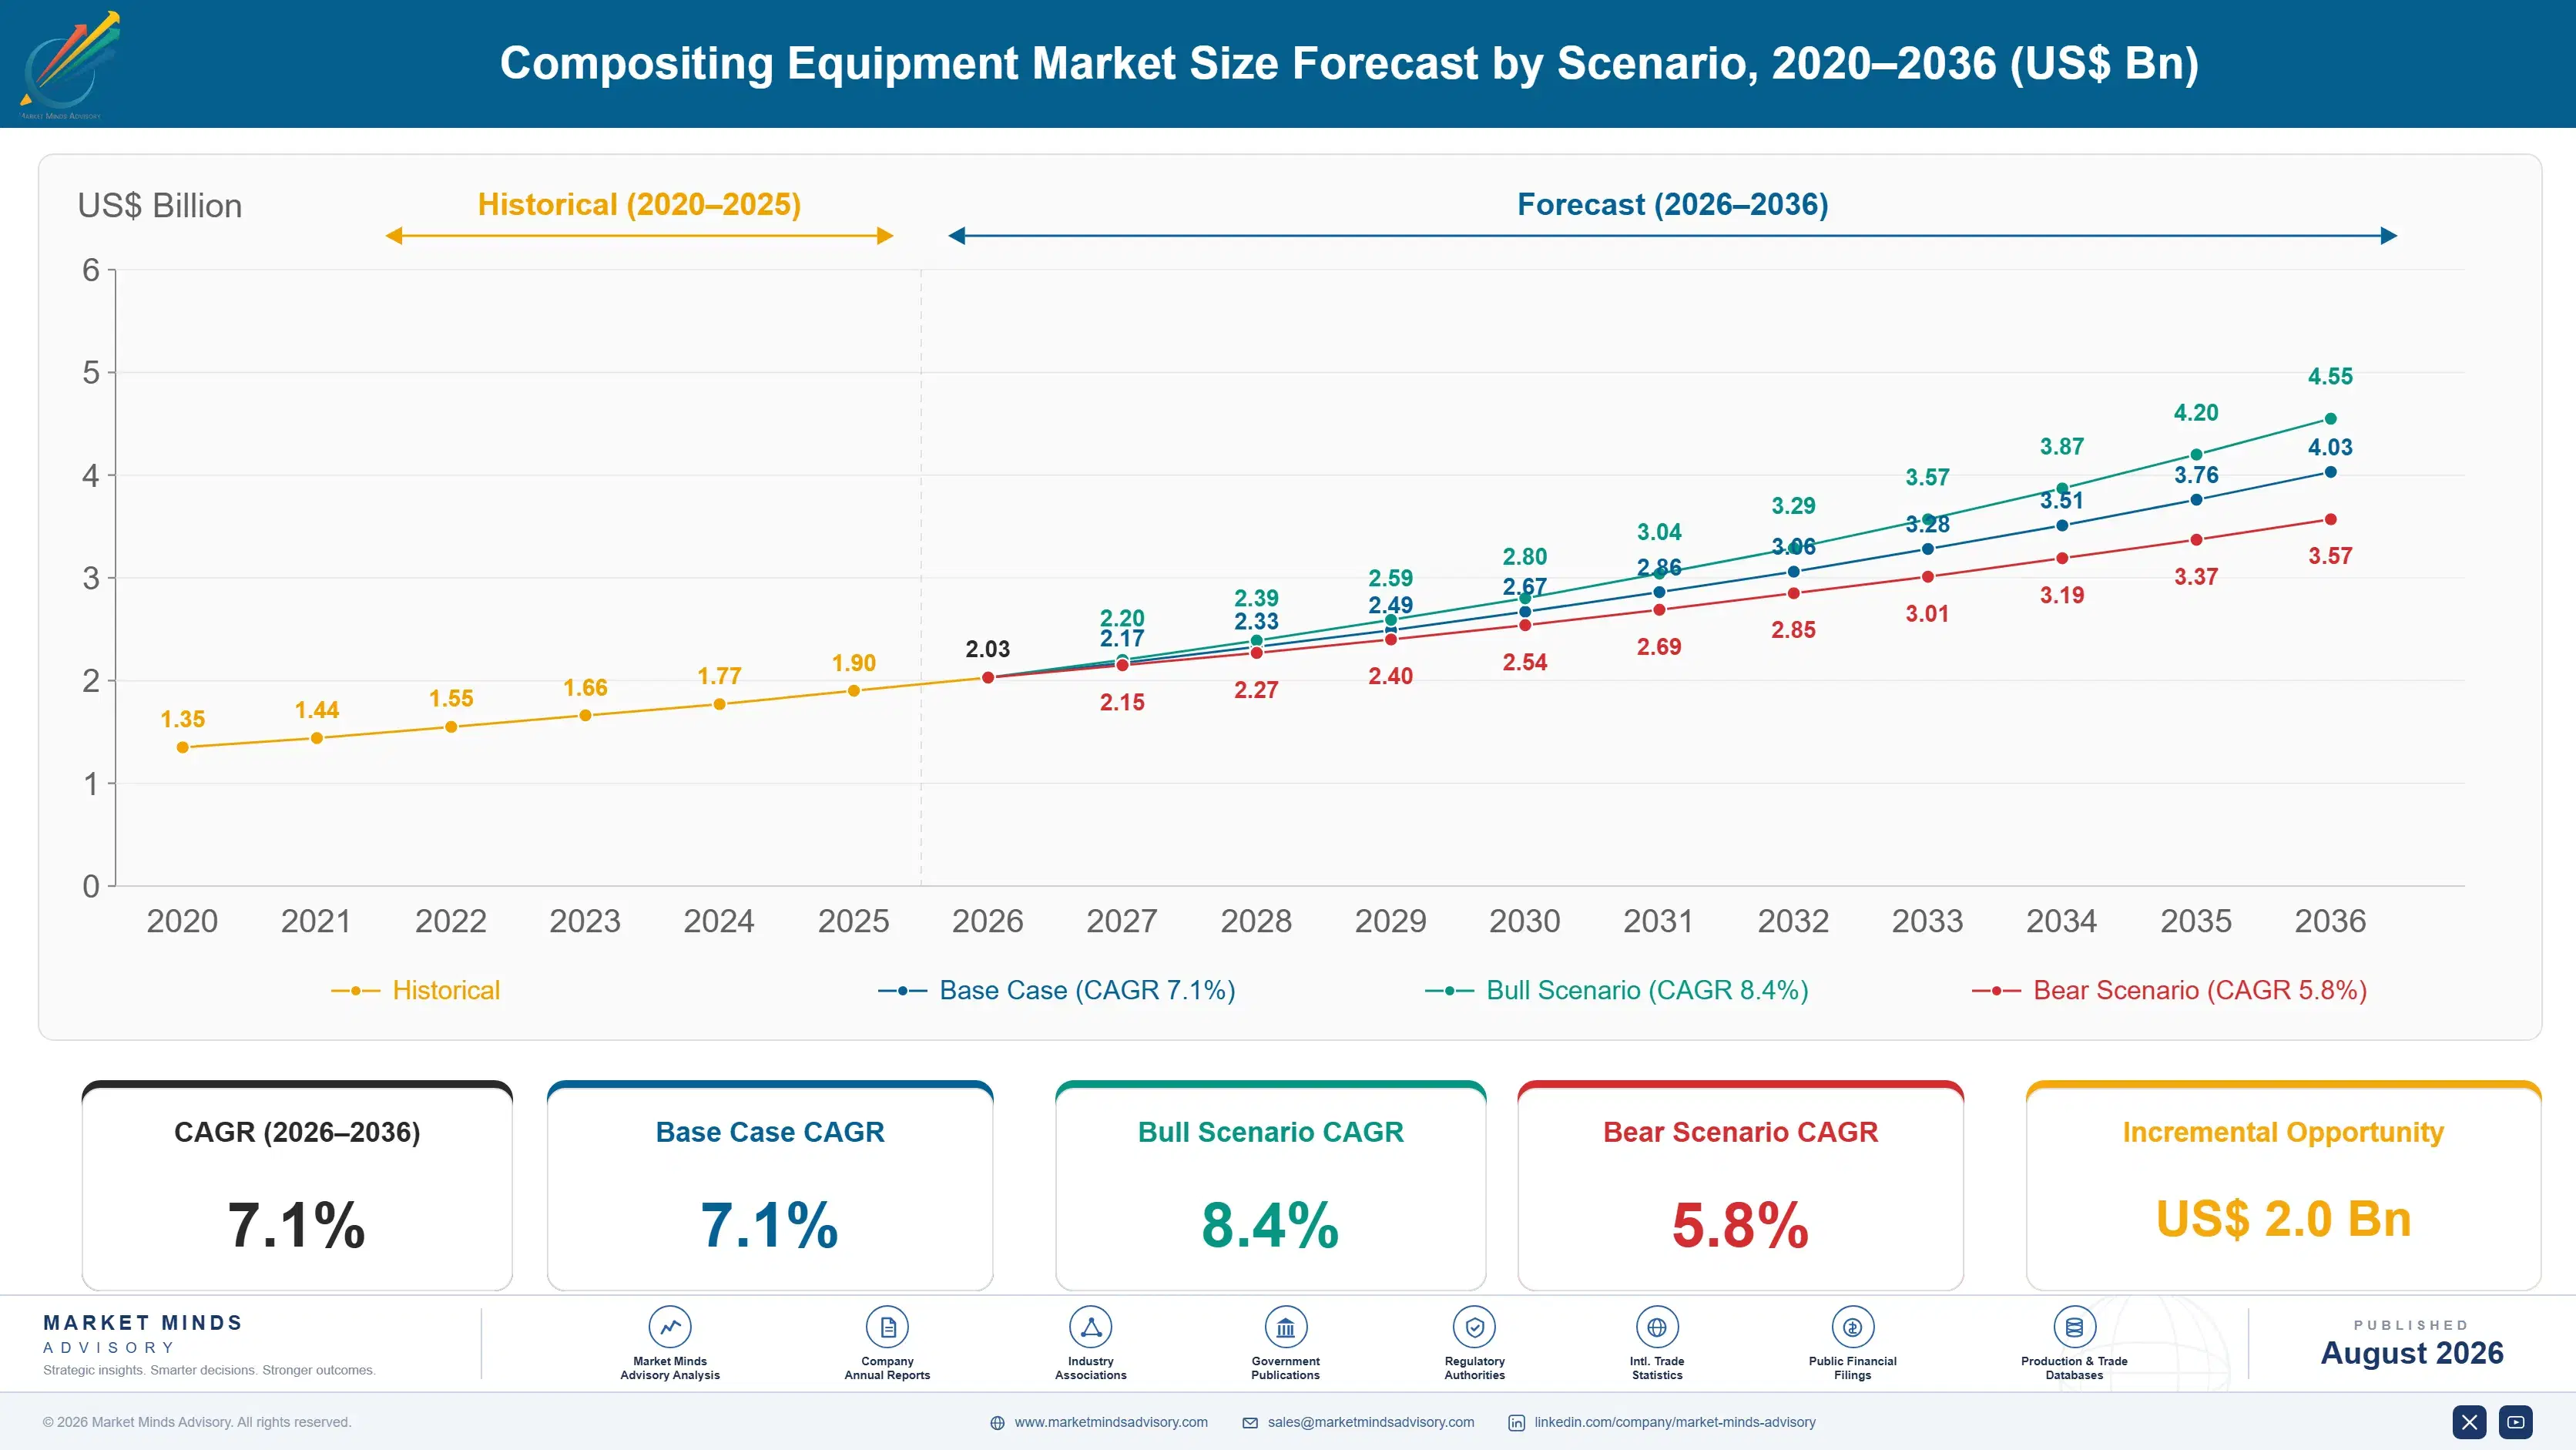
Compositing Equipment Market Forecast Scenarios

compositing-equipment-market-size-forecast-scenario-1787333730001
Between 2020 and 2025 the obligation to compost arrived faster than the capacity to do it. European member states adopted mandatory separate biowaste collection, several American states and Canadian provinces did the same, and the treatment capacity to receive that material did not exist in most places. Planning and odour objections slowed every new facility. A 5.9% historical CAGR reflects capacity lagging obligation rather than any shortage of demand.
Three mechanisms carry the 7.1% base case. Mandatory separate biowaste collection is the largest, since a collected stream must be treated somewhere and landfill is closing to organics across most developed markets. Odour compliance is the second, because enclosed and aerated systems are increasingly the only configuration a planning authority will approve. And contamination in collected feedstock keeps driving screening and refining investment that nobody budgeted for at design stage.
The 8.4% bull case turns on enforcement of collection mandates tightening, which would expose a capacity gap most authorities currently manage by exporting or landfilling quietly. The 5.8% bear case is municipal capital constraint, since a composting facility competes against every other public spending priority. Neither scenario depends on anything the equipment does or fails to do.

A Process Judged By People Who Live Nearby

Composting is biologically simple and politically difficult. The process works reliably given moisture, oxygen, and time, and none of that is where facilities actually fail. They fail because somebody living two kilometres downwind complains, an authority investigates, and a permit is refused or quietly withdrawn. Roughly 38% of closures and refusals trace to odour rather than to any process problem at all.
TOP FIVE CONCENTRATION31%Regional builders and process specialists divide the field broadly
AVERAGE PLANT VALUEUSD 3.1 millionTypical equipment scope for a mid-size municipal composting facility
ODOUR CLOSURE SHARE38%Facility closures and permit refusals attributed to odour complaints
FEEDSTOCK CONTAMINATION RATE3 to 9 percentNon-organic material arriving in separately collected biowaste streams
EQUIPMENT SERVICE LIFE12 to 20 yearsOperating years before major equipment replacement becomes necessary
LEADING PRODUCER SHARE34%Manufacturing concentrates where biowaste regulation first arrived and stayed
That reality decides the technology. Enclosed vessels, covered aerated piles, and negative pressure buildings with biofiltration cost several times an open windrow and produce compost that is not meaningfully better in any measurable respect. They get specified because they let the site exist at all, which is a completely different purchasing argument and one that most equipment suppliers still under-use in front of the people who sign.
Contamination is the second problem nobody designed for. Separately collected biowaste arrives carrying 3% to 9% plastic film, packaging, and material that will not break down at the residence times a commercial plant actually runs. Screening equipment ends up doing work the collection system should have done, and the finished compost still fails quality standards on visible plastic content.
"Nobody has ever closed a composting plant because the compost was poor. They close because the smell reached a housing estate on a still evening in August. Every equipment decision on a modern site is really a decision about that evening."
Director, Organics Infrastructure Practice · MMA Construction and Industrial Equ

Market Trends

Odour Compliance Rather Than Process Decides Technology

An open windrow composts perfectly well and cannot be permitted within reach of housing in most developed markets any more. Enclosed vessels, covered aerated static piles, and negative pressure buildings with biofilters or scrubbers cost substantially more and produce compost of similar quality, and they get chosen because a planning authority will approve them. Roughly 38% of facility closures and permit refusals trace to odour complaints rather than to any operational failure. That makes odour control the deciding specification on almost every new site, and it grows at 10.8% against a market at 7.1%.
Market Impact: Collection mandatory across 27 stat
Contaminated Feedstock Pushes Investment Into Screening

Separate biowaste collection delivers material containing 3% to 9% plastic film, packaging, and items that will not degrade in the eight to twelve weeks a commercial process allows. Compostable packaging frequently falls into that category, since certification residence times exceed what most plants actually run. The result is finished compost failing quality standards on visible plastic, and operators buying screening and density separation equipment to remove what should never have arrived. That investment was rarely in the original plant design, and it is becoming a standard retrofit across facilities built only a few years ago.
Market Impact: Landfill taxes exceed 100 per tonne

Market Opportunities and Growth Drivers

Separate Biowaste Collection Became Mandatory Across Europe

European member states have been obliged to collect biowaste separately since the end of 2023, and a stream that is collected has to be treated somewhere while landfill closes to organics in parallel. That converts composting capacity from a municipal choice into an obligation with a legal basis sitting behind it. Implementation varies enormously between member states and enforcement remains uneven, but the direction is fixed and the capacity gap in several countries is substantial. Authorities discovering they have collection without treatment are the most motivated buyers anywhere in this market.
Market Impact: Permitting takes 3 to 6 years

Landfill Restriction Removes The Cheap Alternative Everywhere

Bans and escalating taxes on landfilling organic material have spread across Europe, North America, and increasingly Asia, which removes the option that made composting look expensive by comparison. Once organics cannot go to landfill the question stops being whether to treat them and becomes how, which puts composting against anaerobic digestion rather than against doing nothing at all. Composting wins on capital cost and operational simplicity for garden and mixed green waste while digestion takes the wetter food waste fraction. Both of those outcomes create equipment demand that did not previously exist anywhere.
Market Impact: Capital approval takes over 24 mont

Market Restraints and Challenges

Planning Objections Delay Or Prevent New Facilities

A composting facility attracts organised local opposition on odour, traffic, and vermin grounds long before it exists, and planning authorities give those objections considerable weight. The root cause is that the perceived nuisance is immediate and local while the benefit is diffuse and environmental, which is a losing combination at any planning hearing. Commercially this means permitted capacity grows far more slowly than collection obligations require, and projects stall for years. Suppliers are mitigating with fully enclosed designs, guaranteed emission performance, and reference sites that objectors can visit and smell for themselves.
Market Impact: Odour causes 38% of closures

Municipal Budgets Cap What Authorities Will Actually Spend

Composting facilities are funded from public capital that competes against roads, schools, and every other municipal priority, and an obligation to collect does not automatically produce the money to treat. The root cause is that waste treatment carries no political benefit and considerable political risk for whoever approves it. Commercially this pushes authorities toward the cheapest compliant option and toward exporting material rather than building capacity. Suppliers are mitigating with modular systems that scale in stages, operator financing and concession models, and designs that lower operating cost rather than capital cost.
Market Impact: Contamination reaches 9 percent
3 additional market trends, 4 additional growth drivers, and 2 additional restraints and challenges are covered in the full report. Contact sales@marketmindsadvisory.com to access the complete intelligence.

Segment CAGR and Growth Architecture

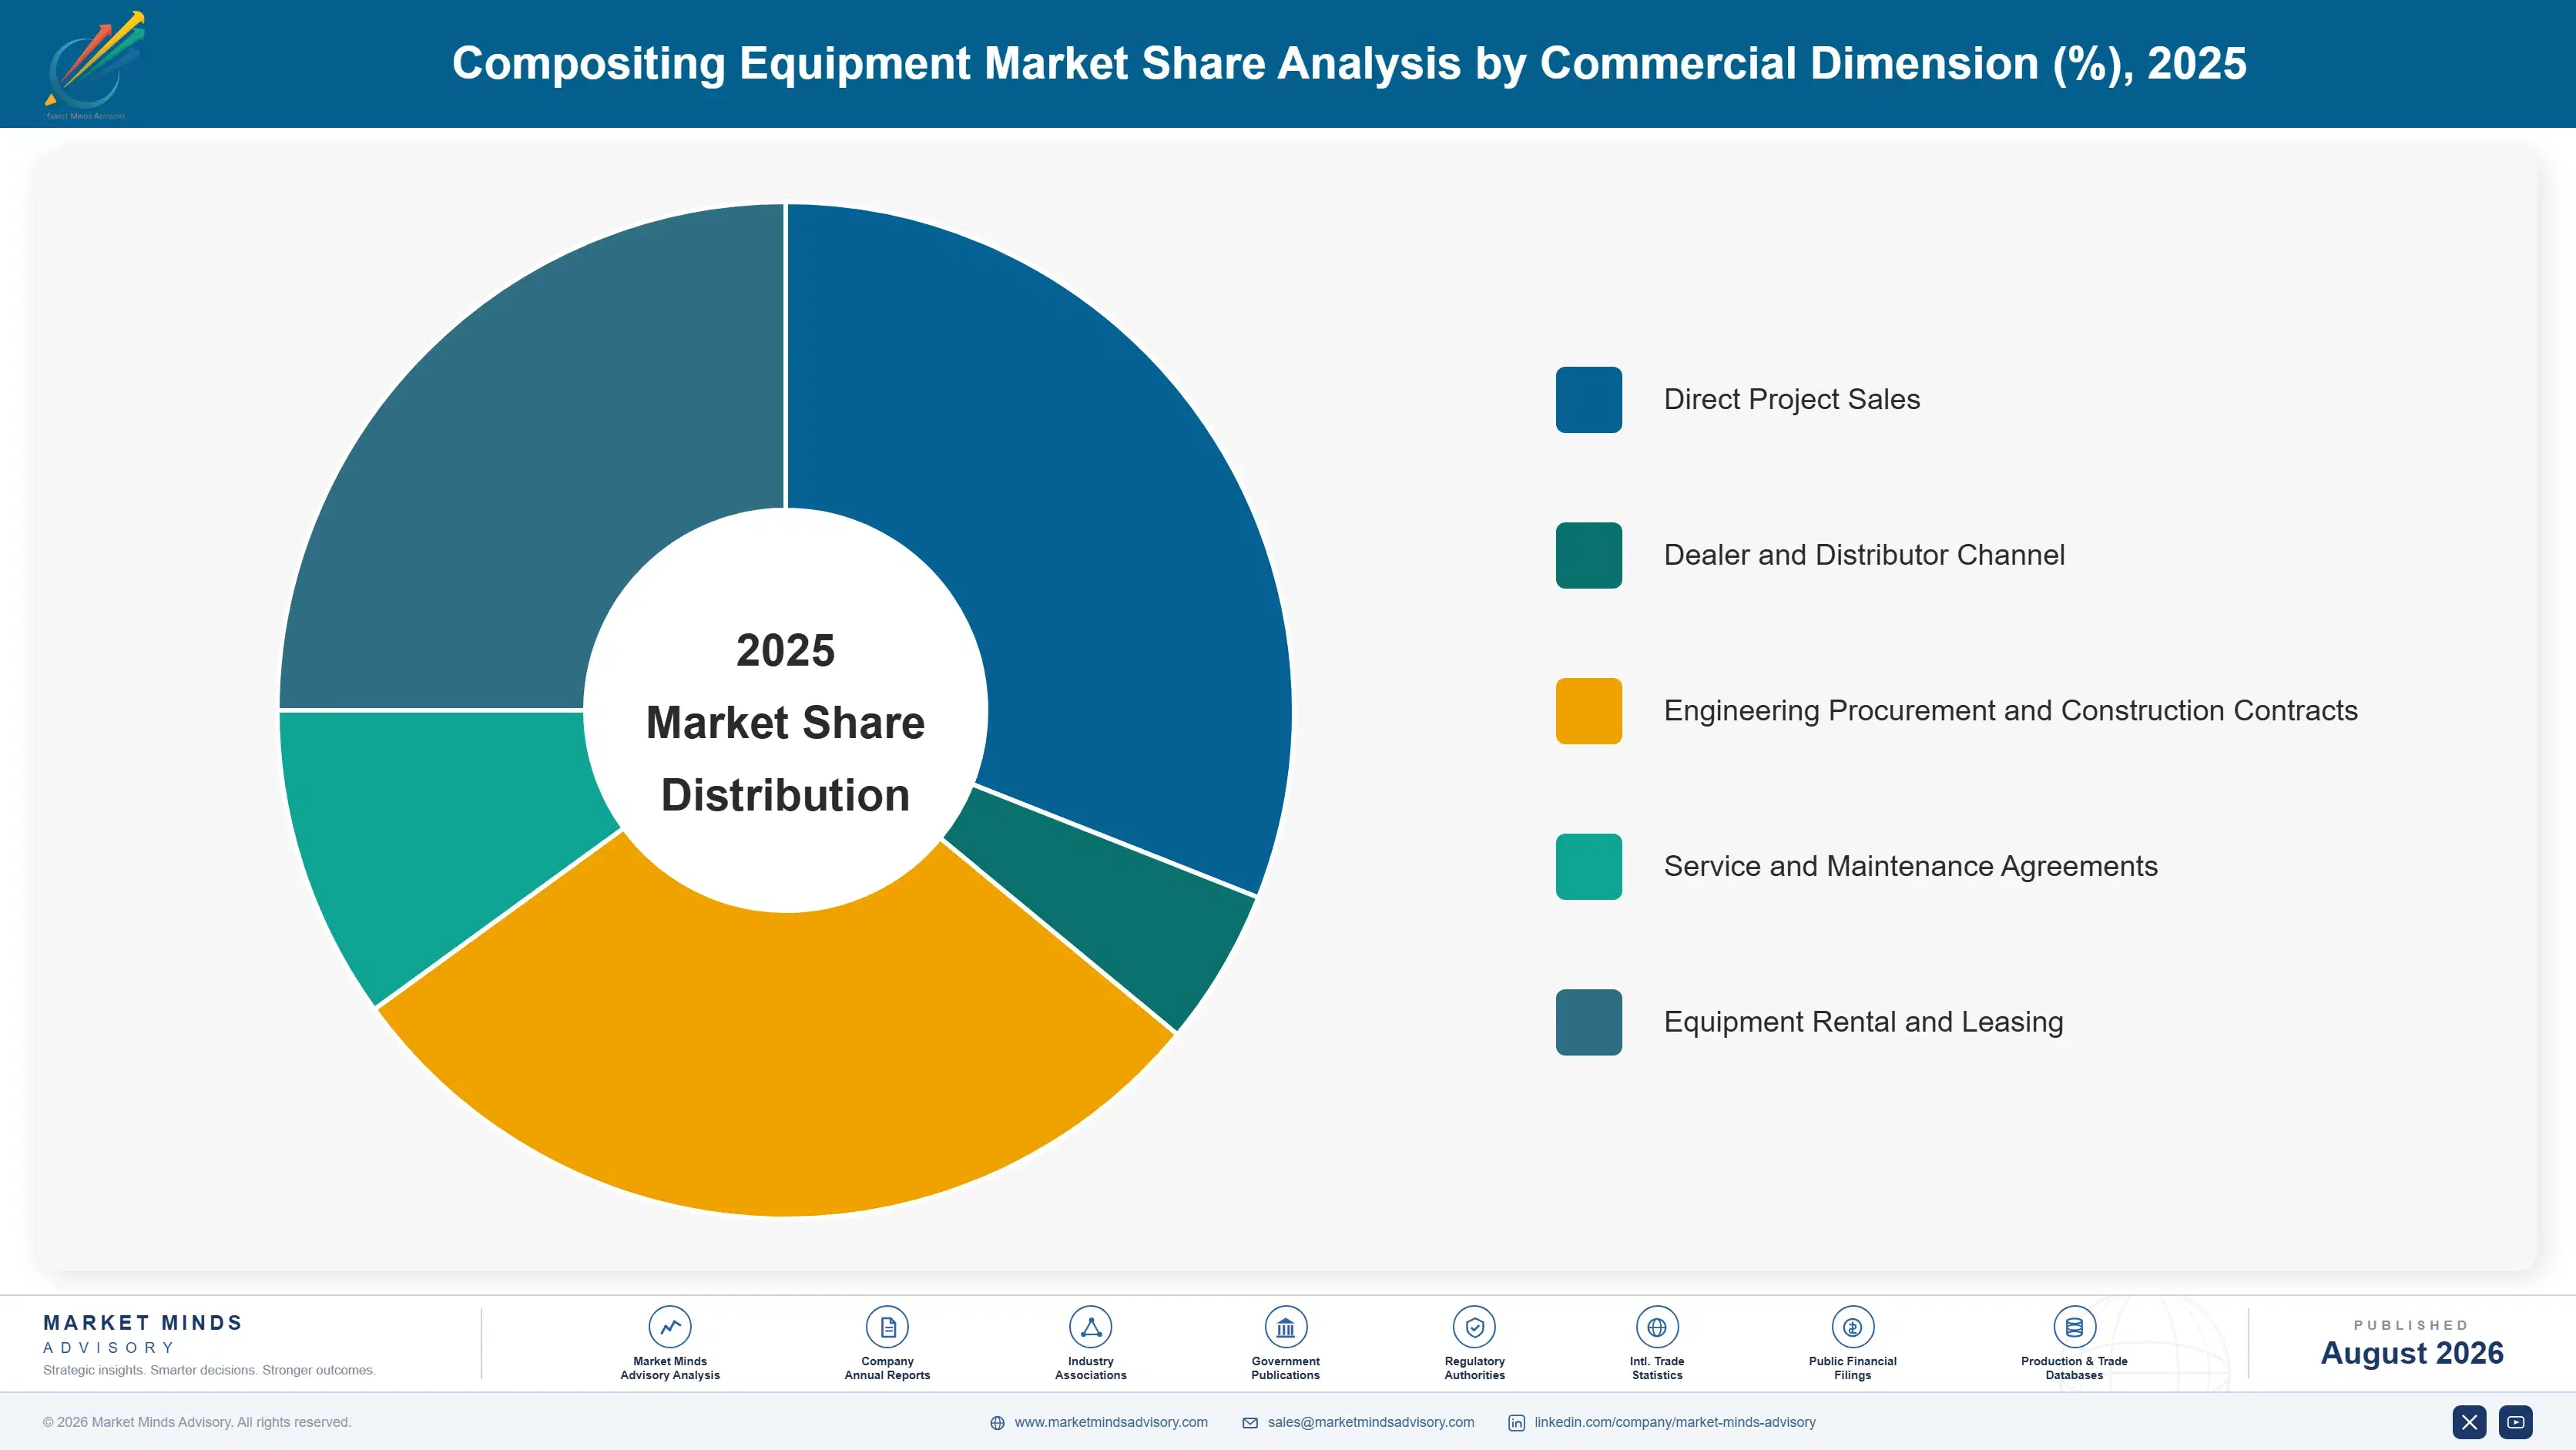
Segmentation follows process stage, meaning where in the composting line a given piece of equipment sits, because that determines what it must handle, who inside the operator specifies it, and whether it is bought for throughput or bought for compliance. Facility scale, feedstock type, and ownership model are handled in the framework and commentary rather than as segments here.
compositing-equipment-market-market-share-analysis-1787333730582

Odour Control and Biofiltration

Odour control grows fastest at 10.8%, about 1.52 times the market rate, and it is the only segment bought purely to keep a site legal. Biofilters, acid and chemical scrubbers, negative pressure enclosure, and covered aerated systems all address emissions that decide whether a permit is granted, renewed, or withdrawn. None of them improves the compost in any measurable way. Roughly 38% of facility closures and permit refusals trace to odour, which makes this equipment the difference between a plant that operates and one that does not. Performance guarantees rather than capital cost decide selection here, and suppliers able to commit to measured emission levels reach projects competitors cannot bid on at all.
CAGR 10.8%

Aeration and Process Control

Aeration and process control grows at 9.2%, driven by the same permitting logic approached from a different direction entirely. Forced aeration with temperature and oxygen feedback holds the pile in aerobic conditions continuously, which is what prevents the anaerobic pockets that generate the compounds neighbours actually smell. It also shortens the process cycle and raises throughput per square metre, though neither of those is usually the reason it gets bought. Covered aerated static pile systems combine that aeration with a membrane capturing emissions, which suits sites unable to justify the cost of full enclosure. Control sophistication has risen considerably as operators discovered that consistent process conditions are what keep the complaints away.
CAGR 9.2%
Full segment breakdown across 7 segments available in the complete report.

Regional Architecture and Country Demand Map

Regional shares here follow waste regulation rather than population or waste volume, because composting capacity gets built when landfill closes to organics and separate collection becomes compulsory. Growth tracks enforcement of those obligations far more closely than it tracks anything commercial, which makes policy timing the useful predictor.

Western Europe

Western Europe holds 31% of value, above the 26% ceiling this framework applies, and regulation rather than waste volume explains all of it. Mandatory separate biowaste collection since the end of 2023 is the strongest single driver of composting capacity anywhere in the world, and it arrives alongside landfill restrictions that remove the alternative entirely. German, Austrian, Dutch, and Nordic operators built capacity earliest and now run the most technically advanced facilities in the market, with enclosure and biofiltration close to standard specification. Southern European member states sit further behind and represent most of the remaining capacity gap. Growth at 6.1% trails the global rate because the leading markets are already largely built out.
Share: 31% | CAGR: 6.1% (2026 to 2036)

East Asia

East Asia records 18% of value against a 22% floor in this framework, which reflects how recently organic waste separation arrived rather than any lack of waste to treat. Chinese municipal waste sorting mandates have rolled out city by city since 2019 and created enormous collected volumes with treatment capacity still catching up, mostly favouring anaerobic digestion for food waste and composting for garden and agricultural material. Japanese and Korean systems are mature and heavily focused on food waste recycling under long-standing obligations. Domestic equipment manufacturers supply most of the volume at prices imported machinery cannot match. Growth at 8.0% exceeds the global rate on capacity being built to catch up with collection that already exists.
Share: 18% | CAGR: 8.0% (2026 to 2036)
Regional intelligence for 5 additional markets available in the complete report: North America, South Asia and Pacific, Latin America, Eastern Europe, Middle East and Africa. Contact sales@marketmindsadvisory.com.
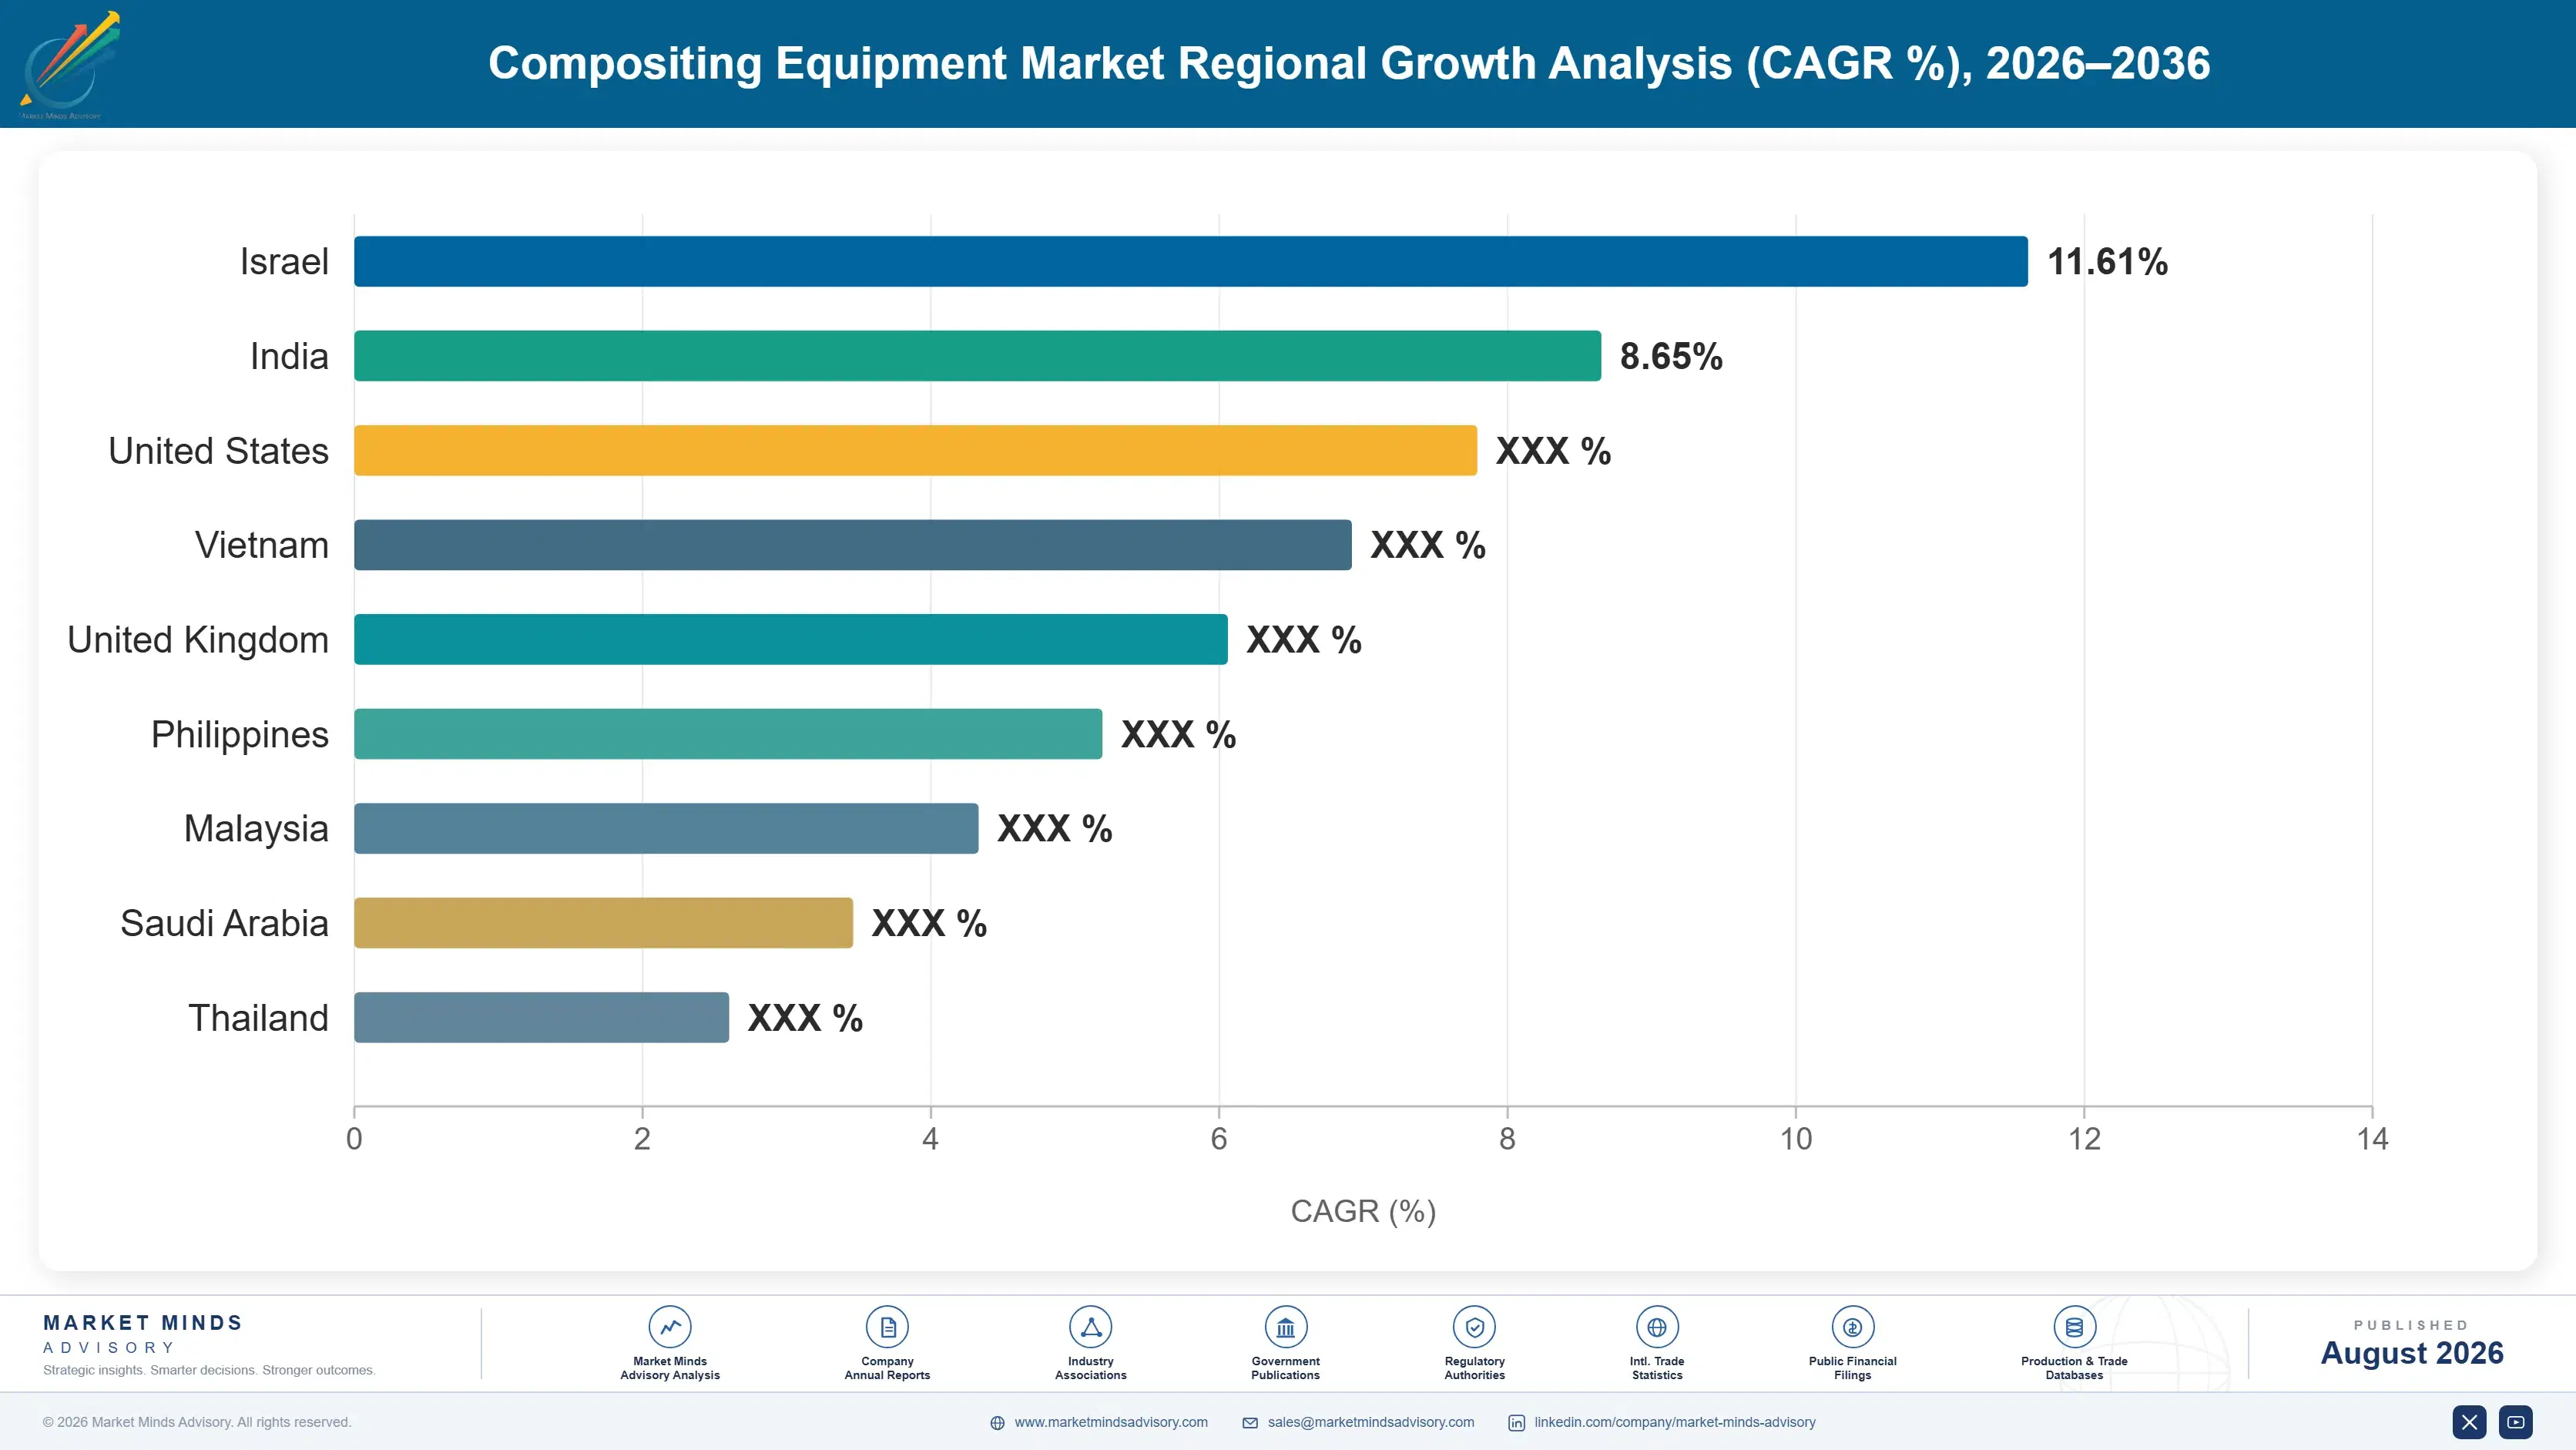
compositing-equipment-market-country-cagr-analysis-1787333731099

Where Composting Equipment Margin Actually Sits

Composting equipment margin does not sit in the machinery itself. It sits in guaranteeing an emission level that a planning authority will actually accept, in handling feedstock that nobody sorted properly upstream, and in keeping plant running for operators who have neither the staff nor the budget to maintain it themselves across twenty years.

Sell Guaranteed Emission Performance Rather Than Equipment

An operator buying a biofilter wants a permit, not a biofilter. Suppliers willing to contract to a measured emission concentration, with monitoring and remediation obligations attached, reach projects that specification-only competitors are excluded from bidding on, and they price 15% to 25% above equipment-only quotes. The commercial requirement is real measurement data across enough reference sites to underwrite that guarantee, which favours suppliers with an installed base. It also changes who signs the order, moving the decision from a procurement department to whoever carries permitting risk for the whole facility.
Market Impact: Emission guarantees add 15 to 25 pe

Retrofit Screening Into Plants Built Without It

Facilities designed five to ten years ago assumed cleaner feedstock than separate collection actually delivers, and 3% to 9% contamination is now producing compost that fails quality standards on plastic. Retrofitting screening, density separation, and film removal into an operating plant is a repeatable USD 200,000 to USD 700,000 sale into an installed base that already exists and can be identified from public permit records. Margins run well above new-build equipment because the alternative is the plant losing its product certification. Suppliers who track which plants were built before contamination became visible have a target list ready.
Market Impact: Screening retrofits run 200,000 to

Take Operating Responsibility Under Long Service Contracts

Municipal operators run composting plants with staff who have several other responsibilities, and process control suffers accordingly, which produces the odour events that threaten the permit. Full service agreements covering maintenance, process supervision, and remote monitoring convert a one-off equipment sale into annual revenue running 4% to 8% of installed capital value across a twelve to twenty year asset life. Margins exceed equipment margin substantially and the revenue is contracted rather than cyclical. It also gives the supplier the operating data needed to underwrite emission guarantees on the next project.
Market Impact: Service contracts yield 4 to 8 perc

Who Controls the Margin Pool

Concentration is low at 31% across the top five, measured on composting equipment revenue, and it reflects a market split between regional machinery builders and process system specialists who rarely meet in the same tender. Komptech and Vermeer lead on the mobile shredding, turning, and screening side with genuinely international distribution. Eggersmann, Doppstadt, and Terex Ecotec follow. The gap between the leaders and the field is distribution reach rather than technology.
Competition currently turns on three things. Whether a supplier can guarantee emission performance rather than describe it, whether the equipment handles contaminated feedstock without constant intervention, and whether service coverage exists near the site. Price matters less than any of those on permitted facilities, and rather more on agricultural and simple windrow work where the machinery is closer to a commodity.

Pressure is coming from process system integrators who sell the enclosure, aeration, and biofiltration as one permitted package rather than as separate machines. That approach owns the customer relationship and relegates machinery suppliers to component vendors. Rankings will shift toward whoever can take responsibility for the whole permitting outcome, which favours firms with process engineering capability over those with only equipment.
compositing-equipment-market-company-positioning-matrix-1787333731622

Competitive Moat and Risk Dimensions

KOMPTECH

Moat: Broadest treatment equipment range

Komptech covers shredding, screening, turning, and separation across a single product family, which lets one supplier equip most of a composting line and one service organisation maintain it. For municipal operators running lean maintenance teams that single point of responsibility carries real weight, and it makes displacement by a single-machine competitor considerably harder than the individual product comparisons suggest.
KOMPTECH

Risk: Limited enclosed process capability

The range is strongest in mobile and open-site machinery at exactly the moment permitting is pushing new facilities toward enclosed, aerated, and biofiltered configurations. Process system integrators selling that complete permitted package can position mobile equipment as a component within their scope, which moves the customer relationship away from Komptech and compresses what it can charge for it.
VERMEER

Moat: Dealer network and durability

Vermeer sells through an established dealer network with parts availability and field service that few competitors match, particularly across North America. For an operator whose grinder stopping means feedstock piling up and odour rising within days, response time is a purchasing criterion in its own right, and it sustains price premiums that specification comparisons alone would not support.
VERMEER

Risk: Narrow organics equipment scope

Vermeer's strength is grinding and turning within a broader industrial equipment business, which leaves the aeration, control, and odour equipment that increasingly decides projects to other suppliers. As facilities move toward integrated permitted systems that positioning risks reducing Vermeer to a machine supplier inside somebody else's contract, with the margin structure that implies.

Players Tracked

Prominent Players

Komptech
Vermeer
Eggersmann Group
Doppstadt
Terex Ecotec

Other Key Players

Menart
Sandberger
Willibald
Scarab Manufacturing
Brown Bear
Midwest Bio-Systems
W. L. Gore
Engineered Compost Systems
Green Mountain Technologies
BDP Industries
Lindner
UNTHA
Pronar
Tana
Bandit Industries

Recent Developments

MARCH 2025

Enclosed German facility commissioned to meet tighter emission limits

Eggersmann commissioned an enclosed composting facility for a German municipal authority, combining tunnel composting with full negative pressure containment and biofiltration throughout the building. The configuration was designed to meet emission limits considerably tighter than the site's previous permit had allowed under its earlier open windrow arrangement.
Signal: Enclosure was specified to win a permit re
SEPTEMBER 2024

Screening line extended to strip film plastic from compost

Komptech expanded its screening and separation product line with equipment specifically targeting film plastic removal from composted material. The move responded to operators finding that separately collected biowaste now arrives contaminated enough to fail finished product quality standards on visible plastic content alone, even after conventional screening.
Signal: Product development driven by failures in
JANUARY 2025

Dealer coverage extended across Southern European biowaste markets

Terex Ecotec extended its dealer coverage across several Southern European markets where mandatory separate biowaste collection is creating new treatment capacity requirements faster than facilities can be built. The target buyers are municipalities and private operators putting up their first composting facilities under European obligations.
Signal: Distribution investment tracking where reg

What Builds A Composting Line

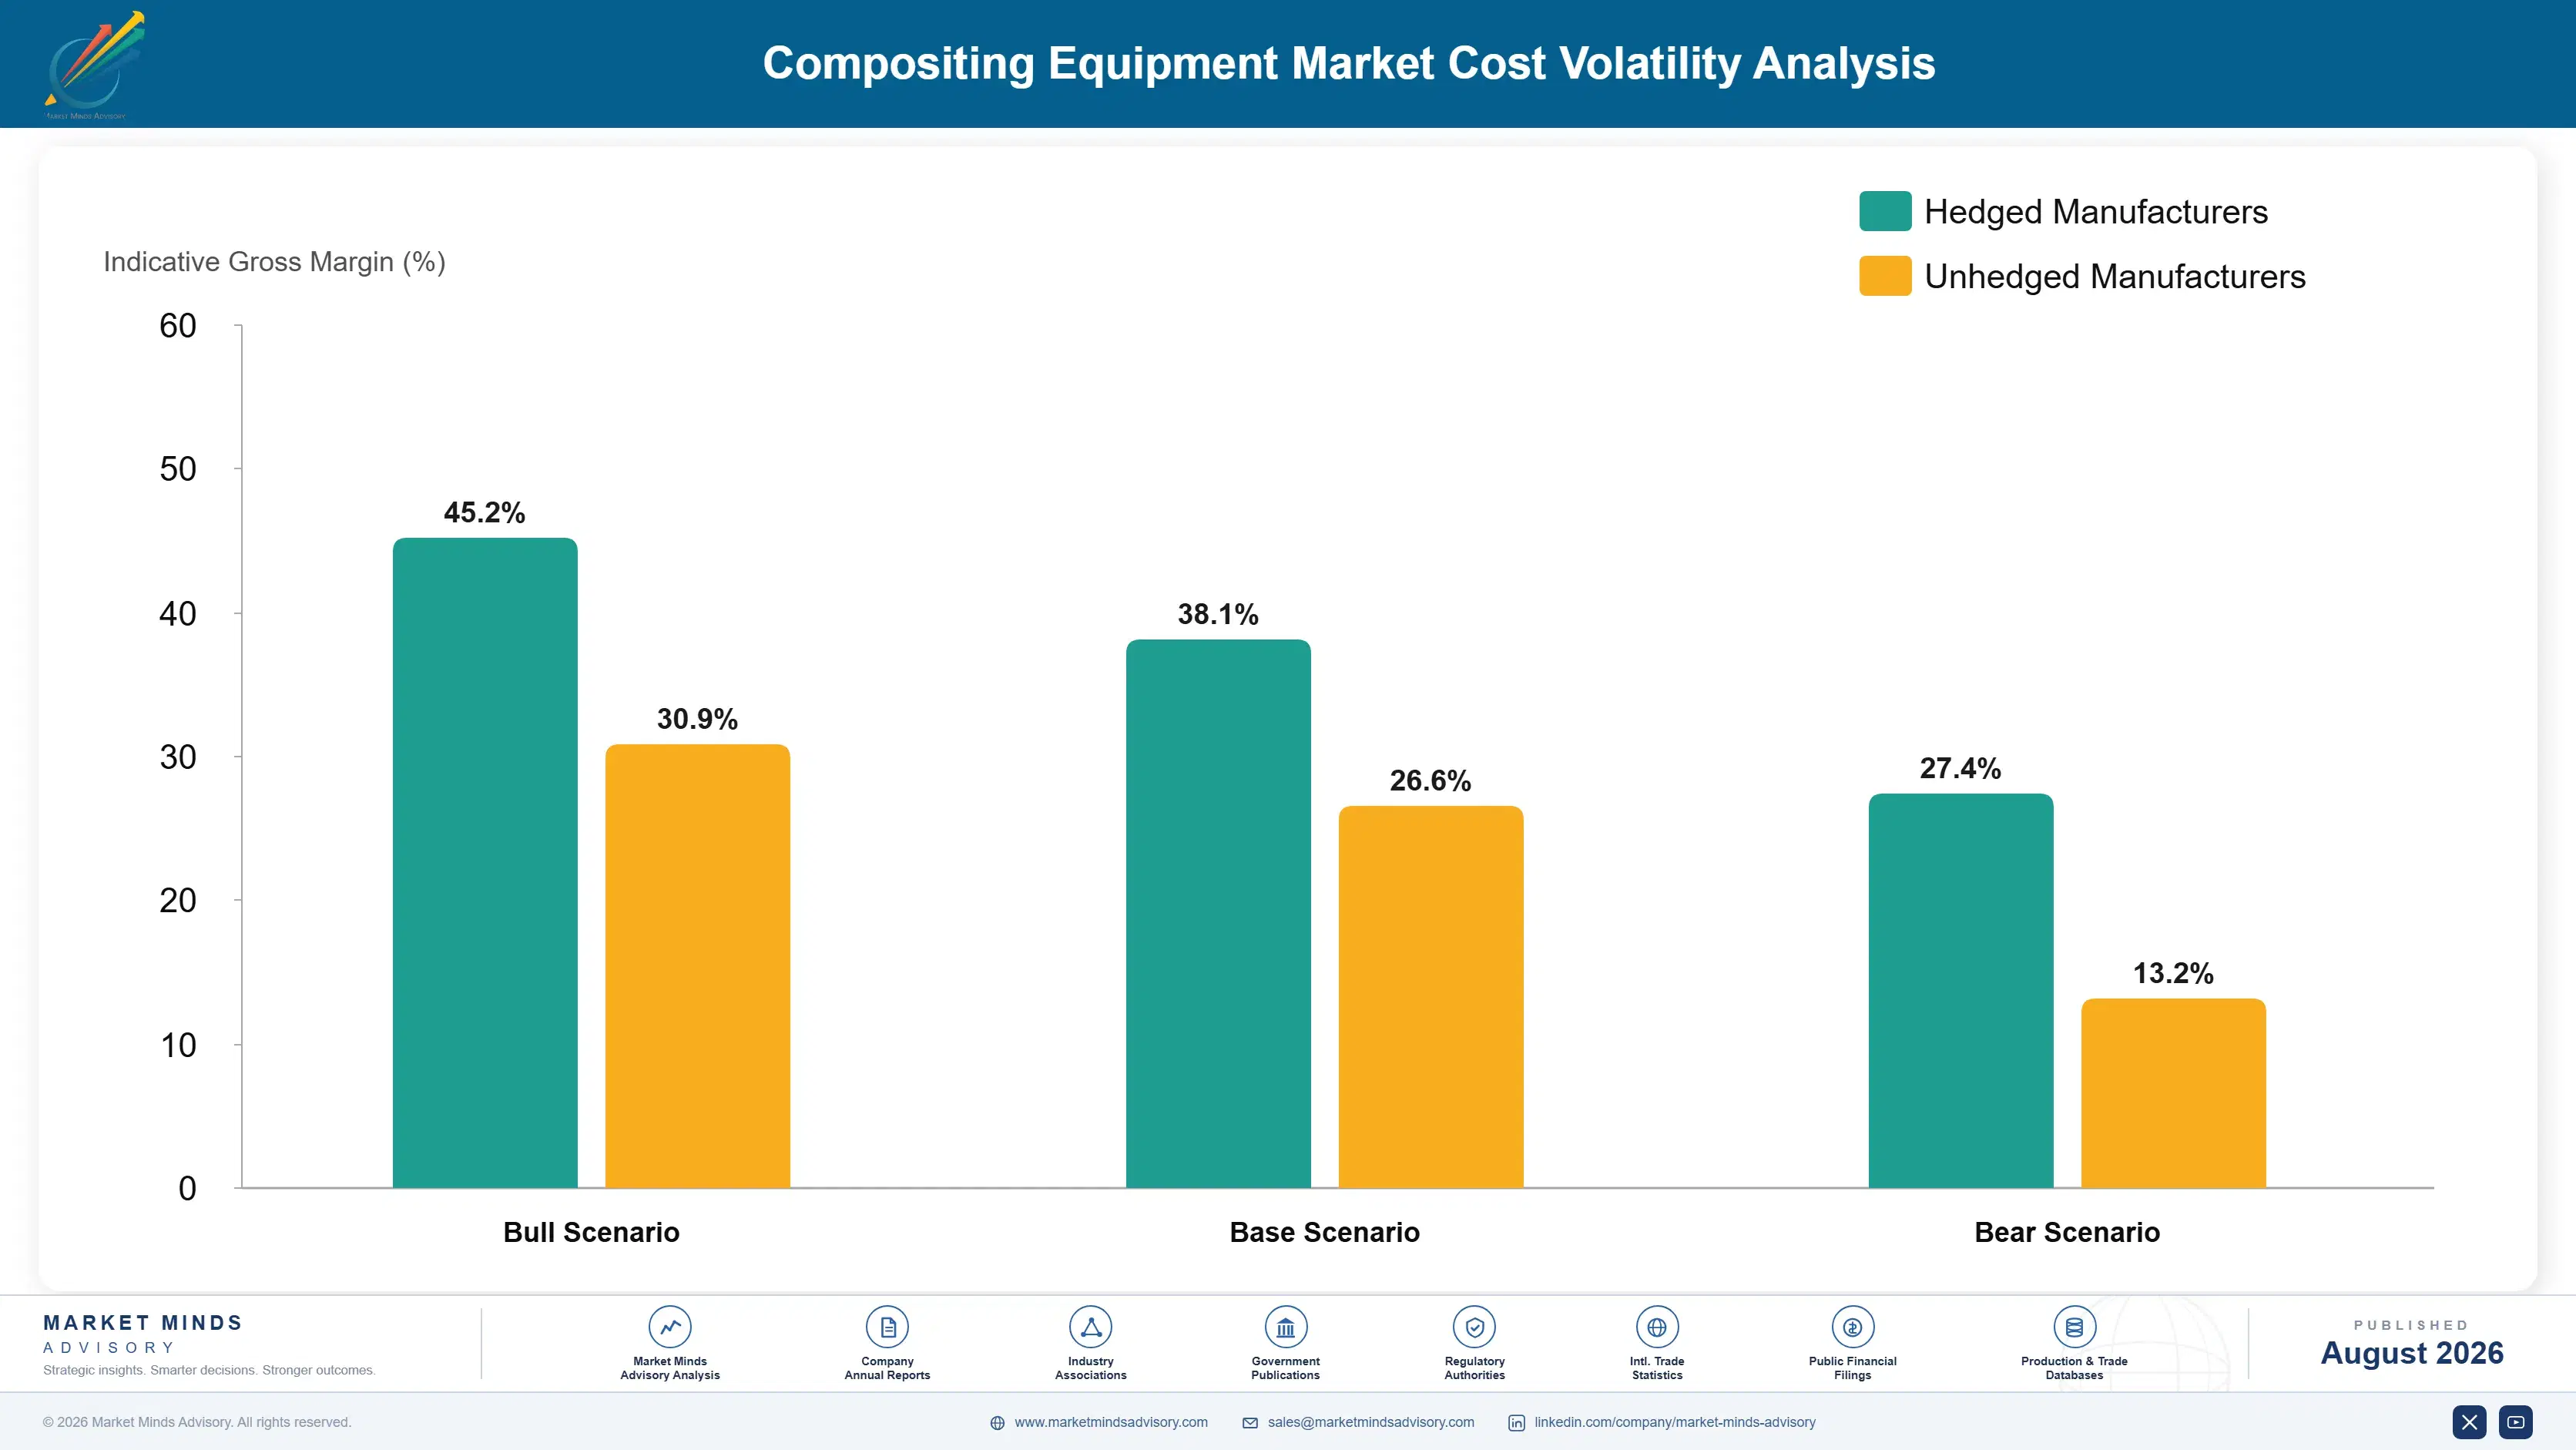
Fabricated steel is the largest input at roughly 30% to 38% of cost of goods, covering shredder bodies, screening drums, turning drums, and enclosure structures, sourced mostly from European and regional mills close to the assembly plants. Diesel engines and hydraulic drives add another 22% to 28% and come from a small group of specialist suppliers. Blowers, fans, controls, and instrumentation make up most of the remainder.
Steel prices across Europe moved sharply through 2022 and 2023 following the energy shock, and the effect ran straight into equipment quoted months before delivery. Doppstadt and Komptech both noted input cost pressure in that period. European Commission energy statistics show the industrial electricity costs behind those steel prices roughly doubling at the peak. Manufacturers holding firm-price quotes absorbed the difference, because a tendered price cannot be reopened.

Exposure divides by who can reprice. Suppliers selling standard mobile machinery through dealers adjust list prices each season and pass most input movement through within a year. Those bidding fixed-price municipal projects with two-year approval timelines cannot, and they carry the full risk between quote and delivery. Smaller regional builders without volume steel contracts sit worst, paying spot prices while larger competitors buy forward.
compositing-equipment-market-cost-volatility-analysis-1787333731817

Index municipal tender pricing to steel benchmarks

Building a steel index adjustment clause into fixed-price municipal contracts transfers the risk between tender and delivery back to the buyer, which is where it belongs on a two-year approval cycle. Public procurement rules permit it in most European jurisdictions, and buyers accept it more readily than they accept the risk premium suppliers would otherwise have to add.

Standardise structures across product families

Common frame, drum, and enclosure designs shared across several machine models raise steel purchase volumes for any given specification and support forward contracts that per-model buying simply cannot. It also cuts fabrication setup cost and inventory carrying. The constraint is engineering discipline, since sales teams push for configuration flexibility that quietly destroys the purchasing advantage.

Shift value toward controls and service revenue

Instrumentation, process control, and long-term service contracts carry almost no steel content and considerably better margins than fabricated machinery. Growing them as a share of revenue reduces overall exposure to metal prices without changing anything about how the equipment is built. It also produces contracted income that steadies results through the cyclical municipal capital spending this industry depends on.

Portfolio Architecture for Margin Defence

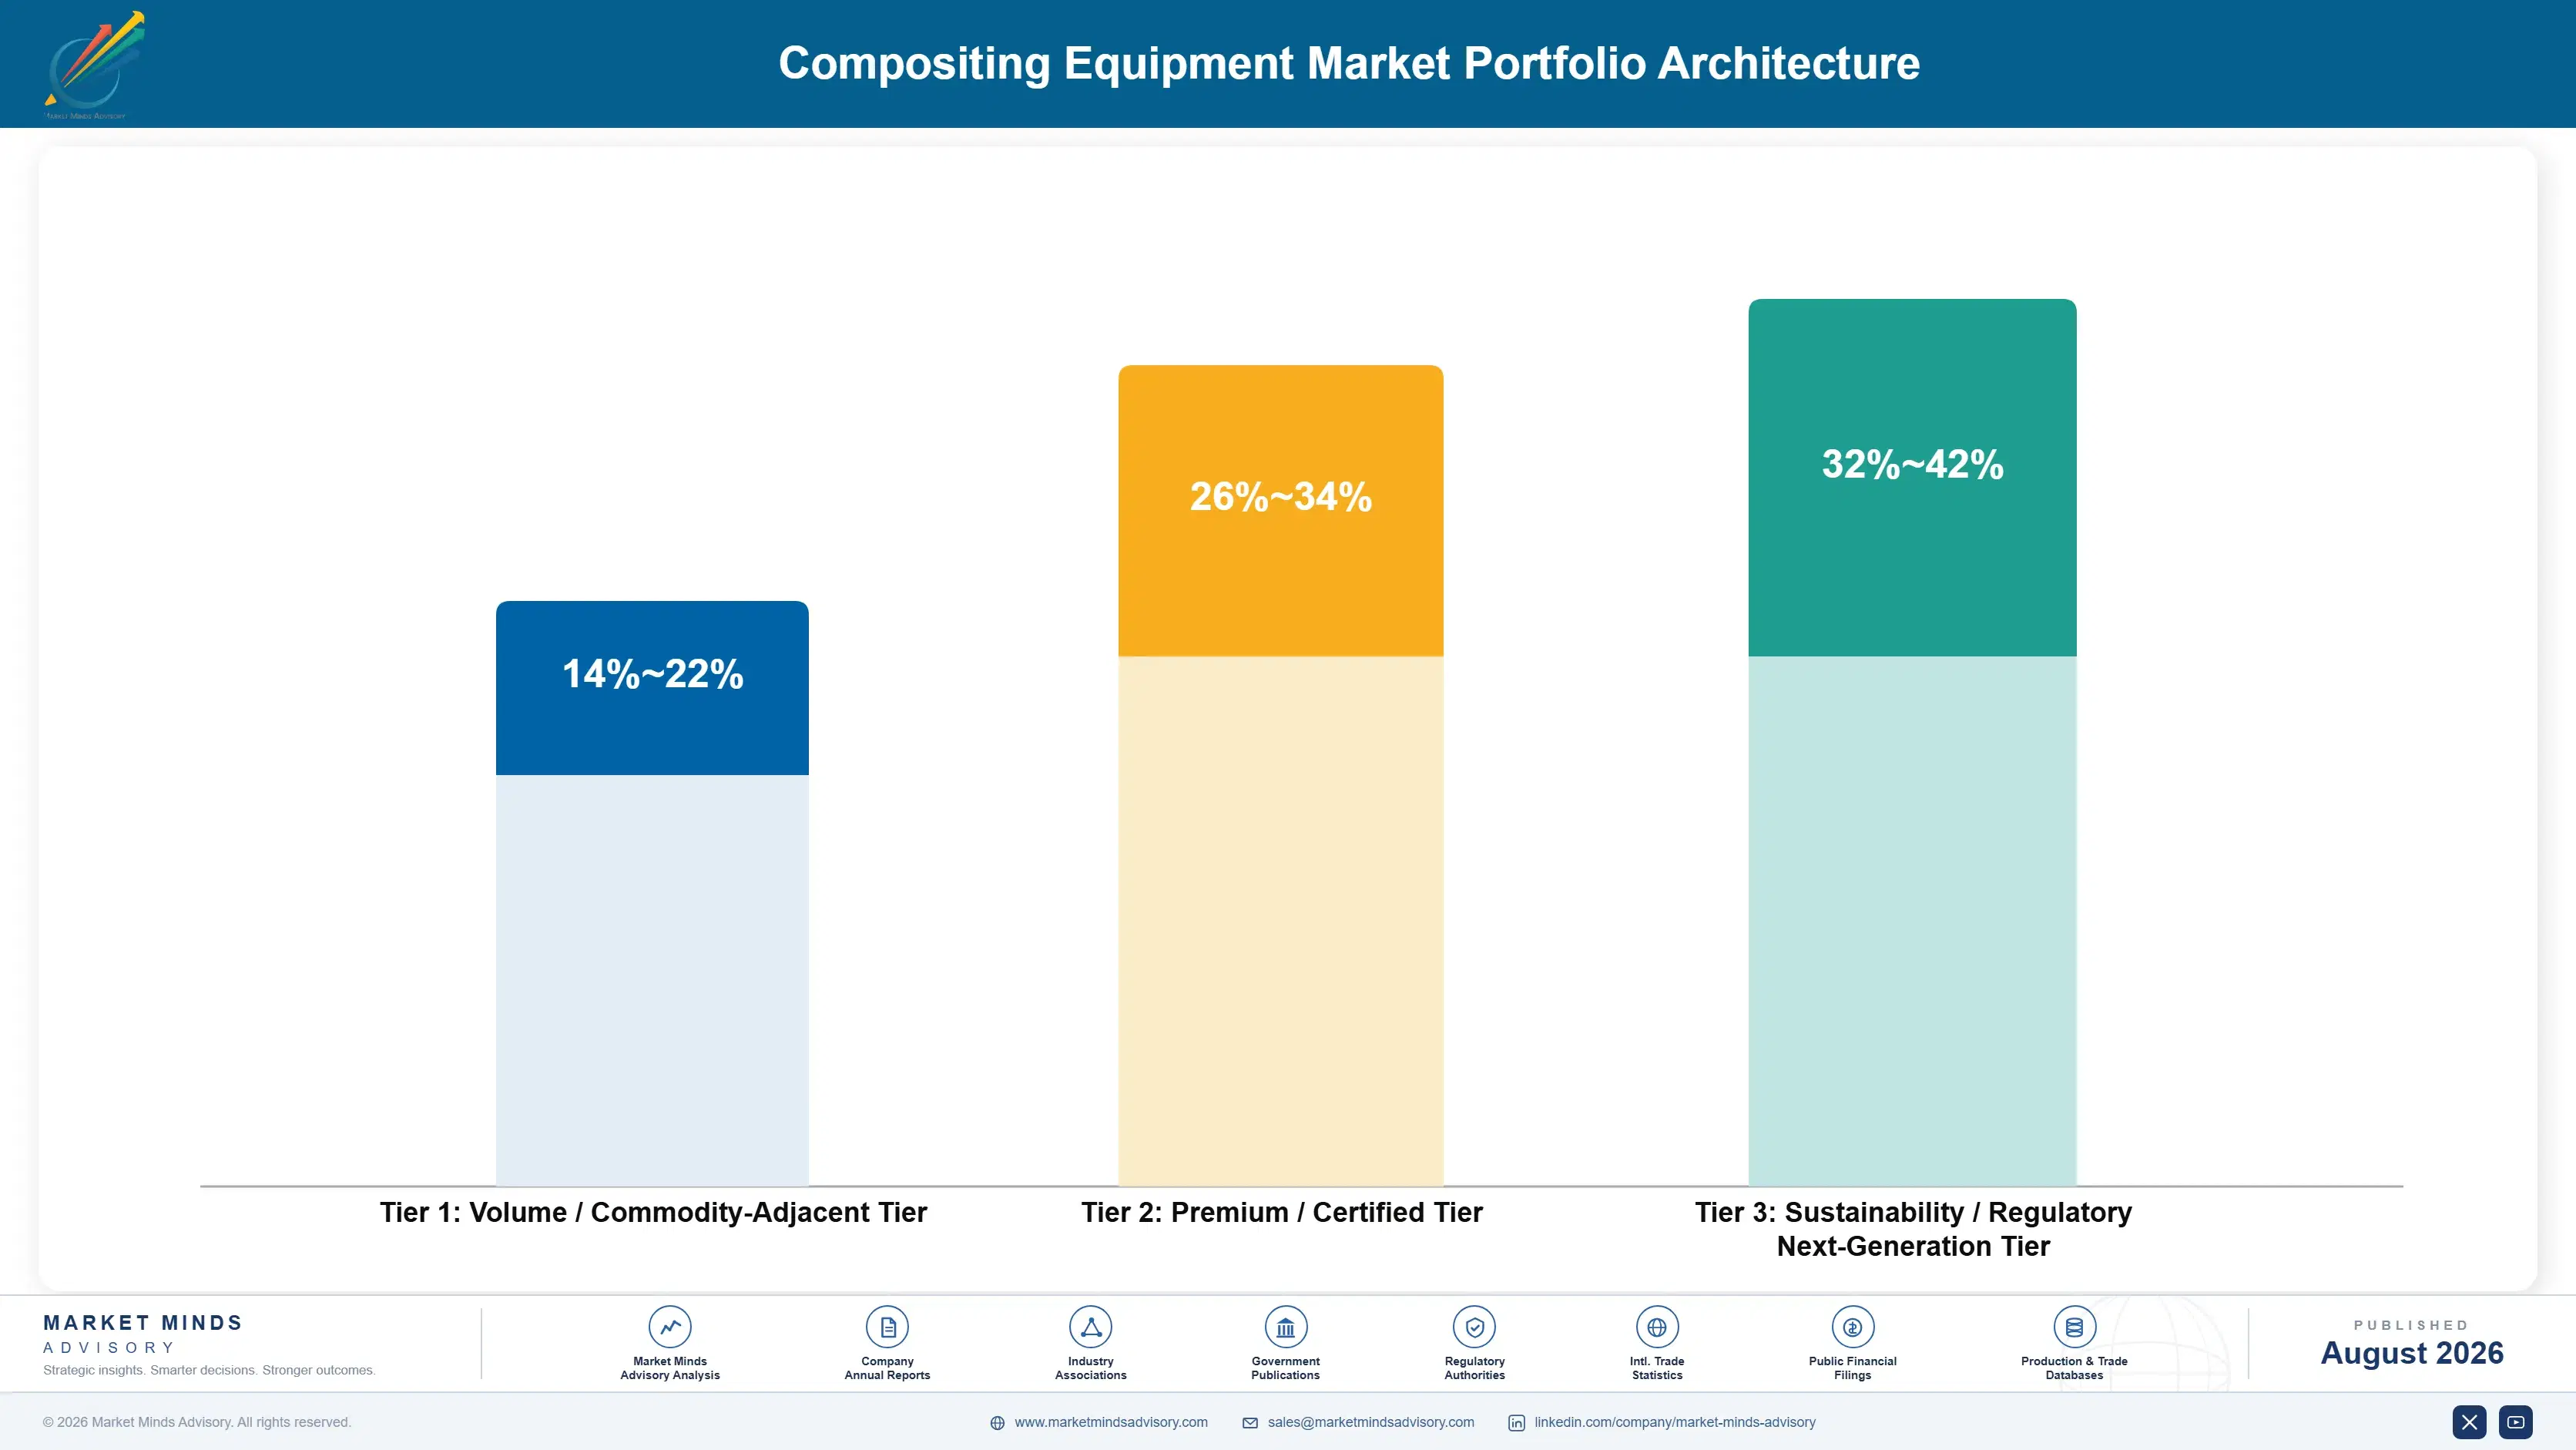
Margin in composting equipment tracks how much permitting risk the supplier is prepared to absorb. Standard mobile machinery sold through dealers competes on specification and on price, and margins reflect exactly that. Enclosed process systems sold with emission guarantees attached are priced instead against the cost of not getting a permit, which is a different calculation entirely and a considerably better one.
The volume tension here is real. Agricultural and simple municipal windrow work is the largest tonnage and the thinnest margin, and it funds factory utilisation. Permitted enclosed facilities are fewer, slower to close, and far more profitable per project, but they demand process engineering capability that most machinery builders do not have and cannot acquire quickly.

High-value pools concentrate in three places. Odour control systems sold with performance guarantees, screening retrofits into plants built before contamination was understood, and long service contracts on municipal facilities that lack the staff to run them properly. All three sit downstream of the initial equipment sale, and all three are won by suppliers who stayed close to the installed base rather than by those who sold the machine and moved on.

Volume / Commodity-Adjacent Tier

Mobile shredders, trommel screens, and windrow turners sold through dealers into agricultural and simple municipal work. Specification comparison and price decide these, and the range reflects how much dealer margin sits in the channel.
Gross Margin: 14-22%

Premium / Certified Tier

Enclosed tunnel and aerated static pile systems, integrated aeration and control, and process packages sold against permitting requirements. Priced against permit risk rather than equipment cost, which supports margins mobile machinery cannot reach.
Gross Margin: 26-34%

Sustainability / Regulatory / Next-Generation Tier

Odour control with contracted emission performance, advanced contamination separation, and long-term service and monitoring agreements. The widest range here reflects how much variation there is in what suppliers will actually guarantee and price accordingly.
Gross Margin: 32-42%
compositing-equipment-market-portfolio-architecture-1787333732317

High-value Sub-segments and Strategic Watch-out

Guaranteed Odour Control Systems

Growing at 10.8% and the highest margin position anywhere in the market, because a contracted emission level is what a planning authority actually buys. Underwriting that guarantee requires measured reference data across enough operating sites, which limits entry to suppliers already holding an installed base.
Gross Margin: 38-52%

Aeration and Process Control

Growing at 9.2% with strong margins carried on instrumentation and control content rather than on fabricated steel plate. Increasingly specified as regulatory evidence that aerobic conditions held throughout the whole cycle, which moves the buying decision toward compliance functions and away from the operations teams.
Gross Margin: 30-40%

Mobile Shredding and Screening

The largest revenue base and the thinnest margins anywhere in the market, sold through dealer channels into agricultural work and simple municipal windrow sites. It funds factory utilisation and service network coverage, and remains the entry point into accounts that later buy full process systems.
Gross Margin: 14-22%

Decentralised Small-Scale Systems

Container and in-vessel units sold to institutions, estates, and Indian urban local bodies, growing quickly from a very small installed base. Low value per unit and high volume, sold through a channel completely unlike anything that centralised equipment suppliers currently operate or properly understand today.
Gross Margin: 24-36%

Who Keeps Paying After Commissioning

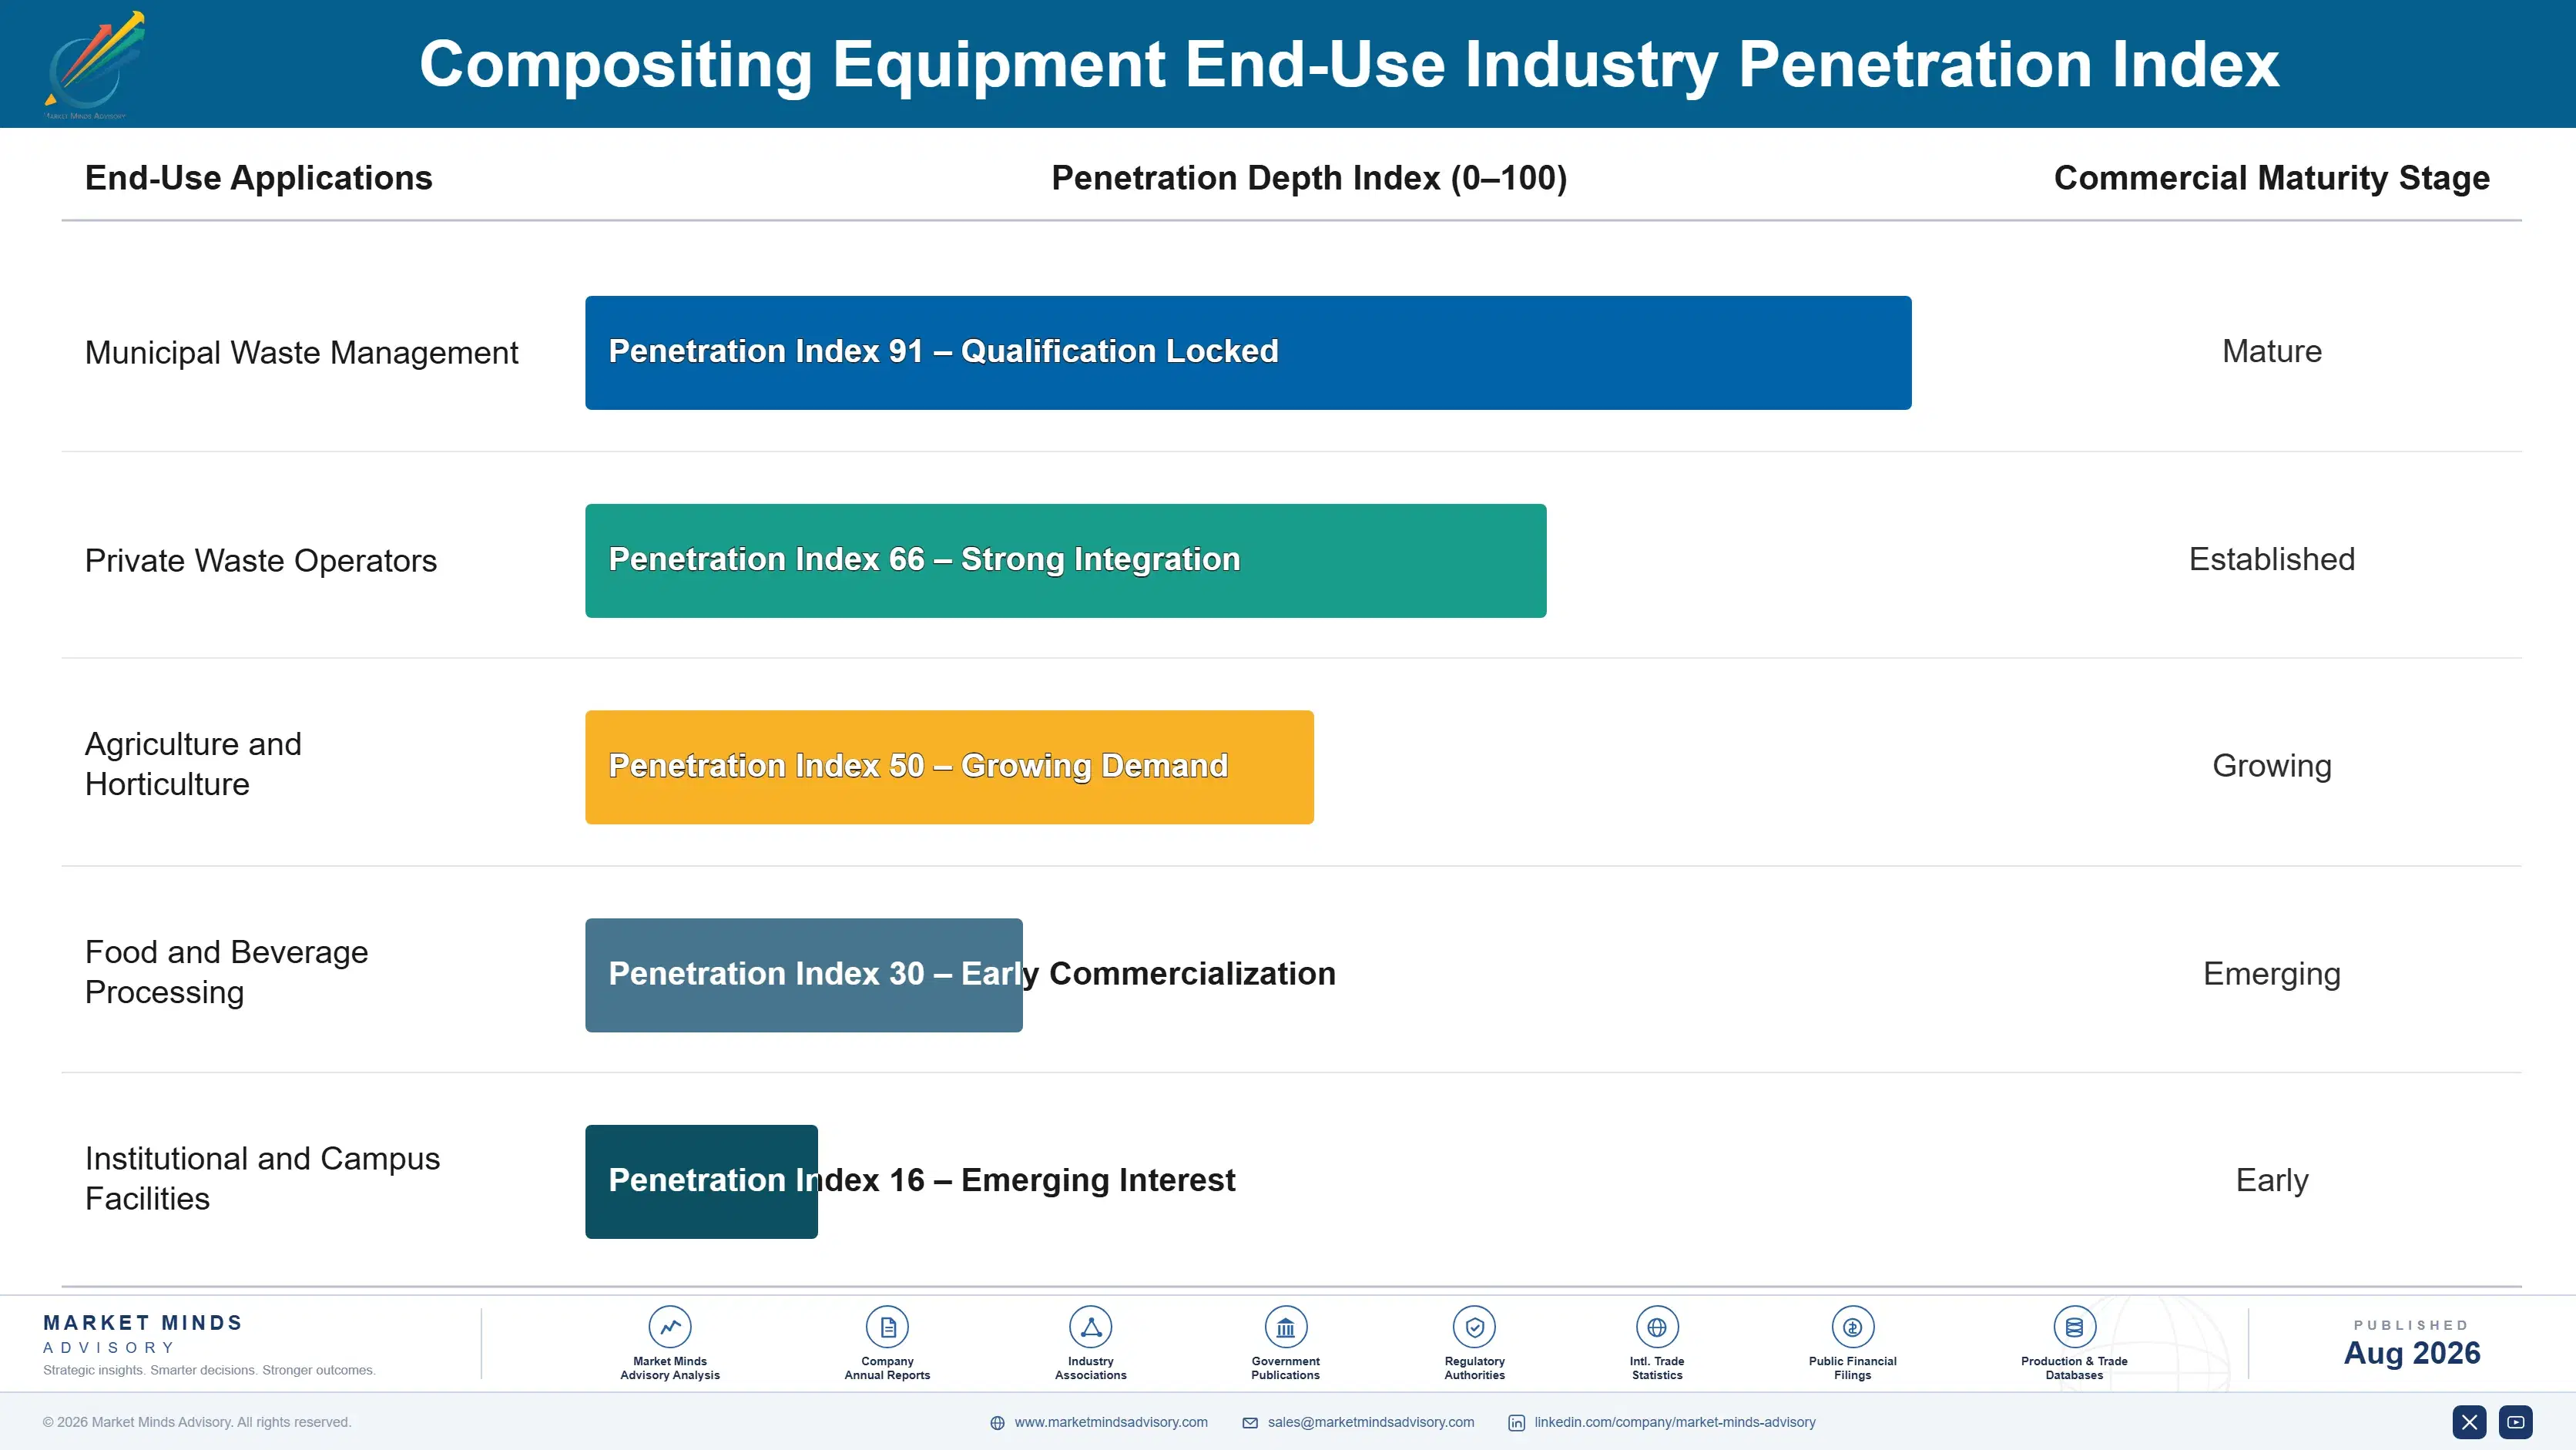
Composting equipment produces annuity income that most suppliers under-collect. A plant runs twelve to twenty years, wears through screens, blades, belts, and blower components continuously, and needs process supervision the operator often cannot provide. Parts and service on a well-managed installed base run 4% to 8% of installed capital value annually, and that revenue is contracted rather than dependent on municipal capital cycles.
Stickiness varies sharply by who owns the plant. Municipal authorities replace equipment on the same brand almost automatically because retendering is administratively painful and staff training carries over. Private waste operators running multiple sites standardise deliberately and buy across their estate at once, which makes them the highest value relationships available. Agricultural users are the least sticky, treating machinery as a commodity and switching on price without much hesitation.

Buyer profiles have changed. The purchasing decision used to sit with a works manager who cared about throughput. It increasingly sits with an environmental compliance function that cares about emission limits and permit conditions, and that person reads guarantee terms rather than specification sheets. Suppliers still selling on tonnes per hour are answering a question nobody in the room is asking any more.
compositing-equipment-market-end-use-penetration-index-1787333732809

Where To Compete Here

These are among the four positions where our research anticipates prominent divergence between winners and laggards over the coming forecast period. Each is grounded in the demand model, the regulatory perimeter, and the announced capacity pipeline.
01 / EMISSION GUARANTEE UNDERWRITING

Contract to a number, not a specification

Operators buy permits, not biofilters, and the supplier willing to contract to a measured emission concentration reaches projects that competitors are simply not allowed to bid on at all. That capability rests on measurement data gathered across a real installed base, which takes years to accumulate and cannot be bought in from anybody else at any price. Building it now creates a commercial position competitors will need most of a decade to match, and the projects won meanwhile compound the advantage.
02 / CONTAMINATION RETROFIT SALES

Target plants built before contamination became visible

Facilities commissioned five to ten years ago assumed feedstock considerably cleaner than separate collection actually delivers, and their finished compost now fails quality standards on visible plastic content. Those plants are identifiable from public permit records and each one represents a screening retrofit worth several hundred thousand dollars to whichever supplier calls on them first. This is an installed base that can be listed and worked systematically rather than a market that has to be found through general demand generation.
03 / SERVICE CONTRACT CONVERSION

Sell twenty years of operation, not machinery

Municipal operators lack the staff to run process control properly, and the odour events that follow are exactly what threatens their operating permits and their political cover. Full service agreements covering maintenance, process supervision, and remote monitoring solve that problem directly, and they convert one-off equipment revenue into contracted annual income at considerably better margins. They also generate the operating data a supplier needs in order to underwrite emission guarantees on the next project it goes out to bid for.
04 / PROCESS INTEGRATION CAPABILITY

Own the permitted package or become a component

System integrators selling enclosure, aeration, and biofiltration as one permitted outcome are taking the customer relationship and reducing machinery builders to component vendors sitting inside somebody else's contract. That trend will decide competitive rankings across the forecast period considerably more than any individual product development programme is going to, however good the machinery itself eventually becomes. Acquiring genuine process engineering capability is the only real defence available here, and every further year of waiting makes the eventual acquisition more expensive.

Engagement Snapshot From the Field

A live engagement with an industry participant carrying material or product regulatory and market exposure ahead of a defining policy shift, showing how our research translates into a defensible multi-year portfolio strategy.
MARKET MINDS ADVISORY · CLIENT ENGAGEMENT SUMMARY
Compositing Equipment Producer Strategic Portfolio Review and Transition Roadmap 2026·Investment Scenario on Compositing Equipment Exposure Evaluation 2025-26
CLIENT PROFILE
A privately held waste management operator running collection and treatment across several European regions, with roughly USD 340 million in annual revenue (client-reported, unverified by MMA). The business held municipal collection contracts covering separately collected biowaste but treated most of that material through third-party facilities under commercial gate fee arrangements it did not control or influence.
STRATEGIC CHALLENGE
Gate fees at the third-party composting sites had risen sharply as regional treatment capacity tightened under collection mandates, and two facilities had permit issues that threatened continuity. The operator needed to decide whether to build its own treatment capacity, and if so what technology configuration would actually survive planning in the regions where its collection contracts sat.
MMA APPROACH
MMA examined planning outcomes for composting applications across the client's operating regions over eight years, identifying which technology configurations were approved and which were refused and on what grounds. Equipment cost and operating models were built for each viable configuration, and interviews with permitting authorities and operators established what conditions were realistically achievable.
KEY FINDINGS
  1. Open windrow applications in the client's regions were refused at nearly four times the rate of enclosed configurations, almost entirely on odour objections raised at consultation stage.
  2. Third-party gate fees had risen 31% over three years (client-reported, unverified by MMA) and showed no sign of easing while regional capacity remained short of collected volumes.
  3. Enclosed tunnel systems carried roughly double the capital cost of covered aerated static pile but delivered no measurable permitting advantage in the regions examined.
  4. Contamination in the client's collected biowaste averaged 6%, requiring screening capability that the initial internal cost estimates had omitted from the project entirely.
CLIENT PROFILE
A privately held waste management operator running collection and treatment across several European regions, with roughly USD 340 million in annual revenue (client-reported, unverified by MMA). The business held municipal collection contracts covering separately collected biowaste but treated most of that material through third-party facilities under commercial gate fee arrangements it did not control or influence.
STRATEGIC CHALLENGE
Gate fees at the third-party composting sites had risen sharply as regional treatment capacity tightened under collection mandates, and two facilities had permit issues that threatened continuity. The operator needed to decide whether to build its own treatment capacity, and if so what technology configuration would actually survive planning in the regions where its collection contracts sat.
MMA APPROACH
MMA examined planning outcomes for composting applications across the client's operating regions over eight years, identifying which technology configurations were approved and which were refused and on what grounds. Equipment cost and operating models were built for each viable configuration, and interviews with permitting authorities and operators established what conditions were realistically achievable.
KEY FINDINGS
  1. Open windrow applications in the client's regions were refused at nearly four times the rate of enclosed configurations, almost entirely on odour objections raised at consultation stage.
  2. Third-party gate fees had risen 31% over three years (client-reported, unverified by MMA) and showed no sign of easing while regional capacity remained short of collected volumes.
  3. Enclosed tunnel systems carried roughly double the capital cost of covered aerated static pile but delivered no measurable permitting advantage in the regions examined.
  4. Contamination in the client's collected biowaste averaged 6%, requiring screening capability that the initial internal cost estimates had omitted from the project entirely.
RECOMMENDED STRATEGY
Phase 1: Phase one: build covered aerated static pile capacity at two sites where collection volumes justified it and planning history indicated approval was achievable. Phase 2: Phase two: specify screening and film separation from the outset rather than as retrofit, sizing for the 6% contamination actually measured in collected material. Phase 3: Phase three: retain third-party treatment for peripheral regions rather than building sub-scale capacity, renegotiating those contracts from a stronger position.
OUTCOME
The client committed capital to two facilities using covered aerated static pile rather than the enclosed tunnel configuration originally assumed, cutting projected capital requirement by roughly USD 11 million (client-reported, unverified by MMA). Both applications were submitted with odour modelling addressing the objection grounds MMA had identified from prior refusals in those regions.

Frequently Asked Questions

Foundational context covering the market sizes, CAGR, scope, country, region and competition that inform every finding below. This section is provided to cover basics and most often pre-purchase conversations, answered from the MMA Primary Research Dataset.

What is the current size of the Composting Equipment Market?

The market reached USD 1.9 billion in 2025 and is forecast at USD 2.03 billion for 2026. Growth is driven by mandatory separate biowaste collection rather than by any commercial pull.

How large will the Composting Equipment Market be by 2036?

MMA forecasts USD 4.03 billion by 2036, an increase of USD 2.00 billion over 2026. That represents an expansion multiple of 1.99 times across the forecast period.

What is the CAGR for the Composting Equipment Market 2026 to 2036?

The base case CAGR is 7.1%, with a bull case at 8.4% and a bear case at 5.8%. The bull case depends on enforcement of collection mandates tightening rather than on new obligations appearing.

Which segment is growing fastest?

Odour control and biofiltration grows fastest at 10.8%, about 1.52 times the market rate. It is bought to keep facilities permitted rather than to improve the compost.

Who are the major companies in the Composting Equipment Market?

Komptech, Vermeer, Eggersmann Group, Doppstadt, and Terex Ecotec lead the market. The top five hold roughly 31% of composting equipment revenue, which is low for an industrial equipment category.

Which country is growing fastest?

India grows fastest at 10.2%, driven by municipal solid waste rules requiring segregation and processing alongside national mission funding for urban local bodies. Most of that is first capacity rather than replacement.

Report Segmentation Architecture

The full report scope spans multiple orthogonal segmentation dimensions, with cross-tabulated demand data provided for each dimension pair. Coverage extends further to regional breakdowns, trend trajectories, and the competitive detail needed to support segment-level decision-making.

By Process Stage

  • Feedstock Preparation and Shredding
  • Active Composting and Turning
  • Aeration and Process Control
  • Screening and Refining
  • Odour Control and Biofiltration

By End-Use Industry

  • Municipal Waste Management
  • Private Waste Operators
  • Agriculture and Horticulture
  • Food and Beverage Processing
  • Institutional and Campus Facilities

By Commercial Dimension

  • Direct Project Sales
  • Dealer and Distributor Channel
  • Engineering Procurement and Construction Contracts
  • Service and Maintenance Agreements
  • Equipment Rental and Leasing

By Region

  • Western Europe
  • East Asia
  • North America
  • South Asia and Pacific
  • Latin America
  • Eastern Europe
  • Middle East and Africa

Scope, Methodology, and Coverage

Every figure in this report is reproducible from documented input assumptions. The scope below maps the historical period, the forecast horizon, the segmentation dimensions, and the countries covered, alongside the underlying primary and qualitative methodology.
Historical Period
2020 to 2025
Forecast Period
2026 to 2036
Base Year
2025 (USD billions; MMA Primary Research Dataset, August 2026)
Market Definition
The composting equipment market comprises machinery and process systems used to convert separated organic waste into compost, covering feedstock shredding and mixing, windrow turning, in-vessel and aerated static pile systems, aeration and process control, screening and refining, and odour control and biofiltration. Scope covers municipal, private operator, agricultural, and institutional facilities across all scales. Anaerobic digestion and biogas plant, landfill equipment, collection vehicles, municipal recycling sorting lines, and the compost product itself are excluded.
Quantitative Units
USD billions (current prices); volume in units of equipment shipped
Segmentation Dimensions
By Process Stage; By End-Use Industry; By Commercial Dimension; By Region
Regions Covered
Western Europe, East Asia, North America, South Asia and Pacific, Latin America, Eastern Europe, Middle East and Africa
Countries Covered
Germany, Austria, Netherlands, Belgium, France, UK, Italy, Spain, Sweden, Denmark, Finland, Switzerland, Poland, Czechia, Romania, Bulgaria, Hungary, USA, Canada, Mexico, Brazil, Chile, Colombia, Argentina, China, Japan, South Korea, Taiwan, India, Australia, New Zealand, Indonesia, Thailand, Vietnam, Saudi Arabia, United Arab Emirates, South Africa, Egypt, Turkey, and additional markets relevant to this sector
Key Companies Profiled
Komptech, Vermeer, Eggersmann Group, Doppstadt, Terex Ecotec, Menart, Sandberger, Willibald, Scarab Manufacturing, Brown Bear, Midwest Bio-Systems, W. L. Gore, Engineered Compost Systems, Green Mountain Technologies, BDP Industries, Lindner, UNTHA, Pronar, Tana, Bandit Industries
Quantitative Methodology
Primary survey, n=3,800 respondents, Q4 2025, six countries; demand-side model with trade association cross-validation
Qualitative Methodology
47 expert interviews, Q4 2025; applied to validate demand model assumptions, identify emerging dynamics, and assess competitive positioning
Report Format
PDF and XLSX data workbook (Word format preview document)
Publisher
Market Minds Advisory
Report Code
MMA-2026-CON-561
Published
August 2026
Contact
sales@marketmindsadvisory.com | www.marketmindsadvisory.com

Purchase the full Compositing Equipment Market Report (2026 to 2036).

The full report examines composting equipment demand across seven regions and five process stages, with particular attention to how odour permitting rather than process performance decides which technology gets selected. It quantifies the contamination problem in separately collected biowaste and sizes the retrofit market that follows from it. Competitive analysis covers twenty participants assessed on composting equipment revenue, including where process system integrators are displacing machinery suppliers from the customer relationship. Regional chapters trace how collection mandates translate into built capacity, and identify where legal obligation currently runs well ahead of treatment.
Seven-region demand and capacity gap analysis
Five process stage segmentation with growth rates
Twenty participant competitive assessment and positioning
Odour permitting outcomes and technology implications
Contamination retrofit market sizing by region
Service and annuity revenue benchmarking by operator type

Built For The People Who Decide

From boardroom strategy to bench-side execution, this report is read cover-to-cover by leaders shaping the next decade of their industry, turning demand scenarios, market dynamics and valuation benchmarks into decisions.
CXOs/ Presidents/ VPs/ Managers
M&A and Corporate Development
Strategy Teams and R&D Heads
Procurement and Product Directors
Regulatory and Compliance Leaders
Investor Relations and Equity Analysts