Complement 3 Glomerulopathy (C3G) Treatment Market
Complement 3 Glomerulopathy (C3G) Treatment Market: Two Approvals in One Year After Decades of Nothing, and a Biopsy Nobody Performs
Diagnosis requires a kidney biopsy stained for a specific complement pattern, which means the size of this market is decided by nephrologists who biopsy rather than by how many people have the disease.
2025 MARKET VALUE$0.4BMarket Size 2025
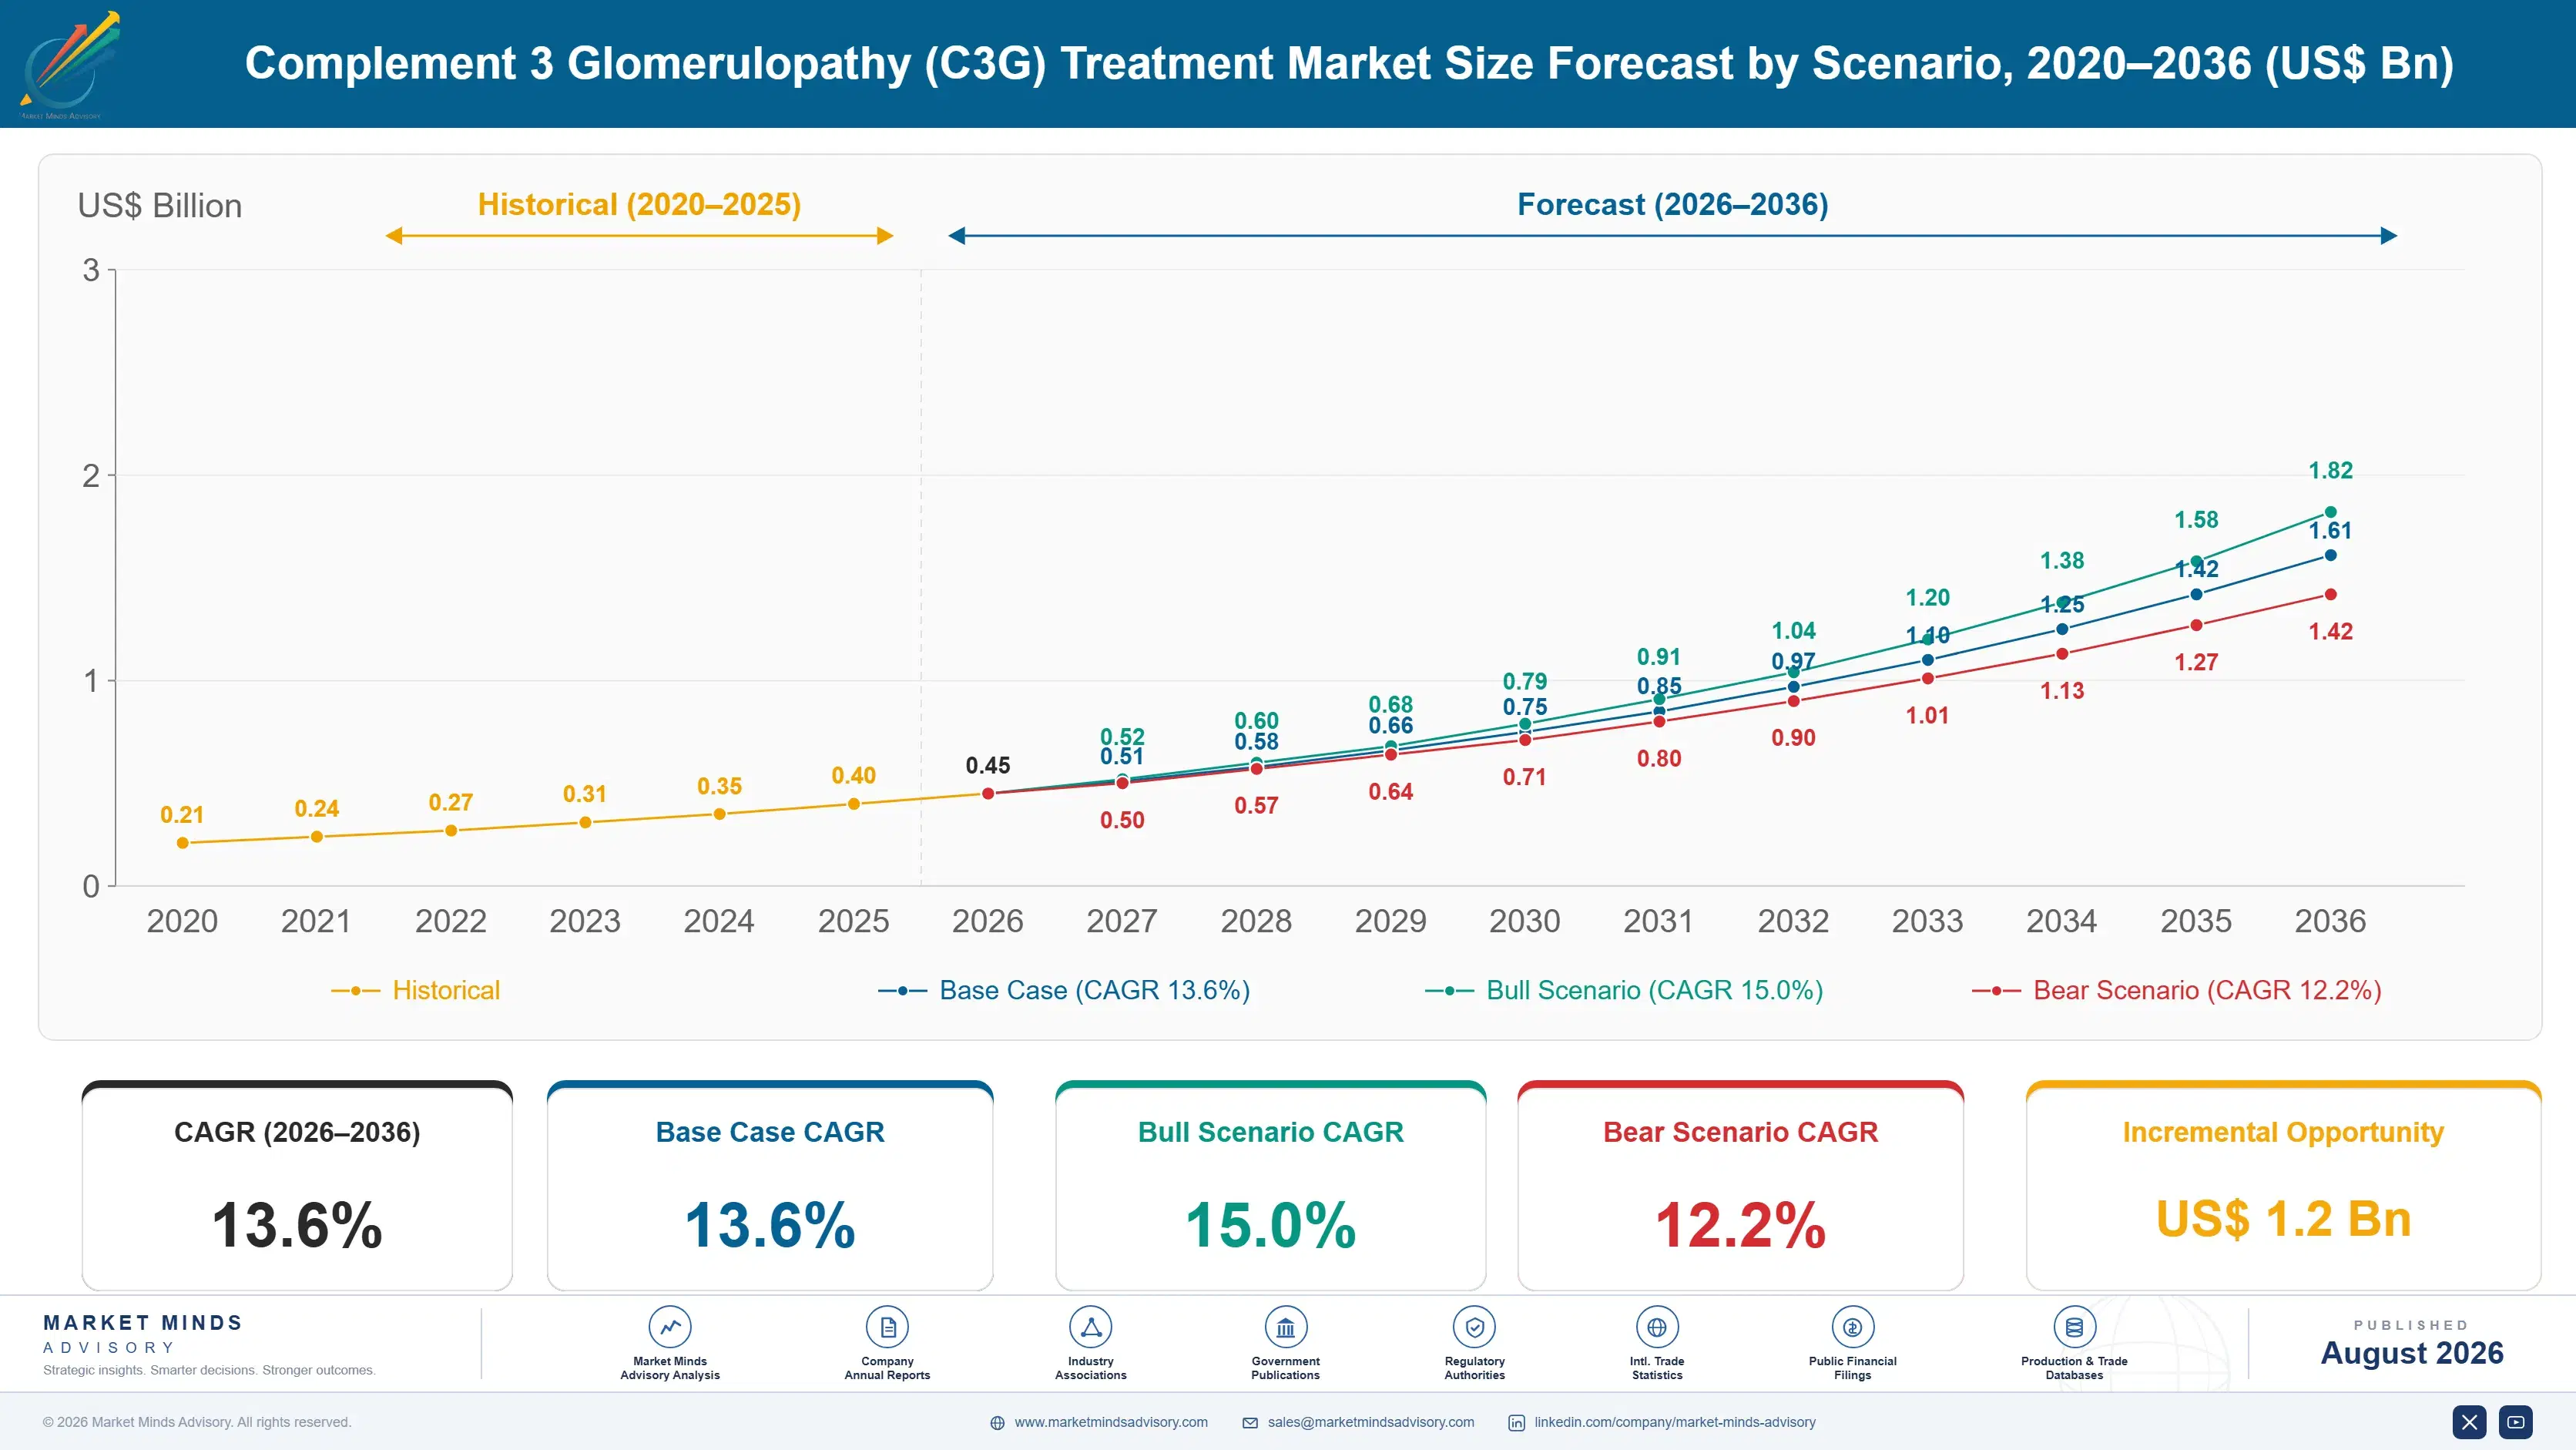
2036 FORECAST VALUE$1.7BBase Case , 2026 to 2036
CAGR 2026 TO 203613.6 %Bull 15.0% / Bear 12.2%
INCREMENTAL OPPORTUNITY$1.2BNet 10- year value creation
EXPANSION MULTIPLE3.56x2036 value over 2026 base
Strategic Levers
M&A Pipeline
Regional Outlook
Country Rankings
Competitive Intelligence
Segmental Deep-dive
Executive Snapshot and Market Trajectory
For decades this disease had no approved treatment anywhere, and nephrologists managed it with blood pressure control, immunosuppression that mostly failed, and off-label complement inhibitors aimed at the wrong point in the pathway. Two approvals arrived within four months of each other in 2025. Nothing had worked before that.
Complement factor B inhibitors compound at 20.4%, a full 1.50x the market rate, on an oral agent that reached approval first and had a commercial organisation already in place. North America holds 46% of global value, an exceptional concentration reflecting first approval, ultra-rare pricing several times ex-US levels, and the highest diagnosed prevalence anywhere outside Japan. Diagnosed prevalence near 2.5 per million sits well below epidemiological estimates.
Concentration is extreme at 92%, which is what happens when a market has exactly two approved products. The binding constraint is not competition but diagnosis: confirming C3G requires a kidney biopsy with immunofluorescence showing dominant C3 staining, and median delay from presentation runs around 14 months. Recurrence affects roughly 67% of transplanted kidneys, which makes prophylaxis around transplantation the one use case payers find genuinely difficult to refuse on cost grounds.
Market Definition
This market covers therapy for complement 3 glomerulopathy, including dense deposit disease and C3 glomerulonephritis, spanning complement factor B inhibitors, C3 inhibitors, investigational complement modulators, supportive and immunosuppressive therapy delivered specifically for this indication, and C5 inhibitors used off-label. Immunoglobulin A nephropathy, membranous nephropathy, lupus nephritis, atypical haemolytic uraemic syndrome, dialysis and transplantation services, kidney biopsy and complement diagnostic testing, and general antihypertensive therapy are excluded.
Base Year Value
$0.4B in 2025 (MMA Primary Research Dataset, August 2026)
Forecast Period
2026 to 2036, eleven discrete annual values
CAGR
13.6% base case. Bull 15.0%. Bear 12.2%.
Fastest Growth Segment
Complement Factor B Inhibitors: 20.4% CAGR
Fastest Growth Country
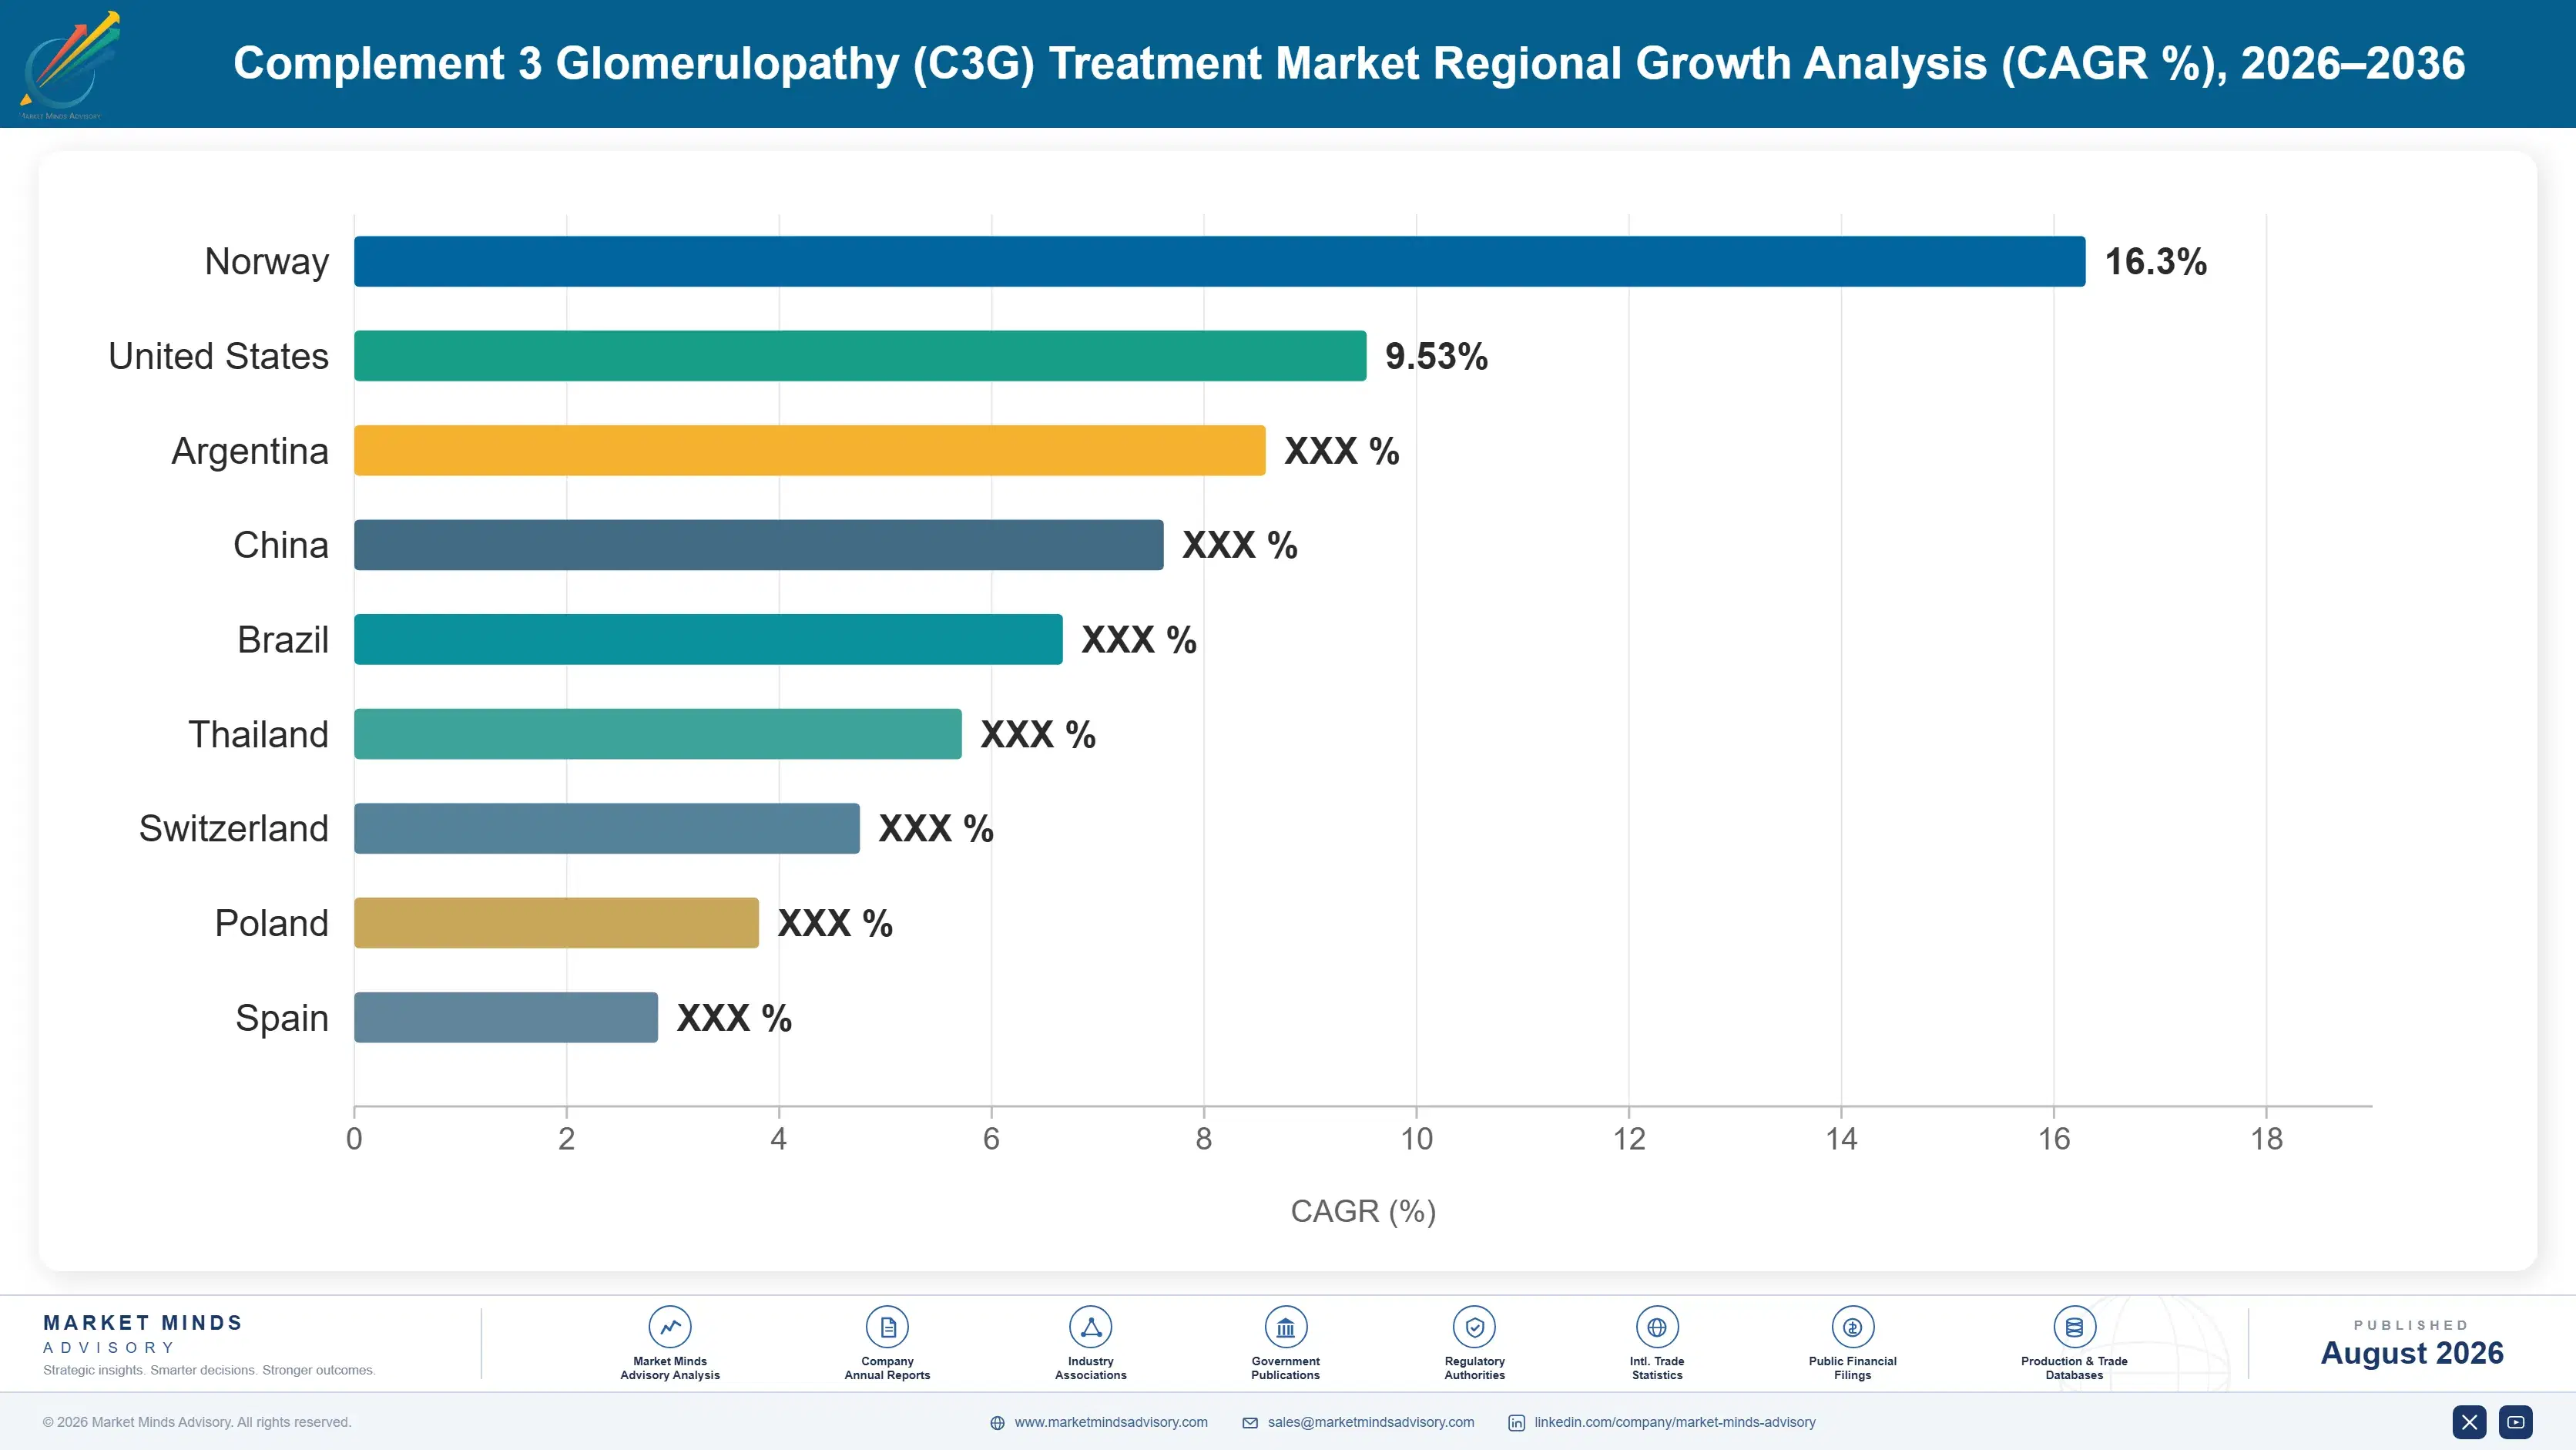
Japan: 16.2% CAGR
Fastest Growth Region
South Asia and Pacific: 15.8% CAGR
Largest Region
North America: 46% of 2025 global value
Market Leaders
Novartis, Apellis Pharmaceuticals, Sobi, AstraZeneca, and Roche. Source: MMA Primary Research Dataset, July 2026.
Primary Survey
n=3,800 procurement and R&D decision-makers, Q4 2025, six countries
Methodology
Demand-side build-up, cross-validated against public data, 47 expert interviews
Complement 3 Glomerulopathy (C3G) Treatment Market Forecast Scenarios

Growth ran near 12.2% from 2020 to 2025 on off-label complement inhibition and supportive care rather than on any approved therapy, since none existed. Nephrologists used C5 inhibitors despite a mechanism that blocks the pathway well downstream of where this disease is driven, and results were correspondingly poor. Diagnostic guideline work during the period did more for eventual market size than any therapy did.
Base case growth of 13.6% rests on three mechanisms. Two approved therapies now give nephrologists a reason to pursue definitive diagnosis, which was previously an academic exercise. Transplant recurrence prophylaxis is becoming standard practice, since the disease returns in most transplanted kidneys. And biopsy rates in markets where nephrology has been conservative are rising as treatable disease changes the calculation. None of the three depends on a further approval arriving within the period.
The bull case at 15.0% assumes diagnostic rates rise sharply as the availability of therapy filters through nephrology practice, which historically follows approval by several years rather than months. The bear case at 12.2% reflects payer restriction to biopsy-confirmed patients with defined progression criteria, which would hold treated volume well below diagnosed prevalence in most reimbursed markets.
Base case growth of 13.6% rests on three mechanisms. Two approved therapies now give nephrologists a reason to pursue definitive diagnosis, which was previously an academic exercise. Transplant recurrence prophylaxis is becoming standard practice, since the disease returns in most transplanted kidneys. And biopsy rates in markets where nephrology has been conservative are rising as treatable disease changes the calculation. None of the three depends on a further approval arriving within the period.
The bull case at 15.0% assumes diagnostic rates rise sharply as the availability of therapy filters through nephrology practice, which historically follows approval by several years rather than months. The bear case at 12.2% reflects payer restriction to biopsy-confirmed patients with defined progression criteria, which would hold treated volume well below diagnosed prevalence in most reimbursed markets.
C3G: Approvals Arrive, Diagnosis Lags
Until 2025 a nephrologist diagnosing this disease had nothing approved to offer. Management meant blood pressure control, mycophenolate and steroids that rarely altered the course, and in some centres an off-label C5 inhibitor blocking the pathway several steps below where the problem originates. Roughly half of patients reach end-stage kidney disease within a decade regardless.
TOP FIVE CONCENTRATION92%Extreme concentration around the only approved therapies available
DIAGNOSED PREVALENCE2.5 per millionConfirmed diagnoses per million population across covered markets
MEDIAN DIAGNOSTIC DELAY14 monthsTime from first presentation to a confirmed histological diagnosis
TEN-YEAR PROGRESSION RATE50%Patients reaching end-stage kidney disease within a decade
TRANSPLANT RECURRENCE RATE67%Grafts developing disease recurrence after a kidney transplantation
ANNUAL THERAPY COST$580,000Typical yearly cost per treated patient at list price
Two approvals then arrived within four months of one another, one an oral factor B inhibitor and one a subcutaneous C3 inhibitor. That changed the clinical position entirely and exposed a commercial one that had been hidden. Diagnosis requires a kidney biopsy processed with immunofluorescence showing dominant C3 staining, and a great many patients carrying this disease were never characterised that precisely.
Median delay from presentation to confirmed diagnosis runs around 14 months, and diagnosed prevalence sits near 2.5 per million against epidemiological estimates that are considerably higher. That gap, rather than any competitive dynamic, determines how large this market becomes. Nephrologists biopsy more readily when a positive result changes what they can do, and that behavioural shift takes years rather than months. Both sponsors now fund pathology characterisation programmes for exactly that reason.
"Everybody is watching the two approved products compete and the actual contest is with the pathologist. This disease is defined by an immunofluorescence pattern, and if the biopsy is not done or the staining is not requested, the patient is recorded as membranoproliferative glomerulonephritis and nobody ever treats them for what they have."
Market Trends
A kidney biopsy carries genuine risk and cost, and nephrologists weigh that against what a definitive answer would change. When nothing approved existed, characterising membranoproliferative disease down to a C3-dominant pattern was largely academic and many did not pursue it. Two approvals reverse that calculation directly, since a confirmed diagnosis now leads somewhere. Diagnosed prevalence near 2.5 per million sits well below epidemiological estimates, and closing that gap is worth more than any competitive share shift between the approved products. Both sponsors now fund pathology programmes that expand the population for each other equally.
Market Impact: Recurrence affecting 67% of grafts
Oral and subcutaneous formats compete on burden not efficacy
Two approved therapies reached market within four months of each other targeting different points in the same pathway, and comparative efficacy data does not exist and will not for years. Nephrologists therefore select on administration burden, monitoring requirements and the meningococcal safety programme both carry. An oral tablet against a subcutaneous infusion is a comparison patients make immediately and clinicians respect. Positioning arguments in this market are about how therapy fits a life rather than about pathway biology. Nephrologists carrying two to four such patients each cannot resolve a mechanism debate.
Market Impact: Progression reaching 50% at ten yea
Market Opportunities and Growth Drivers
Transplant recurrence makes prophylaxis clinically unavoidable
The disease returns in roughly 67% of transplanted kidneys, and graft loss follows recurrence in a substantial share of those, which means a patient who reaches transplantation faces losing the organ to the same process that destroyed the first. Prophylactic complement inhibition around transplantation carries a clinical rationale that payers find difficult to refuse on cost grounds. Each transplanted patient represents extended therapy at roughly $580,000 annually, and transplant programmes are a small identifiable audience. Engaging transplant programmes is therefore the most efficient commercial activity available anywhere in this indication.
Market Impact: Diagnostic delay running 14 months
Guideline definition made the disease a treatable entity
Formal guideline work separating C3 glomerulopathy from the broader membranoproliferative category established a diagnostic definition regulators and trial designers could work with, which is what made registrational studies possible at all. Before that, patients with the same underlying pathology sat inside a mixed classification that no trial could enrol coherently. The definitional work preceded and enabled both approvals, and it continues to determine how many patients are correctly identified in routine nephrology practice today. Where the immunofluorescence staining is never requested, a patient is recorded under the broader membranoproliferative category and treated for nothing in particular.
Market Impact: Therapy costing $580,000 annually
Market Restraints and Challenges
Diagnosis depends on a biopsy many patients never receive
Confirming this disease requires a kidney biopsy processed with immunofluorescence showing dominant C3 staining, and nephrology practice varies enormously in how readily biopsy is performed. The root cause is that biopsy carries risk and cost, and until 2025 a definitive answer changed nothing about management. Commercial impact is diagnosed prevalence near 2.5 per million against considerably higher epidemiological estimates. Participants respond by funding pathology characterisation programmes, nephrology education and complement biomarker access rather than promoting products. Prescriber promotion reaches none of those patients. The staining has to be requested before it can be found.
Market Impact: Diagnosed prevalence near 2.5 per m
Payers restrict therapy at these prices to defined criteria
At roughly $580,000 per patient annually, reimbursement across most systems requires biopsy confirmation, documented proteinuria thresholds and evidence of progression before therapy is funded. The root cause is straightforward cost containment in a disease where progression is variable and some patients remain stable for years without treatment. Commercial impact is treated volume well below diagnosed prevalence. Participants respond by generating progression prediction evidence, biomarker-based risk stratification and outcome-linked payment arrangements. That evidence takes years to accumulate and cannot be produced once an eligibility restriction is already in place, so the investment has to precede the negotiation entirely.
Market Impact: Two approvals within 4 months
3 additional market trends, 2 additional growth drivers, and 4 additional restraints and challenges are covered in the full report. Contact sales@marketmindsadvisory.com to access the complete intelligence.
Segment CAGR and Growth Architecture
Five therapy classes divide this market by mechanism and pathway position, which determines both clinical rationale and commercial position. The division separates the two newly approved mechanisms from the supportive care they displace and from off-label complement inhibition aimed several steps below where this disease is actually driven. Administration route decides prescribing more than mechanism does.

Complement Factor B Inhibitors
Compounding at 20.4%, a full 1.50x the market rate, this class blocks the alternative complement pathway upstream of C3 through an oral agent taken twice daily rather than infused. Reaching approval first mattered enormously in an ultra-rare disease where nephrologists have very few patients each and adopt what they have used before. The commercial organisation and meningococcal safety programme were already established from adjacent complement indications, which removed the infrastructure build that a first-in-disease launch would otherwise require. Oral administration is the argument patients respond to immediately. Nephrologists see so few of these patients that whichever therapy they used first tends to become the one they keep using. First approval therefore matters more here than elsewhere.
CAGR 20.4%
C3 Inhibitors
Growing at 17.8%, this class targets C3 directly, which is the protein the disease is named for and arguably the more precise intervention point in the pathway. Registrational data spanning both C3 glomerulopathy and primary immune complex membranoproliferative disease gives it a broader label than a narrower competitor carries. Subcutaneous infusion is the commercial disadvantage against an oral alternative that reached market months earlier. Comparative efficacy data does not exist and will not for years, so positioning rests on pathway logic and administration burden instead. Payer eligibility criteria requiring biopsy confirmation and documented progression apply equally to both classes, so neither carries an access advantage over the other. Pathway logic is the argument that remains.
CAGR 17.8%
Full segment breakdown across 5 segments available in the complete report.
Regional Architecture and Country Demand Map
Regional distribution follows diagnosis rate and ultra-rare pricing rather than disease prevalence, which is broadly uniform. Where nephrologists biopsy readily and pathology laboratories run immunofluorescence routinely, patients are identified; where they do not, the disease is recorded as something else entirely. Biopsy practice decides identification everywhere.
North America
Forty-six per cent of global value against nothing like that share of patients. Note: this far exceeds the 22 to 32% band because both approvals were granted here first, United States net prices for ultra-rare therapy run several times European levels, and biopsy practice supports comparatively high diagnosed prevalence. Payer restriction is nonetheless severe, requiring biopsy confirmation, proteinuria thresholds and documented progression before funding. Transplant programmes are the most developed anywhere, which makes recurrence prophylaxis a substantial and defensible use case in this region. Diagnostic support programmes have become the principal commercial activity here rather than prescriber promotion. Payer eligibility criteria are nonetheless applied more strictly here than in any other reimbursed market covered, requiring documented decline before funding.
Share: 46% | CAGR: 13.0% (2026 to 2036)
Western Europe
Twenty-two per cent of value, and health technology assessment governs access more than clinical opinion does. National agencies have negotiated confidential discounts and several restricted eligibility to biopsy-confirmed patients meeting defined progression criteria before funding either therapy. Germany, France, Italy, Spain and the United Kingdom account for most regional value. Nephrology biopsy practice is reasonably consistent and pathology immunofluorescence widely available, so diagnosed prevalence approaches epidemiological estimates more closely here than in most regions covered. Transplant programmes across the region are active and well organised, which makes recurrence prophylaxis a clearer commercial route than first-line treatment where eligibility criteria bite hardest. Confidential discounting makes published pricing meaningless across the region.
Share: 22% | CAGR: 12.0% (2026 to 2036)
Regional intelligence for 5 additional markets available in the complete report: East Asia, South Asia and Pacific, Latin America, Middle East and Africa, Eastern Europe. Contact sales@marketmindsadvisory.com.

Where C3G Treatment Value Actually Turns
Two approved therapies competing for a diagnosed population of two and a half per million is a smaller contest than either sponsor would like. The larger opportunity sits with the patients who have this disease and are recorded as something else, and with the transplant setting where treatment is hardest to refuse. Growing this market matters more than winning it.
Fund the pathology before promoting the product
This disease is defined by an immunofluorescence pattern, and where the staining is not requested the patient is classified as membranoproliferative glomerulonephritis and never treated for what they actually have. Diagnosed prevalence near 2.5 per million sits well below epidemiological estimates, and closing that gap expands the treatable population for both approved therapies simultaneously. Supporting pathology characterisation and complement biomarker access reaches patients that no amount of prescriber-facing promotion ever would. The uncomfortable feature is that this investment expands the treatable population for a competitor equally, and neither sponsor can decline to make it.
Market Impact: Prevalence identified at only 2.5 p
Secure transplant prophylaxis as standard protocol
Recurrence affects roughly 67% of transplanted kidneys and graft loss follows in a substantial share, which gives prophylactic therapy a clinical rationale payers struggle to refuse on cost alone. Establishing it as standard transplant protocol rather than a case-by-case judgement creates defined treatment episodes worth roughly $580,000 annually each. Transplant programmes are a small identifiable audience reachable through a handful of centres per country, which makes this the most efficient commercial activity available in the indication. Graft loss follows recurrence in a substantial share of affected transplants. Transplant centres number very few per country.
Market Impact: Episodes worth $580,000 in every si
Compete on burden while efficacy data does not exist
Comparative efficacy between the two approved mechanisms will not exist for years, so nephrologists select on administration burden, monitoring requirements and how therapy fits a patient's life. An oral tablet against a subcutaneous infusion is a comparison patients make immediately and clinicians respect. Sponsors arguing pathway biology to nephrologists who have perhaps two such patients each are addressing a debate those clinicians have no basis to resolve, and the burden argument decides the prescription instead. Two mechanisms reached approval within 4 months of each other, and no head-to-head study is planned by either sponsor.
Market Impact: Two mechanisms approved within just
Build progression evidence ahead of payer restriction
Reimbursement at roughly $580,000 annually requires biopsy confirmation, proteinuria thresholds and documented progression in most systems, which holds treated volume well below diagnosed prevalence. Biomarker-based progression prediction would identify patients who genuinely cannot wait, converting a cost argument into a clinical one that payers find harder to refuse. That evidence takes years to generate and cannot be produced once a restriction is already in place, so the investment has to precede the negotiation. Roughly 50% of patients reach end-stage kidney disease within a decade, and identifying which ones early is the argument payers respond to.
Market Impact: Progression reaching 50% within a s
Who Controls the Margin Pool
The top five hold 92% of the market measured on revenue from products indicated for or used in this disease, the basis used throughout this section. That concentration simply reflects a market with two approved therapies, and the gap to everything else is absolute rather than gradual. Novartis holds the first approval with an oral agent while Apellis and Sobi hold the C3 inhibitor position with a broader label spanning a related indication.
Competitive activity runs along three lines. Both sponsors are funding diagnostic and pathology characterisation programmes, correctly identifying that undiagnosed patients matter more than share between them. Transplant prophylaxis is being pursued as a defined and defensible use case by both. And a considerable pipeline of factor D, MASP-2 and complement factor H approaches is advancing behind them from specialist developers.
Pressure will come from the pipeline rather than from each other. Several investigational mechanisms address the same pathway with different administration profiles, and in a disease where efficacy comparison is impractical, administration burden decides outcomes. Rankings shift on which sponsor expands the diagnosed population fastest, since that expansion benefits whoever is positioned in nephrology when the patient is identified.

Competitive Moat and Risk Dimensions
Moat: First approval with existing infrastructure
Reaching approval first in an ultra-rare disease matters more than it would elsewhere, because nephrologists carry very few such patients each and prescribe what they have used before. The commercial organisation, meningococcal safety programme and specialist field presence were already established through adjacent complement indications, which removed an infrastructure build that a first-in-disease launch normally requires entirely.
Risk: Upstream target arguably less precise
Factor B inhibition blocks the alternative pathway above C3, while the competing approach targets C3 itself, which is the protein this disease is named after and which some nephrologists regard as the more logical intervention point. Without comparative data that argument stays unresolved, and a subcutaneous competitor carrying a broader label reached approval only four months later.
Moat: Direct C3 targeting breadth
Inhibiting C3 addresses the exact protein whose deposition defines this disease histologically, which is a clean pathway argument that nephrologists understand immediately. Registrational data spanning both C3 glomerulopathy and primary immune complex membranoproliferative disease produces a broader label than a narrower competitor holds, reaching patients that the alternative approval does not formally cover.
Risk: Subcutaneous burden against oral
Administration burden is the criterion nephrologists actually use while comparative efficacy remains unavailable, and a subcutaneous infusion competes against a twice-daily tablet that reached market four months earlier. Patients weigh that difference immediately and clinicians respect their preference, which places the burden of proof on the more demanding regimen without any data to discharge it.
Players Tracked
Prominent Players
Novartis
Apellis Pharmaceuticals
Sobi
AstraZeneca
Roche
Other Key Players
Otsuka Pharmaceutical
Vera Therapeutics
Q32 Bio
Omeros
BioCryst Pharmaceuticals
Kira Pharmaceuticals
Novelmed Therapeutics
Amgen
Alnylam Pharmaceuticals
Travere Therapeutics
Ionis Pharmaceuticals
Aurinia Pharmaceuticals
Calliditas Therapeutics
Zai Lab
Hansa Biopharma
Recent Developments
Guideline work separates C3 glomerulopathy as a distinct entity
International kidney disease guidance formalised complement 3 glomerulopathy as a distinct diagnostic entity within the membranoproliferative pattern, defined by dominant C3 staining on immunofluorescence. The guidance was a clinical practice publication rather than any regulatory action, and it established the definition that subsequent registrational trials required to enrol coherently.
Signal: A diagnostic definition had to exist befor
First therapy approved for complement 3 glomerulopathy
United States regulators approved an oral complement factor B inhibitor for complement 3 glomerulopathy, the first therapy ever approved for the disease after decades in which nephrologists had only supportive care and off-label options. The approval established a treatment pathway and a reimbursement precedent the second entrant negotiated against.
Signal: First approval in an ultra-rare disease sh
C3 inhibitor approved across two related indications
Regulators approved a subcutaneous C3 inhibitor for complement 3 glomerulopathy and primary immune complex membranoproliferative glomerulonephritis, producing a broader label than the first approval carried. The two therapies target different points in the same pathway, and no comparative efficacy data exists between them. Positioning therefore rests on administration burden.
Signal: Two mechanisms arrived four months apart w
What Actually Costs Money Here
Manufacturing barely registers against pricing at this level. Small molecule synthesis for the oral agent and peptide manufacture for the injectable together account for under 6% of net revenue, with capacity in Europe and the United States. What genuinely costs money is clinical development in a disease with two and a half diagnosed patients per million, where enrolling a registrational trial required international site networks and years of recruitment.
Complement inhibition also requires a meningococcal safety programme covering vaccination, prescriber certification and continuous monitoring, and that carries fixed cost regardless of patient numbers. Sponsor disclosures across complement therapeutics document rare disease commercial expense running far above conventional therapeutic areas per treated patient. Diagnostic and pathology support programmes represent a further cost line that neither sponsor can avoid if the treated population is to grow.
Exposure varies by portfolio breadth rather than by geography. Sponsors running several complement therapies spread safety programme infrastructure across a wider revenue base, which matters more than manufacturing efficiency ever will at these prices. Single-asset participants carry that overhead alone. Both approved sponsors also carry diagnostic investment that expands the market for their competitor as much as for themselves.

Shared complement safety programme infrastructure
Meningococcal vaccination tracking, prescriber certification and continuous safety monitoring carry fixed cost that a single product must absorb alone. Sponsors running several complement therapies spread that infrastructure across a wider revenue base, which is one reason this field rewards portfolio breadth far beyond what its patient numbers would suggest. Single-asset participants carry it entirely alone.
Registry investment ahead of payer restriction
Progression prediction evidence takes years to accumulate and cannot be generated once a payer has already imposed eligibility criteria. Funding registries and biomarker stratification before restriction is negotiated converts a future cost argument into a clinical one, and sponsors that invested early are defending treated volume considerably more successfully. Restriction criteria are rarely revisited once set.
Diagnostic support through pathology networks
Immunofluorescence characterisation determines whether a patient is ever identified, and supporting pathology networks reaches patients that prescriber promotion cannot. The uncomfortable feature is that this investment expands the treatable population for competitors equally, so sponsors must weigh market growth against relative share. Neither sponsor can decline it, since an undiagnosed patient generates nothing for anybody.
Portfolio Architecture for Margin Defence
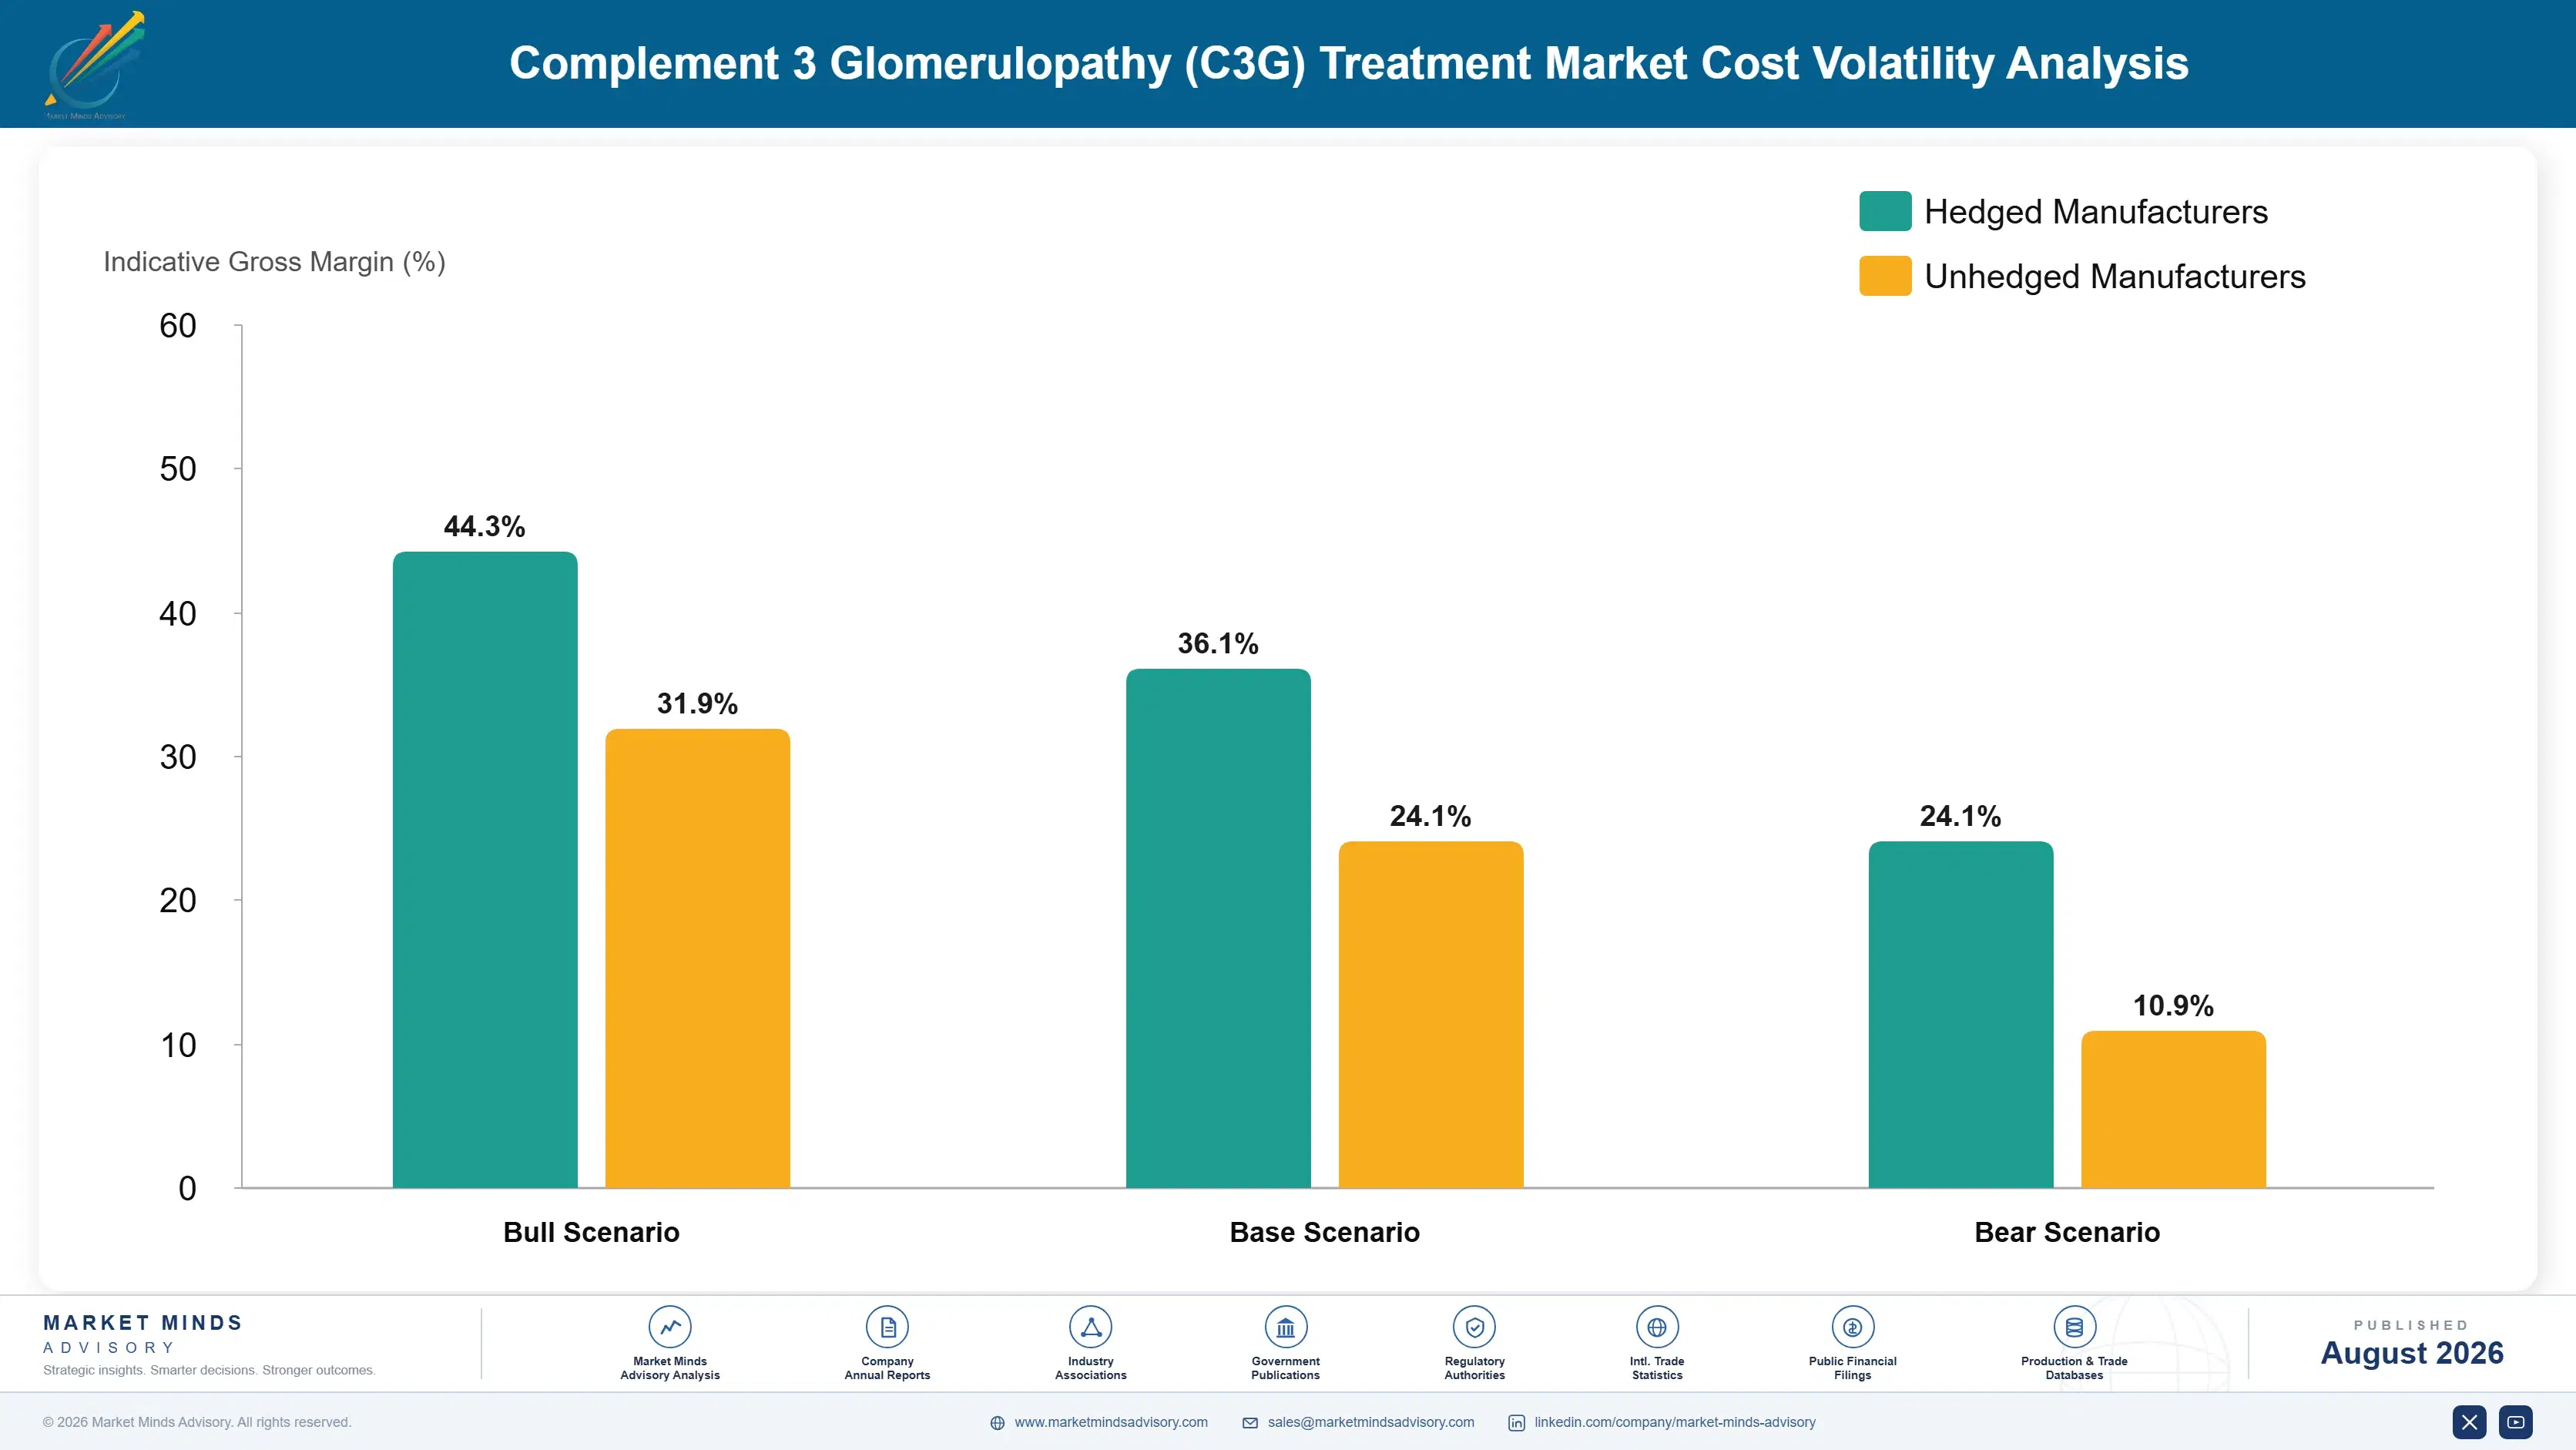
Margin architecture here reflects ultra-rare pharmaceutical economics rather than anything about kidney disease. Manufacturing cost is immaterial against roughly $580,000 per patient annually, so gross margin on both approved therapies clears well above ninety per cent. What consumes the economics is patient identification, the safety programme and a specialist field organisation supporting a few thousand treated patients worldwide. Manufacturing efficiency is close to irrelevant against that st
The tension is between growing the market and winning it. Both sponsors need diagnosed prevalence to rise from 2.5 per million, and every pathology programme that achieves it benefits the competitor equally. Neither can decline to invest, since an undiagnosed patient generates nothing for anybody. That produces an unusual dynamic where competitors fund a shared expansion while competing for share within it.
High-value pools concentrate where therapy is clinically indefensible to withhold. Transplant recurrence prophylaxis, rapidly progressive disease with documented decline and paediatric presentations all sit there, because no nephrologist will withhold treatment regardless of what a payer prefers. Everything treating stable patients with modest proteinuria faces an eligibility restriction conversation at every funding review. Eligibility criteria are reassessed formally in several European systems rather than presumed to continue indefinitely.
Volume / Commodity-Adjacent Tier
Supportive and immunosuppressive management including blood pressure control, mycophenolate and steroids delivered at genericised cost, which most patients receive alongside or before any approved complement therapy reaches them. Nothing here alters disease trajectory meaningfully.
Gross Margin: 12-28%
Premium / Certified Tier
Approved complement therapies delivered through certified prescribers under meningococcal safety programmes and payer eligibility criteria, defended by regulatory approval and by nephrology prescribing habit in a disease few clinicians see often.
Gross Margin: 86-93%
Sustainability / Regulatory / Next-Generation Tier
Transplant prophylaxis protocols and biomarker-directed treatment strategies, defended by clinical rationale that payers cannot easily refuse and by progression evidence that takes years of registry investment to assemble. Registry investment is the entry cost.
Gross Margin: 88-95%

High-value Sub-segments and Strategic Watch-out
Complement Factor B Inhibitors
High value and the fastest growth at 20.4%, holding first approval and an oral administration advantage. Prescribing habit in an ultra-rare disease favours whichever therapy a nephrologist used first, and few see enough patients to revisit that. Oral administration is the argument patients respond to.
Gross Margin: 88-94%
C3 Inhibitors
High value at 17.8%, targeting the protein that defines the disease histologically and carrying a broader label across a related indication. Subcutaneous administration is the disadvantage against an oral competitor that arrived first. Label breadth reaches patients the alternative approval does not formally cover at all.
Gross Margin: 86-93%
Transplant Prophylaxis Protocols
The defensible pool, since recurrence affects roughly 67% of grafts and no nephrologist will withhold prophylaxis. Transplant centres are a small identifiable audience, making this the most efficient commercial activity available here. Payers find this use case hardest to decline. Graft loss follows recurrence quickly.
Gross Margin: 88-95%
Investigational Complement Modulators
The strategic watch-out at 15.0%. Factor D, MASP-2 and factor H approaches are advancing with different administration profiles, and in a disease where efficacy comparison is impractical, burden decides outcomes entirely. Several are advancing behind the two approvals already. Burden will decide those contests too.
Gross Margin: 84-92%
Who Diagnoses and What Persists
Revenue here is duration multiplied by a fixed price, and the price is not moving. A treated patient generates roughly $580,000 annually for as long as therapy continues, so the commercial questions are how many patients are identified and how long each stays on treatment. With diagnosed prevalence near 2.5 per million, patient identification matters more than any other activity a sponsor can fund.
Persistence depends on disease trajectory rather than tolerability. Patients with rapidly progressive disease, transplant recipients and those with documented decline stay on therapy indefinitely, because no nephrologist will stop treatment against that background. Patients with stable proteinuria face a funding review at every renewal, and in several European systems eligibility criteria are reassessed formally rather than presumed to continue.
The identifying clinician sits upstream of the prescribing one, which is unusual. A renal pathologist requesting and interpreting immunofluorescence determines whether this disease is ever named, and a nephrologist then decides whether to treat it. Sponsors engaging only with prescribing nephrologists reach the second decision and never influence the first, which is where most of the addressable population is currently being lost.

Where Value Actually Sits
These are among the four positions where our research anticipates prominent divergence between winners and laggards over the coming forecast period. Each is grounded in the demand model, the regulatory perimeter, and the announced capacity pipeline.
The pathologist decides this market's size
This disease is defined entirely by an immunofluorescence pattern showing dominant C3 staining, and where that staining is never requested at all the patient is recorded as membranoproliferative glomerulonephritis and treated for nothing in particular. Diagnosed prevalence near 2.5 per million therefore sits well below every epidemiological estimate of the true underlying burden. Supporting pathology characterisation reaches patients that no volume of prescriber-facing promotion could ever identify at all, and it expands the treatable population for every participant at once.
Recurrence makes prophylaxis nearly impossible to refuse
The disease returns in roughly 67% of all transplanted kidneys and graft loss then follows recurrence in a substantial share of those cases, which gives prophylactic therapy a clinical rationale payers find genuinely difficult to decline on cost grounds. Establishing it as standard transplant protocol rather than as a case-by-case clinical judgement creates defined episodes worth roughly $580,000 annually each. Transplant programmes are also a small and readily identifiable audience across every single covered market, reachable through very few centres.
No efficacy comparison exists, so burden decides
Two mechanisms reached approval within four months of one another and comparative efficacy data will not exist for many years, which leaves nephrologists selecting instead on administration burden and on monitoring requirements alone. A twice-daily oral tablet set against a subcutaneous infusion is a comparison that patients make immediately and that clinicians then respect without much argument. Sponsors debating pathway biology with nephrologists who see only two such patients each are addressing a question those clinicians have no basis to resolve.
Generate the data before the restriction lands
Reimbursement at roughly $580,000 annually already requires biopsy confirmation, proteinuria thresholds and documented progression across almost every funded system, which holds treated volume far below the diagnosed prevalence in every one of them. Biomarker-based progression prediction would instead identify precisely those patients who genuinely cannot wait, converting an economic argument into a clinical one that payers find considerably harder to refuse. That evidence takes years to accumulate properly and simply cannot be produced after an eligibility restriction has already been imposed.
Engagement Snapshot From the Field
A live engagement with an industry participant carrying material or product regulatory and market exposure ahead of a defining policy shift, showing how our research translates into a defensible multi-year portfolio strategy.
MARKET MINDS ADVISORY · CLIENT ENGAGEMENT SUMMARY
Complement 3 Glomerulopathy (C3G) Treatment Producer Strategic Portfolio Review and Transition Roadmap 2026·Investment Scenario on Complement 3 Glomerulopathy (C3G) Treatment Exposure Evaluation 2025-26
CLIENT PROFILE
A rare disease biopharmaceutical company with annual revenue near $890 million (client-reported, unverified by MMA), holding an approved complement therapy in an adjacent indication and a candidate in late-stage development for complement 3 glomerulopathy. Leadership had built launch plans around competitive positioning against the two approved therapies and wanted the assumptions tested before committing the commercial budget.
STRATEGIC CHALLENGE
The plan allocated most of the launch budget to nephrologist education and comparative positioning, on the assumption that the addressable population was already identified and the contest was for share of it. Leadership needed to establish how many patients were actually diagnosed, where identification was failing, and whether competing for share of a small population was the right objective at all.
MMA APPROACH
We reconstructed diagnostic pathways across nine markets, tracking patients from first presentation through biopsy, immunofluorescence characterisation and specialist referral. Thirty-seven nephrologists and 14 renal pathologists were interviewed on biopsy thresholds and staining practice. We modelled a share-competition launch against a diagnostic expansion strategy using treated patient count as the comparison.
KEY FINDINGS
- Diagnosed prevalence across the nine markets averaged 2.5 per million against epidemiological estimates roughly twice that, and the loss occurred at biopsy and staining rather than at referral.
- Nine of 14 renal pathologists said C3 staining was not performed routinely on membranoproliferative patterns unless the nephrologist requested it specifically, and most did not.
- Nephrologists reported managing two to four such patients each, which made comparative efficacy arguments meaningless to them and administration burden the deciding factor.
- Diagnostic expansion modelled a larger absolute increase in treated patients for the client than any realistic share gain against the two approved therapies would have produced.
CLIENT PROFILE
A rare disease biopharmaceutical company with annual revenue near $890 million (client-reported, unverified by MMA), holding an approved complement therapy in an adjacent indication and a candidate in late-stage development for complement 3 glomerulopathy. Leadership had built launch plans around competitive positioning against the two approved therapies and wanted the assumptions tested before committing the commercial budget.
STRATEGIC CHALLENGE
The plan allocated most of the launch budget to nephrologist education and comparative positioning, on the assumption that the addressable population was already identified and the contest was for share of it. Leadership needed to establish how many patients were actually diagnosed, where identification was failing, and whether competing for share of a small population was the right objective at all.
MMA APPROACH
We reconstructed diagnostic pathways across nine markets, tracking patients from first presentation through biopsy, immunofluorescence characterisation and specialist referral. Thirty-seven nephrologists and 14 renal pathologists were interviewed on biopsy thresholds and staining practice. We modelled a share-competition launch against a diagnostic expansion strategy using treated patient count as the comparison.
KEY FINDINGS
- Diagnosed prevalence across the nine markets averaged 2.5 per million against epidemiological estimates roughly twice that, and the loss occurred at biopsy and staining rather than at referral.
- Nine of 14 renal pathologists said C3 staining was not performed routinely on membranoproliferative patterns unless the nephrologist requested it specifically, and most did not.
- Nephrologists reported managing two to four such patients each, which made comparative efficacy arguments meaningless to them and administration burden the deciding factor.
- Diagnostic expansion modelled a larger absolute increase in treated patients for the client than any realistic share gain against the two approved therapies would have produced.
RECOMMENDED STRATEGY
Phase 1: Phase one: redirect launch budget from comparative positioning toward pathology network support and immunofluorescence characterisation programmes across target markets. Identification precedes competition. Phase 2: Phase two: build transplant centre engagement early, since recurrence prophylaxis is the use case payers find hardest to refuse and centres are few. Phase 3: Phase three: position on administration burden rather than pathway biology, since nephrologists cannot resolve mechanism arguments at these patient volumes.
OUTCOME
The launch budget was reallocated with roughly half redirected toward diagnostic support, reversing the original plan. Pathology programmes in three markets raised C3 staining rates measurably within a year (client-reported, unverified by MMA). Transplant centre engagement began ahead of approval, and leadership now treats diagnosed prevalence as the primary commercial metric.
Frequently Asked Questions
Foundational context covering the market sizes, CAGR, scope, country, region and competition that inform every finding below. This section is provided to cover basics and most often pre-purchase conversations, answered from the MMA Primary Research Dataset.
What is the current size of the Complement 3 Glomerulopathy (C3G) Treatment Market?
The global market is valued at $0.42 billion in 2025, rising to $0.48 billion in 2026. North America holds 46% of that value, reflecting first approval and ultra-rare pricing several times ex-US levels.
How large will the Complement 3 Glomerulopathy (C3G) Treatment Market be by 2036?
MMA forecasts $1.71 billion by 2036, an increase of $1.23 billion over the 2026 base and an expansion multiple of 3.56x. Rising diagnosed prevalence carries most of that growth.
What is the CAGR for the Complement 3 Glomerulopathy (C3G) Treatment Market 2026 to 2036?
The base case compound annual growth rate is 13.6%, with a bull case at 15.0% and a bear case at 12.2%. Historical growth from 2020 to 2025 came from supportive care and off-label use only.
Which segment is growing fastest?
Complement factor B inhibitors compound at 20.4%, a full 1.50x the market rate. The class reached approval first with an oral agent and an existing commercial and safety infrastructure already in place.
Who are the major companies in the Complement 3 Glomerulopathy (C3G) Treatment Market?
Novartis, Apellis Pharmaceuticals, Sobi, AstraZeneca and Roche together hold 92% of revenue from products used in this disease. That concentration simply reflects a market with two approved therapies.
Which country is growing fastest?
Japan compounds at 16.2%, faster than any other country covered, on nephrology practice that performs kidney biopsy far more readily than Western equivalents. Its renal biopsy registry has characterised this disease unusually well.
Report Segmentation Architecture
The full report scope spans multiple orthogonal segmentation dimensions, with cross-tabulated demand data provided for each dimension pair. Coverage extends further to regional breakdowns, trend trajectories, and the competitive detail needed to support segment-level decision-making.
By Therapy Class
- Complement Factor B Inhibitors
- C3 Inhibitors
- Investigational Complement Modulators
- Supportive and Immunosuppressive Therapy
- C5 Inhibitors Used Off-Label
By End-Use Industry
- Academic Nephrology Centres
- Paediatric Nephrology Units
- Kidney Transplant Programmes
- Community Nephrology Practice
- Renal Pathology Laboratories
- Clinical Trial Sites
By Commercial Dimension
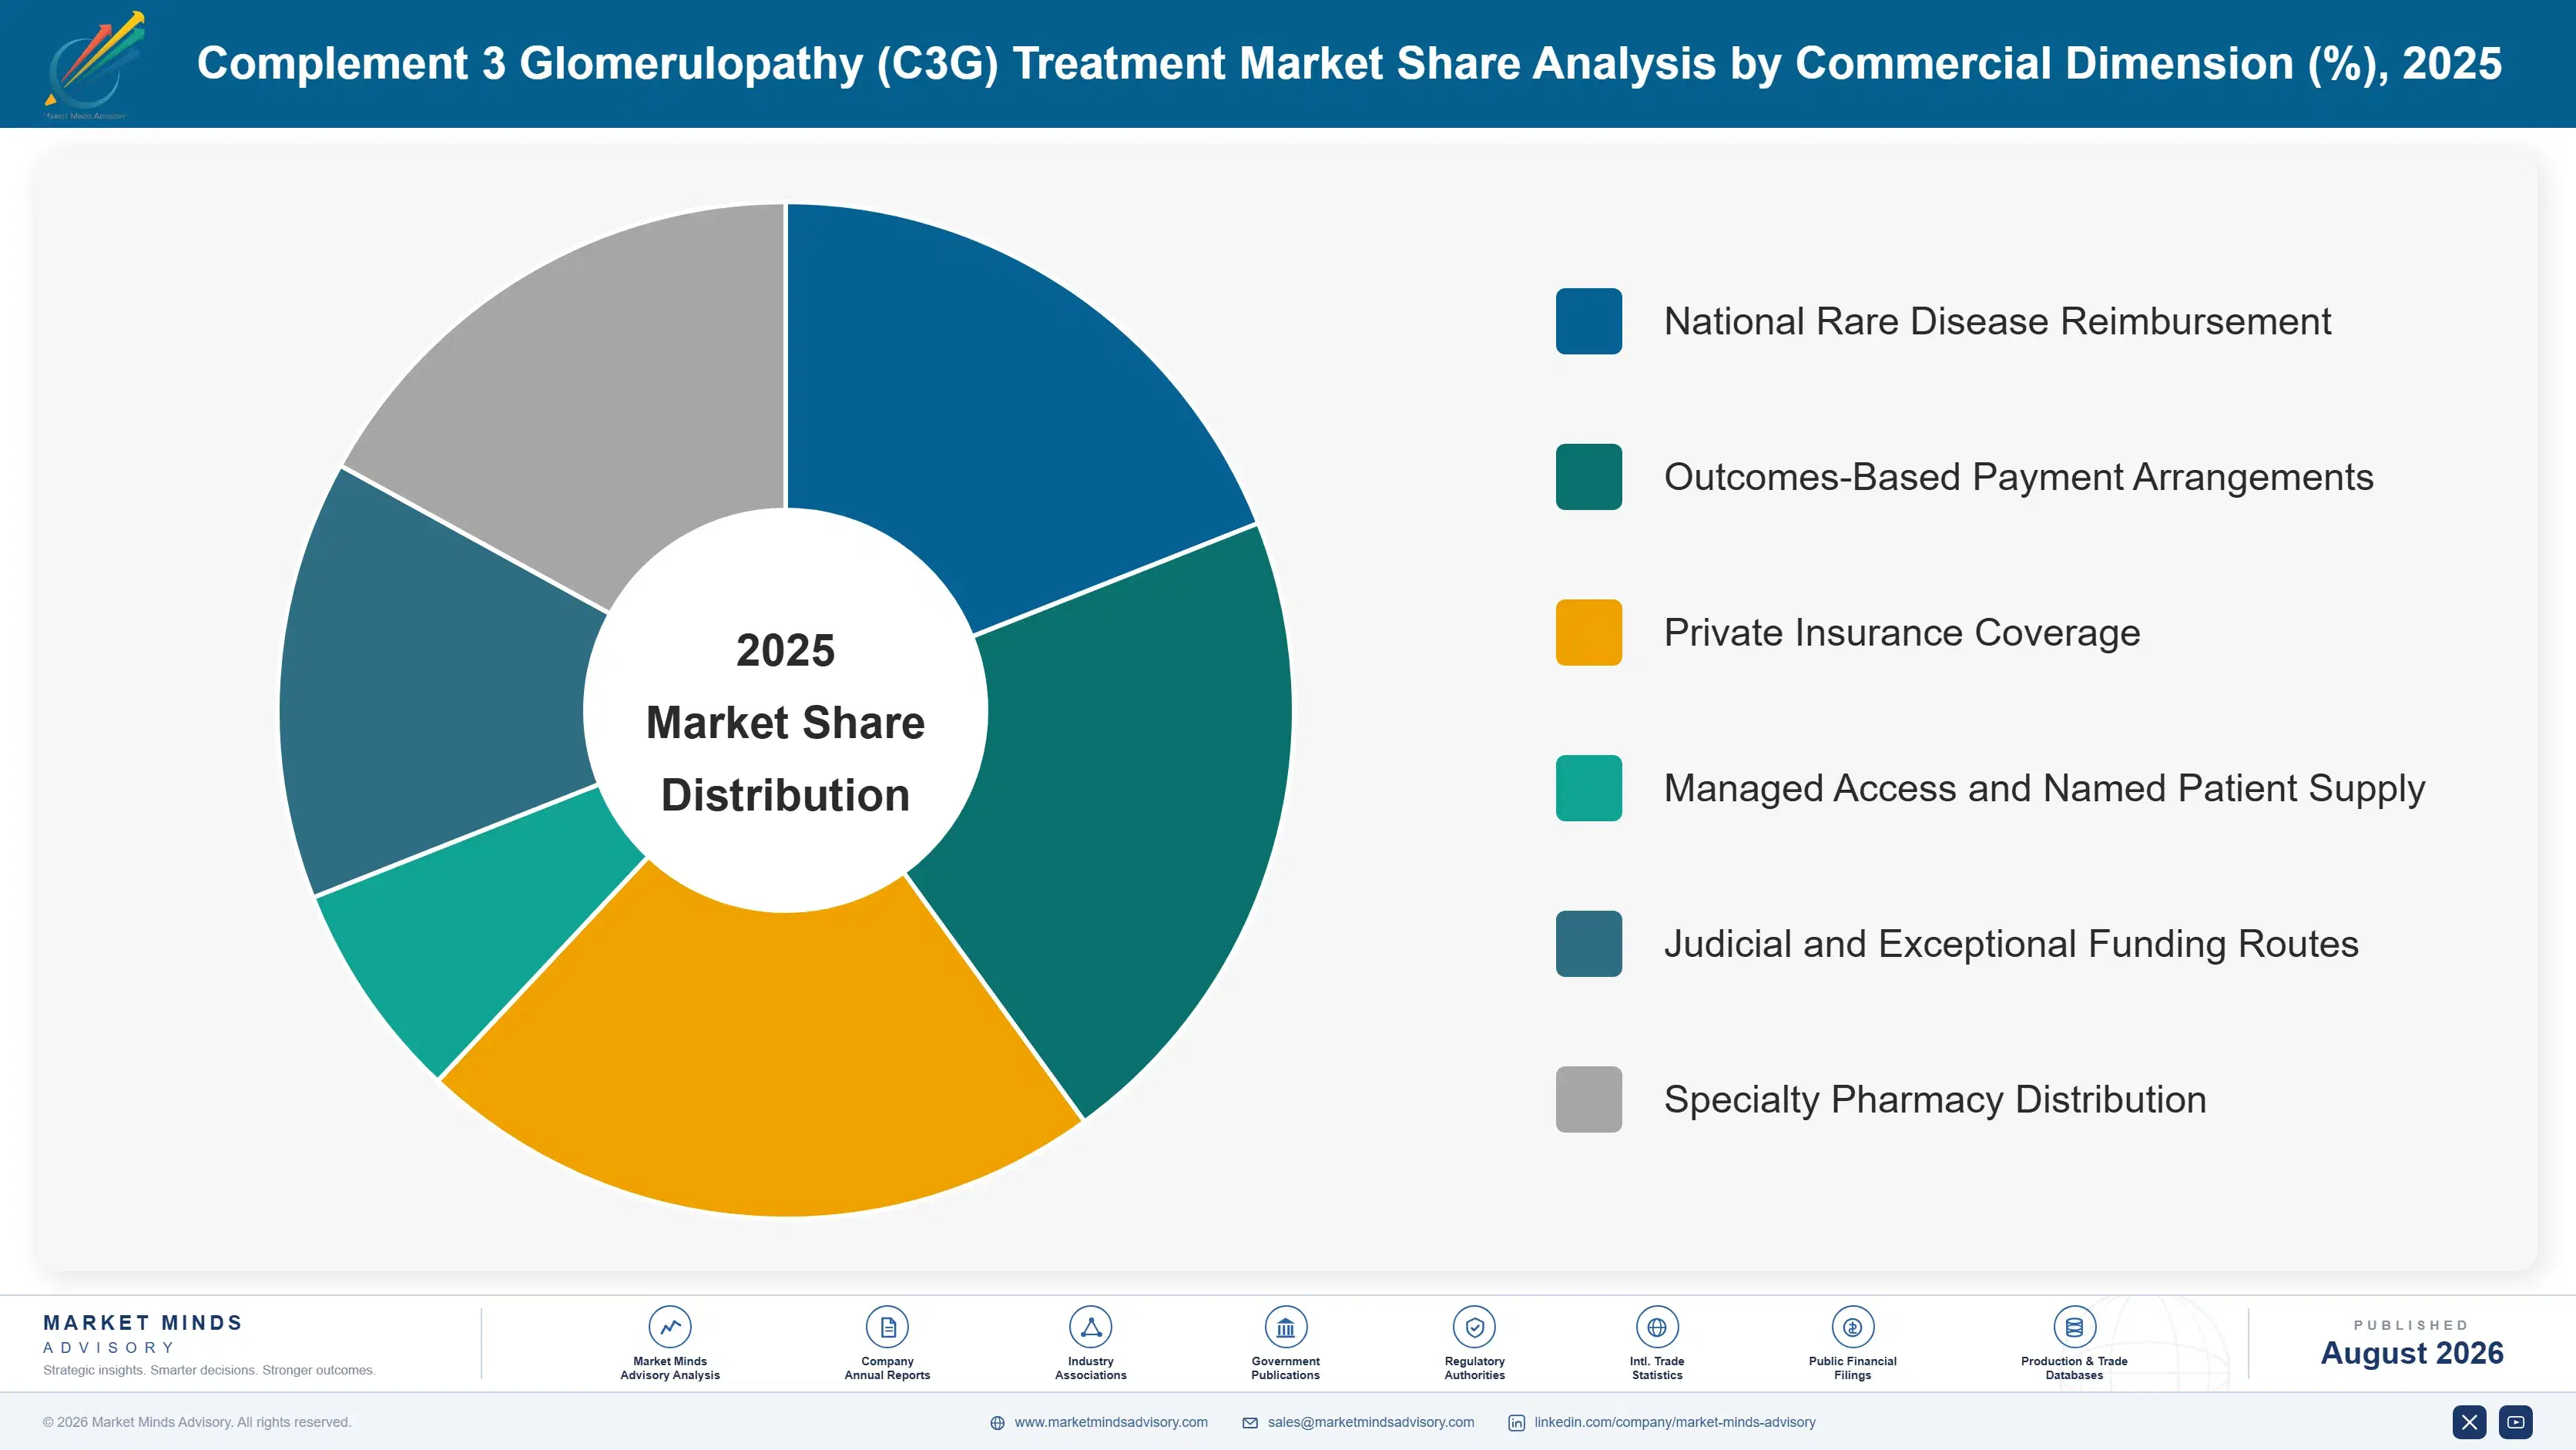
- National Rare Disease Reimbursement
- Outcomes-Based Payment Arrangements
- Private Insurance Coverage
- Managed Access and Named Patient Supply
- Judicial and Exceptional Funding Routes
- Specialty Pharmacy Distribution
By Region
- North America
- Western Europe
- East Asia
- South Asia and Pacific
- Latin America
- Middle East and Africa
- Eastern Europe
Scope, Methodology, and Coverage
Every figure in this report is reproducible from documented input assumptions. The scope below maps the historical period, the forecast horizon, the segmentation dimensions, and the countries covered, alongside the underlying primary and qualitative methodology.
Historical Period
2020 to 2025
Forecast Period
2026 to 2036
Base Year
2025 (USD billions; MMA Primary Research Dataset, August 2026)
Market Definition
This market comprises therapy for complement 3 glomerulopathy, encompassing both dense deposit disease and C3 glomerulonephritis, measured at manufacturer net revenue across national rare disease reimbursement, outcomes-based payment arrangements, private insurance coverage, managed access and named patient supply, judicial or exceptional funding routes, and specialty pharmacy distribution. Coverage spans complement factor B inhibitors administered orally, C3 inhibitors administered subcutaneously, investigational complement modulators including factor D, MASP-2 and complement factor H directed approaches where supplied under access programmes, supportive and immunosuppressive therapy delivered specifically for this indication including mycophenolate, corticosteroids and renin-angiotensin system blockade, and C5 inhibitors used off-label. Immunoglobulin A nephropathy, membranous nephropathy, lupus nephritis, atypical haemolytic uraemic syndrome and other complement-mediated kidney conditions, dialysis and kidney transplantation services themselves, kidney biopsy procedures and renal pathology services, complement genetic and biomarker testing, and antihypertensive therapy prescribed for general cardiovascular indications fall outside scope.
Quantitative Units
USD millions (manufacturer net revenue); diagnosed patients by market; treated patients on therapy; annual therapy cost per patient; diagnostic delay; transplant recurrence rate; treated share of diagnosed prevalence
Segmentation Dimensions
By Therapy Class; By End-Use Industry; By Commercial Dimension; By Region
Regions Covered
North America, Western Europe, East Asia, South Asia and Pacific, Latin America, Middle East and Africa, Eastern Europe
Countries Covered
United States, Canada, Germany, France, United Kingdom, Italy, Spain, Netherlands, Belgium, Sweden, Denmark, Switzerland, Japan, China, South Korea, Taiwan, Australia, India, Singapore, Brazil, Mexico, Argentina, Chile, Colombia, Saudi Arabia, United Arab Emirates, Israel, South Africa, Poland, Czechia, Hungary, Romania, Turkey, and additional markets relevant to rare kidney disease analysis
Key Companies Profiled
Novartis, Apellis Pharmaceuticals, Sobi, AstraZeneca, Roche, Otsuka Pharmaceutical, Vera Therapeutics, Q32 Bio, Omeros, BioCryst Pharmaceuticals, Kira Pharmaceuticals, Novelmed Therapeutics, Amgen, Alnylam Pharmaceuticals, Travere Therapeutics, Ionis Pharmaceuticals, Aurinia Pharmaceuticals, Calliditas Therapeutics, Zai Lab, Hansa Biopharma
Quantitative Methodology
Primary survey, n=3,800 respondents, Q4 2025, six countries; demand-side model with trade association cross-validation
Qualitative Methodology
47 expert interviews, Q4 2025; applied to validate demand model assumptions, identify emerging dynamics, and assess competitive positioning
Report Format
PDF and XLSX data workbook (Word format preview document)
Publisher
Market Minds Advisory
Report Code
MMA-2026-HLT-556
Published
August 2026
Contact
sales@marketmindsadvisory.com | www.marketmindsadvisory.com
Purchase the full Complement 3 Glomerulopathy (C3G) Treatment Market Report (2026 to 2036).
The full MMA report treats diagnosed prevalence rather than competitive share as the variable that determines this market's size, and traces where patients are lost between presentation and treatment. It sizes five therapy classes and seven regions to 2036, modelling diagnosed patients, treated patients, annual therapy cost, diagnostic delay, transplant recurrence and treated share of prevalence separately. Competitive assessment covers twenty participants on one consistent revenue basis. Cost exposure is traced through development, safety programmes and diagnostic support. Four commercial levers and a strategic verdict close the report, grounded in 47 expert interviews and a 3,800-respondent survey.
Five therapy classes sized separately through 2036
Diagnostic pathways reconstructed from presentation through biopsy to treatment
Pathology immunofluorescence practice benchmarked across covered markets
Twenty participants assessed on one consistent revenue basis
Transplant recurrence prophylaxis modelled as a defined treatment episode
Anonymised sponsor engagement with tested launch budget recommendations
Built For The People Who Decide
From boardroom strategy to bench-side execution, this report is read cover-to-cover by leaders shaping the next decade of their industry, turning demand scenarios, market dynamics and valuation benchmarks into decisions.
CXOs/ Presidents/ VPs/ Managers
M&A and Corporate Development
Strategy Teams and R&D Heads
Procurement and Product Directors
Regulatory and Compliance Leaders
Investor Relations and Equity Analysts