Market Minds Advisory
Competent Cells Market

Competent Cells Market: Transformation Efficiency, Strain Genotype and the Frozen Supply Chain That Governs Delivered Value

A frozen research consumable whose entire commercial value rests on transformation efficiency and strain genotype, sold into laboratories that could make a cruder version themselves for the price of a salt solution.

Lead Analyst

Alice Ballenger

Published

September 2026

Make Smarter Decisions with Customized Research Insights

Request a free sample report and evaluate market opportunities, growth trends, and competitive dynamics relevant to your business needs.

2025 MARKET VALUE$0.7BMarket Size 2025
2036 FORECAST VALUE$1.8BBase Case , 2026 to 2036
CAGR 2026 TO 20368.4 %Bull 9.6% / Bear 7.2%
INCREMENTAL OPPORTUNITY$1.0BNet 10- year value creation
EXPANSION MULTIPLE2.24x2036 value over 2026 base
Strategic Levers
M&A Pipeline
Regional Outlook
Country Rankings
Competitive Intelligence
Segmental Deep-dive
Call-Us : 91 93563 13602

Executive Snapshot and Market Trajectory

Competent cells look identical in every tube, and they are not. Transformation efficiency across the commercial catalogue spans four orders of magnitude, and buyers who select on price alone discover the difference only after a failed library. The tube tells you nothing. Efficiency, not appearance, is the product.
Specialty genotype strains are pulling ahead of everything else, compounding at 12.6% against a market at 8.4%, because methylation-deficient, recombination-deficient and large-insert cloning work cannot be done with a standard laboratory preparation. East Asia holds 30% of global consumption, carried by Chinese domestic suppliers and an academic research base whose molecular biology throughput now rivals any other region. Domestic supply removed the import cost barrier entirely.
Five suppliers hold 44% of the market, which is unusually fragmented for a life science consumable. Strain genotype rather than manufacturing scale is what separates them, and much of the catalogue carries institutional licence terms. Regional manufacturing has stayed the deciding advantage, and every entrant that tried shipping frozen cells across an ocean eventually learned exactly why that is. Regional manufacturing presence confers a great deal more than sheer scale ever does here.
Market Definition
The market covers commercially manufactured bacterial and non-bacterial cells prepared for DNA uptake and sold as a research consumable, spanning chemically competent, electrocompetent, expression strain, specialty genotype and yeast preparations. Cells prepared in-house by end-user laboratories are excluded, as are transfection reagents for mammalian cells, cloning kits sold without cells, and downstream plasmid purification consumables.
Base Year Value
$0.7B in 2025 (MMA Primary Research Dataset, August 2026)
Forecast Period
2026 to 2036, eleven discrete annual values
CAGR
8.4% base case. Bull 9.6%. Bear 7.2%.
Fastest Growth Segment
Specialty Genotype Competent Cells: 12.6% CAGR
Fastest Growth Country
India: 11.2% CAGR
Fastest Growth Region
South Asia and Pacific: 10.4% CAGR
Largest Region
East Asia: 30% of 2025 global value
Market Leaders
Thermo Fisher Scientific, New England Biolabs, Takara Bio, Agilent Technologies, Merck KGaA. Source: MMA Analysis based on company annual reports.
Primary Survey
n=3,800 procurement and R&D decision-makers, Q4 2025, six countries
Methodology
Demand-side build-up, cross-validated against public data, 47 expert interviews

Competent Cells Market Forecast Scenarios

competent-cells-market-size-forecast-scenario-1787307177267
The 2020 to 2025 period was distorted twice. Pandemic-era molecular biology demand pulled volume forward through 2021, then academic funding tightened across 2023 and 2024 and unit growth stalled while average selling prices held. The implied historical CAGR of 7.2% conceals that shape entirely, and no single year sat close to it. Averaging across it misleads badly.
The base case at 8.4% rests on three mechanisms. Synthetic biology and DNA foundry work consumes high-efficiency cells at industrial volume rather than bench volume. Specialty genotypes command premiums that standard preparations cannot, and their share of catalogue revenue keeps rising. And the share of transformations run on laboratory-prepared cells continues to fall as institutions price technician hours honestly against a purchased vial that simply works first time. Foundry demand alone reshaped the order book.
The bull case at 9.6% turns on antibody discovery library work, where a single campaign consumes cells at a scale no academic laboratory approaches. The bear case at 7.2% is a funding case: sustained pressure on National Institutes of Health and European academic budgets pushes laboratories back toward in-house calcium chloride preparation, which costs almost nothing in materials.

Why Efficiency and Genotype Decide Price in an Apparently Undifferentiated Consumable

Every microbiology graduate student learns to make competent cells with calcium chloride and ice. That preparation reaches perhaps ten million transformants per microgram on a good day, and it varies week to week with whoever ran it. The commercial market exists in the gap between that number and the ten billion a library construction strain delivers reproducibly, batch after batch, with a certificate. That gap is the whole business.
TOP FIVE CONCENTRATION44%Combined share held by the five largest global suppliers
TRANSFORMATION EFFICIENCY SPREAD10^6 to 10^10 cfu/ugRange separating routine subcloning grades from library construction grades
COLD CHAIN COST18% of delivered costDry ice freight and packaging as delivered cost share
IN-HOUSE PREPARATION SHARE31% of transformationsReactions still run on laboratory prepared cells rather than purchased
AVERAGE REORDER INTERVAL9 weeksTypical repurchase gap for an active molecular cloning laboratory
LICENSED GENOTYPE SHARE26% of catalogueCatalogue genotypes carrying third party or institutional licence terms
Pricing tracks that gap closely. A standard subcloning vial sells for a few dollars per reaction and competes hard on catalogue price. A specialty genotype strain, methylation-deficient for restriction cloning or engineered to tolerate a toxic insert, sells at several times that and rarely faces a straight price comparison, because no alternative preparation does the job. Nothing else in the catalogue reaches it.
The frozen supply chain shapes the competitive map more than most observers expect. Chemically competent cells die if they thaw in transit, dry ice shipment runs roughly 18% of delivered cost, and a single excursion writes off the consignment. That arithmetic favours regional manufacturing and has kept a genuinely global catalogue supplier from emerging. Several strong national suppliers persist against much larger international names for exactly this reason.
"The uncomfortable truth about this market is that its largest competitor is a graduate student with a bucket of ice. Every commercial vial has to justify itself against something a laboratory can make for almost nothing, which is why the growth has moved entirely to genotypes nobody can prepare on a bench."
Director, Life Science Tools and Research Consumables Practice · MMA Life Scienc

Market Trends

Synthetic Biology Foundries Buy at Industrial Rather Than Bench Scale

Automated DNA assembly foundries transformed the purchasing profile. A single antibody library campaign consumes more high-efficiency electrocompetent cells than a university department uses in a year, and the buyer specifies efficiency floors contractually rather than reading a catalogue. Foundry operators across the United States, United Kingdom and China now run standing supply agreements with volume commitments and batch reservation terms. That has forced suppliers to hold dedicated manufacturing slots and to certify lot-to-lot consistency far more tightly than academic sales ever demanded of them. Catalogue selling and contracted supply are now genuinely different businesses.
Market Impact: Biopharmaceutical accounts holding
Specialty Genotypes Move From Catalogue Curiosity to Revenue Core

Ten years ago the specialty section of a competent cell catalogue was a long tail nobody expected to sell. Methylation-deficient strains for restriction cloning, recombination-deficient strains for unstable repeats, and strains engineered to tolerate proteins that kill ordinary hosts now carry a disproportionate share of gross profit. They compound at 12.6% while standard chemical preparations manage 5.4%. Suppliers have responded by licensing academic strain collections aggressively, since the genotype rather than the preparation method is what the customer is actually buying. Preparation method has become the commodity, and the genotype carries the price.
Market Impact: In-house share down to 31%

Market Opportunities and Growth Drivers

Biopharmaceutical Discovery Pipelines Sustain Baseline Cloning Volume

Antibody and protein therapeutic discovery generates constant cloning work that does not respond to short-term budget cycles. Every candidate construct, every variant panel and every expression optimisation round terminates in a transformation, and the discovery organisations running them treat cell quality as a schedule risk rather than a cost line. Roughly 34% of commercial competent cell volume now goes to biopharmaceutical discovery and development, and those accounts reorder on a nine-week rhythm that holds through funding cycles which reliably flatten academic purchasing. Discovery timelines do not tolerate a repeat. Academic purchasing shows no such discipline.
Market Impact: Roughly 31% of transformations unpu

Laboratories Price Technician Time Against Cheap In-House Preparation

The in-house share of transformations has fallen from roughly half a decade ago to 31% today. Materials for a bench preparation cost almost nothing, but a technician spends the better part of two days on it and the result varies. Core facility managers running chargeback models see that labour directly, and institutional biosafety documentation for strain handling adds administrative time that a purchased vial with a certificate simply removes from the calculation entirely. Core facility purchasing has shifted decisively toward buying rather than preparing, and once a chargeback model prices those hours honestly the decision rarely reverses.
Market Impact: Cold chain at 18% of cost

Market Restraints and Challenges

Bench Preparation Remains a Permanent Free Substitute

No other research consumable competes against a version the customer can make for the cost of a salt solution. The root cause is that basic chemical competence is a simple, published, unpatentable procedure taught to every molecular biology student. For routine subcloning at ten million transformants per microgram the homemade product genuinely suffices, which caps pricing on the standard tier permanently. Suppliers mitigate by moving the argument onto reproducibility, documentation and efficiency grades no bench preparation reaches, rather than defending the low end on price. That reframing is the only defence available.
Market Impact: Foundry accounts reaching 19% of vo

Frozen Distribution Limits Reach and Writes Off Excursions

Chemically competent cells lose most of their efficiency after a single thaw, so the product ships on dry ice with a short delivery window. The root cause is biological rather than logistical: the calcium-treated membrane state that permits DNA uptake is inherently unstable above freezing. Delivered cost carries roughly 18% freight and packaging, and remote or customs-delayed destinations frequently receive dead product. Suppliers are pursuing lyophilised and ambient-stable formats, though none yet matches frozen efficiency at the high grades. Warm-climate field performance remains the open question. Laboratory results have not yet settled it.
Market Impact: Specialty genotypes compounding at
4 additional market trends, 3 additional growth drivers, and 2 additional restraints and challenges are covered in the full report. Contact sales@marketmindsadvisory.com to access the complete intelligence.

Segment CAGR and Growth Architecture

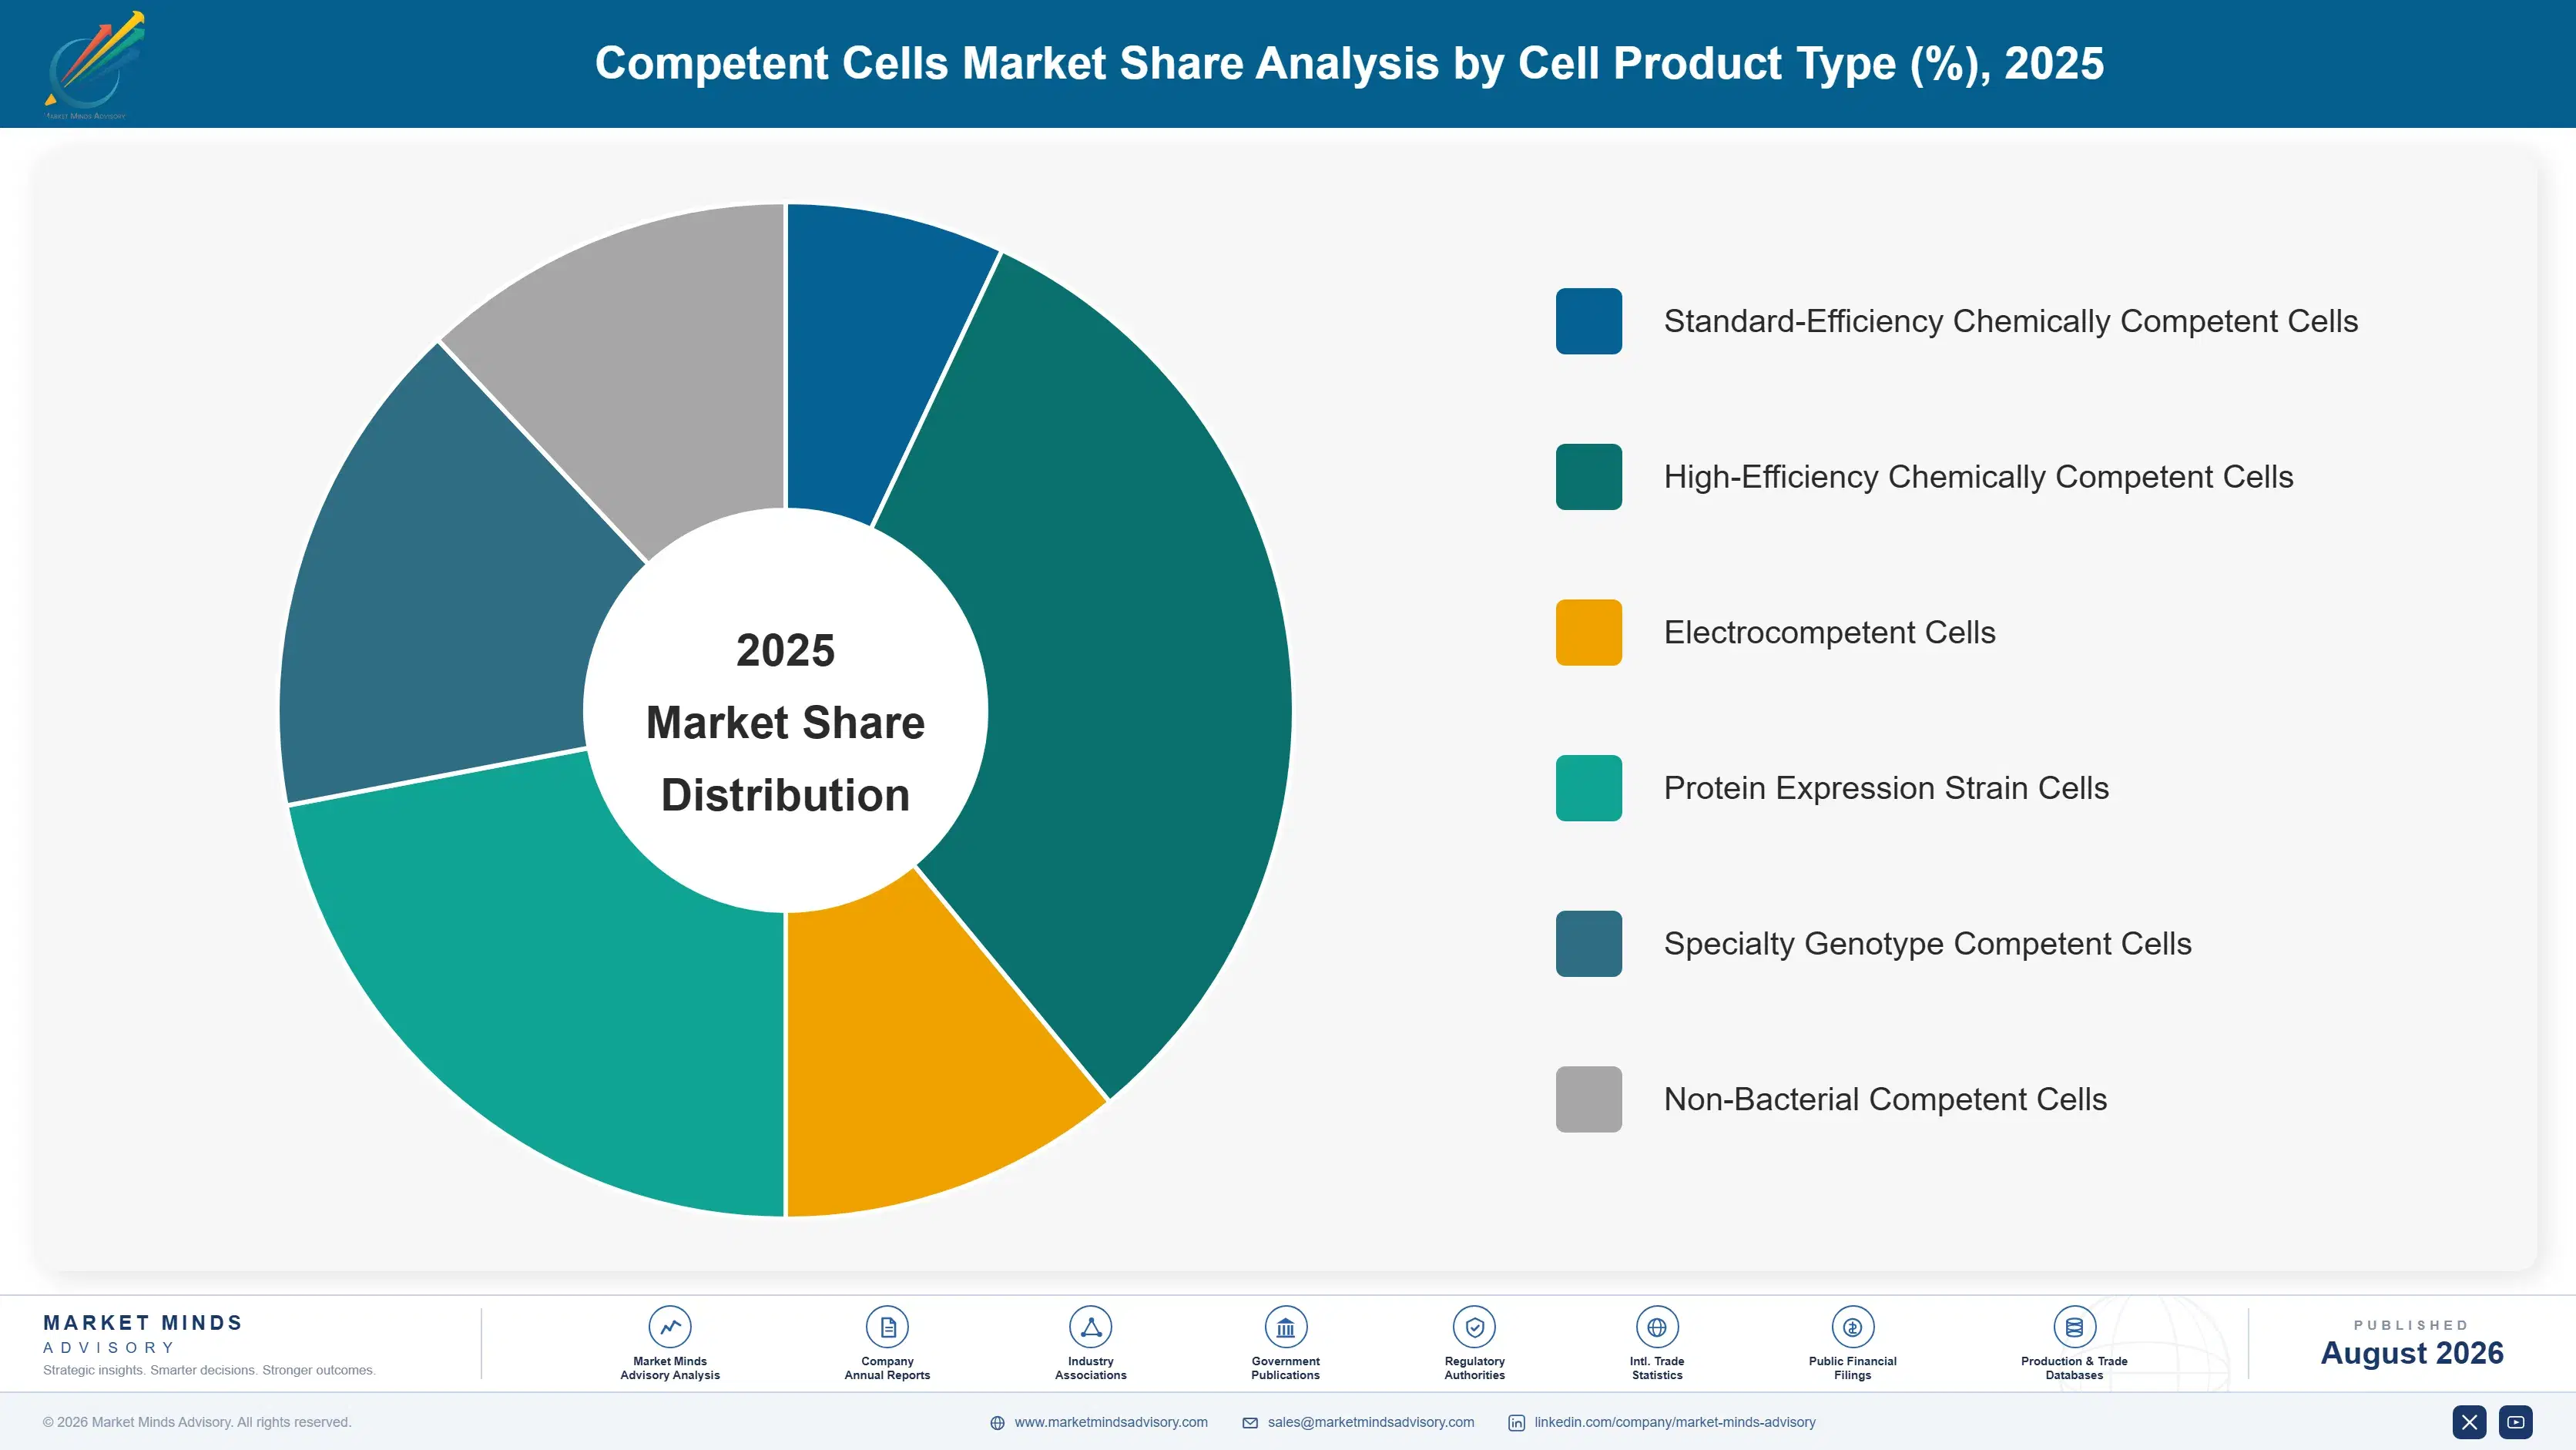
Segmentation follows cell product type, because that is the dimension on which laboratories actually select and on which price varies by an order of magnitude. Preparation chemistry and strain genotype together determine transformation efficiency, handling requirements and application fit, and every purchasing decision in this market resolves to that single choice. No other dimension explains the pricing.
competent-cells-market-market-share-analysis-1787307177796

Specialty Genotype Competent Cells

Growth here runs at 12.6%, exactly 1.50 times the market, and the reason is that these strains solve problems no preparation method can address. Methylation-deficient hosts allow restriction enzymes that would otherwise refuse to cut. Recombination-deficient hosts hold unstable repeats that ordinary strains delete overnight. Large-insert hosts carry bacterial artificial chromosomes intact. Strains engineered for toxic protein tolerance let a laboratory clone a construct that kills a standard host outright. Pricing sits well above the standard tier and faces no substitute, since the customer needs that specific genotype rather than a competent cell in general. Licensing academic strain collections has become the principal route to catalogue depth. Internal development rarely competes with it.
CAGR 12.6%

Non-Bacterial Competent Cells

Yeast and other non-bacterial preparations grow at 10.1%, well ahead of the market, on a much smaller base. Saccharomyces and Pichia strands of the catalogue serve synthetic biology assembly, where yeast homologous recombination stitches together constructs that bacterial cloning handles badly, and protein expression work where eukaryotic folding and glycosylation matter. Preparation and shipping are more demanding than bacterial equivalents and the shelf life is shorter still, which keeps supplier participation narrow. Metabolic engineering programmes building yeast production strains for flavours, fragrances and pharmaceutical intermediates have become the reliable volume driver, and those accounts buy repeatedly rather than once. Qualification into a production workflow is slow, and once granted it is almost never revisited on price grounds alone.
CAGR 10.1%
Full segment breakdown across 6 segments available in the complete report.

Regional Architecture and Country Demand Map

Consumption follows laboratory density and molecular biology throughput rather than population or manufacturing capacity. East Asia leads on sheer volume of academic and commercial cloning work, while North America holds the higher-value discovery accounts and pays materially more per reaction. Grade mix separates the two far more than volume does.

East Asia

East Asia holds 30% of global consumption, which reflects the number of laboratories running cloning work rather than what they pay per reaction. China alone operates more molecular biology benches than any other country, and a domestic supplier base including Vazyme, TransGen, Tsingke and Yeasen serves them at prices Western catalogues cannot approach. Those suppliers built genuine manufacturing depth during the pandemic diagnostics expansion and kept it. Japanese demand is narrower but higher in value, concentrated in pharmaceutical discovery and in Takara Bio's home market, where specialty genotype uptake is strong. Korean synthetic biology programmes add a growing high-efficiency electrocompetent requirement. The regional CAGR of 9.6% sits above the global rate because domestic supply removed the import cost barrier entirely.
Share: 30% | CAGR: 9.6% (2026 to 2036)

North America

North America accounts for 28% of the market and considerably more than that of gross profit, because the account mix skews toward biopharmaceutical discovery organisations that buy on efficiency specification rather than catalogue price. The Boston, San Francisco Bay and San Diego clusters concentrate antibody discovery work, and a single library campaign there consumes more high-efficiency electrocompetent cells than a mid-sized university department uses annually. Academic demand funded through National Institutes of Health grants provides the volume floor, though it flattened noticeably across 2023 and 2024. Canadian demand is modest and concentrated in Toronto and Vancouver. Growth of 7.6% reflects a mature installed laboratory base where the remaining upside comes from grade mix rather than from new benches.
Share: 28% | CAGR: 7.6% (2026 to 2036)
Regional intelligence for 5 additional markets available in the complete report: Western Europe, South Asia and Pacific, Latin America, Middle East and Africa, Eastern Europe. Contact sales@marketmindsadvisory.com.
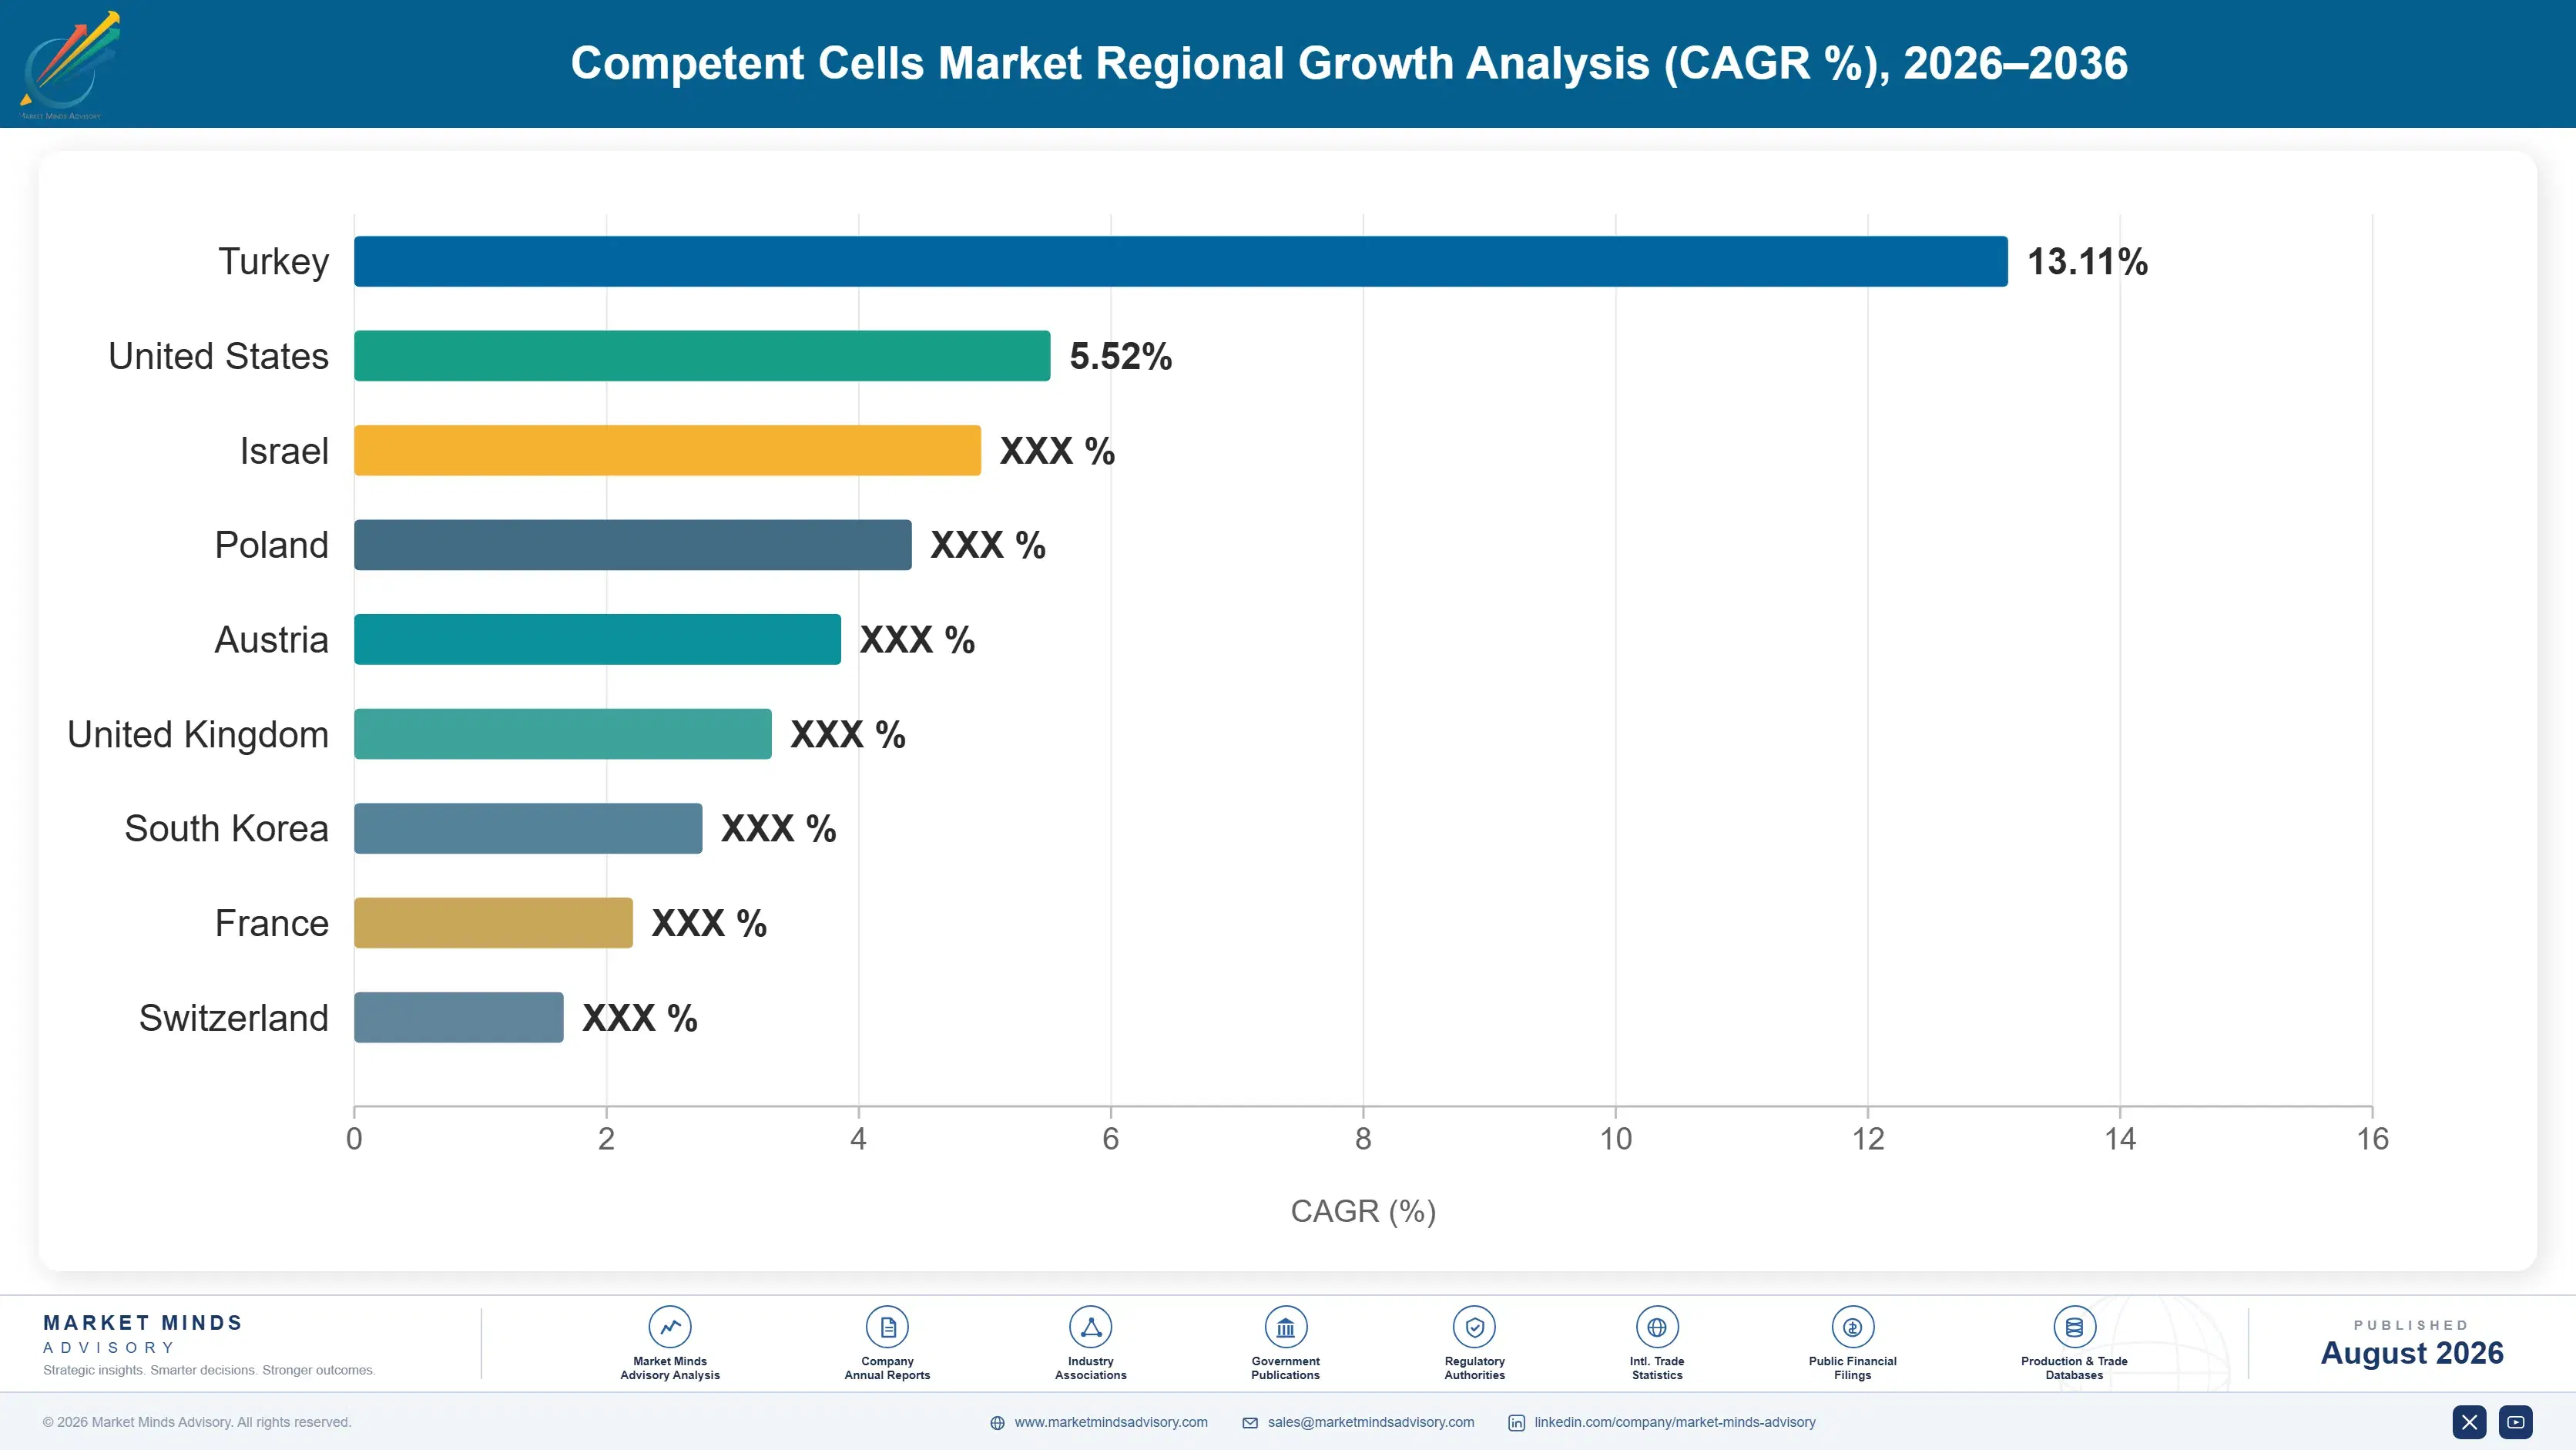
competent-cells-market-country-cagr-analysis-1787307178314

Where Margin Actually Sits in This Catalogue

The commercial problem in competent cells is not manufacturing, which is well understood and cheap at scale. It is finding the positions where a laboratory has no bench alternative and no straight price comparison to make. Four such positions carry most of the available margin, and all four turn on genotype or specification rather than volume.

Build Catalogue Depth Through Academic Strain Licensing

The genotype is the product, and most of the useful genotypes originated in academic laboratories rather than commercial ones. Suppliers that have licensed strain collections systematically hold catalogue positions competitors cannot replicate without negotiating the same agreements. Roughly 26% of a typical commercial catalogue now carries third-party or institutional licence terms, and those entries carry gross margins some 18 to 24 points above standard chemical preparations. Licensing costs are modest against that spread. The discipline required is scouting: identifying which published strain solves a cloning problem a customer base repeatedly encounters, then securing it before a competitor does.
Market Impact: Licensed genotypes carrying 18 to 2

Certify Lot Consistency for Foundry Supply Agreements

Automated DNA foundries buy differently from academic laboratories. They specify an efficiency floor contractually, reserve manufacturing batches, and treat a failed lot as a schedule event rather than an inconvenience. Suppliers able to certify lot-to-lot consistency to that standard win multi-year agreements that now represent roughly 19% of high-efficiency volume and grow considerably faster than catalogue sales. The investment sits in quality systems and batch reservation capacity rather than in new science. The reward is order visibility that a catalogue business never provides, and pricing negotiated on reliability rather than on unit cost.
Market Impact: Agreements now covering 19% of the

Solve Ambient Distribution for Underserved Geographies

Cold chain runs roughly 18% of delivered cost and closes off geographies entirely. Latin America, most of Africa and much of South Asia receive compromised shipments often enough that laboratories default to bench preparation regardless of price. A lyophilised or ambient-stable format that holds even moderate efficiency would open those markets rather than merely serve them more cheaply. Nobody has yet matched frozen performance at the high grades, but standard subcloning grades are within reach, and that is precisely the tier where the geographic gap is widest and the substitute is free.
Market Impact: Removing an 18% freight cost across

Serve Yeast and Metabolic Engineering Programmes Directly

Non-bacterial preparations grow at 10.1% and few suppliers participate seriously, because yeast competent cells are harder to make, harder to ship and shorter-lived. That difficulty is the opportunity. Metabolic engineering programmes building production strains for flavours, fragrances and pharmaceutical intermediates buy repeatedly across long development cycles, and they value supply reliability far above unit price. Establishing a credible yeast catalogue takes real process development work, but the resulting account relationships run for years and face almost no competitive pressure on price once qualified into a workflow. Few competitors are willing to attempt it.
Market Impact: Yeast preparations compounding at 1

Who Controls the Margin Pool

Five suppliers hold 44% of the market measured on reagent revenue, a basis held consistently throughout this section. That is fragmented for a life science consumable, and the reason is that manufacturing scale confers little advantage. Thermo Fisher and New England Biolabs lead, though the gap to Takara Bio and Agilent is narrower than in most reagent categories. Genotype depth rather than plant size decides position here.
Competition runs on three dimensions. Catalogue genotype depth decides which cloning problems a supplier can address at all. Certified transformation efficiency decides whether foundry and discovery accounts will qualify a vial into a validated workflow. And regional manufacturing presence decides who can deliver a frozen product intact, which is why several strong national suppliers persist against global names.

Chinese suppliers are the pressure point. Vazyme, TransGen, Tsingke and Yeasen built manufacturing depth during the diagnostics expansion and now hold their domestic market decisively. Their export ambitions face the same cold chain arithmetic that constrains everyone. Rankings will shift where any supplier solves ambient distribution or secures exclusive rights to a genotype that a major cloning workflow comes to require. Neither route is easy.
competent-cells-market-company-positioning-matrix-1787307178836

Competitive Moat and Risk Dimensions

THERMO FISHER SCIENTIFIC

Moat: Catalogue breadth and workflow

The Invitrogen competent cell range sits inside a molecular biology catalogue that already supplies the enzymes, purification kits and instruments around it. Laboratories qualify a supplier once and reorder across the whole workflow, which makes the competent cell line difficult to displace on its own merits. Distribution reach and consolidated institutional contracts reinforce that position considerably.
THERMO FISHER SCIENTIFIC

Risk: Premium pricing versus substitutes

Standard-grade positions face two substitutes at once: a bench preparation that costs almost nothing, and Chinese suppliers pricing well below Western catalogues. Neither threatens the specialty tier, but both erode the volume base that carries manufacturing overhead. Academic procurement running through competitive tender exposes precisely the grades where that price gap is most visible to buyers.
NEW ENGLAND BIOLABS

Moat: Strain genotype scientific credibility

New England Biolabs holds unusual standing with molecular biologists, built through decades of enzyme work and a strain catalogue that engineers rather than merely lists genotypes. Researchers specify their strains by name in published methods, which compounds into reorder demand no marketing spend replicates. Employee ownership permits long development horizons on genotypes that take years to justify commercially.
NEW ENGLAND BIOLABS

Risk: Narrow geographic manufacturing footprint

Manufacturing concentration means frozen distribution into Asia, Latin America and Africa runs on long routes with real excursion risk. Regional suppliers deliver intact product faster and cheaper in exactly the geographies growing fastest. Building distributed cold chain manufacturing is expensive relative to the incremental volume, which leaves a genuine gap in the highest-growth regions for competitors to occupy.

Players Tracked

Prominent Players

Thermo Fisher Scientific
New England Biolabs
Takara Bio
Agilent Technologies
Merck KGaA

Other Key Players

Promega Corporation
Bio-Rad Laboratories
LGC Biosearch Technologies
QIAGEN
Zymo Research
GenScript Biotech
Vazyme Biotech
TransGen Biotech
Tsingke Biotechnology
Yeasen Biotechnology
Sangon Biotech
Meridian Bioscience
Intact Genomics
Delphi Genetics
Toyobo

Recent Developments

MARCH 2025

Foundry supply agreements extend batch reservation terms

Several automated DNA assembly operators moved from catalogue purchasing to multi-year supply agreements carrying contractual efficiency floors and reserved manufacturing batches. These were commercial supply agreements rather than any equity or joint venture arrangement, and they changed how high-efficiency capacity gets allocated across the year.
Signal: High-efficiency manufacturing capacity is
AUGUST 2025

Chinese suppliers consolidate domestic molecular biology reagent share

Domestic Chinese reagent manufacturers extended their competent cell positions against imported catalogues, using capacity built during the diagnostics expansion. This was organic share gain rather than acquisition, reflecting delivered cost advantage on a frozen product more than technical differentiation. Export ambitions face the same constraint in reverse.
Signal: Cold chain economics rather than product p
NOVEMBER 2025

Ambient-stable formats reach standard subcloning grades

Lyophilised and ambient-stable competent cell preparations reached efficiency levels adequate for routine subcloning, though still well short of library construction grades. Development work continues across several suppliers independently. Field performance in warm-climate distribution remains the open question rather than laboratory bench results. Several suppliers are pursuing the format independently.
Signal: The geographies closed off by frozen distr

What Costs Money in a Frozen Vial

Raw materials are almost irrelevant here. Growth media, salts and glycerol together account for under 8% of cost of goods, and they source from ordinary industrial chemical supply with no meaningful concentration risk. Cold chain freight and packaging run roughly 18%, dry ice and validated insulated shippers sourced regionally. Quality control and release testing carry another 21%, and skilled labour dominates the remainder.
The 2021 to 2022 dry ice shortage demonstrated the exposure plainly. Carbon dioxide supply tightened as ethanol and ammonia production disruptions cut the by-product stream that feeds it, and United States Energy Information Administration data on the industrial gas and refining disruptions of that period tracks the underlying cause. Competent cell shipments were delayed or rerouted across several weeks, and suppliers reported shipment write-offs from thaw excursions in company disclosures covering that period.

Exposure varies sharply by player type. A supplier with regional manufacturing near its customers ships short distances and absorbs freight volatility easily. One manufacturing from a single site into three continents carries both higher baseline freight and far greater excursion risk, and cannot pass either through because the customer compares delivered price against a bench preparation costing nothing.
competent-cells-market-cost-volatility-analysis-1787307179030

Regional manufacturing to shorten frozen distribution routes

Establishing production close to major consuming clusters cuts both freight cost and excursion risk at once. The capital requirement is modest by life science standards, since competent cell manufacturing needs fermentation and cold storage rather than sterile fill capacity. The barrier is quality system replication across sites, which takes longer than the construction itself does.

Ambient-stable formats to remove cold chain dependence entirely

Lyophilised and glass-state preparations eliminate dry ice, insulated shippers and delivery window constraints together. Efficiency currently reaches routine subcloning grades but not library construction grades, so the format addresses the volume tier rather than the premium one. That is nonetheless where the geographic gap and the free substitute both bite hardest on delivered economics.

Contracted dry ice supply with alternative packaging validated

Suppliers that validated phase-change materials and vacuum-insulated shippers alongside dry ice moved shipments across during the shortage without pausing. Contracting carbon dioxide supply annually rather than buying spot removes most of the price exposure. Validating a second packaging configuration costs little and takes months, which is why doing it before a shortage matters. Shortages arrive without warning.

Portfolio Architecture for Margin Defence

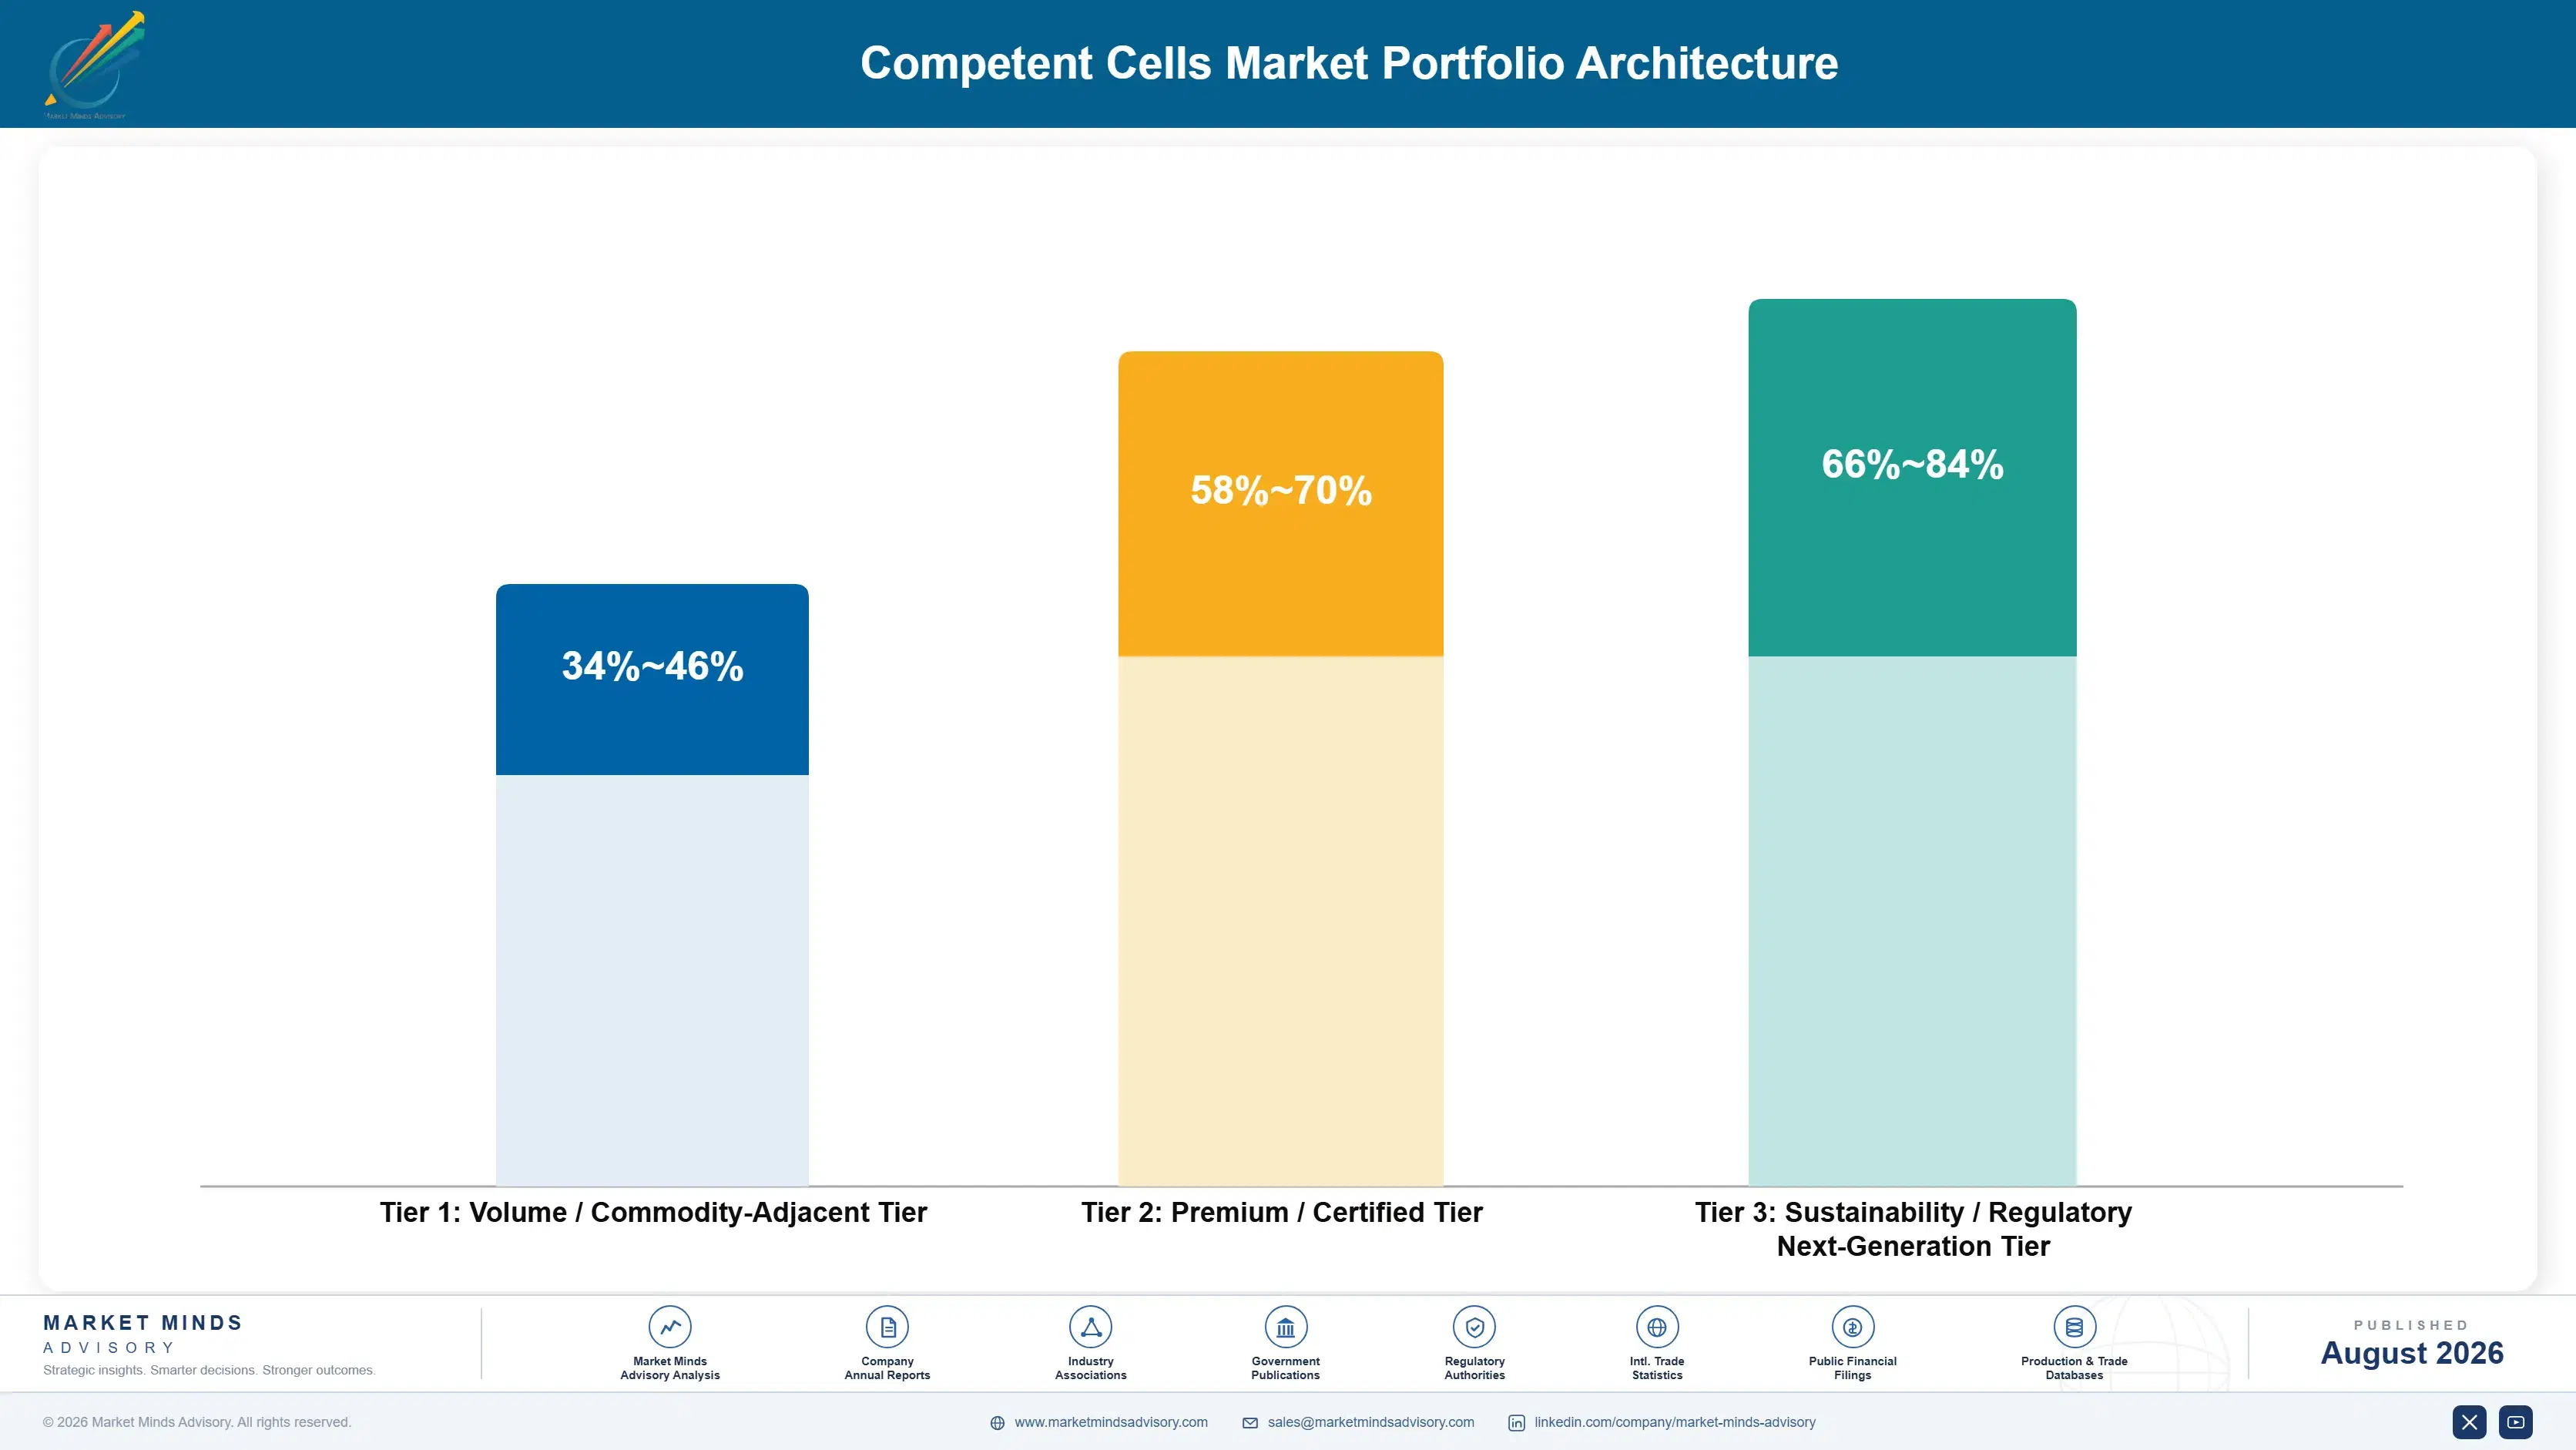
The portfolio splits cleanly by whether a laboratory has an alternative. Standard chemical preparations compete against a free bench substitute and against aggressive regional pricing, and margins reflect that reality. Certified high-efficiency and expression strain grades sell on documented performance into workflows that will not risk a failed run. Specialty genotypes and non-bacterial preparations face no substitute at all, and price accordingly. Substitutability explains the entire margin la
The tension is that volume grades carry the manufacturing overhead. Fermentation capacity, quality systems and cold storage are largely fixed, and a supplier that abandons the standard tier to chase specialty margin discovers its unit costs on everything else rise. The suppliers holding position best run standard grades close to breakeven deliberately and treat them as capacity utilisation rather than as a profit centre in their own right. Abandoning it looks attractive and rarely is.

High-value pools concentrate where genotype scarcity meets a workflow that cannot tolerate failure. Antibody library construction, toxic protein expression, large-insert cloning and yeast assembly all sit there. Each rewards catalogue depth over manufacturing scale. Each is small in volume and disproportionate in the profit it returns.

Volume / Commodity-Adjacent Tier

Standard-efficiency chemically competent cells for routine subcloning, sold on catalogue price against a free bench preparation and against regional suppliers pricing well below Western catalogues. Carries the fixed manufacturing overhead.
Gross Margin: 34-46%

Premium / Certified Tier

High-efficiency chemical and electrocompetent grades plus expression strains, sold on certified transformation efficiency into discovery and foundry workflows that treat a failed lot as a schedule event rather than a cost.
Gross Margin: 58-70%

Sustainability / Regulatory / Next-Generation Tier

Specialty genotypes, non-bacterial preparations and ambient-stable formats. Genotype scarcity removes price comparison entirely, and the wide margin range reflects licensing terms varying considerably by strain origin. Volumes are small and the pricing power is considerable.
Gross Margin: 66-84%
competent-cells-market-portfolio-architecture-1787307179528

High-value Sub-segments and Strategic Watch-out

Specialty Genotype Competent Cells

Compounding at 12.6% with no substitute available at any price, since the customer needs one specific genotype rather than a competent cell in general. Catalogue depth here comes through licensing academic strain collections rather than through internal development work. Scouting the published literature is the discipline that matters.
Gross Margin: 70-84%

High-Efficiency Electrocompetent Cells

Growing at 9.0% and carrying the foundry and antibody library accounts that buy on contracted efficiency floors. Manufacturing consistency rather than peak efficiency decides who qualifies, and qualification once granted is rarely revisited by the customer. That makes early qualification unusually valuable to hold. Displacement is rare.
Gross Margin: 60-72%

Standard Chemically Competent Cells

The volume core at 5.4%, competing against a bench preparation costing almost nothing and against regional suppliers with far shorter freight routes. Run deliberately for capacity utilisation rather than for margin. Treating it as a profit centre in its own right is the common error.
Gross Margin: 34-46%

Ambient-Stable Preparations

The watch-out. Efficiency now reaches routine subcloning grades but not library construction, so it threatens the volume tier first while opening geographies that frozen distribution closed off. Whoever solves it properly resets regional competitive positions entirely. It is the one development that could reorder regional share within a single decade.
Gross Margin: 48-66%

How Laboratories Actually Reorder

This is annuity revenue in all but name. An active cloning laboratory reorders on roughly a nine-week rhythm, and the vial sits inside a validated workflow that nobody wants to revalidate. Switching suppliers means re-establishing that a new strain performs identically on constructs the laboratory already knows, and that verification work costs more in technician time than any plausible price saving returns over a year of purchasing.
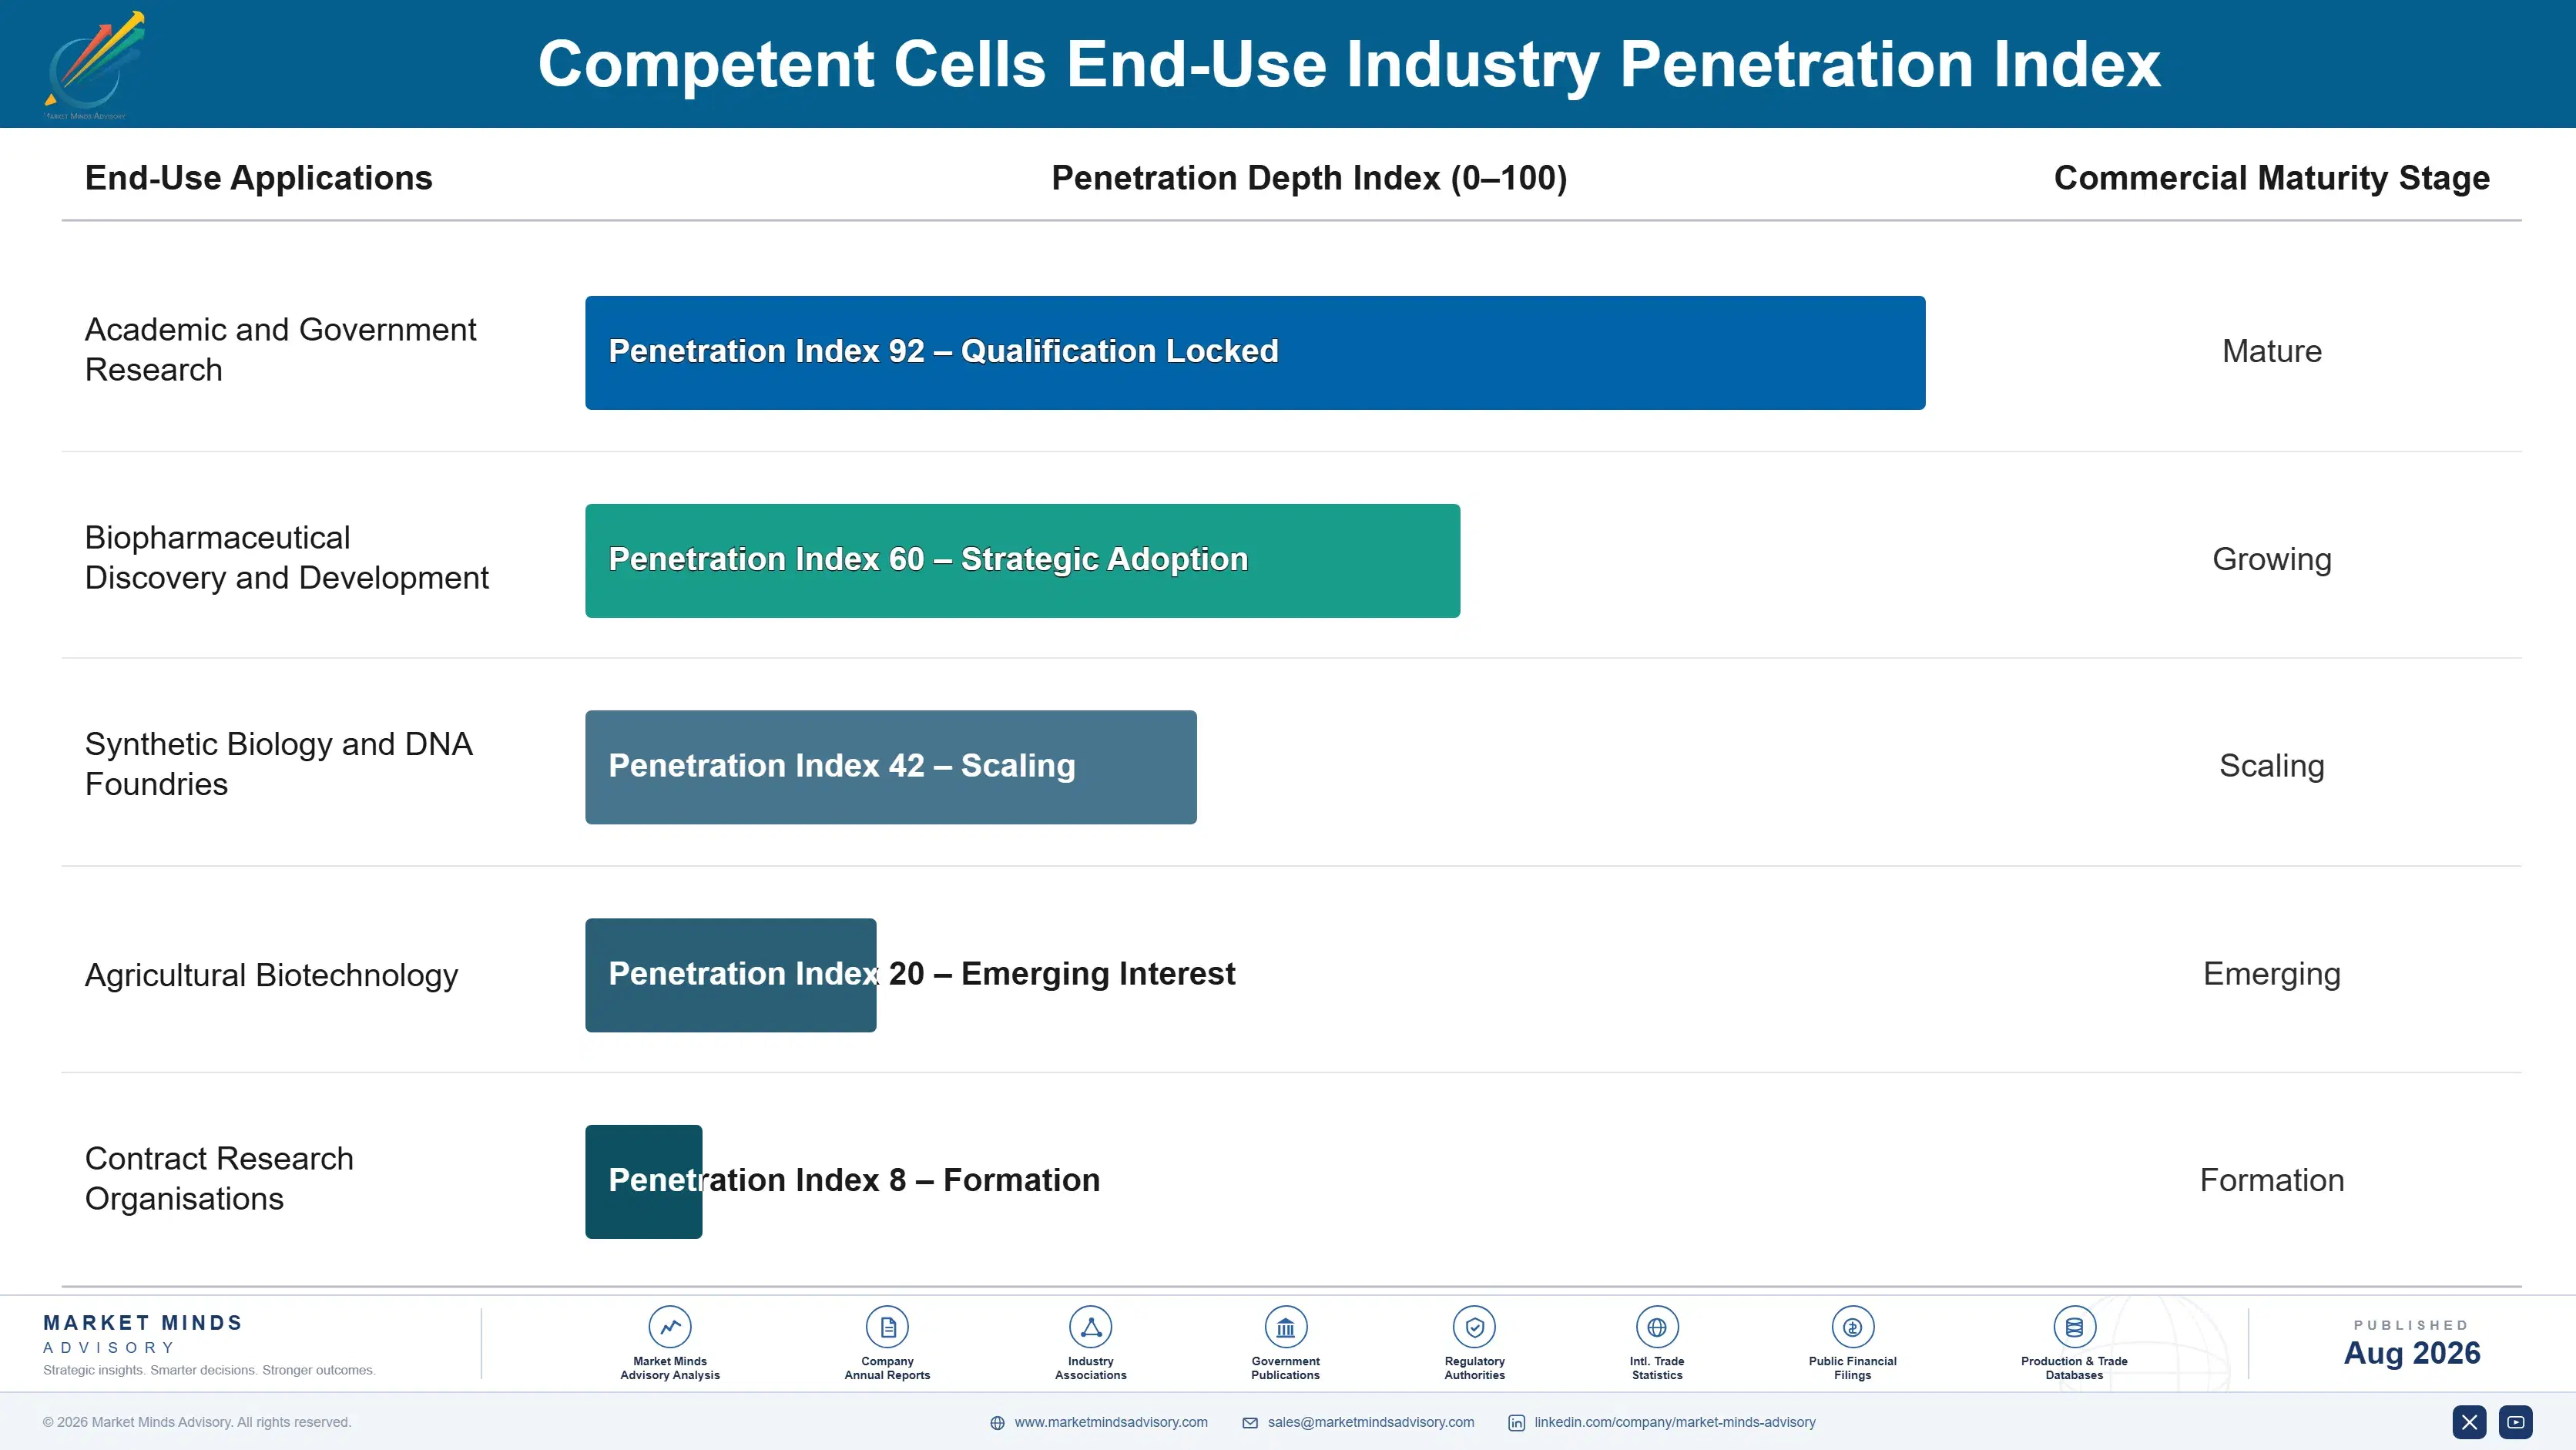
Adoption depth varies enormously by vertical. Biopharmaceutical discovery buys the deepest, at 34% of volume, specifying efficiency contractually and treating quality as schedule risk. Synthetic biology foundries buy at industrial scale on reserved batches. Academic laboratories buy shallowly and substitute freely toward bench preparation when budgets tighten. Agricultural biotechnology sits between the two, buying steadily on trait development cycles that run to their own timetable regardless of quarterly research funding conditions.

The buyer profile has shifted. Purchasing decisions used to sit with the principal investigator who cared about the strain genotype. Increasingly they sit with core facility managers and procurement functions running chargeback models, who care about delivered cost per successful transformation. That group buys more purchased cells, not fewer, because they price technician hours honestly.
competent-cells-market-end-use-penetration-index-1787307180016

Where the Money Is Made

These are among the four positions where our research anticipates prominent divergence between winners and laggards over the coming forecast period. Each is grounded in the demand model, the regulatory perimeter, and the announced capacity pipeline.
01 / STRAIN LICENSING DISCIPLINE

The genotype is the product, and most originate outside industry

Roughly 26% of a commercial catalogue now carries third-party or institutional licence terms, and those entries run 18 to 24 gross margin points above standard preparations. The strains that genuinely matter were engineered in academic laboratories to solve one specific cloning problem apiece, then published openly for anyone to read and license. Suppliers that scout the published literature systematically and continuously and secure licences before competitors do build catalogue positions that no amount of manufacturing investment can replicate at any scale whatsoever.
02 / COLD CHAIN POSITIONING

Frozen distribution decides regional share more than product quality

Freight and packaging together run roughly 18% of delivered cost on this product, and a single thaw excursion in transit writes off the entire consignment. Regional manufacturers deliver intact product cheaply and quickly, while single-site suppliers carry both a higher baseline freight cost and real excursion risk into precisely those geographies which happen to be growing fastest of all. That arithmetic rather than any technical or scientific shortfall explains why Chinese domestic suppliers hold their home market so firmly against far larger international competitors.
03 / FOUNDRY ACCOUNT CERTIFICATION

Contracted efficiency floors are replacing catalogue purchasing at the top

Automated DNA assembly operators now take roughly 19% of high-efficiency volume on multi-year agreements with reserved manufacturing batches and contractual specification floors. These buyers treat a failed lot as a schedule event rather than an inconvenience, and they pay for demonstrated reliability rather than negotiating hard on the unit cost of a vial. Winning that business requires quality system investment rather than any new science at all, and it delivers forward order visibility that a catalogue business simply never provides.
04 / BENCH SUBSTITUTION DEFENCE

Never defend the standard tier on price against a free alternative

Around 31% of transformations still run on cells a laboratory prepared itself for the cost of a salt solution, and that preparation procedure is published, simple, unpatentable and taught to every molecular biology student. No pricing strategy anywhere defeats a genuinely free substitute at the routine subcloning grade, and attempting it simply destroys the margin. The only winning argument moves the discussion onto reproducibility, release documentation and efficiency grades that no bench preparation reaches, which is exactly where the specialty tier compounds at 12.6%.

Engagement Snapshot From the Field

A live engagement with an industry participant carrying material or product regulatory and market exposure ahead of a defining policy shift, showing how our research translates into a defensible multi-year portfolio strategy.
MARKET MINDS ADVISORY · CLIENT ENGAGEMENT SUMMARY
Competent Cells Producer Strategic Portfolio Review and Transition Roadmap 2026·Investment Scenario on Competent Cells Exposure Evaluation 2025-26
CLIENT PROFILE
A mid-sized European reagent manufacturer with roughly EUR 140 million in revenue (client-reported, unverified by MMA) across enzymes, purification kits and a competent cell range that had grown by accretion rather than by design. The competent cell line contributed about 11% of revenue (client-reported, unverified by MMA) and materially less than that of gross profit, concentrated almost entirely in standard chemical grades sold through European academic distribution.
STRATEGIC CHALLENGE
Standard-grade volume was being taken on price by regional competitors while academic tender pricing compressed further each cycle. Management believed the answer was manufacturing efficiency and had scoped a capacity investment on that basis. The competing view inside the business held that the catalogue itself was the problem, and that no unit cost improvement would fix a range with no defensible positions in it.
MMA APPROACH
MMA mapped the client's catalogue genotype by genotype against the four largest competitors, then ran a purchasing analysis across 47 expert interviews (Q4 2025) covering how discovery and foundry accounts actually select suppliers. Delivered cost modelling separated freight and excursion write-offs from manufacturing cost, which had been reported together and had distorted the investment case considerably.
KEY FINDINGS
  1. The client's catalogue held no specialty genotype positions competitors lacked, meaning every listed product faced either a direct equivalent or a free bench preparation as substitute.
  2. Excursion write-offs on long-route shipments accounted for a larger share of margin loss than manufacturing inefficiency did, and had been absorbed into freight cost without separate tracking.
  3. Foundry and discovery accounts in the client's own region were buying from competitors purely because the client held no certified efficiency floor documentation to qualify against.
  4. Three published academic strains solving problems the client's customers repeatedly reported were unlicensed by anyone, and available on modest institutional terms. Two were secured within six months.
CLIENT PROFILE
A mid-sized European reagent manufacturer with roughly EUR 140 million in revenue (client-reported, unverified by MMA) across enzymes, purification kits and a competent cell range that had grown by accretion rather than by design. The competent cell line contributed about 11% of revenue (client-reported, unverified by MMA) and materially less than that of gross profit, concentrated almost entirely in standard chemical grades sold through European academic distribution.
STRATEGIC CHALLENGE
Standard-grade volume was being taken on price by regional competitors while academic tender pricing compressed further each cycle. Management believed the answer was manufacturing efficiency and had scoped a capacity investment on that basis. The competing view inside the business held that the catalogue itself was the problem, and that no unit cost improvement would fix a range with no defensible positions in it.
MMA APPROACH
MMA mapped the client's catalogue genotype by genotype against the four largest competitors, then ran a purchasing analysis across 47 expert interviews (Q4 2025) covering how discovery and foundry accounts actually select suppliers. Delivered cost modelling separated freight and excursion write-offs from manufacturing cost, which had been reported together and had distorted the investment case considerably.
KEY FINDINGS
  1. The client's catalogue held no specialty genotype positions competitors lacked, meaning every listed product faced either a direct equivalent or a free bench preparation as substitute.
  2. Excursion write-offs on long-route shipments accounted for a larger share of margin loss than manufacturing inefficiency did, and had been absorbed into freight cost without separate tracking.
  3. Foundry and discovery accounts in the client's own region were buying from competitors purely because the client held no certified efficiency floor documentation to qualify against.
  4. Three published academic strains solving problems the client's customers repeatedly reported were unlicensed by anyone, and available on modest institutional terms. Two were secured within six months.
RECOMMENDED STRATEGY
Phase 1: Phase 1 (months 1 to 6): Secure licences on the three unclaimed academic strains and establish release documentation adequate for foundry account qualification. Phase 2: Phase 2 (months 6 to 15): Redirect the planned capacity spend into quality systems and regional cold storage rather than fermentation throughput expansion. Phase 3: Phase 3 (months 15 to 30): Reposition standard grades explicitly as capacity utilisation, competing on delivered reliability rather than on catalogue price against regional suppliers.
OUTCOME
The capacity investment was cancelled and roughly EUR 9 million redirected (client-reported, unverified by MMA). Two of the three strain licences were secured within the first phase, and the client qualified with its first foundry account eleven months in. Competent cell gross margin improved by approximately six points (client-reported, unverified by MMA) on essentially flat volume.

Frequently Asked Questions

Foundational context covering the market sizes, CAGR, scope, country, region and competition that inform every finding below. This section is provided to cover basics and most often pre-purchase conversations, answered from the MMA Primary Research Dataset.

What is the current size of the Competent Cells Market?

The global market was worth USD 0.72 billion in 2025, reaching USD 0.78 billion in 2026. Consumption concentrates in East Asia at 30% of global volume.

How large will the Competent Cells Market be by 2036?

MMA forecasts USD 1.75 billion by 2036, an expansion multiple of 2.24 times the 2026 base. That represents roughly USD 0.97 billion of incremental value.

What is the CAGR for the Competent Cells Market 2026 to 2036?

The base case compounds at 8.4% annually, with a bull case of 9.6% and a bear case of 7.2%. Historical growth from 2020 to 2025 ran at 7.2%.

Which segment is growing fastest?

Specialty genotype competent cells compound at 12.6%, exactly 1.50 times the market rate. Methylation-deficient, recombination-deficient and toxic-protein-tolerant strains face no bench-prepared substitute at any price.

Who are the major companies in the Competent Cells Market?

Thermo Fisher Scientific, New England Biolabs, Takara Bio, Agilent Technologies and Merck KGaA hold a combined 44% of the market. Chinese suppliers including Vazyme and TransGen dominate their domestic market.

Which country is growing fastest?

India compounds at 11.2%, ahead of every other national market. Biosimilar development, vaccine manufacturing and a rapidly widening contract research sector together drive that underlying demand.

Report Segmentation Architecture

The full report scope spans multiple orthogonal segmentation dimensions, with cross-tabulated demand data provided for each dimension pair. Coverage extends further to regional breakdowns, trend trajectories, and the competitive detail needed to support segment-level decision-making.

By Cell Product Type

  • Standard-Efficiency Chemically Competent Cells
  • High-Efficiency Chemically Competent Cells
  • Electrocompetent Cells
  • Protein Expression Strain Cells
  • Specialty Genotype Competent Cells
  • Non-Bacterial Competent Cells

By End-Use Industry

  • Academic and Government Research
  • Biopharmaceutical Discovery and Development
  • Synthetic Biology and DNA Foundries
  • Agricultural Biotechnology
  • Contract Research Organisations

By Commercial Dimension

  • Direct Manufacturer Sales
  • Laboratory Distributor Channel
  • Catalogue and E-Commerce Ordering
  • Custom and Bulk Supply Agreements

By Region

  • North America
  • Western Europe
  • East Asia
  • South Asia and Pacific
  • Latin America
  • Middle East and Africa
  • Eastern Europe

Scope, Methodology, and Coverage

Every figure in this report is reproducible from documented input assumptions. The scope below maps the historical period, the forecast horizon, the segmentation dimensions, and the countries covered, alongside the underlying primary and qualitative methodology.
Historical Period
2020 to 2025
Forecast Period
2026 to 2036
Base Year
2025 (USD billions; MMA Primary Research Dataset, August 2026)
Market Definition
The market covers commercially manufactured bacterial and non-bacterial cells prepared for exogenous DNA uptake and supplied as a research consumable, including chemically competent, electrocompetent, protein expression strain, specialty genotype and yeast preparations. Cells prepared in-house by end-user laboratories fall outside the addressable scope, as do mammalian transfection reagents, cloning kits supplied without cells, and plasmid purification consumables. Sizing is measured at supplier reagent revenue in current prices.
Quantitative Units
USD billions (current prices); transformation efficiency in colony-forming units per microgram where applicable
Segmentation Dimensions
By Cell Product Type; By End-Use Industry; By Commercial Dimension; By Region
Regions Covered
North America, Western Europe, East Asia, South Asia and Pacific, Latin America, Middle East and Africa, Eastern Europe
Countries Covered
USA, China, Germany, France, UK, Japan, South Korea, India, Australia, Canada, Brazil, Mexico, Indonesia, Vietnam, Thailand, Malaysia, UAE, Saudi Arabia, South Africa, Nigeria, Turkey, Poland, Netherlands, Italy, Spain, Sweden, Switzerland, Argentina, Colombia, Singapore, and additional markets relevant to this sector
Key Companies Profiled
Thermo Fisher Scientific, New England Biolabs, Takara Bio, Agilent Technologies, Merck KGaA, Promega Corporation, Bio-Rad Laboratories, LGC Biosearch Technologies, QIAGEN, Zymo Research, GenScript Biotech, Vazyme Biotech, TransGen Biotech, Tsingke Biotechnology, Yeasen Biotechnology, Sangon Biotech, Meridian Bioscience, Intact Genomics, Delphi Genetics, Toyobo
Quantitative Methodology
Primary survey, n=3,800 respondents, Q4 2025, six countries; demand-side model with trade association cross-validation
Qualitative Methodology
47 expert interviews, Q4 2025; applied to validate demand model assumptions, identify emerging dynamics, and assess competitive positioning
Report Format
PDF and XLSX data workbook (Word format preview document)
Publisher
Market Minds Advisory
Report Code
MMA-2026-HLT-612
Published
August 2026
Contact
sales@marketmindsadvisory.com | www.marketmindsadvisory.com

Purchase the full Competent Cells Market Report (2026 to 2036).

The full report sizes the competent cells market across six product types, three commercial channels and seven regions, with annual forecasts to 2036 under base, bull and bear scenarios. It maps catalogue genotype coverage supplier by supplier, identifying which cloning problems each can address and which academic strain collections remain unlicensed. Delivered cost modelling separates cold chain freight and excursion write-offs from manufacturing cost, a distinction most internal reporting conflates. Competitive profiles cover twenty suppliers on a consistent reagent revenue basis. Foundry and discovery account qualification requirements are set out in procurement detail.
Genotype-level catalogue mapping across twenty competing suppliers
Delivered cost model separating freight from manufacturing cost
Unlicensed academic strain collections identified by cloning application
Foundry account qualification and efficiency certification requirements
Regional cold chain excursion risk quantified by distribution route
In-house preparation substitution rates by end-use vertical

Built For The People Who Decide

From boardroom strategy to bench-side execution, this report is read cover-to-cover by leaders shaping the next decade of their industry, turning demand scenarios, market dynamics and valuation benchmarks into decisions.
CXOs/ Presidents/ VPs/ Managers
M&A and Corporate Development
Strategy Teams and R&D Heads
Procurement and Product Directors
Regulatory and Compliance Leaders
Investor Relations and Equity Analysts