Market Minds Advisory
Community Engagement Platform Market

Community Engagement Platform Market: Community Engagement Platform Market: Statutory Consultation, Infrastructure Funding Conditions and the Software That Documents Public Participation

Agencies buy consultation software to produce a defensible record rather than to increase participation, which is why infrastructure funding conditions and litigation exposure drive this category far more than democratic ambition does.

Lead Analyst

Published

September 2026

Make Smarter Decisions with Customized Research Insights

Request a free sample report and evaluate market opportunities, growth trends, and competitive dynamics relevant to your business needs.

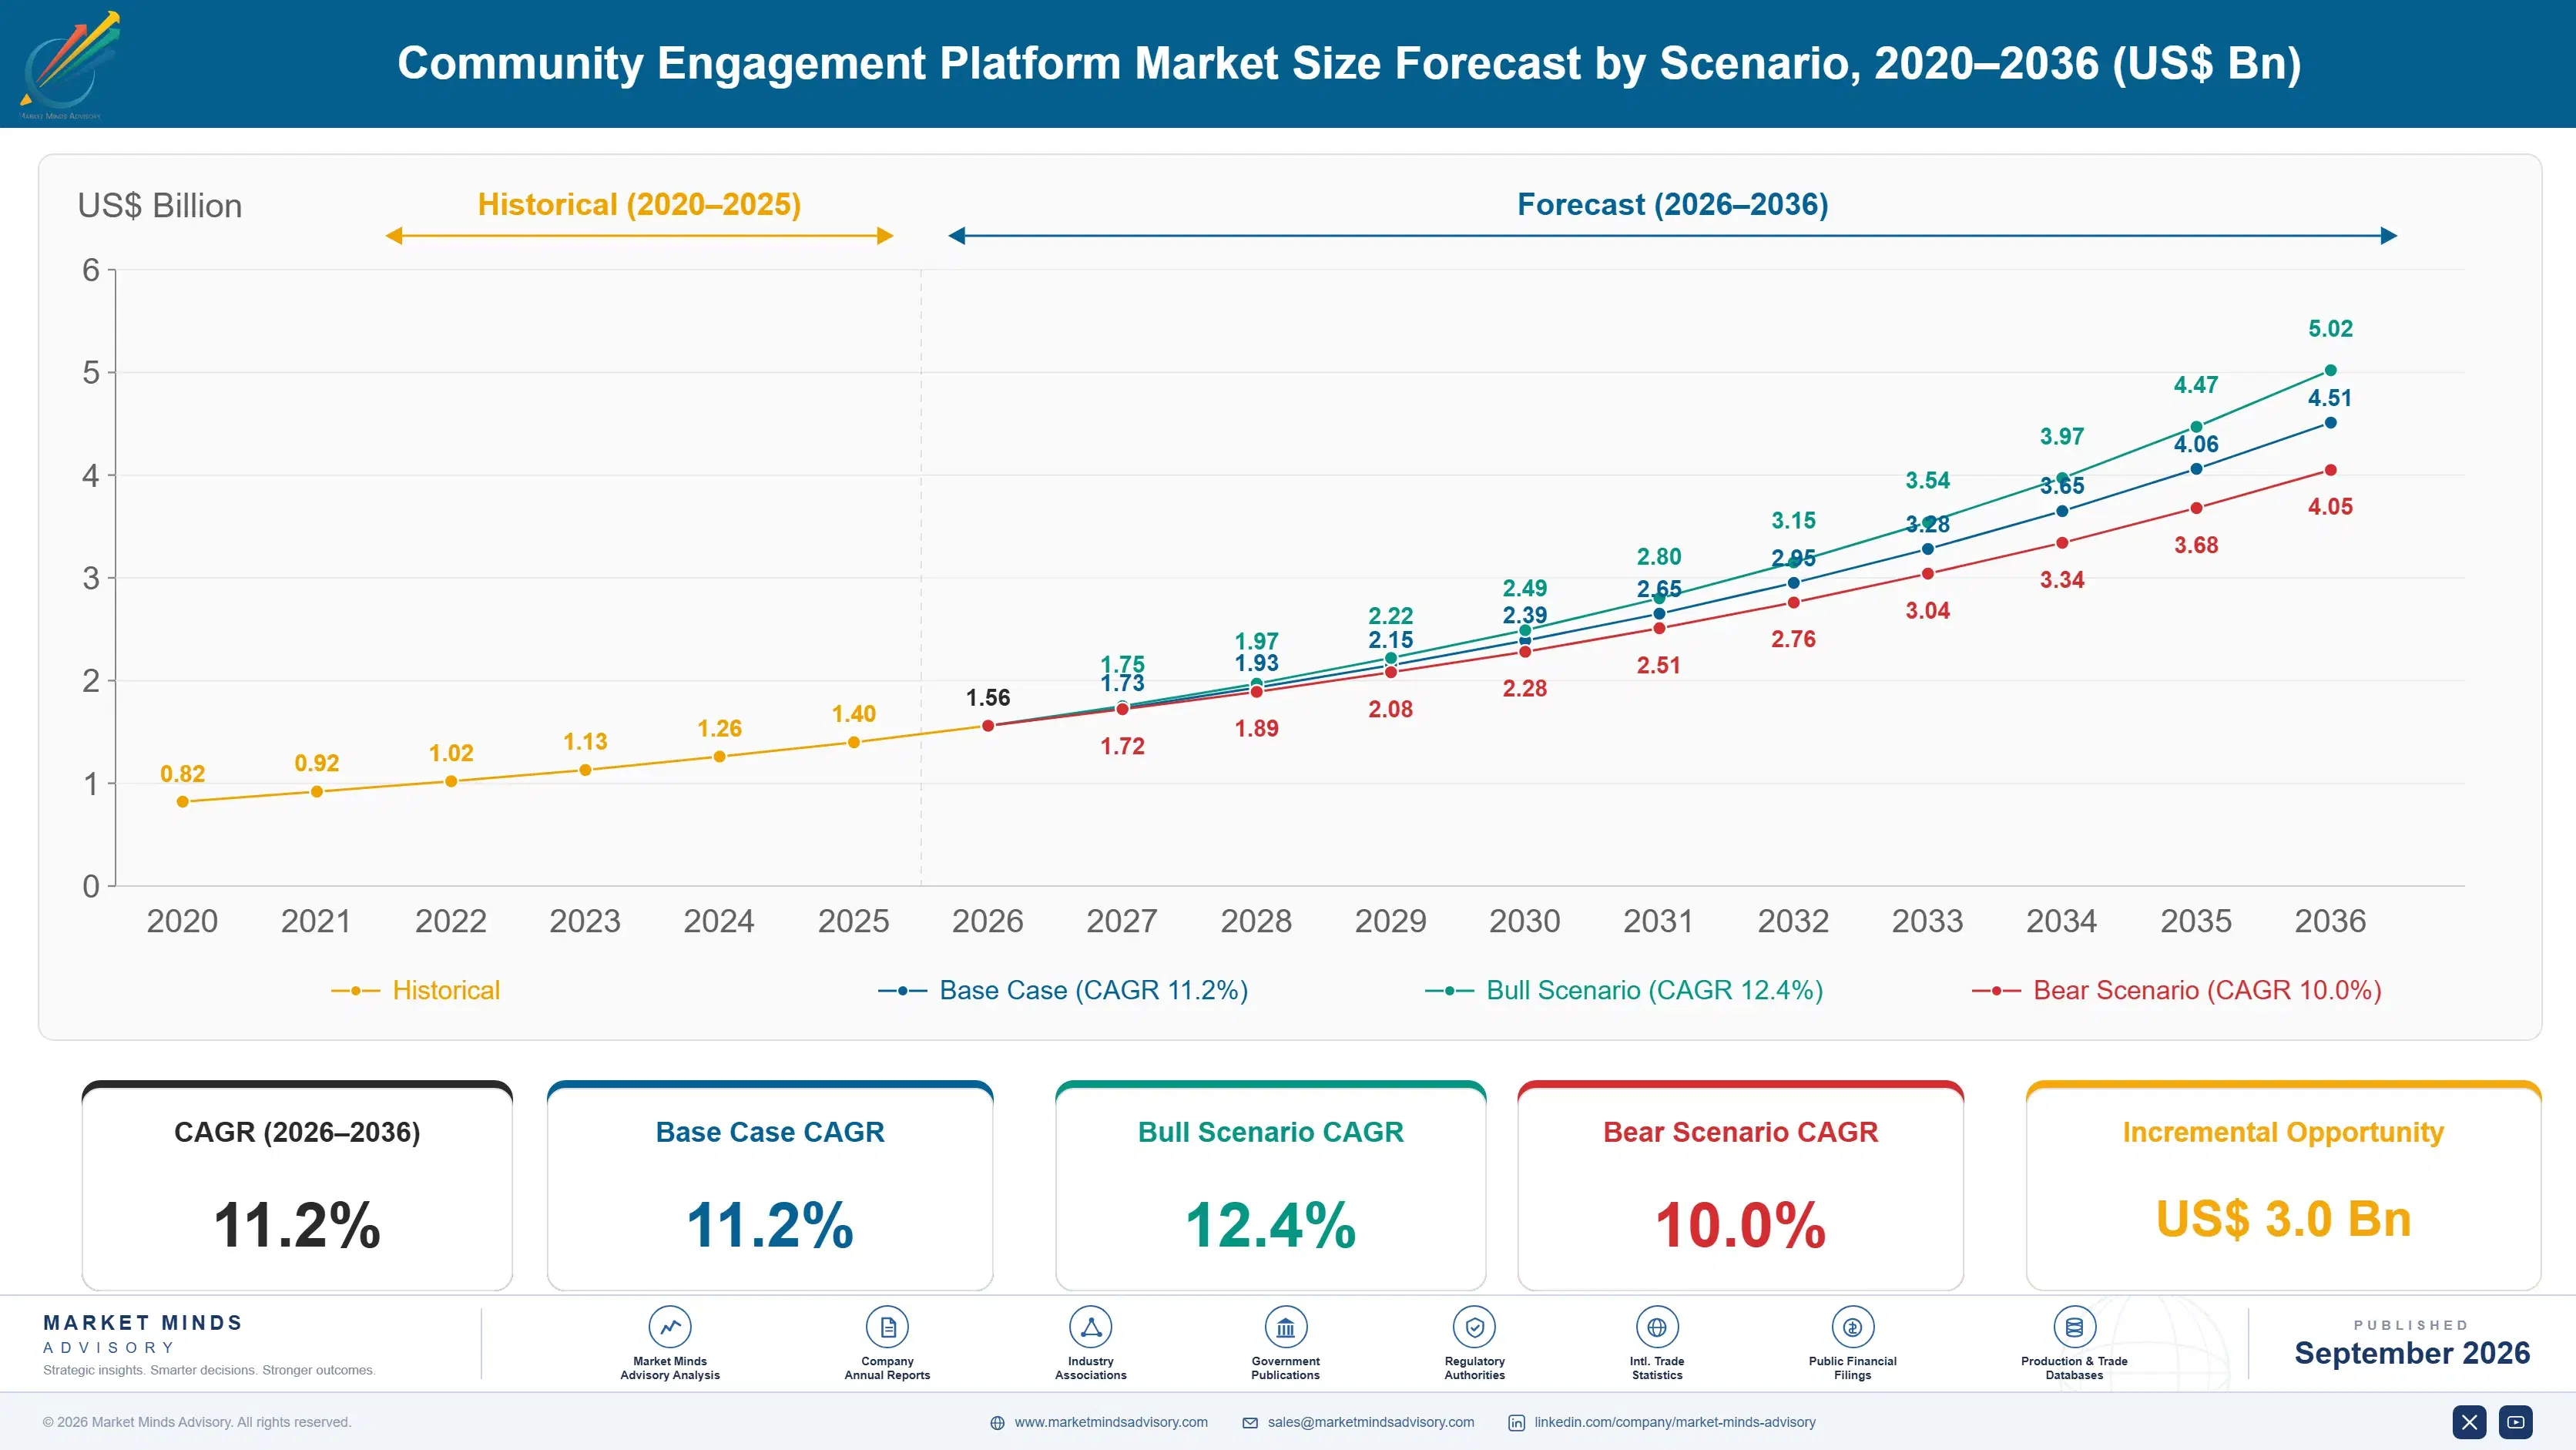
2025 MARKET VALUE$1.4BMarket Size 2025
2036 FORECAST VALUE$4.5BBase Case , 2026 to 2036
CAGR 2026 TO 203611.2 %Bull 12.4% / Bear 10.0%
INCREMENTAL OPPORTUNITY$3.0BNet 10- year value creation
EXPANSION MULTIPLE2.89x2036 value over 2026 base
Strategic Levers
M&A Pipeline
Regional Outlook
Country Rankings
Competitive Intelligence
Segmental Deep-dive
Call-Us : 91 93563 13602

Executive Snapshot and Market Trajectory.

Public agencies do not buy this software to increase participation, whatever the marketing says. They buy an auditable record that consultation happened, because an undocumented process is expensive when someone challenges the decision in court or at appeal. That is a different product from the one being advertised.
That reframing explains where the money is. Infrastructure project engagement grows at 16.8%, half again the market rate of 11.2%, because capital funding programmes now attach community consultation conditions to the grant itself. North America takes 38% of spending, since it holds by far the largest number of separately governed public bodies. Australia and New Zealand punch well above their population weight. Statutory duties there are unusually explicit, and they have recently been widened again.
Concentration sits at roughly 41% across the top five on measured subscription revenue, which understates how consolidated the field feels to a buyer. Granicus assembled much of its position through acquisition and now competes against a long tail of small vendors and a few open-source projects. Contract values are tiny, churn runs near 14%, and customer acquisition cost is the binding constraint on everyone. Nobody has solved it.
Market Definition
This market covers software platforms used by public bodies and infrastructure project owners to consult, inform and gather structured input from residents and stakeholders, including consultation portals, sentiment analysis, participatory budgeting, public notice management and engagement record-keeping. Revenue is measured as subscription and attributable implementation services. Brand and customer community software, internal employee community tools, association management systems, social media management suites and constituent relationship management are excluded.
Base Year Value
$1.4B in 2025 (MMA Primary Research Dataset, September 2026)
Forecast Period
2026 to 2036, eleven discrete annual values
CAGR
11.2% base case. Bull 12.4%. Bear 10.0%.
Fastest Growth Segment
Infrastructure Project and Capital Works Engagement: 16.8% CAGR
Fastest Growth Country
Australia: 15.6% CAGR
Fastest Growth Region
South Asia and Pacific: 13.4% CAGR
Largest Region
North America: 38% of 2025 global value
Market Leaders
Granicus, CivicPlus, OpenGov, Zencity and Go Vocal lead on measured community engagement subscription revenue. Source: MMA Primary Research Dataset, July 2026.
Primary Survey
n=3,800 procurement and R&D decision-makers, Q4 2025, six countries
Methodology
Demand-side build-up, cross-validated against public data, 47 expert interviews

Community Engagement Platform Market Forecast Scenarios

community-engagement-platform-market-size-forecast-scenario-1788417781791
The 2020 to 2025 period grew at 10.2% and had two very different halves. Pandemic conditions forced councils that had never run an online consultation to buy one within weeks, and adoption jumped from a small base. That surge unwound through 2023 and 2024 as emergency budgets closed and agencies discovered that participation had not improved much. What survived was the compliance use case, which never depended on enthusiasm.
The base case at 11.2% rests on three mechanisms. Infrastructure funding programmes in the United States, United Kingdom and Australia now condition disbursement on documented community consultation, which converts the software from optional to procurement-required. Planning reform in several jurisdictions has shortened statutory consultation windows, and agencies cannot meet compressed timetables on paper processes. Third, litigation and appeal risk around major projects makes an evidenced engagement record commercially valuable to the project owner.
The bull case at 12.4% turns on Indigenous and community benefit consultation duties being enforced rather than merely stated, which would materially raise per-project engagement spending. The bear case at 10.0% is straightforward: local government budgets. State and local revenue pressure removes small discretionary subscriptions first, and this category sits squarely in that bracket. Renewal conversations get short.

The Software Documents Consultation More Than It Creates It

The founding promise of this category was that moving consultation online would produce broader and more representative participation. It has not. Typical response rates sit near 2.4% of eligible residents, skew heavily toward older homeowners, and have barely moved in a decade of product development. Vendors know this. Buyers know it too, and they keep buying anyway, which tells you what the product is for.
TOP FIVE CONCENTRATION41%Moderately concentrated after a decade of platform consolidation
RESIDENT PARTICIPATION RATE2.4%Share of eligible residents responding to a typical consultation
AVERAGE CONTRACT VALUEUSD 27,000Annual subscription paid by a mid-sized local authority
ANNUAL CUSTOMER CHURN14%Accounts lost each year mostly to budget withdrawal
STATUTORY REQUIREMENT SHARE63%Purchases driven by a legal consultation obligation somewhere
ADDRESSABLE AGENCY COUNT148,000Public bodies worldwide carrying some form of consultation duty
What agencies are purchasing is defensibility. A planning refusal, a route decision or a service closure can be challenged, and the challenge usually turns on whether consultation was adequate and properly recorded. A platform that timestamps submissions, demonstrates who was notified and produces a structured response report is worth more to a legal team than extra responses would be. Roughly 63% of purchases trace to a statutory obligation.
Commercially the category is defined by tiny contracts and enormous customer counts. An average subscription near USD 27,000 cannot support enterprise selling, so vendors depend on inbound demand, cooperative purchasing schedules and reference-driven regional expansion. Churn near 14% is mostly budget withdrawal rather than dissatisfaction. Whoever solves acquisition cost at that price point wins, and consolidation has been the only method anyone has found.
"Everyone in this market talks about participation and nobody is paid for it. The product that sells is a defensible audit trail, and the vendors who accepted that built better businesses than the ones still chasing turnout numbers that have never moved."
Director, Public Sector Software Practice · MMA Technology Practice · September 2026

Market Trends

Funding Conditions Turn Consultation Into a Procurement Requirement

Major infrastructure funding programmes across the United States, United Kingdom and Australia now attach community engagement conditions to disbursement, requiring evidence of outreach to specified populations before money moves. That changes the buyer entirely. The purchase is no longer made by a communications team hoping for better input but by a programme office that cannot draw down funds without documentation. Sales cycles shorten, price sensitivity falls, and the specification shifts toward reporting and audit features rather than engagement design. Vendors built for the communications buyer have found themselves selling to somebody with different questions.
Market Impact: Delays cost 9 months programme
Consolidation Replaced Product Competition as the Growth Method

Customer acquisition cost against a USD 27,000 average contract leaves almost no room for conventional enterprise selling, and vendors that tried it exhausted their capital. The response has been acquisition: buying installed bases rather than winning them, then cross-selling adjacent public sector modules into accounts already held. Granicus assembled the largest position this way over roughly eight years. The consequence for buyers is fewer independent vendors and more bundled suites, and the consequence for smaller vendors is that independence is increasingly hard to fund past a few thousand accounts. Buyers notice the difference.
Market Impact: Cuts consultation windows to 6 weeks

Market Opportunities and Growth Drivers

Legal Challenge Risk Around Major Projects Keeps Rising

Judicial review, planning appeal and administrative challenge against infrastructure and land use decisions have become routine tactics rather than exceptional ones, and inadequate consultation is among the most commonly successful grounds. A quashed decision on a large transport or energy project costs the promoter months of programme delay and the associated financing carry, which dwarfs any software subscription. Legal teams have accordingly become influential in these purchases, and they specify evidence handling, timestamping and notification records rather than engagement features. This is the single most reliable demand mechanism in the category.
Market Impact: Participation stuck near 2.4%

Statutory Consultation Windows Compress Under Planning Reform

Several jurisdictions have shortened mandatory consultation periods to accelerate housing and infrastructure delivery, in some cases from 12 weeks to 6. The obligation to consult remains identical while the time to do it halves, which makes paper and public meeting processes unworkable for authorities handling large caseloads. Digital platforms are the only practical response, and the purchase becomes operational necessity rather than modernisation. English planning reform and Australian state housing legislation have both produced clear procurement responses among affected councils within a year of enactment. Caseload volume is what makes the paper alternative impossible rather than merely inconvenient.
Market Impact: Churn removes 14% annually

Market Restraints and Challenges

Participation Rates Have Not Improved in a Decade

Response rates near 2.4% of eligible residents undermine the stated purpose of the category and give sceptical elected members an easy argument against renewal. The root cause is not the software: people who are not already motivated to engage with a planning decision do not become motivated because the form moved online, and the demographic skew toward older homeowners persists regardless of channel. Commercially this caps how much value a vendor can credibly claim. Mitigation efforts centre on paid representative panels, text-based outreach and randomly selected deliberative processes, none of which scale cheaply.
Market Impact: Conditions attached to 4 funding programmes

Local Government Budget Cycles Drive Churn Regardless of Value

Annual churn near 14% is dominated by budget withdrawal rather than dissatisfaction, and a subscription in the tens of thousands is small enough to be cut without a debate. The root cause is that this software rarely sits inside a protected statutory line item, so it competes against everything else discretionary in a squeezed authority. The commercial impact is that lifetime value assumptions built on enterprise software norms are wrong. Vendors are mitigating by embedding into statutory workflow, selling multi-year cooperative purchasing agreements and pricing per project rather than annually.
Market Impact: Acquisitions drove 61% of growth
4 additional market trends, 3 additional growth drivers, and 2 additional restraints and challenges are covered in the full report. Contact sales@marketmindsadvisory.com to access the complete intelligence.

Segment CAGR and Growth Architecture

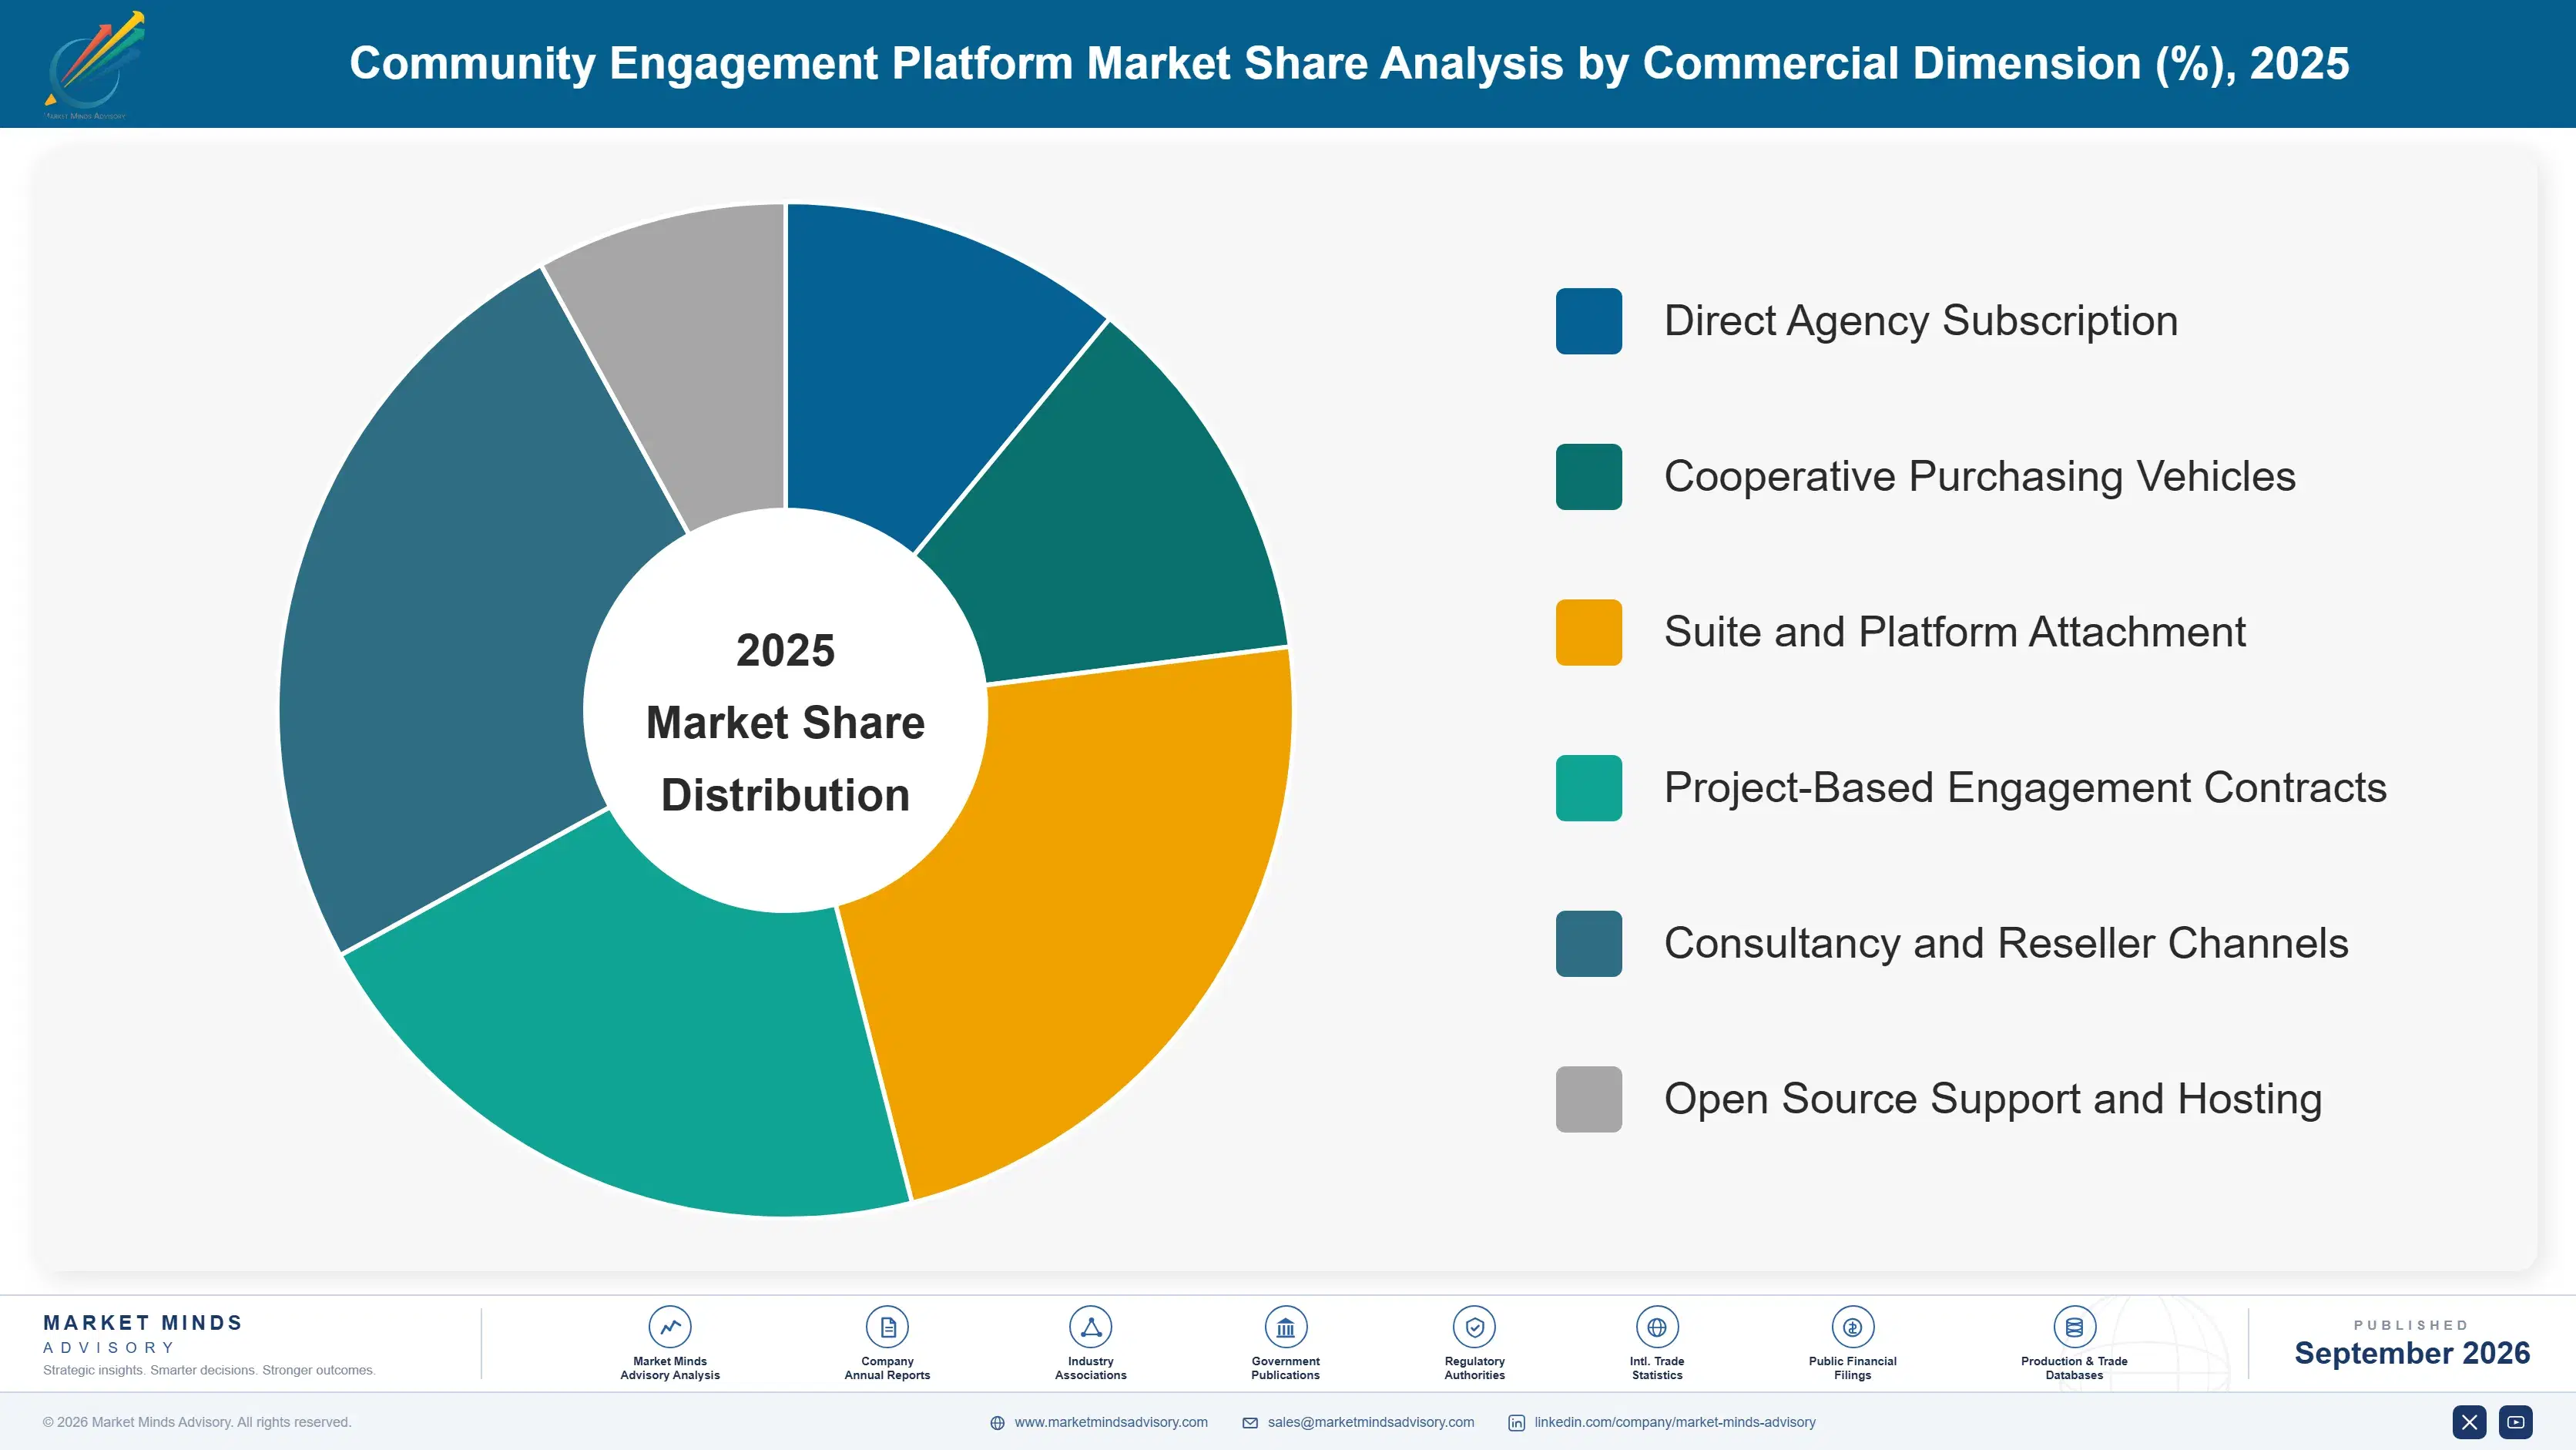
Segmentation follows the obligation the software satisfies, since that determines who signs, what budget it comes from and how defensible the renewal is. Applications tied to a statutory or funding requirement behave quite differently from those bought on general engagement ambition, and the gap between the two is widening every year. Buyers behave accordingly.
community-engagement-platform-market-market-share-analysis-1788417782370

Infrastructure Project and Capital Works Engagement

Project-based engagement is the fastest part of this market at 16.8%, half again the market rate of 11.2%, and it is also the most profitable to serve. The buyer is a project promoter, developer or delivery authority rather than a standing council, the budget comes from project capital rather than operating funds, and per-project spending runs several times a typical annual subscription. Consenting conditions, community benefit obligations and challenge risk all point the same direction. The trade-off is that revenue ends when the project does, so vendors serving this segment carry a permanent replacement burden that subscription businesses do not, and pipeline visibility is correspondingly poor. Account management skills matter far less here than business development ones.
CAGR 16.8%

Resident Sentiment and Feedback Analytics

Sentiment and feedback analytics sells to a different buyer again, usually a chief executive's office or performance team wanting a continuous read on resident opinion rather than a consultation record. Growth at 14.2% reflects genuine demand from larger authorities, though the segment remains vulnerable to the same argument that limits the rest of the market: representativeness. Vendors have responded by combining platform submissions with commissioned panels and social listening, which improves the picture and raises delivery cost considerably. Renewal here is stronger than in consultation tooling, because performance reporting cycles create a recurring internal need that does not disappear when a particular project finishes. Larger authorities with performance teams are effectively the whole addressable base.
CAGR 14.2%
Full segment breakdown across 6 segments available in the complete report.

Regional Architecture and Country Demand Map

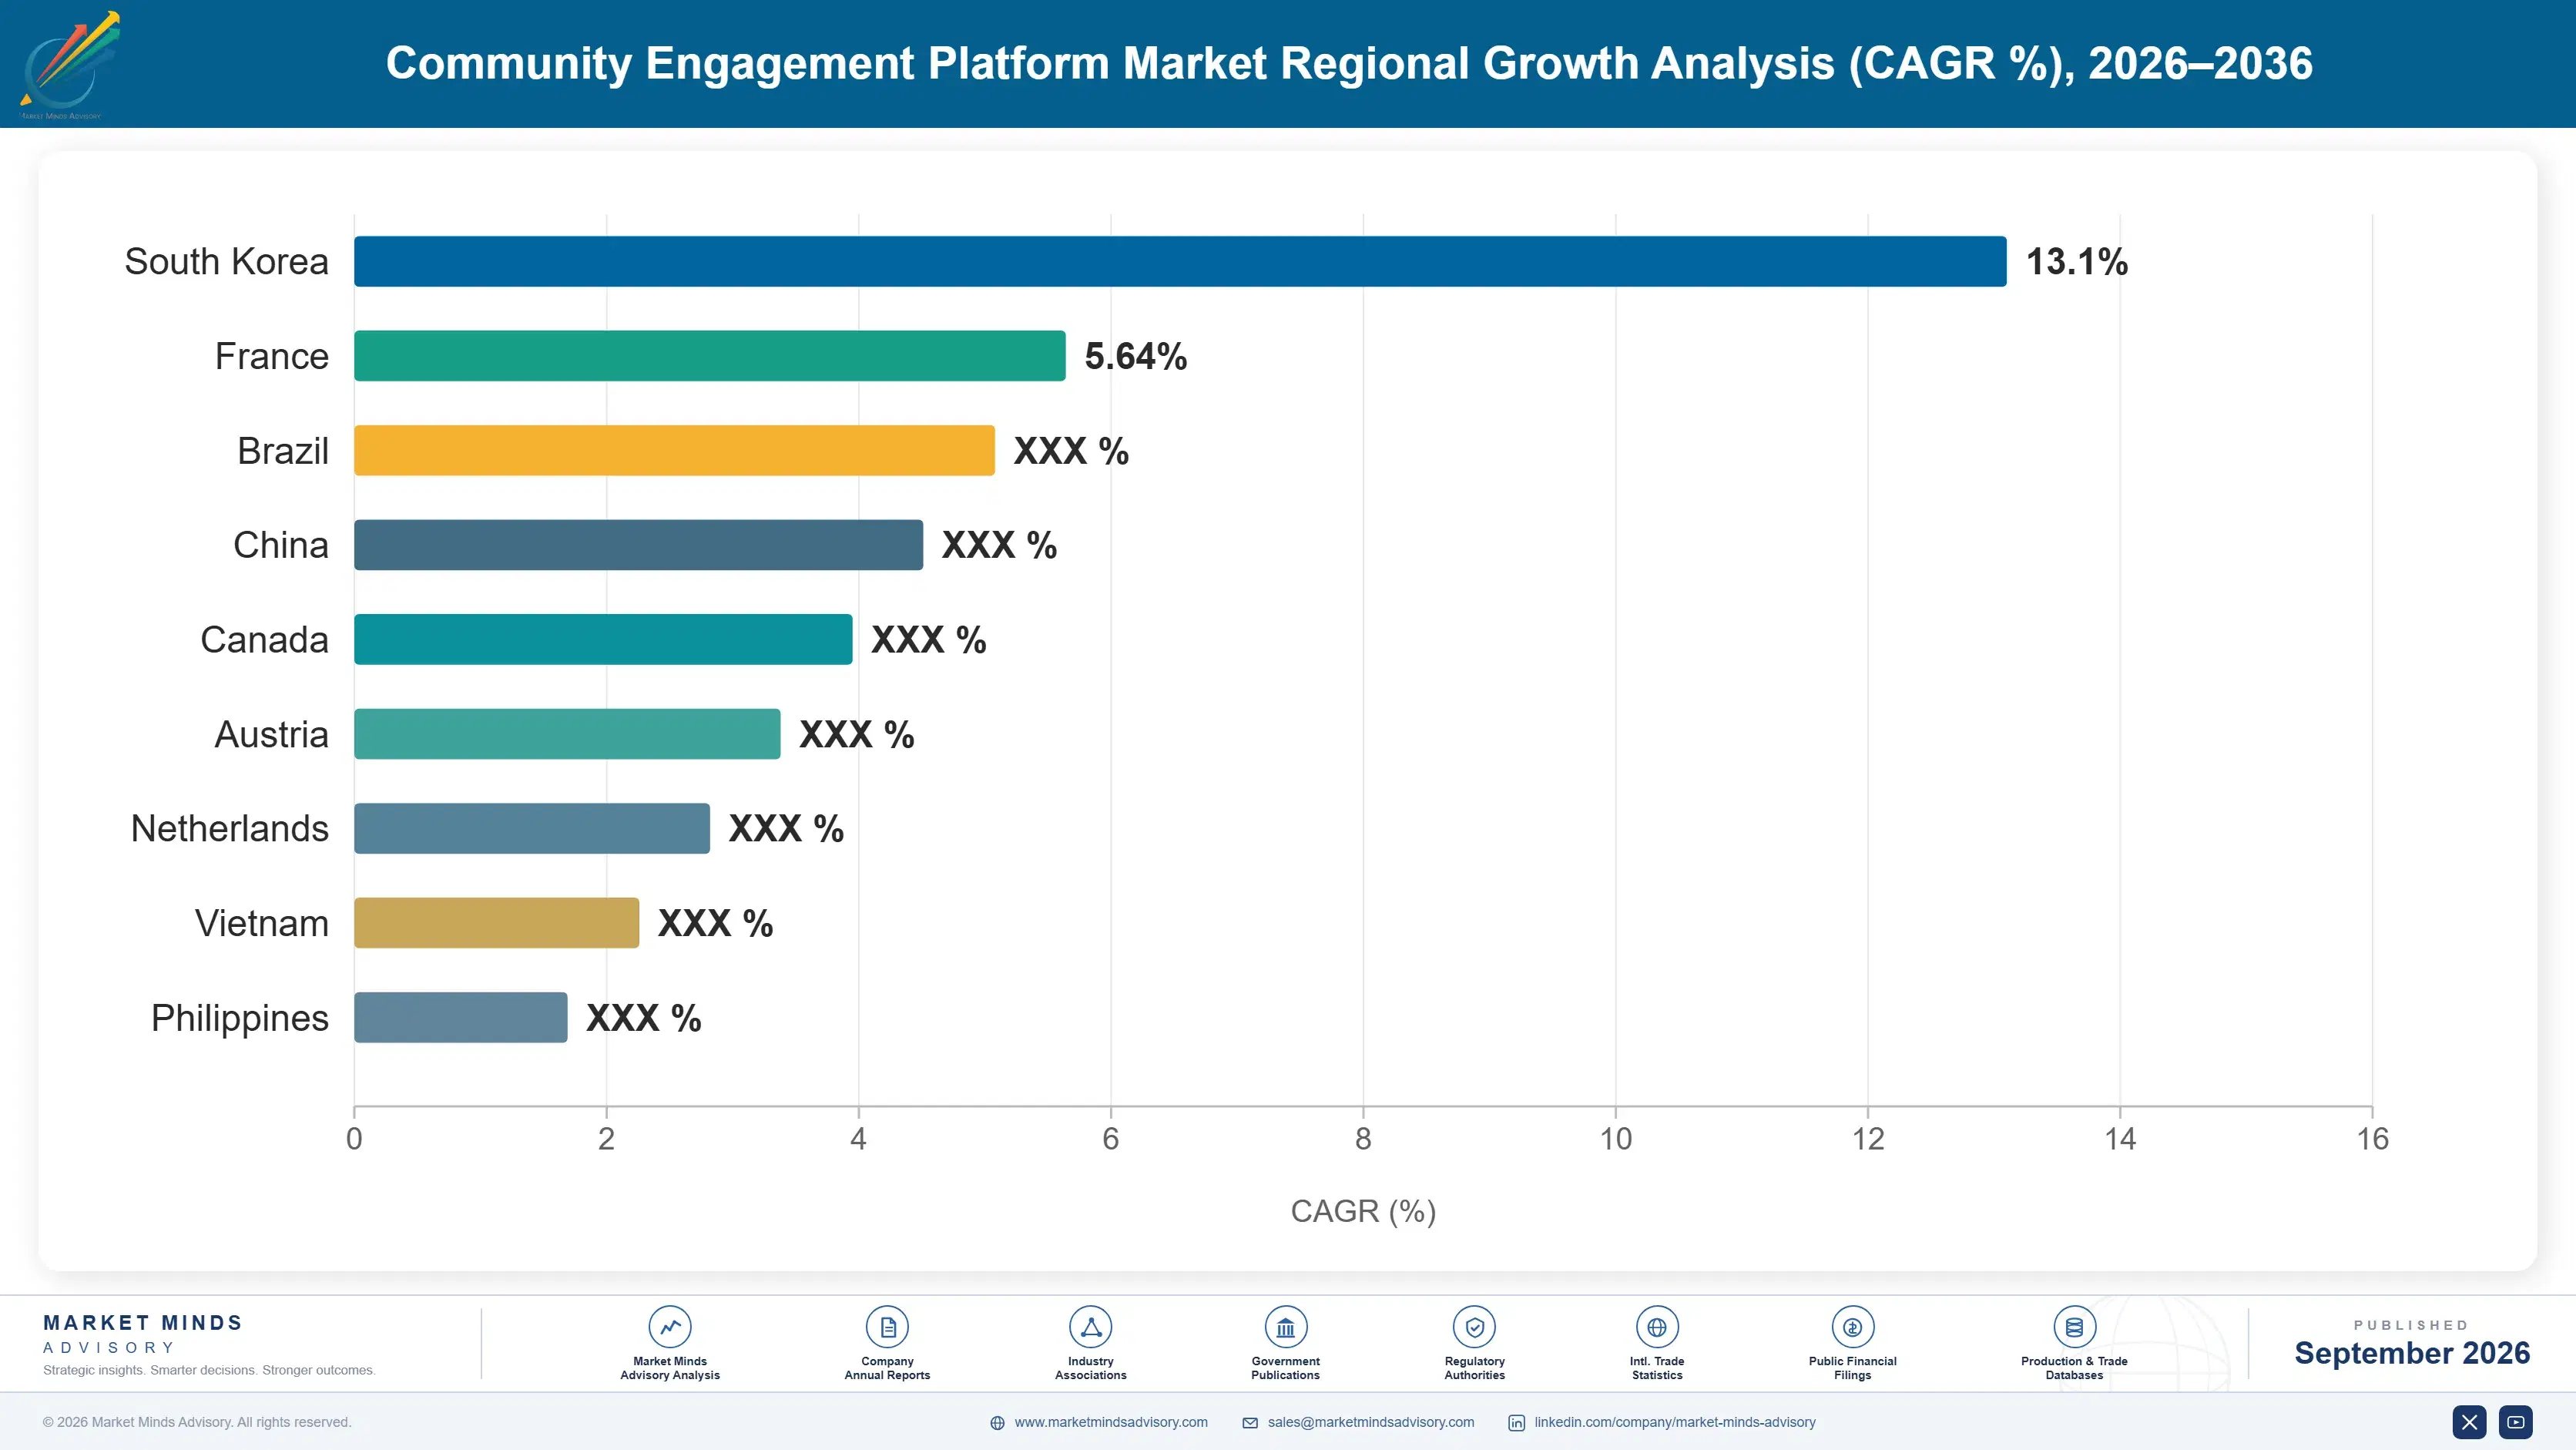
Regional demand tracks the number of separately governed public bodies and the strength of statutory consultation duties, not population. Countries with many small autonomous authorities and enforceable participation obligations buy heavily; centralised states with weak consultation duties barely buy at all. Authority count matters more than anything.

North America

North America holds 38%, above the regional band, and the reason is the sheer number of separately governed public bodies: the United States alone contains roughly 90,000 local government units by Census Bureau count, each an autonomous buyer. Federal infrastructure funding conditions requiring documented community outreach have pushed engagement software into programme offices that previously had no reason to hold it. State transportation departments and water utilities are now significant buyers alongside municipalities. Canadian demand is proportionally strong, driven by Indigenous consultation duties that carry genuine legal weight on resource and infrastructure projects and cannot be satisfied through a general public process. Contract values stay small even at state level, keeping acquisition cost the governing commercial problem.
Share: 38% | CAGR: 10.4% (2026 to 2036)

Western Europe

European demand is shaped by planning law rather than by funding conditions. English local authorities buy against statutory consultation duties and appeal exposure, and planning reform shortening consultation windows has forced several to replace paper processes outright. Dutch and Nordic authorities have the deepest participatory practice and buy sophisticated tooling, though their smaller authority counts limit absolute volume. German procurement is fragmented across states and municipalities and moves slowly, which suppresses adoption relative to the size of the public sector. French demand concentrates in metropolitan authorities and major infrastructure promoters rather than in the very large number of small communes. Spanish and Italian adoption sits in larger city administrations, where open-source deployments hold a meaningful share.
Share: 24% | CAGR: 9.6% (2026 to 2036)
Regional intelligence for 5 additional markets available in the complete report: East Asia, South Asia and Pacific, Latin America, Middle East and Africa, Eastern Europe. Contact sales@marketmindsadvisory.com.
community-engagement-platform-market-country-cagr-analysis-1788417782901

Where Engagement Platform Economics Actually Work

At an average contract value near USD 27,000, nothing about conventional software economics applies. The commercially viable positions come from selling into project budgets rather than operating budgets, embedding into statutory workflow that cannot be cancelled, and finding acquisition channels that do not require a salesperson per account. Everything else is a distraction from those three.

Sell Into Project Capital Rather Than Operating Budgets

A council operating subscription is scrutinised annually and cut when revenue tightens. A consultation budget inside a major project's capital allocation is not, because it is a condition of consent or funding and the programme cannot proceed without it. Vendors that repositioned toward project promoters, developers and delivery authorities report per-engagement values running 5 times a typical annual council subscription, with far shorter procurement. The trade-off is revenue that ends with the project, which means pipeline discipline matters more here than account management does. Account managers are the wrong hire for this segment.
Market Impact: Delivers roughly 5 times a typical subscription value

Embed Into Statutory Workflow Not Communications Practice

Software that sits alongside a communications team's work is discretionary. Software that produces the consultation record a planning decision legally depends on is not, and it survives budget rounds that remove everything else. Vendors that integrated with planning case management, notice publication and decision reporting cut churn from around 14% to under 6% in accounts where the integration is live. The engineering effort is unglamorous and the integrations are jurisdiction-specific, which is exactly why they defend a position that feature work never has. Feature roadmaps have never defended a renewal the way an integration does.
Market Impact: Cuts annual churn from 14% down to 6%

Use Cooperative Purchasing Schedules as the Acquisition Channel

Direct enterprise selling cannot be funded at this price point, and vendors that attempted it burned capital without building a durable base. Cooperative purchasing vehicles, state master contracts and consortium frameworks remove procurement effort for both parties and cut customer acquisition cost by roughly 40% against direct selling. Getting listed takes time and administrative persistence rather than sales investment. Vendors holding positions on the major vehicles compound advantage steadily, because a listed contract is often the deciding factor for a small authority with no procurement capacity. Procurement capacity is the real constraint on the buyer side.
Market Impact: Reduces customer acquisition cost by roughly 40% overall

Price Representativeness Work Separately From Platform Access

Buyers increasingly ask whether responses represent the community, and the honest answer is that platform submissions do not. Vendors that offer commissioned representative panels, targeted outreach and deliberative process facilitation as separately priced services add roughly 35% to account value and address the objection that most threatens renewal. Delivery cost is real and margins are lower than software, but the work makes the platform defensible in front of elected members. Bundling it into the subscription price instead destroys the margin and hides the value. Elected members ask the representativeness question and they ask it publicly.
Market Impact: Adds roughly 35% to the total account value

Who Controls the Margin Pool

Concentration sits near 41% across the top five on measured subscription revenue, which is moderate on paper and feels tighter to buyers because the leading position was assembled by acquiring products they once evaluated separately. The gap between the leaders and the challenger tier is mostly one of breadth rather than capability: smaller vendors often hold better engagement products and cannot fund the adjacent modules that make a suite purchase attractive.
Competition runs on three dimensions. Procurement accessibility is first, since a listing on the right cooperative purchasing vehicle decides more small deals than any product comparison. Second is integration with planning, records and notice publication systems, which is where renewal defensibility actually comes from. Third is credibility on representativeness, where nobody has a strong answer and buyers increasingly ask in front of elected members.

Two pressures are reshaping the field. Open-source platforms maintained by public sector consortia have become genuinely usable and hold real positions in Europe and Latin America, capping pricing at the lower end. Meanwhile the large government software suppliers are bundling engagement modules into wider platform contracts, which threatens standalone vendors at the top end. Rankings will move toward whoever holds statutory workflow integration.
community-engagement-platform-market-company-positioning-matrix-1788417783432

Competitive Moat and Risk Dimensions

GRANICUS

Moat: Acquired installed base breadth

Granicus assembled the largest position in this category by acquiring products rather than displacing them, and the resulting installed base spans agency sizes and jurisdictions no organic sales effort could have reached at this price point. Adjacent public sector modules covering notice publication, records and communications make the suite defensible against single-product challengers. Cooperative purchasing listings compound the advantage further.
GRANICUS

Risk: Integration debt across acquisitions

Growth by acquisition leaves multiple overlapping products with distinct data models, and rationalising them risks disrupting exactly the accounts that provide the revenue base. Buyers comparing modules within the portfolio sometimes find inconsistency that a single-product vendor avoids. The strategy also depends on continued availability of acquisition targets at reasonable prices, which is narrowing as the independent vendor population shrinks.
CIVICPLUS

Moat: Municipal web platform anchor

CivicPlus reaches engagement buyers through the municipal website and communications platform many of them already run, which removes the acquisition cost that constrains everyone else in this market. Selling an additional module into an existing account is a fundamentally different economic proposition than winning a new authority. Its depth in small municipalities is hard for enterprise vendors to reach.
CIVICPLUS

Risk: Limited large project capability

The company's strength lies in standing municipal accounts rather than in the major infrastructure project engagements that carry the fastest growth and the largest per-engagement values. Project promoters and delivery authorities procure differently and expect consultation methodology support alongside software. Building that capability means competing against specialist consultancies as much as against other platform vendors, which is unfamiliar commercial territory.

Players Tracked

Prominent Players

Granicus
CivicPlus
OpenGov
Zencity
Go Vocal

Other Key Players

PublicInput
Polco
Konveio
Commonplace
Social Pinpoint
Balancing Act
Delib
Esri
Tyler Technologies
Accela
Rock Solid Technologies
Objective Corporation
Harvest Digital Planning
Decidim
Consul Democracy

Recent Developments

APRIL 2025

Granicus expands engagement suite through internal product development

The company released consultation reporting and audit trail capability aimed at federally funded infrastructure programmes, built internally rather than acquired. The release responds to grant conditions requiring documented outreach to specified populations before disbursement, which had become the most common buyer requirement. Existing customers received it without additional charge.
Signal: Product roadmaps are now being set by funding conditions rather than by anything resembling engagement practice.
AUGUST 2025

Australian state extends mandatory community engagement obligations to regional councils

The legislative change requires published engagement strategies and documented consultation from a further group of regional authorities, extending obligations that metropolitan councils have carried for several years. Affected councils were given a twelve month implementation period before the duty takes effect. Published strategies must be reviewed each electoral term.
Signal: Australian statutory duties keep widening, which is why the country grows faster than any other market covered here.
JANUARY 2025

European city consortium expands shared open-source engagement deployment

A group of European municipal administrations agreed joint funding for continued development of a shared open-source engagement platform, pooling maintenance costs across participating cities. The arrangement is a collaboration agreement rather than a joint venture or any equity transaction between the parties. Participating cities retain their own hosting arrangements.
Signal: Open-source alternatives now cap commercial pricing at the lower end of the European market quite effectively.

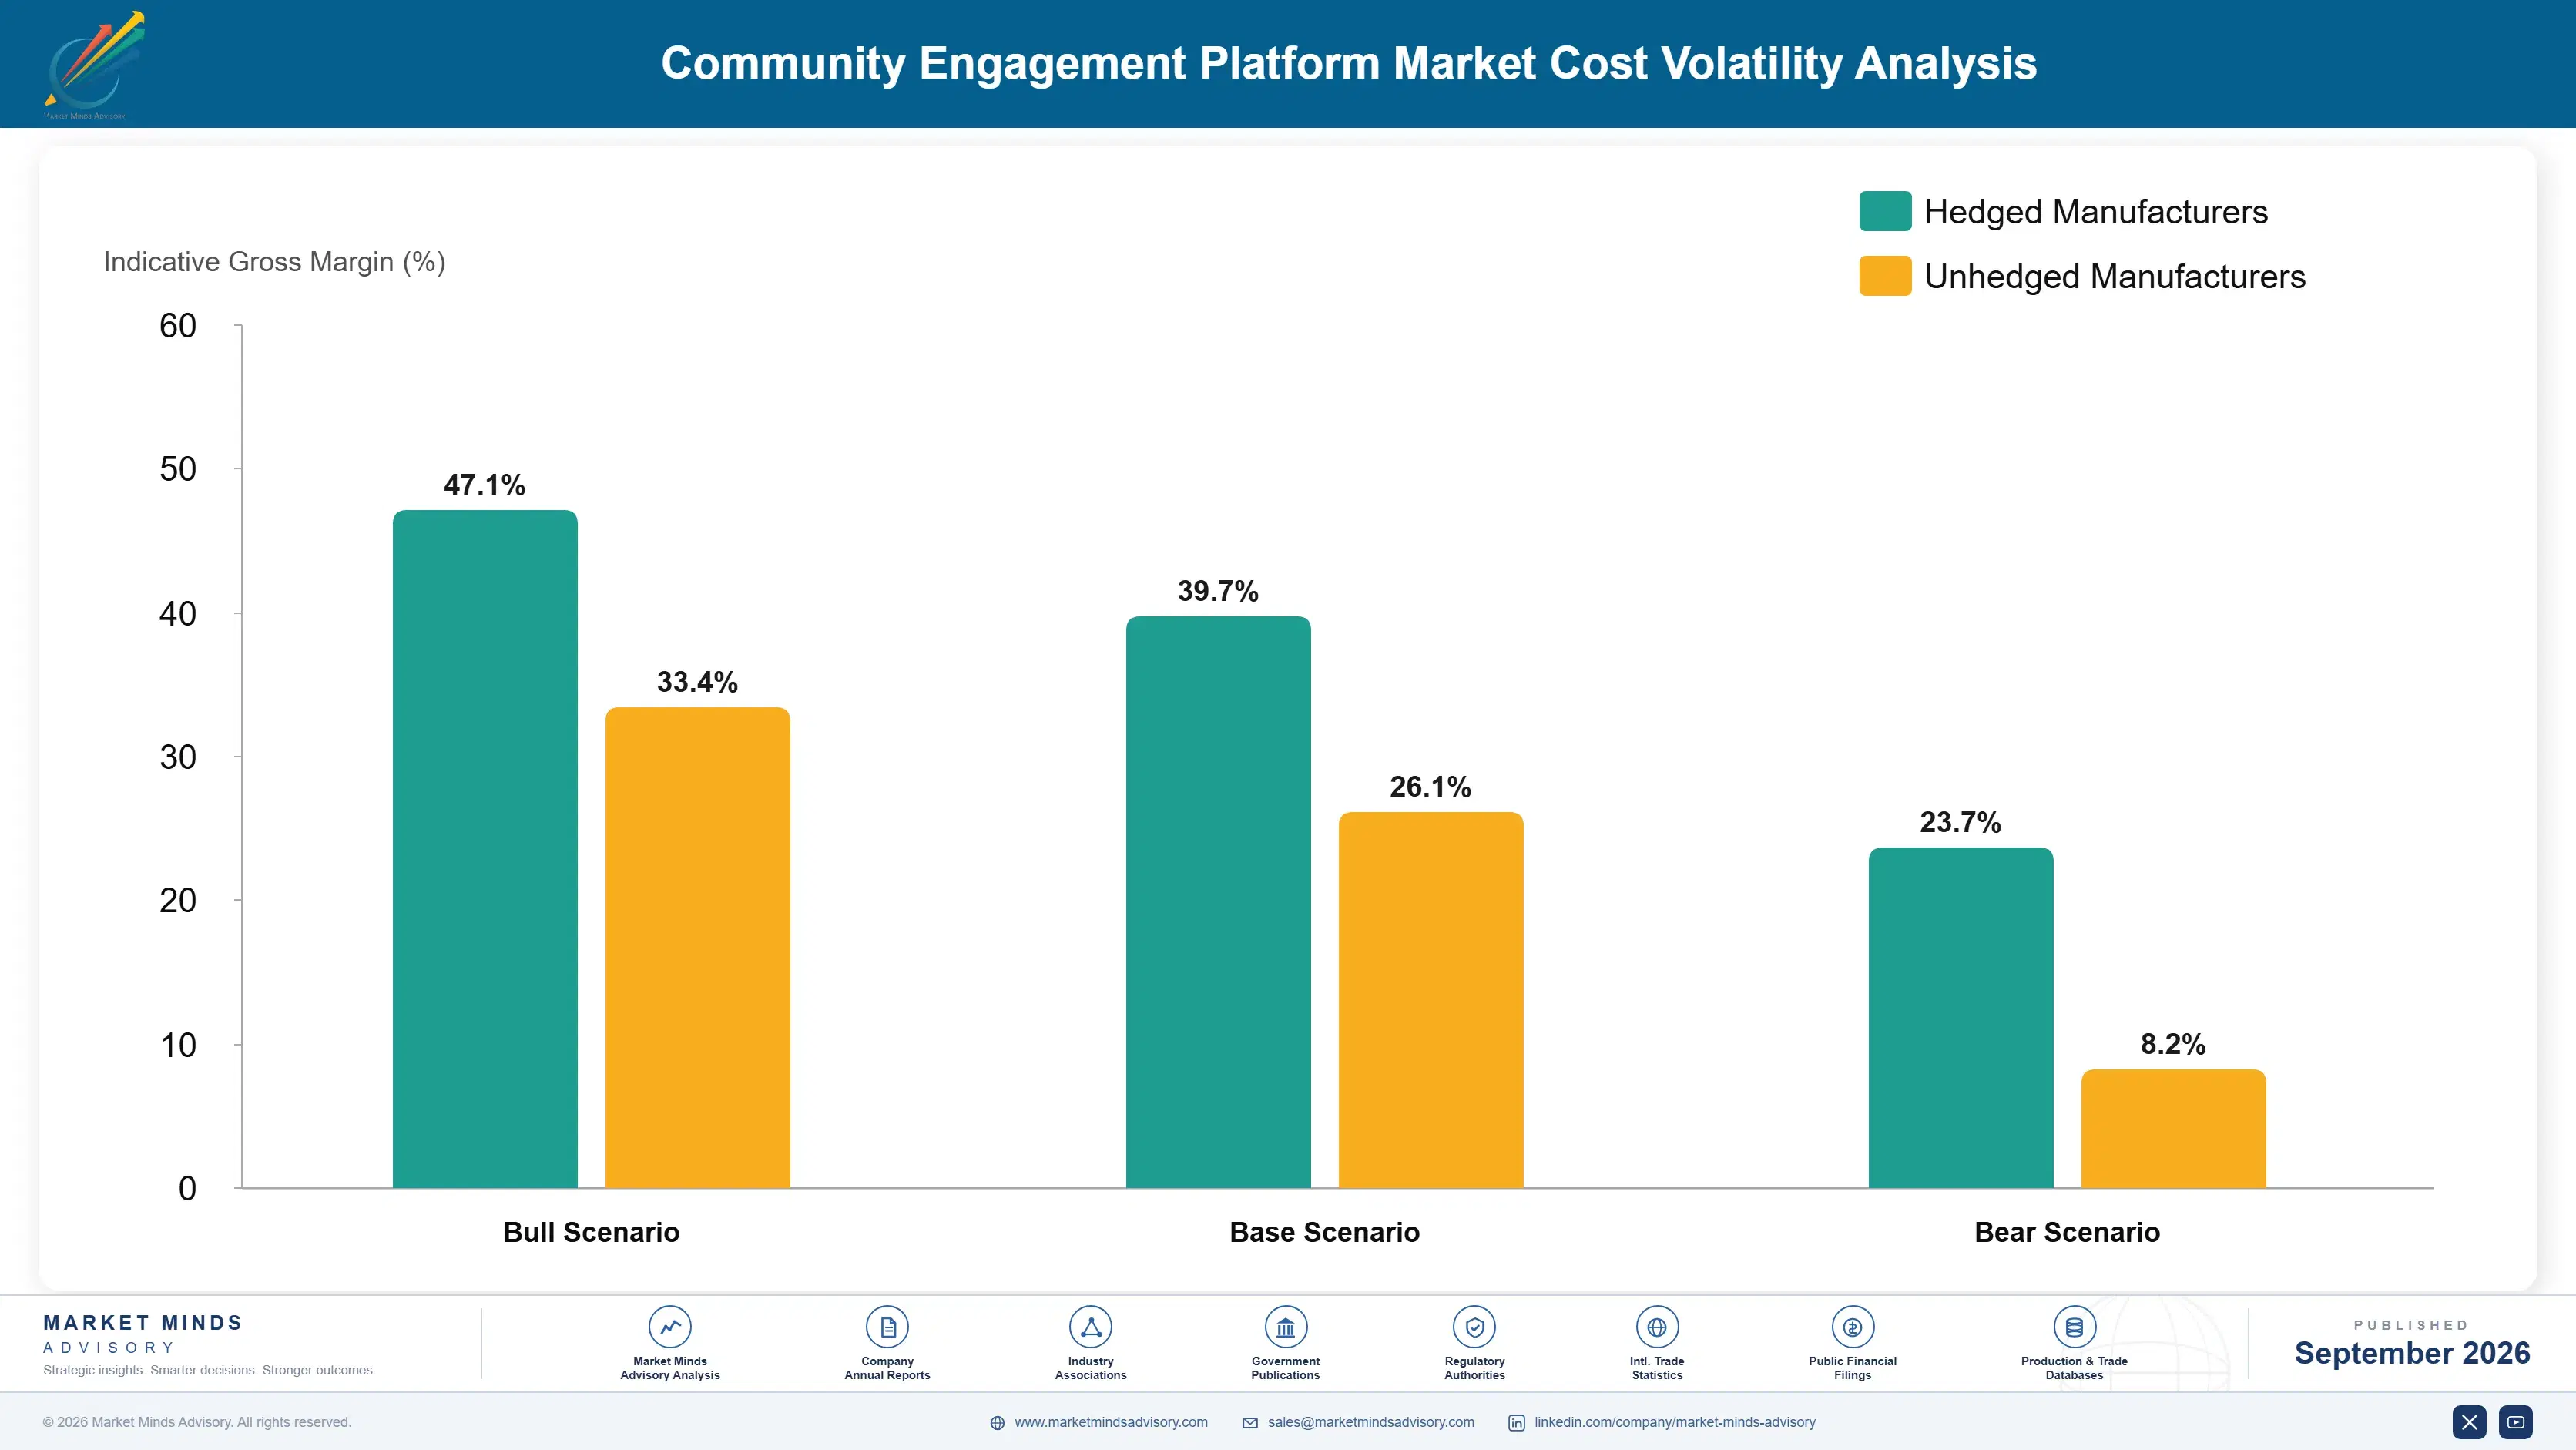
What Delivering This Software Really Costs

Cost structure here is dominated by going to market rather than by building or running anything. Sales and marketing consume between 34% and 46% of revenue at most vendors, a range that varies with how much volume flows through cooperative purchasing. Customer success and implementation take roughly 22%, hosting under 9%, and moderation and support the balance. Engineering is smaller than most observers assume.
The recent pressure has come from public sector budget conditions rather than from any input price. United States Census Bureau quarterly reporting on state and local tax revenue showed real-terms softening through 2024 and into 2025, and vendors serving municipal accounts held sales capacity against deals that slipped by quarters. Customer acquisition cost rose accordingly. Tyler Technologies noted extended public sector sales cycles in 2024 reporting.

Exposure is uneven and it follows channel rather than scale. Vendors selling direct into individual authorities carry the full cost of every slipped procurement, while those with cooperative listings and suite attachment absorb far less. Firms serving infrastructure project budgets are least exposed, since capital programmes are less sensitive to annual revenue swings. Small independent vendors hold neither channel advantage nor the account base to spread fixed selling cost.
community-engagement-platform-market-cost-volatility-analysis-1788417783631

Shift volume onto cooperative purchasing vehicles

Listings on state master contracts and consortium frameworks cut acquisition cost by roughly 40% and remove procurement effort that small authorities cannot resource anyway. Getting listed demands administrative persistence rather than sales investment, which suits capital-constrained vendors. The disadvantage is published pricing, which compresses discounting flexibility and makes competitive positions considerably more transparent than direct selling ever did.

Attach engagement to an existing platform relationship

Selling a module into an account that already runs a municipal website, records or permitting platform costs a fraction of winning a new authority outright. This is the clearest advantage available in the category and why suite vendors outgrow specialists. Independent vendors can partly replicate it through reseller arrangements with platform providers, though margin share is punitive.

Move implementation toward configured templates

Bespoke implementation is unaffordable at a USD 27,000 contract value, yet many vendors still deliver it because early customers demanded it. Jurisdiction-specific configured templates covering common consultation types cut implementation effort by around 55% and improve consistency of the resulting record. The work needs legal review per jurisdiction, which is why smaller vendors have been slow to build it.

Portfolio Architecture for Margin Defence

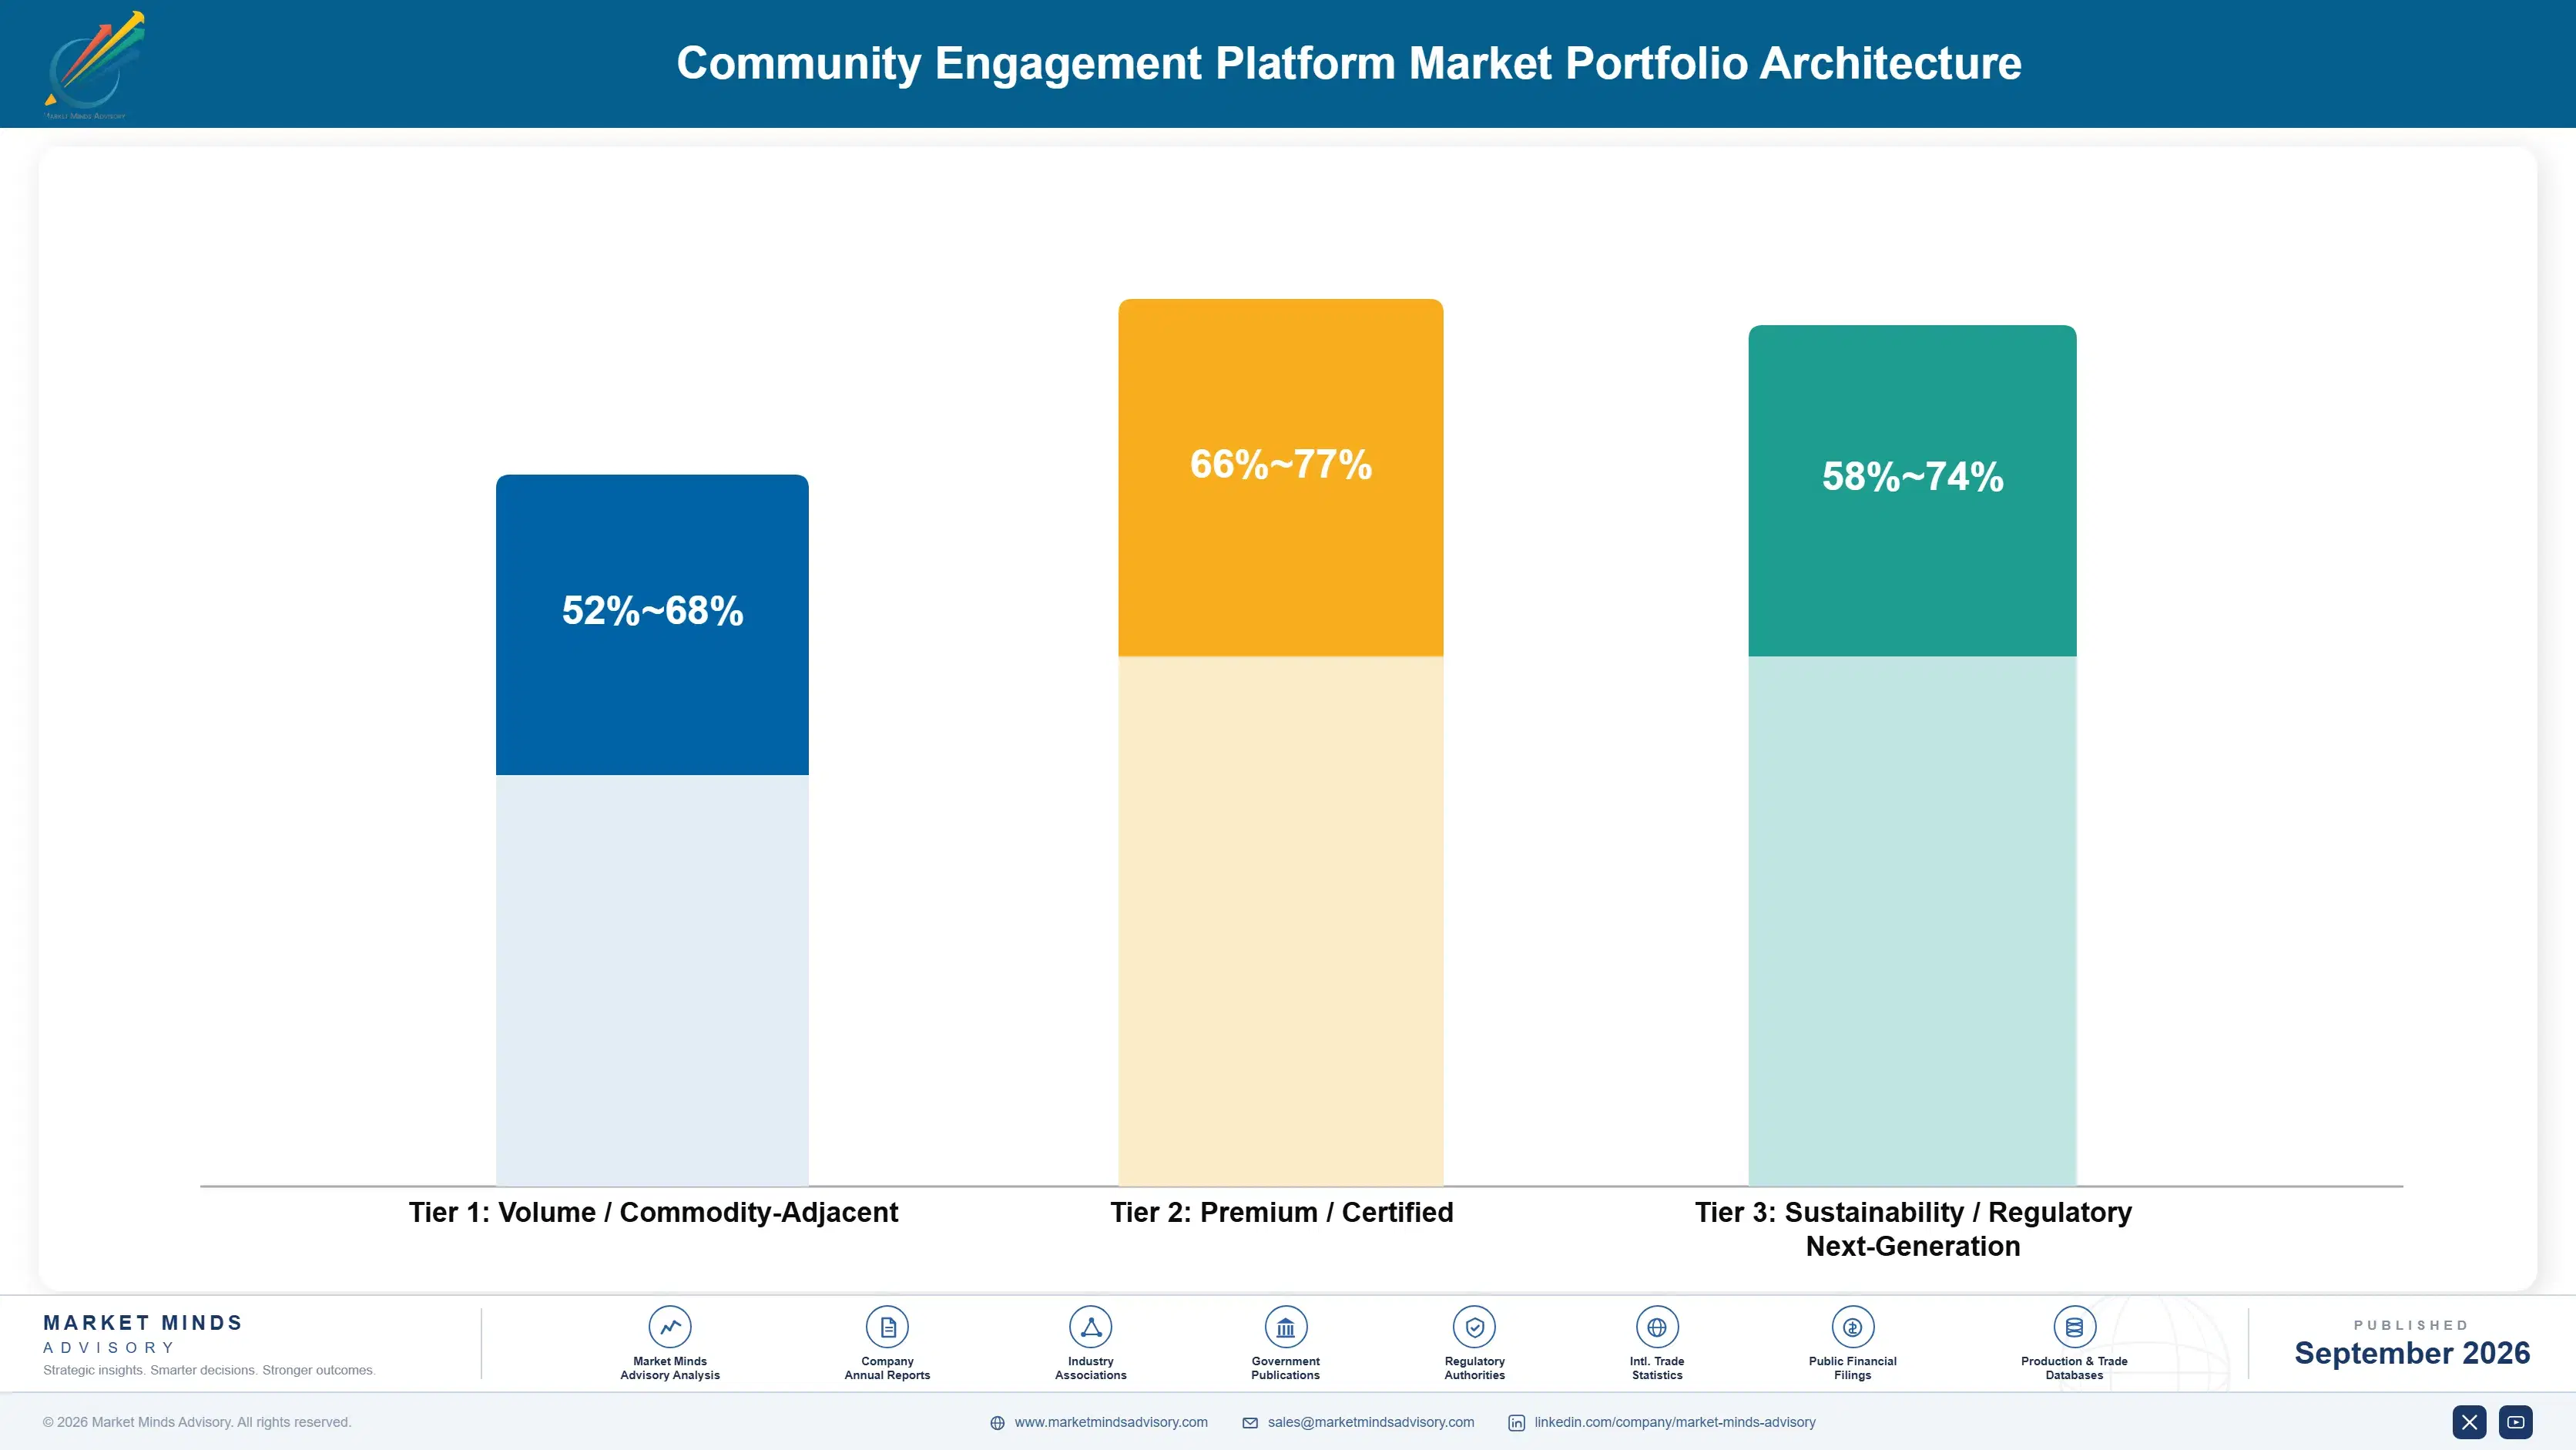
Margin architecture divides on acquisition channel rather than on product. Vendors selling through suite attachment or cooperative purchasing clear gross margins in the seventies, while those funding direct sales into individual authorities struggle to hold the fifties once selling cost is allocated. Product quality explains little of the variance. Channel explains most of it, which is uncomfortable for firms that have invested heavily in engagement features.
The volume tension is between standing subscriptions and project engagements. Subscriptions are small, predictable and churn at 14%; project work pays several times more, procures faster and disappears on completion. Vendors need both, because subscription revenue funds the fixed engineering base while project revenue supplies the margin. Those that chose one exclusively have found either that they cannot fund development or that they cannot forecast anything, and both failure modes proved expensive.

High-value revenue concentrates in infrastructure project engagement and in representativeness services sold alongside the platform. Both share the property that the buyer faces a consequence, whether a consent condition or a challenge risk, that dwarfs the fee. Standing council subscriptions occupy the volume position and generate the reference base, but they will not carry a business at prevailing contract values and churn.

Volume / Commodity-Adjacent

Standing consultation subscriptions sold to councils and small public bodies. The wide range separates suite-attached and cooperative-channel sales from direct selling, which changes fully loaded economics completely. Open-source alternatives cap pricing at the bottom of this tier across Europe and Latin America.
Gross Margin: 52-68%

Premium / Certified

Platforms integrated into statutory planning, records and notice workflow, sold to larger authorities with genuine compliance exposure. Margin holds because integration makes replacement expensive and renewal close to automatic. Jurisdiction-specific engineering limits how quickly the position can be extended to new markets.
Gross Margin: 66-77%

Sustainability / Regulatory / Next-Generation

Infrastructure project engagement and representativeness services including commissioned panels and deliberative facilitation. The widest range in the portfolio, since delivery content varies enormously between a documentation exercise and a facilitated process. Highest absolute values and the least predictable pipeline anywhere in this market.
Gross Margin: 58-74%
community-engagement-platform-market-portfolio-architecture-1788417784150

High-value Sub-segments and Strategic Watch-out

Infrastructure Project Engagement

High value and high growth together, funded from project capital rather than operating budgets and therefore insulated from council budget rounds. The margin range reflects how much facilitation and methodology support is bundled. Revenue ends with the project, which makes pipeline replacement a permanent operational requirement.
Gross Margin: 64-74%

Statutory Workflow Integration

High value with moderate growth, sold to authorities whose planning decisions legally depend on the consultation record the platform produces. Churn falls below 6% where integration is live, which transforms lifetime value against the market average. Jurisdiction-specific build cost is the constraint on how fast this can be extended.
Gross Margin: 68-77%

Standing Council Subscriptions

The volume core and the least attractive part commercially, carrying 14% churn and contract values too small to support direct selling. It nonetheless generates the reference base and the account footprint that everything else is sold into. Vendors cannot abandon it even where the unit economics barely work.
Gross Margin: 50-64%

Open Source Platform Maintenance

The strategic watch-out, because publicly maintained platforms have become genuinely usable and city consortia now fund them jointly. Commercial vendors can sell hosting and support around them, at margins well below licensed software. Treating these projects as irrelevant has already cost several vendors positions across European municipal markets.
Gross Margin: 42-56%

How This Revenue Repeats

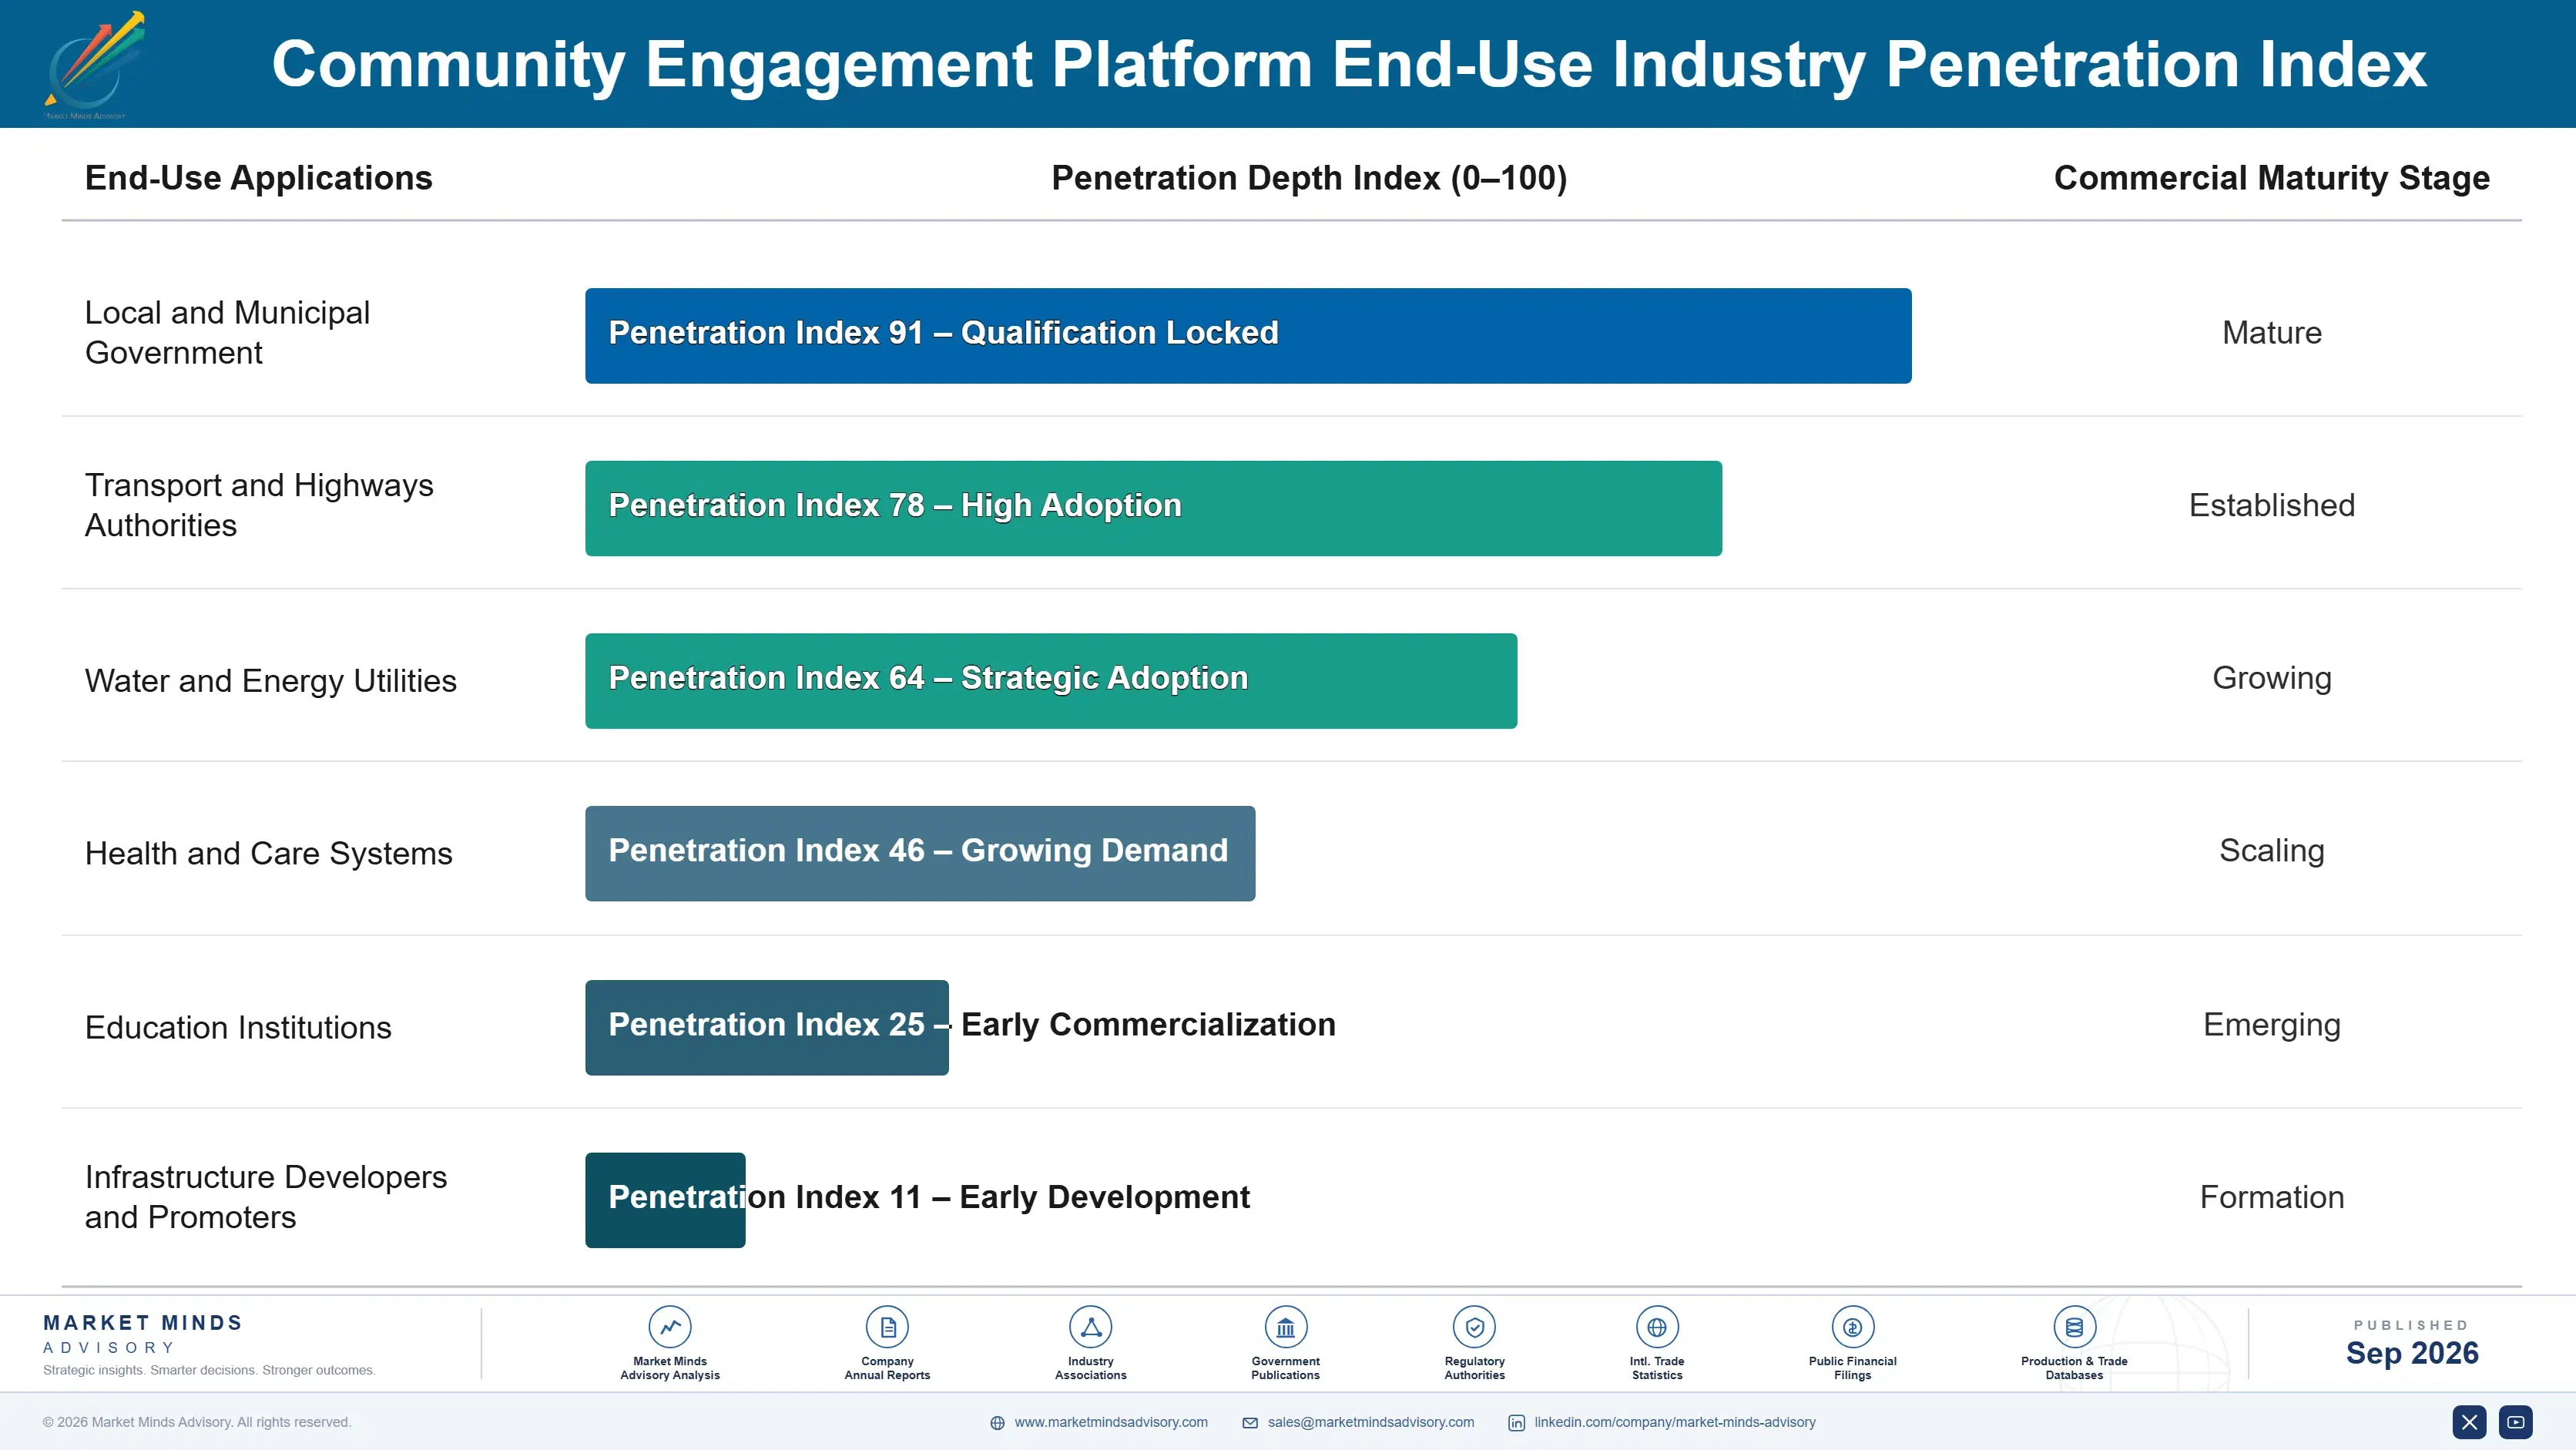
Annuity quality in this market depends almost entirely on whether the platform sits inside a statutory process. Where it produces the consultation record a planning decision legally rests on, renewal is close to automatic and churn falls under 6%, because cancelling creates an evidentiary gap nobody wants to explain. Where it supports communications activity, renewal is decided annually against every discretionary line and churn runs near 14%. The same product, two entirely different businesses.
Adoption depth varies sharply by vertical. Planning and transport authorities use these platforms continuously and integrate them into case handling. Utilities use them episodically around tariff and infrastructure consultations. Health systems buy for service change consultation, intense and infrequent. Education institutions engage lightly. Project promoters use them most intensively of anyone but only for a project's life, which is why that revenue looks nothing like a subscription.

The buyer profile has shifted from communications toward legal and programme management. A decade ago the purchaser was a communications manager persuaded by engagement philosophy. Today it is more often a programme office that cannot draw funding without documentation, or a legal team managing challenge risk. Vendors still pitching participation improvement address a buyer who has stopped signing.
community-engagement-platform-market-end-use-penetration-index-1788417784657

Where This Market Actually Pays

These are among the four positions where our research anticipates prominent divergence between winners and laggards over the coming forecast period. Each is grounded in the demand model, the regulatory perimeter, and the announced capacity pipeline.
01 / STATUTORY WORKFLOW EMBEDDING

Integrate into the legal process or accept permanent churn

Churn near 14% is the defining economic problem in this category and it is almost entirely a function of whether the platform sits inside a process the authority legally cannot skip. Vendors that integrated with planning case management, notice publication and decision reporting cut churn below 6% in those accounts, which changes lifetime value more than any pricing or product decision could. The integrations are jurisdiction-specific and tedious, which is precisely why they defend a position that feature development never has.
02 / PROJECT BUDGET ACCESS

Follow capital programmes rather than operating subscriptions

Infrastructure project engagement pays roughly 5 times what a typical council subscription does, procures considerably faster and comes from capital allocations that comfortably survive the annual budget rounds which remove standing software lines. It is growing at 16.8% against a market at 11.2% for precisely that reason. The discipline this requires is constant pipeline replacement, since project revenue ends abruptly on completion, and vendors organised around account management rather than business development have consistently underperformed across this part of the market.
03 / ACQUISITION CHANNEL ECONOMICS

Solve customer acquisition cost before improving the product

At an average contract value near USD 27,000, direct enterprise selling cannot be funded and several well-regarded vendors exhausted their capital proving it. Cooperative purchasing listings and suite attachment cut acquisition cost by around 40% and they explain far more of the profit variance across this field than product quality does. Firms investing in engagement features while selling direct are optimising the wrong variable, and the ones that understood this early have built materially better businesses than their better-regarded competitors.
04 / REPRESENTATIVENESS CLAIM DISCIPLINE

Sell the audit trail, price representativeness work separately

Participation stuck near 2.4% of eligible residents makes the category's founding promise essentially indefensible in front of sceptical elected members, and buyers have now started asking about it directly. Vendors that stopped claiming representativeness and instead sell a defensible record, with panels and deliberative facilitation priced separately, add roughly 35% to account value while removing the single objection that most threatens renewal. Continuing to market turnout improvement invites a comparison against actual response data that the vendor will lose every single time.

Engagement Snapshot From the Field

A live engagement with an industry participant carrying material or product regulatory and market exposure ahead of a defining policy shift, showing how our research translates into a defensible multi-year portfolio strategy.
MARKET MINDS ADVISORY · CLIENT ENGAGEMENT SUMMARY
Community Engagement Platform Producer Strategic Portfolio Review and Transition Roadmap 2026·Investment Scenario on Community Engagement Platform Exposure Evaluation 2025-26
CLIENT PROFILE
A metropolitan transport authority delivering a light rail extension with a capital value near USD 2.1 billion (client-reported, unverified by MMA), spanning eleven local government areas with separate consultation requirements and three Indigenous groups holding formal consultation rights. Statutory consultation obligations sat with the authority while several affected councils ran their own platforms and processes independently.
STRATEGIC CHALLENGE
A previous corridor decision had been successfully challenged on consultation adequacy, costing roughly nine months of programme delay and USD 34 million in financing carry (client-reported, unverified by MMA). The authority needed an evidentiary standard its legal team would defend, across eleven jurisdictions with inconsistent requirements, without waiting for each council to align its own process first.
MMA APPROACH
MMA assessed the challenge judgment to establish what evidentiary standard had actually failed, then mapped consultation requirements across all eleven jurisdictions against what candidate platforms could demonstrably record. We interviewed nine authority stakeholders, four council planning teams and two administrative law practices. Vendor evaluation was scored on record defensibility and notification evidence rather than on engagement features or user experience.
KEY FINDINGS
  1. The earlier challenge succeeded on notification evidence rather than on response volume, meaning the authority had been optimising the wrong measure entirely across its whole consultation programme.
  2. Seven of eleven councils would accept the authority's consultation record in place of their own if the evidentiary standard was documented in advance, removing most of the coordination problem.
  3. Indigenous consultation required a separate process and record entirely, and no candidate platform handled it adequately without accompanying facilitation from practitioners with standing.
  4. Platform cost was immaterial against programme risk, but three of five shortlisted vendors could not produce timestamped notification evidence in a form counsel considered admissible.
CLIENT PROFILE
A metropolitan transport authority delivering a light rail extension with a capital value near USD 2.1 billion (client-reported, unverified by MMA), spanning eleven local government areas with separate consultation requirements and three Indigenous groups holding formal consultation rights. Statutory consultation obligations sat with the authority while several affected councils ran their own platforms and processes independently.
STRATEGIC CHALLENGE
A previous corridor decision had been successfully challenged on consultation adequacy, costing roughly nine months of programme delay and USD 34 million in financing carry (client-reported, unverified by MMA). The authority needed an evidentiary standard its legal team would defend, across eleven jurisdictions with inconsistent requirements, without waiting for each council to align its own process first.
MMA APPROACH
MMA assessed the challenge judgment to establish what evidentiary standard had actually failed, then mapped consultation requirements across all eleven jurisdictions against what candidate platforms could demonstrably record. We interviewed nine authority stakeholders, four council planning teams and two administrative law practices. Vendor evaluation was scored on record defensibility and notification evidence rather than on engagement features or user experience.
KEY FINDINGS
  1. The earlier challenge succeeded on notification evidence rather than on response volume, meaning the authority had been optimising the wrong measure entirely across its whole consultation programme.
  2. Seven of eleven councils would accept the authority's consultation record in place of their own if the evidentiary standard was documented in advance, removing most of the coordination problem.
  3. Indigenous consultation required a separate process and record entirely, and no candidate platform handled it adequately without accompanying facilitation from practitioners with standing.
  4. Platform cost was immaterial against programme risk, but three of five shortlisted vendors could not produce timestamped notification evidence in a form counsel considered admissible.
RECOMMENDED STRATEGY
Phase 1: Adopt a single authority-wide platform with a documented evidentiary standard agreed with counsel before any consultation opens on the corridor. Phase 2: Negotiate record acceptance agreements with the seven willing councils, and run parallel processes only where a council genuinely requires its own. Phase 3: Commission Indigenous consultation separately through practitioners with standing, recording outcomes into the same evidence framework without forcing it through the platform.
OUTCOME
The authority completed corridor consultation across eleven jurisdictions in a single programme, with counsel confirming the evidence standard before opening. Platform and facilitation cost reached roughly USD 1.4 million against the USD 34 million carry avoided on a single further delay (client-reported, unverified by MMA). No challenge was lodged.

Frequently Asked Questions

Foundational context covering the market sizes, CAGR, scope, country, region and competition that inform every finding below. This section is provided to cover basics and most often pre-purchase conversations, answered from the MMA Primary Research Dataset.

What is the current size of the Community Engagement Platform Market?

The market was worth USD 1.4 billion in 2025 and reaches USD 1.56 billion in 2026. Roughly 63% of purchases trace to a statutory consultation obligation rather than discretionary spending.

How large will the Community Engagement Platform Market be by 2036?

MMA forecasts USD 4.51 billion by 2036, an expansion of 2.89 times over the forecast period. That represents USD 2.95 billion of incremental annual revenue against 2026.

What is the CAGR for the Community Engagement Platform Market 2026 to 2036?

The base case is 11.2% compound annual growth, with a bull case at 12.4% and a bear case at 10.0%. Local government budget conditions separate the three scenarios.

Which segment is growing fastest?

Infrastructure project and capital works engagement grows at 16.8%, half again the market rate of 11.2%. Funding and consent conditions now require documented consultation before capital can be drawn.

Who are the major companies in the Community Engagement Platform Market?

Granicus, CivicPlus, OpenGov, Zencity and Go Vocal lead on measured subscription revenue. Together they hold roughly 41%, with much of the leading position assembled through acquisition.

Which country is growing fastest?

Australia grows fastest at 15.6%, because state Local Government Acts impose explicit community engagement obligations with published strategies. Recent extensions of those duties to regional councils are widening the buyer base.

Report Segmentation Architecture

The full report scope spans multiple orthogonal segmentation dimensions, with cross-tabulated demand data provided for each dimension pair. Coverage extends further to regional breakdowns, trend trajectories, and the competitive detail needed to support segment-level decision-making.

By Primary Market Dimension

  • Statutory Consultation and Planning Participation
  • Infrastructure Project and Capital Works Engagement
  • Resident Sentiment and Feedback Analytics
  • Participatory Budgeting and Prioritisation
  • Public Meeting, Notice and Records Management
  • Emergency and Service Notification

By End-Use Industry

  • Local and Municipal Government
  • Transport and Highways Authorities
  • Water and Energy Utilities
  • Health and Care Systems
  • Education Institutions
  • Infrastructure Developers and Promoters

By Commercial Dimension

  • Direct Agency Subscription
  • Cooperative Purchasing Vehicles
  • Suite and Platform Attachment
  • Project-Based Engagement Contracts
  • Consultancy and Reseller Channels
  • Open Source Support and Hosting

By Region

  • North America
  • Western Europe
  • East Asia
  • South Asia and Pacific
  • Latin America
  • Middle East and Africa
  • Eastern Europe

Scope, Methodology, and Coverage

Every figure in this report is reproducible from documented input assumptions. The scope below maps the historical period, the forecast horizon, the segmentation dimensions, and the countries covered, alongside the underlying primary and qualitative methodology.
Historical Period
2020 to 2025
Forecast Period
2026 to 2036
Base Year
2025 (USD billions; MMA Primary Research Dataset, September 2026)
Market Definition
This market covers software platforms used by public bodies, utilities and infrastructure project owners to consult, inform and gather structured input from residents and stakeholders, spanning consultation portals, sentiment and feedback analytics, participatory budgeting, public notice and meeting records, and engagement evidence management. Revenue is measured as subscription, project engagement fees and directly attributable implementation and facilitation services. Brand and customer community software, internal employee community tools, association management systems, social media management suites and constituent relationship management platforms are excluded.
Quantitative Units
USD billions, subscription and attributable services revenue at vendor level
Segmentation Dimensions
Engagement application, end-use public sector vertical, commercial channel, region
Regions Covered
North America, Western Europe, East Asia, South Asia and Pacific, Latin America, Middle East and Africa, Eastern Europe
Countries Covered
United States, Canada, United Kingdom, Germany, France, Netherlands, Sweden, Denmark, Spain, Italy, Poland, Czechia, Australia, New Zealand, India, Singapore, Japan, South Korea, China, Brazil, Mexico, Colombia, Chile, United Arab Emirates, Saudi Arabia, South Africa
Key Companies Profiled
Granicus, CivicPlus, OpenGov, Zencity, Go Vocal, PublicInput, Polco, Konveio, Commonplace, Social Pinpoint, Balancing Act, Delib, Esri, Tyler Technologies, Accela, Rock Solid Technologies, Objective Corporation, Harvest Digital Planning, Decidim, Consul Democracy
Quantitative Methodology
Primary survey, n=3,800 respondents, Q4 2025, six countries; demand-side model with trade association cross-validation
Qualitative Methodology
47 expert interviews, Q4 2025; applied to validate demand model assumptions, identify emerging dynamics, and assess competitive positioning
Report Format
PDF and XLSX data workbook (Word format preview document)
Publisher
Market Minds Advisory
Report Code
MMA-2026-TEC-761
Published
September 2026
Contact
sales@marketmindsadvisory.com | www.marketmindsadvisory.com

Purchase the full Community Engagement Platform Market Report (2026 to 2036).

The full MMA report examines why public agencies buy consultation software for evidentiary defensibility rather than participation, and what that reframing does to product, pricing and channel strategy across the vendor field. It sizes the market to 2036 across six application segments, seven regions and 26 countries, with segment growth rates and regional demand mechanisms set out in full. Competitive analysis covers 20 participants assessed on measured subscription and project revenue, including moat and risk assessment for the two leaders. The report quantifies cost structure, customer acquisition economics and margin architecture across three portfolio tiers. It closes with four strategic verdicts and an anonymised transport authority engagement.
Six engagement application segments sized to 2036
Seven regions with demand mechanism analysis
Twenty vendors on consistent revenue basis
Customer acquisition cost benchmarks by channel
Margin architecture across three portfolio tiers
Anonymised transport authority consultation strategy engagement

Built For The People Who Decide

From boardroom strategy to bench-side execution, this report is read cover-to-cover by leaders shaping the next decade of their industry, turning demand scenarios, market dynamics and valuation benchmarks into decisions.
CXOs/ Presidents/ VPs/ Managers
M&A and Corporate Development
Strategy Teams and R&D Heads
Procurement and Product Directors
Regulatory and Compliance Leaders
Investor Relations and Equity Analysts