Market Minds Advisory
Commercial Touch Display Market

Commercial Touch Display Market: Commercial Touch Display Market. Interactive Kiosks, Point-of-Sale, and Self-Service Ordering Displays, 2026 to 2036

Retailers and restaurants racing to cut labor costs through self-service ordering are pushing commercial touch display makers to build screens that survive thousands of daily interactions without ever failing prematurely.

Lead Analyst

Published

September 2026

Make Smarter Decisions with Customized Research Insights

Request a free sample report and evaluate market opportunities, growth trends, and competitive dynamics relevant to your business needs.

2025 MARKET VALUE$9.5BMarket Size 2025
2036 FORECAST VALUE$23.3BBase Case , 2026 to 2036
CAGR 2026 TO 20368.5 %Bull 9.7% / Bear 7.3%
INCREMENTAL OPPORTUNITY$13.0BNet 10- year value creation
EXPANSION MULTIPLE2.26x2036 value over 2026 base
Strategic Levers
M&A Pipeline
Regional Outlook
Country Rankings
Competitive Intelligence
Segmental Deep-dive
Call-Us : 91 93563 13602

Executive Snapshot and Market Trajectory.

Commercial touch displays have moved from a novelty add-on in flagship retail stores into standard operating infrastructure, as labor shortages and rising minimum wages push restaurants and retailers to automate ordering and checkout functions that once required dedicated staff across nearly every shift and location worldwide today and going forward.
Self-service ordering and check-in displays are growing fastest as quick-service restaurants and airports expand kiosk deployment aggressively to reduce labor dependency and shrink customer wait times during peak demand periods across every location and operating shift throughout the day and night. North America leads regional demand given its concentration of large quick-service restaurant chains and early self-service kiosk adoption across the broader retail sector nationwide and increasingly beyond its own borders.
Competitive character increasingly centers on durability engineering and software integration flexibility rather than raw display resolution, since commercial deployments demand screens that survive thousands of daily touch interactions in high-traffic public environments that consumer-grade displays were never designed to withstand, and vendors offering genuine multi-year uptime guarantees backed by dedicated field service networks are winning a disproportionate share of new contracts signed each fiscal quarter.
Market Definition
The Commercial Touch Display Market covers ruggedized touchscreen displays deployed in interactive kiosks, point-of-sale terminals, self-service ordering stations, and digital signage across retail, hospitality, and transportation environments. It excludes consumer-grade touchscreens for personal computers and smartphones, industrial human-machine interface panels used in manufacturing control systems, and non-touch digital signage.
Base Year Value
$9.5B in 2025 (MMA Primary Research Dataset, September 2026)
Forecast Period
2026 to 2036, eleven discrete annual values
CAGR
8.5% base case. Bull 9.7%. Bear 7.3%.
Fastest Growth Segment
Self-Service Ordering and Check-In Displays: 12.0% CAGR
Fastest Growth Country
Saudi Arabia: 13.0% CAGR
Fastest Growth Region
South Asia and Pacific: 10.5% CAGR
Largest Region
North America: 30% of 2025 global value
Market Leaders
Leading vendors: Samsung Electronics, LG Electronics, Elo Touch Solutions, NCR Voyix, Sharp NEC Display Solutions. Source: MMA Primary Research Dataset, July 2026.
Primary Survey
n=3,800 procurement and R&D decision-makers, Q4 2025, six countries
Methodology
Demand-side build-up, cross-validated against public data, 47 expert interviews

Commercial Touch Display Market Forecast Scenarios

commercial-touch-display-market-size-forecast-scenario-1789995707639
Growth through 2020 to 2025 was strong as pandemic-era contactless service preferences accelerated self-service kiosk adoption across retail and hospitality, a shift that proved durable rather than temporary as labor cost pressure continued building steadily across most developed economies throughout the entire historical period and well beyond into the present decade and current fiscal year.
Base case growth through 2036 rests on three commercial mechanisms: continued quick-service restaurant kiosk rollout expanding across new markets and store formats worldwide and across every major chain, franchise operator, and independent restaurant group, rising airport and transportation self-service check-in deployment reducing staffing requirements at peak travel periods across major hub facilities, and growing retailer appetite for interactive displays that capture customer data alongside completing basic transaction functions at checkout.
A bull scenario turns on faster labor cost inflation accelerating self-service adoption across price-sensitive quick-service and retail segments that have historically resisted automation investment for smaller store formats. The bear risk is that persistent touchscreen hygiene concerns following public health events discourage some customer segments from engaging with shared touch surfaces, slowing adoption in certain demographic groups and geographic markets.

Durability Economics Behind Every Public Touchscreen

Commercial touch displays occupy a genuinely unforgiving niche in the hardware world, since a screen that fails during a lunch rush at a busy quick-service restaurant costs the operator direct revenue in a way that a broken office monitor simply never would across the entire operating day, every peak service period, every single shift the restaurant runs throughout the week, and every location in the chain.
MARKET CONCENTRATIONCR5: 38%Top five vendors hold roughly two-fifths of the market
AVERAGE UNIT PRICE$1,850Typical mid-size commercial touch display unit installed cost
TOP DEPLOYING COUNTRY SHAREUSA: 28%Reflects concentration of large quick-service restaurant chain deployments
RATED TOUCH CYCLE LIFESPAN50 million touchesTypical rated durability before performance degradation becomes noticeable
DEPLOYMENT PAYBACK PERIOD12 to 18 monthsTypical time for labor savings to offset installation cost
FIELD SERVICE CONTRACT ATTACH64%Share of installations bundled with ongoing maintenance service agreements
Vendors compete less on raw display specifications today and more on total cost of ownership across a multi-year deployment lifecycle, since buyers increasingly evaluate proposals based on field service response time and mean time between failures rather than upfront unit price alone across every location deployed nationwide, internationally, and across every franchise territory served by the broader network and its many partners.
Software integration flexibility has become a genuine purchasing criterion as retailers and restaurants increasingly demand displays that work reliably with existing point-of-sale and inventory management systems rather than requiring costly custom integration work for every new deployment location across the entire store network, franchise system, and corporate technology stack already firmly in place today across every region served.
"The vendors still pitching this as a display sale are losing to the ones pitching it as an uptime guarantee. Nobody cares about resolution when the screen goes dark during the dinner rush."
Practice Lead, Retail Technology and Interactive Hardware Research · MMA Technology Practice · September 2026

Market Trends

Self-Service Kiosk Mandates Reshape Order Flow

Quick-service chains are converting front counters into self-order kiosk banks at a pace that surprised even vendors who forecast the shift years ago, with several major US chains now reporting that more than 40 percent of in-store transactions route through a touch display rather than a cashier. The economics are blunt: a kiosk bank costs less over three years than one additional labor shift, and average order value on kiosk transactions runs 8 to 12 percent higher than counter orders because upsell prompts appear consistently every single time a customer places an order at any hour.
Market Impact: Payback cut to 14-18 months

Outdoor-Rated Displays Open Drive-Thru Retrofit Demand

Drive-thru lanes were largely untouched by the touch display wave until sunlight-readable, weatherproof panels reached a price point that made retrofit economics work, and now roughly 15,000 US drive-thru lanes are scheduled for order-confirmation display retrofits over the next two years according to franchise capital planning disclosures reviewed by MMA analysts across several major regional and national chains. Panel brightness above 2,500 nits and IP65 sealing were the two specifications that enabled this segment, since earlier indoor-rated hardware failed within months when exposed to direct sun, wind-driven rain, and seasonal temperature swings.
Market Impact: 22% of shipments reduced-contact

Market Opportunities and Growth Drivers

Labor Cost Inflation Pushes Automation Payback Faster

Minimum wage increases across roughly two dozen US states since 2023 have compressed the payback period on a self-order kiosk installation from nearly three years down to 14 to 18 months in high-wage metro markets, and operators running thin margins on individual store units treat that payback window as the single deciding factor in a capital budget review conducted each fiscal quarter by the finance team. Franchise operators facing renewal negotiations increasingly cite kiosk conversion as a condition attached to their own five-year store remodel financing packages and lender covenants.
Market Impact: Rural response 3-4x costlier per visit

Contactless Interaction Habits Formed During Prior Health Scares Persist

Consumer comfort with touching a shared public screen fell sharply during the pandemic years and never fully recovered to prior levels, which pushed manufacturers toward antimicrobial glass coatings and, increasingly, hover-sensing overlays that read a fingertip position just above the glass surface without any physical contact whatsoever from the user standing at the unit. Roughly 22 percent of new commercial touch display shipments in 2025 now include some form of reduced-contact or antimicrobial surface treatment as a standard specification rather than a premium option buyers pay extra to add on top of the base unit price.
Market Impact: Lead times stretch to 4 months

Market Restraints and Challenges

Field Service Coverage Gaps Strand Rural Deployments

A commercial touch display that fails on a Friday night in a dense metro market gets a technician on-site within hours, but the same failure at a rural location can leave a screen dark for a week because most vendors concentrate certified technicians in the top 40 metro markets where deployment density justifies the staffing cost. The root cause is simple: a rural service call costs a vendor three to four times more per visit than an urban one. Some vendors now pilot remote diagnostic modules that catch failing components early, cutting truck rolls by roughly 30 percent where deployed.
Market Impact: 40% of transactions now kiosk-routed

Component Shortages Still Ripple Through Panel Lead Times

Touch controller chips and specialty glass remain concentrated among a handful of suppliers, and a single fab disruption or glass furnace outage can push lead times on a standard 24-inch commercial panel from six weeks to four months almost overnight. The underlying cause is that commercial-grade touch panels sit behind consumer electronics in supplier production queues, since consumer volume dwarfs commercial volume and gets priority allocation during any capacity crunch. Buyers now hold 90 days of safety stock rather than the 30 days carried before 2021, and several vendors have begun qualifying a second glass supplier to avoid single-source exposure.
Market Impact: 15,000 lanes scheduled for retrofit
3 additional market trends, 4 additional growth drivers, and 3 additional restraints and challenges are covered in the full report. Contact sales@marketmindsadvisory.com to access the complete intelligence.

Segment CAGR and Growth Architecture

The market splits cleanly by display application rather than by panel technology, since procurement budgets, service contracts, and software integration work all get planned per specific use case. Six categories cover the field: self-service ordering and check-in, interactive digital signage, point-of-sale countertop units, information kiosks, meeting room collaboration panels, and drive-thru order confirmation displays.
commercial-touch-display-market-market-share-analysis-1789995708207

Self-Service Ordering and Check-In Displays

Self-service ordering and check-in displays are the category rewriting store labor models fastest, since a single kiosk bank now replaces roughly one and a half full-time cashier positions across a typical quick-service location running extended hours. Adoption started in burger and chicken chains but has spread into fast-casual dining, airport check-in counters, and hospital registration desks, each bringing slightly different durability and privacy requirements. Screen sizes have grown from 15-inch order pads to 24-inch multi-item displays as menus expanded and upsell logic became denser. Vendors now bundle payment terminals, receipt printers, and loyalty card readers directly into the kiosk housing, which raises average deal size and locks buyers into a single vendor's software stack.
CAGR 12.0%

Interactive Digital Signage Displays

Interactive digital signage spans mall directories, transit wayfinding, and retail promotional walls, and it grows fastest where operators discover a touch-enabled sign generates measurable dwell time and engagement data that a static poster never could. Retail chains increasingly treat signage displays as a data collection channel first and an advertising surface second, since anonymized interaction analytics feed directly into merchandising decisions about which promotions stop foot traffic. Screen sizes here run larger than ordering displays, frequently 43 to 65 inches, and durability requirements skew toward scratch resistance rather than the payment security certifications ordering kiosks require. Content management software revenue attached to signage now often exceeds the hardware margin itself.
CAGR 10.5%
Full segment breakdown across 6 segments available in the complete report.

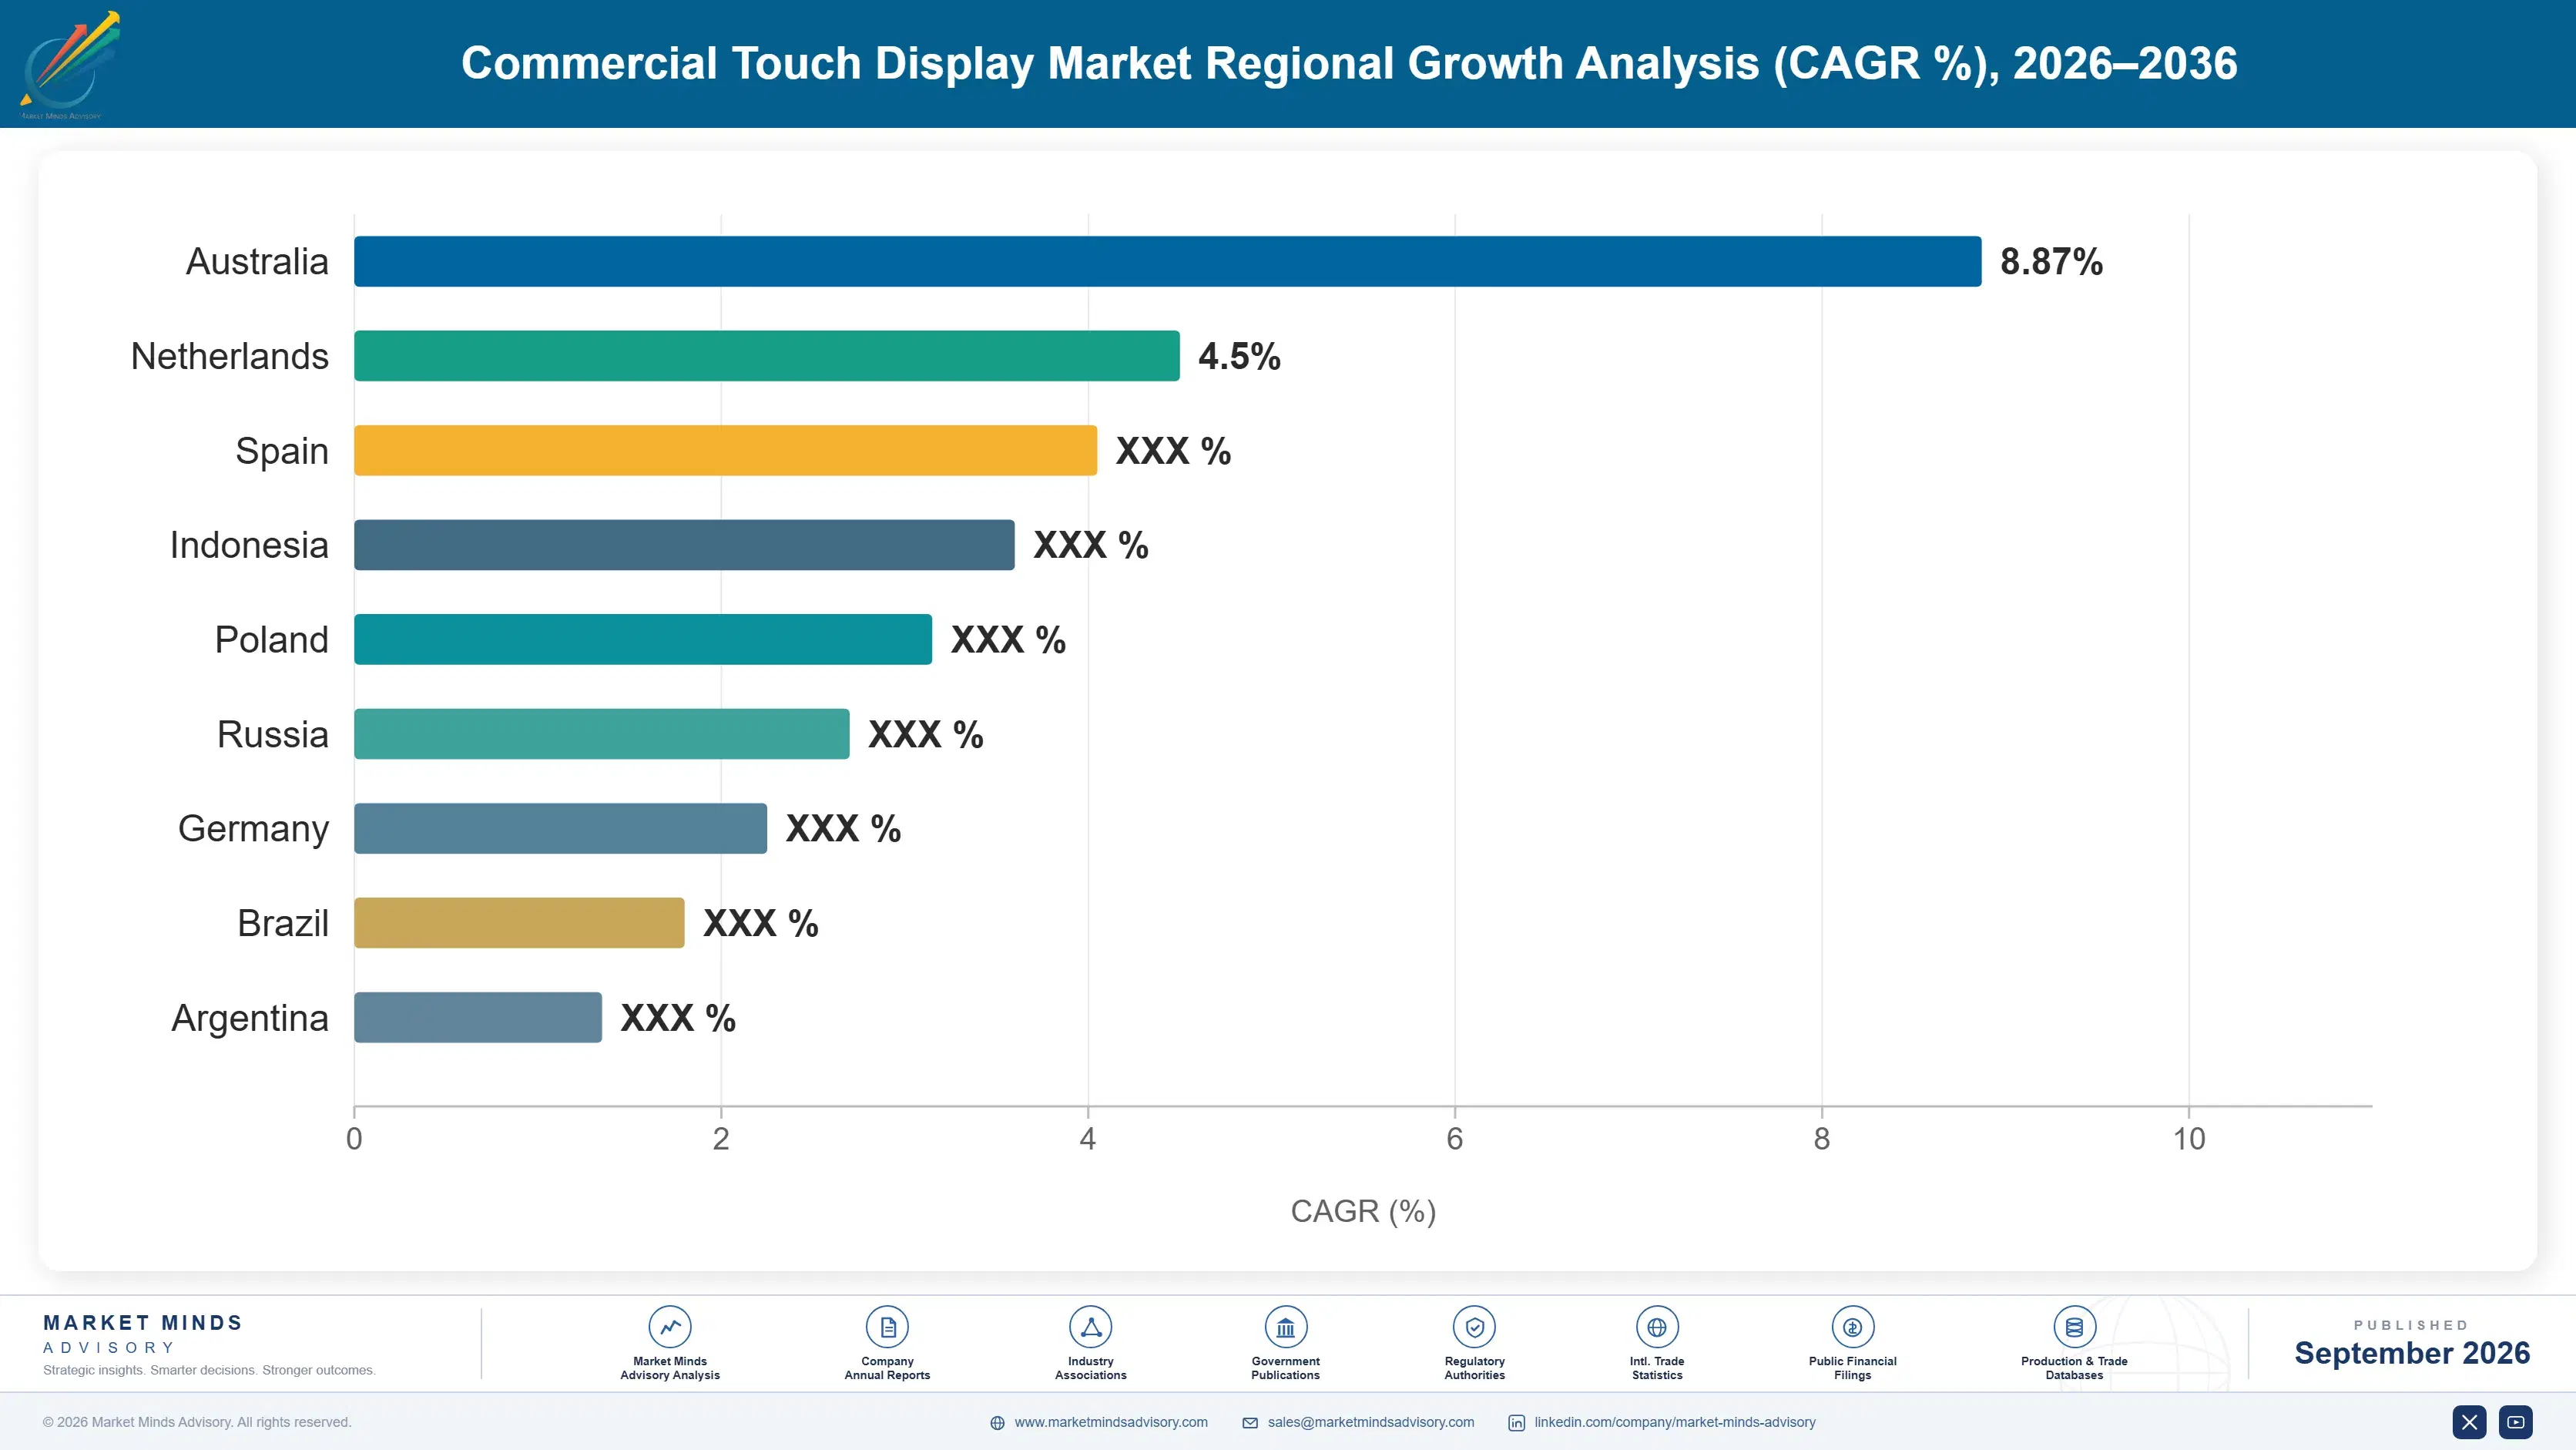
Regional Architecture and Country Demand Map

North America leads on quick-service restaurant kiosk density, East Asia leads on manufacturing scale and domestic retail rollout, and South Asia and Pacific delivers the fastest growth as airport and retail modernization programs expand across the region. Regional shares reflect deployment maturity more than population size.

North America

US quick-service chains account for the single largest concentration of commercial touch display deployments anywhere, driven by minimum wage pressure that has already pushed roughly a third of major chains past the halfway point on kiosk conversion across their entire store networks, franchise and corporate-owned alike. Canada trails on a smaller base but mirrors the same labor cost logic in its own grocery and pharmacy self-checkout expansion, particularly in Ontario and British Columbia. Airport terminal operators across both countries have separately committed to check-in and wayfinding display upgrades tied to multi-year terminal renovation budgets, adding a second demand channel beyond retail and food service that keeps utilization high even outside peak dining hours.
Share: 30% | CAGR: 9.5% (2026 to 2036)

Western Europe

Regulatory pressure around workplace conditions and a slower minimum wage trajectory than the US mean Western European kiosk adoption trails North America by roughly two years on a comparable deployment curve across most retail and food service formats. Germany and the United Kingdom lead regional volume through grocery self-checkout expansion, while France has pushed harder on transit wayfinding signage tied to public infrastructure modernization budgets rather than retail labor economics specifically. Data privacy rules under GDPR shape signage analytics deployment directly, since operators must anonymize dwell-time tracking data at the display level rather than the cloud level, adding a compliance cost and legal review step that slows rollout pace compared with less regulated markets elsewhere.
Share: 20% | CAGR: 7.0% (2026 to 2036)
Regional intelligence for 5 additional markets available in the complete report: East Asia, South Asia and Pacific, Latin America, Middle East and Africa, Eastern Europe. Contact sales@marketmindsadvisory.com.
commercial-touch-display-market-country-cagr-analysis-1789995708748

Where Margin Actually Sits in Display Deals

Hardware alone is a low-margin business in this category, so vendors capture most of their real profit through recurring service contracts, software licensing, and payment processing revenue share attached to each unit sold over its lifespan. The strongest performers treat the initial display sale as the entry point into a much longer commercial relationship with the buyer.

Bundle Field Service Contracts at the Point of Sale

Vendors that attach a multi-year service contract at the moment of initial purchase capture 3 to 4 times the lifetime revenue of a hardware-only sale, since the recurring maintenance fee typically runs 15 to 20 percent of unit price annually and renews with minimal sales effort once installed. Buyers accept the attach rate readily because downtime cost so clearly exceeds the service premium during any peak trading period. The vendors leading this motion train their initial sales team specifically to present total cost of ownership rather than unit price as the primary number in every single customer conversation.
Market Impact: Service contract attach lifts lifetime revenue 3-4x hardware-only

Monetize Signage Analytics as a Standalone Data Product

Interaction and dwell-time analytics collected from signage displays now sell as a standalone subscription in roughly 18 percent of enterprise signage deals, separate from the display hardware and content management software licenses already in the contract. Retailers pay for this data because it directly informs merchandising placement decisions that would otherwise rely on manual observation or nothing at all. Vendors report gross margin on the analytics layer running well above the margin on the underlying hardware, which explains why several are now building dedicated data science teams around this single revenue stream.
Market Impact: Analytics subscriptions now reach 18% of enterprise signage deals

Capture Payment Processing Revenue Share on Kiosk Transactions

Kiosk vendors that integrate payment processing directly into the display, rather than leaving it to a third-party terminal, now capture a small revenue share on every transaction that flows through the unit, typically 0.1 to 0.2 percent of transaction value. Across a high-volume quick-service location processing thousands of orders weekly, that share compounds into a material recurring line that dwarfs the original hardware margin within two to three years of deployment. This has pushed several vendors to acquire payment processing licenses directly rather than partnering with a third party and splitting the revenue.
Market Impact: Processing revenue share adds 0.1-0.2% of transaction value

Sell Extended Warranty Tiers Priced by Uptime Guarantee

Rather than a single flat warranty, leading vendors now offer three tiers priced explicitly against a guaranteed uptime percentage and response time commitment, with the top tier commanding a price roughly 2.5 times the base tier for a 4-hour response guarantee instead of 48 hours. High-volume operators in food service overwhelmingly select the premium tier once they calculate the revenue cost of even a single dark screen during a lunch rush. This tiering approach has lifted average warranty attach revenue per unit by a wide margin across vendors that adopted it early.
Market Impact: Premium warranty tier priced at 2.5x the base tier

Who Controls the Margin Pool

CR5 sits at 38 percent, evaluated on annual commercial touch display revenue across each vendor's full product line, which leaves this market meaningfully more fragmented than most display hardware categories. Samsung Electronics holds the clearest lead, but the gap to the second-ranked challenger has narrowed noticeably over the past three years as regional specialists win share in food service and kiosk integration.
Competitive activity today centers on software integration depth rather than panel specifications, since most vendors now source similar touch controller and glass components from an overlapping supplier base. Vendors differentiate through proprietary kiosk operating systems, remote fleet management dashboards, and service network density, with several announcing dedicated food service and retail vertical teams over the past eighteen months to sell a full solution rather than a bare display.

Emerging pressure comes from Asian panel manufacturers moving up the value chain into fully integrated kiosk hardware rather than staying as component suppliers to Western brands, a shift that could compress margins for incumbents reliant on components sourced from companies now becoming direct competitors. Rankings are most likely to shift in the drive-thru and outdoor display segment, where established leaders hold no clear technical advantage over newer specialist entrants.
commercial-touch-display-market-company-positioning-matrix-1789995709274

Competitive Moat and Risk Dimensions

SAMSUNG ELECTRONICS

Moat: Vertical Panel Supply Integration

Samsung manufactures its own display panels rather than sourcing from third parties, giving it cost and lead-time advantages competitors dependent on external glass and controller suppliers cannot match during any industry-wide component shortage. This vertical integration extends into its own commercial display software platform, letting it bundle hardware and fleet management as one contract.
SAMSUNG ELECTRONICS

Risk: Consumer Brand Overhang Risk

Samsung's commercial display division competes for internal capital and manufacturing capacity against its far larger consumer electronics business, which can deprioritize commercial-grade production runs during a consumer demand surge. Buyers in food service occasionally cite slower commercial-specific customization response as a reason for choosing a smaller, more focused competitor instead.
LG ELECTRONICS

Moat: Outdoor and High-Brightness Expertise

LG has built specific manufacturing expertise in high-brightness, sunlight-readable panels that gave it an early lead in the drive-thru and outdoor signage segment now growing fastest across the category. That specialization created a technical reputation among franchise operators that newer entrants still struggle to overcome despite competitive pricing.
LG ELECTRONICS

Risk: Narrower Software Platform Depth

LG's commercial software and kiosk operating system offering is thinner than Samsung's or the specialist kiosk vendors', pushing many of its deals through third-party integration partners rather than a direct, fully owned solution stack. That dependency slows its ability to win large multi-year fleet management contracts on its own.

Players Tracked

Prominent Players

Samsung Electronics
LG Electronics
Elo Touch Solutions
NCR Voyix
Sharp NEC Display Solutions

Other Key Players

Planar Systems
Panasonic Connect
BenQ Corporation
ViewSonic Corporation
AU Optronics
Diebold Nixdorf
Zebra Technologies
Toshiba Tec Corporation
Fujitsu Frontech
Posiflex Technology
PARTTEAM & OEMKIOSKS
Kiosk Information Systems
Advantech
Christie Digital Systems
Crystal Display Systems

Recent Developments

MARCH 2026

Elo Touch Solutions Launches Outdoor-Rated Kiosk Line

Elo Touch Solutions introduced a new outdoor-rated self-order kiosk line featuring 2,800-nit brightness and IP65 sealing, targeting the drive-thru retrofit wave that franchise operators have begun scheduling across thousands of existing lanes nationwide. The launch followed 18 months of field testing conducted jointly with two major quick-service restaurant chains.
Signal: Confirms outdoor durability specifications as the next major competitive battleground shaping kiosk hardware procurement decisions industrywide.
NOVEMBER 2025

NCR Voyix Signs Multi-Year Fleet Management Deal

NCR Voyix signed a multi-year fleet management and remote diagnostics agreement with a major grocery chain covering several thousand self-checkout and ordering displays across its national store network, bundling predictive maintenance software directly with the existing hardware installed base already deployed across every region it serves.
Signal: Shows recurring software and service revenue increasingly determines contract renewal outcomes over raw hardware specifications alone.
JULY 2025

Sharp NEC Display Solutions Opens Regional Service Hub

Sharp NEC Display Solutions opened a new regional field service hub aimed at cutting rural response times in underserved metro-adjacent markets, adding certified technicians in territories where coverage had previously routed through third-party contractors with inconsistent response times, service quality, and unpredictable pricing structures over the years.
Signal: Signals vendors are now investing directly in service coverage gaps that competitors have left largely unaddressed.

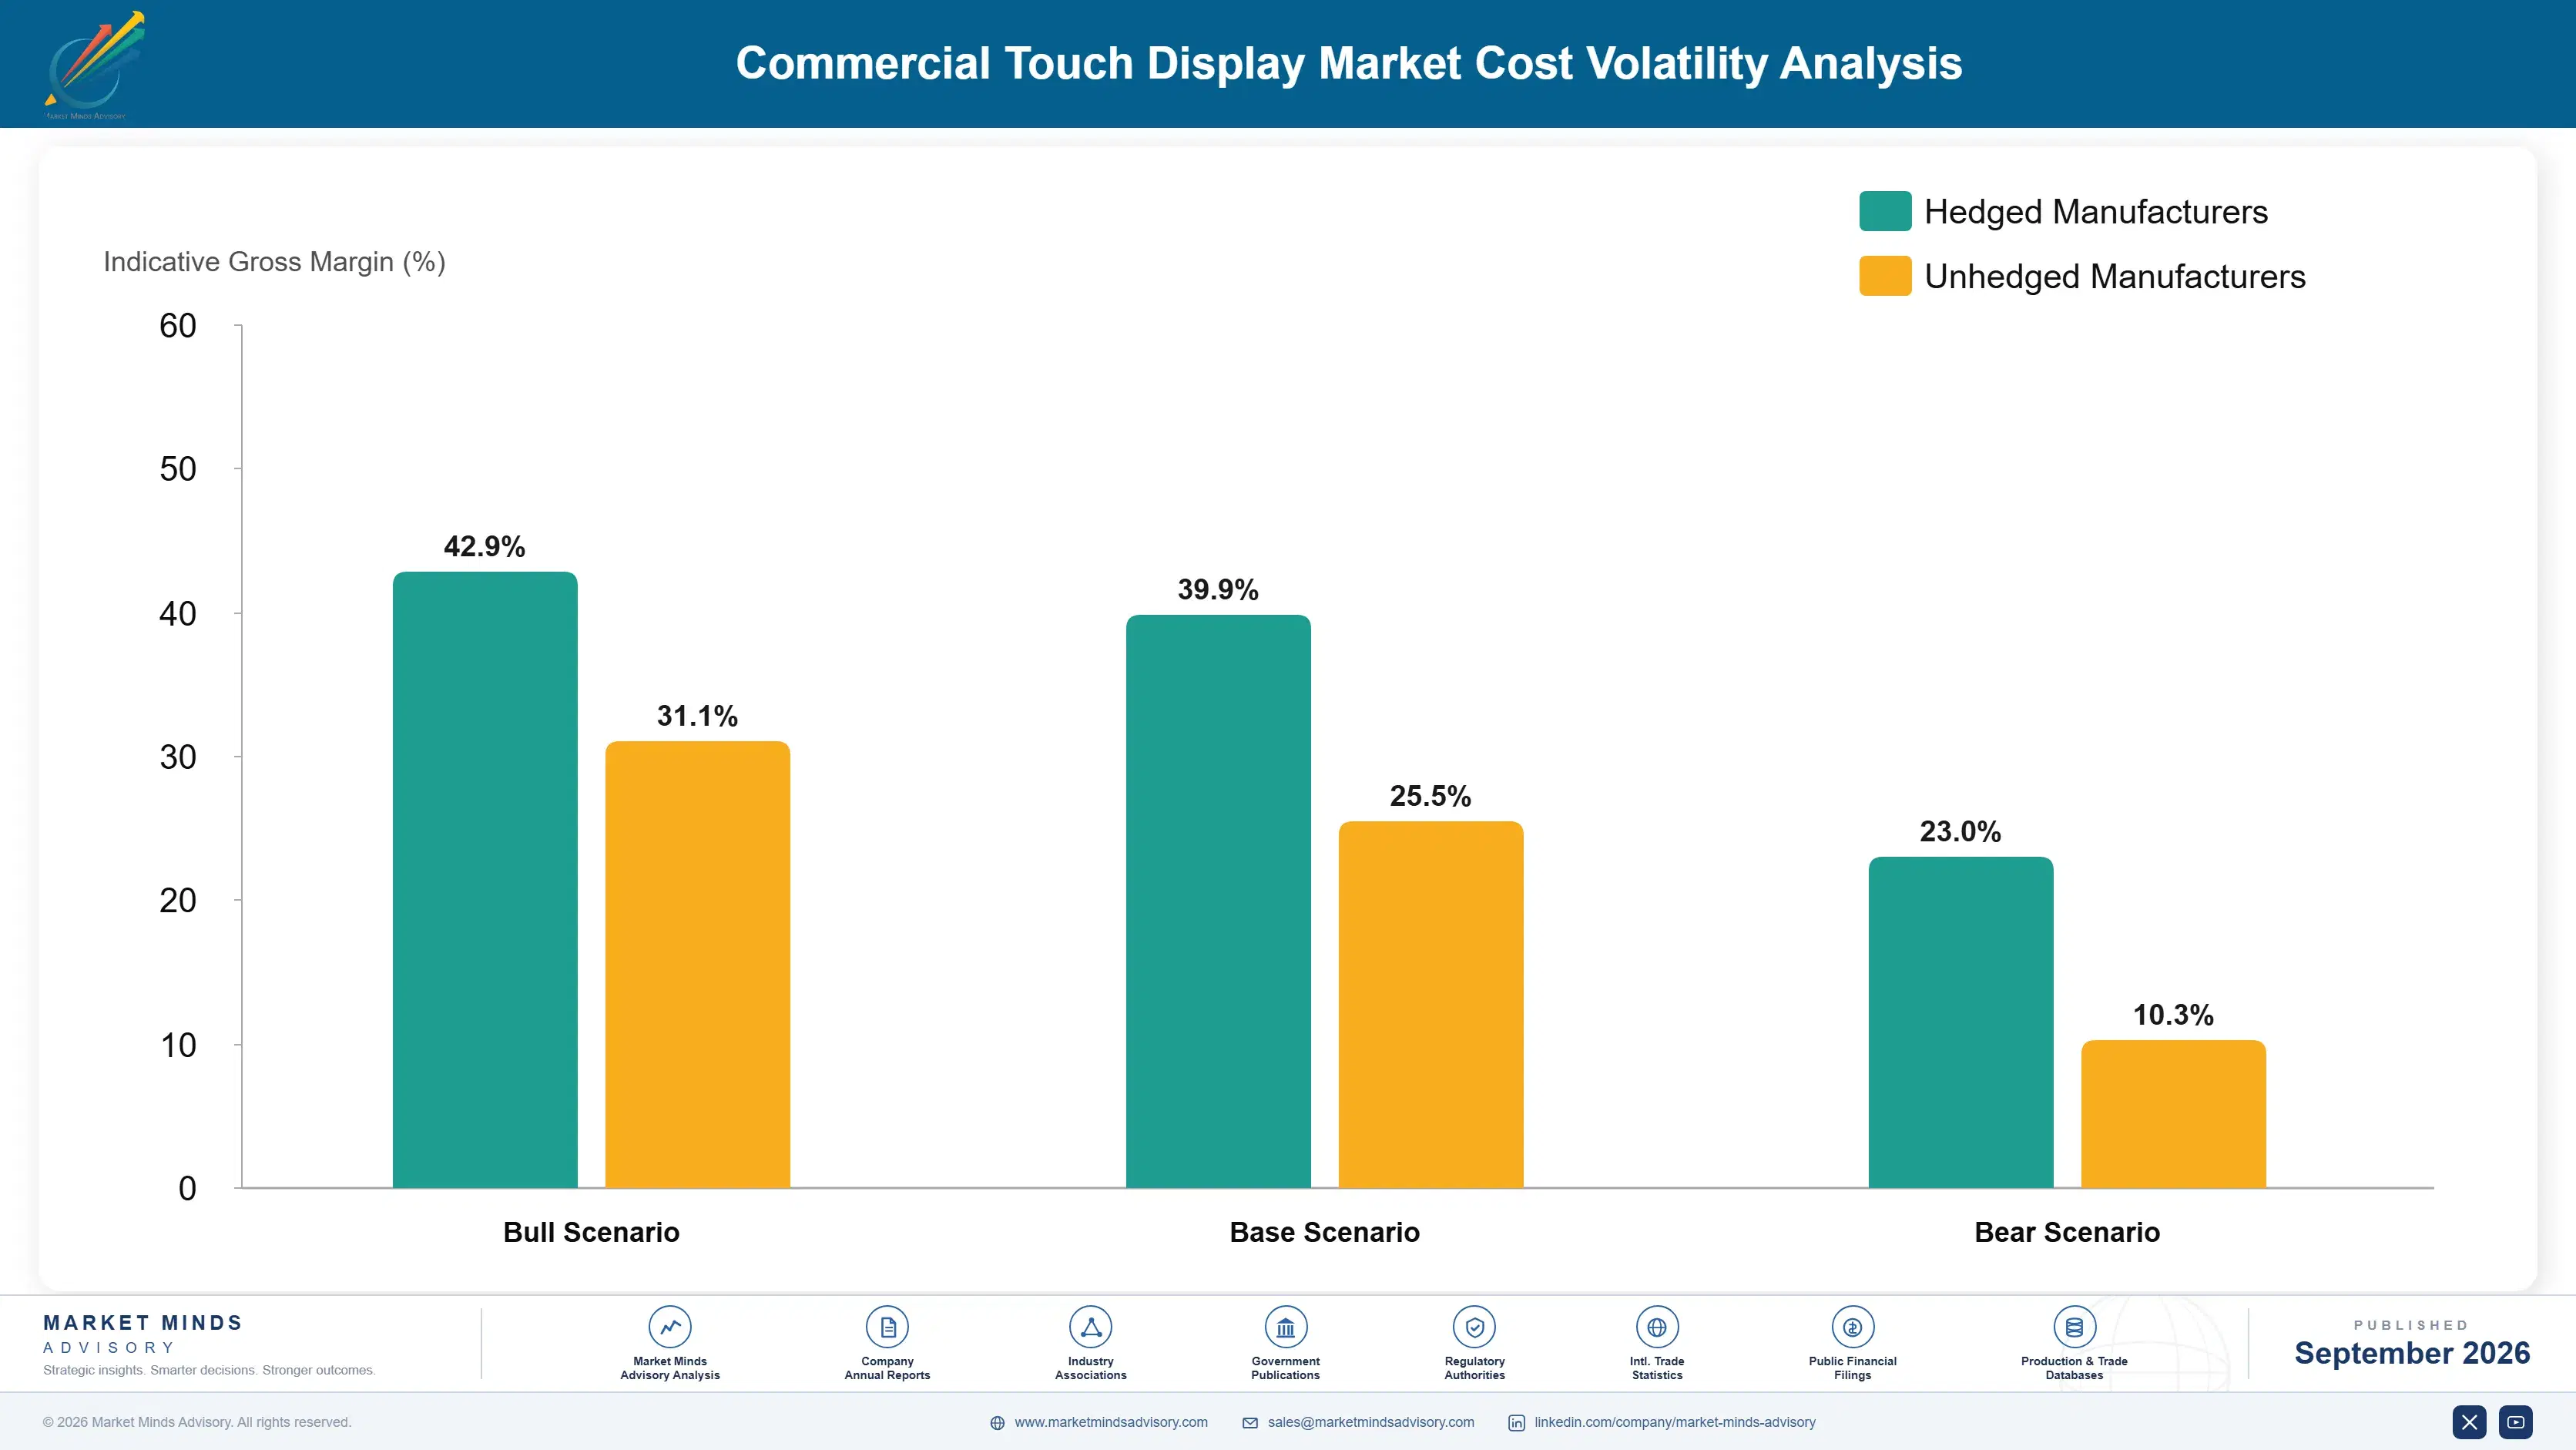
Glass and Controller Exposure in the Bill

Touch panel glass and controller chips together account for roughly 45 percent of a commercial touch display's cost of goods sold, with the remainder split across enclosure, mounting hardware, and assembly labor. Glass supply concentrates heavily in East Asia, primarily Taiwan, South Korea, and China, while touch controller chips draw on the same semiconductor foundries serving broader consumer electronics demand.
A 2024 flood at a major Taiwanese glass fabrication facility, documented in supplier disclosures reviewed by MMA analysts, cut regional cover glass output for nearly two months and pushed spot glass prices up roughly 35 percent industrywide before recovering by early 2025. Vendors without pre-negotiated long-term supply contracts absorbed the full spike directly, while larger buyers with volume agreements were largely insulated from the worst pricing swings that quarter.

Smaller vendors and regional integrators carry disproportionately more exposure to this volatility since they lack the purchase volume to negotiate multi-year fixed pricing that the largest five vendors secure routinely with glass and controller suppliers. That cost gap alone can determine which challenger survives a downturn, since a smaller player facing a 35 percent input spike often cannot pass the full cost through to price-sensitive buyers.
commercial-touch-display-market-cost-volatility-analysis-1789995709472

Qualify a Second Glass Supplier Outside the Primary Region

Leading vendors now dual-source cover glass from a second fabrication facility outside their primary supplier's home region, typically adding 8 to 12 percent to unit cost but eliminating the single-point failure risk that caused the 2024 price spike across the industry. This qualification process usually takes 12 to 18 months to complete properly and pass full validation.

Lock Multi-Year Fixed Pricing on Controller Chips

Larger vendors negotiate 2 to 3 year fixed pricing agreements directly with touch controller chip suppliers, trading a modest volume commitment for price stability that shields them from the spot market swings smaller competitors face every single quarter without such coverage or a comparable long-term contractual arrangement already firmly in place with a supplier.

Redesign Housings to Reduce Glass Surface Area

Several vendors have redesigned kiosk housings to reduce exposed glass surface area by roughly 10 percent without shrinking the active touch zone, cutting both material cost exposure and breakage-related warranty claims that previously ate into service margin significantly across every deployed unit in the field today, this year, and well into the years ahead.

Portfolio Architecture for Margin Defence

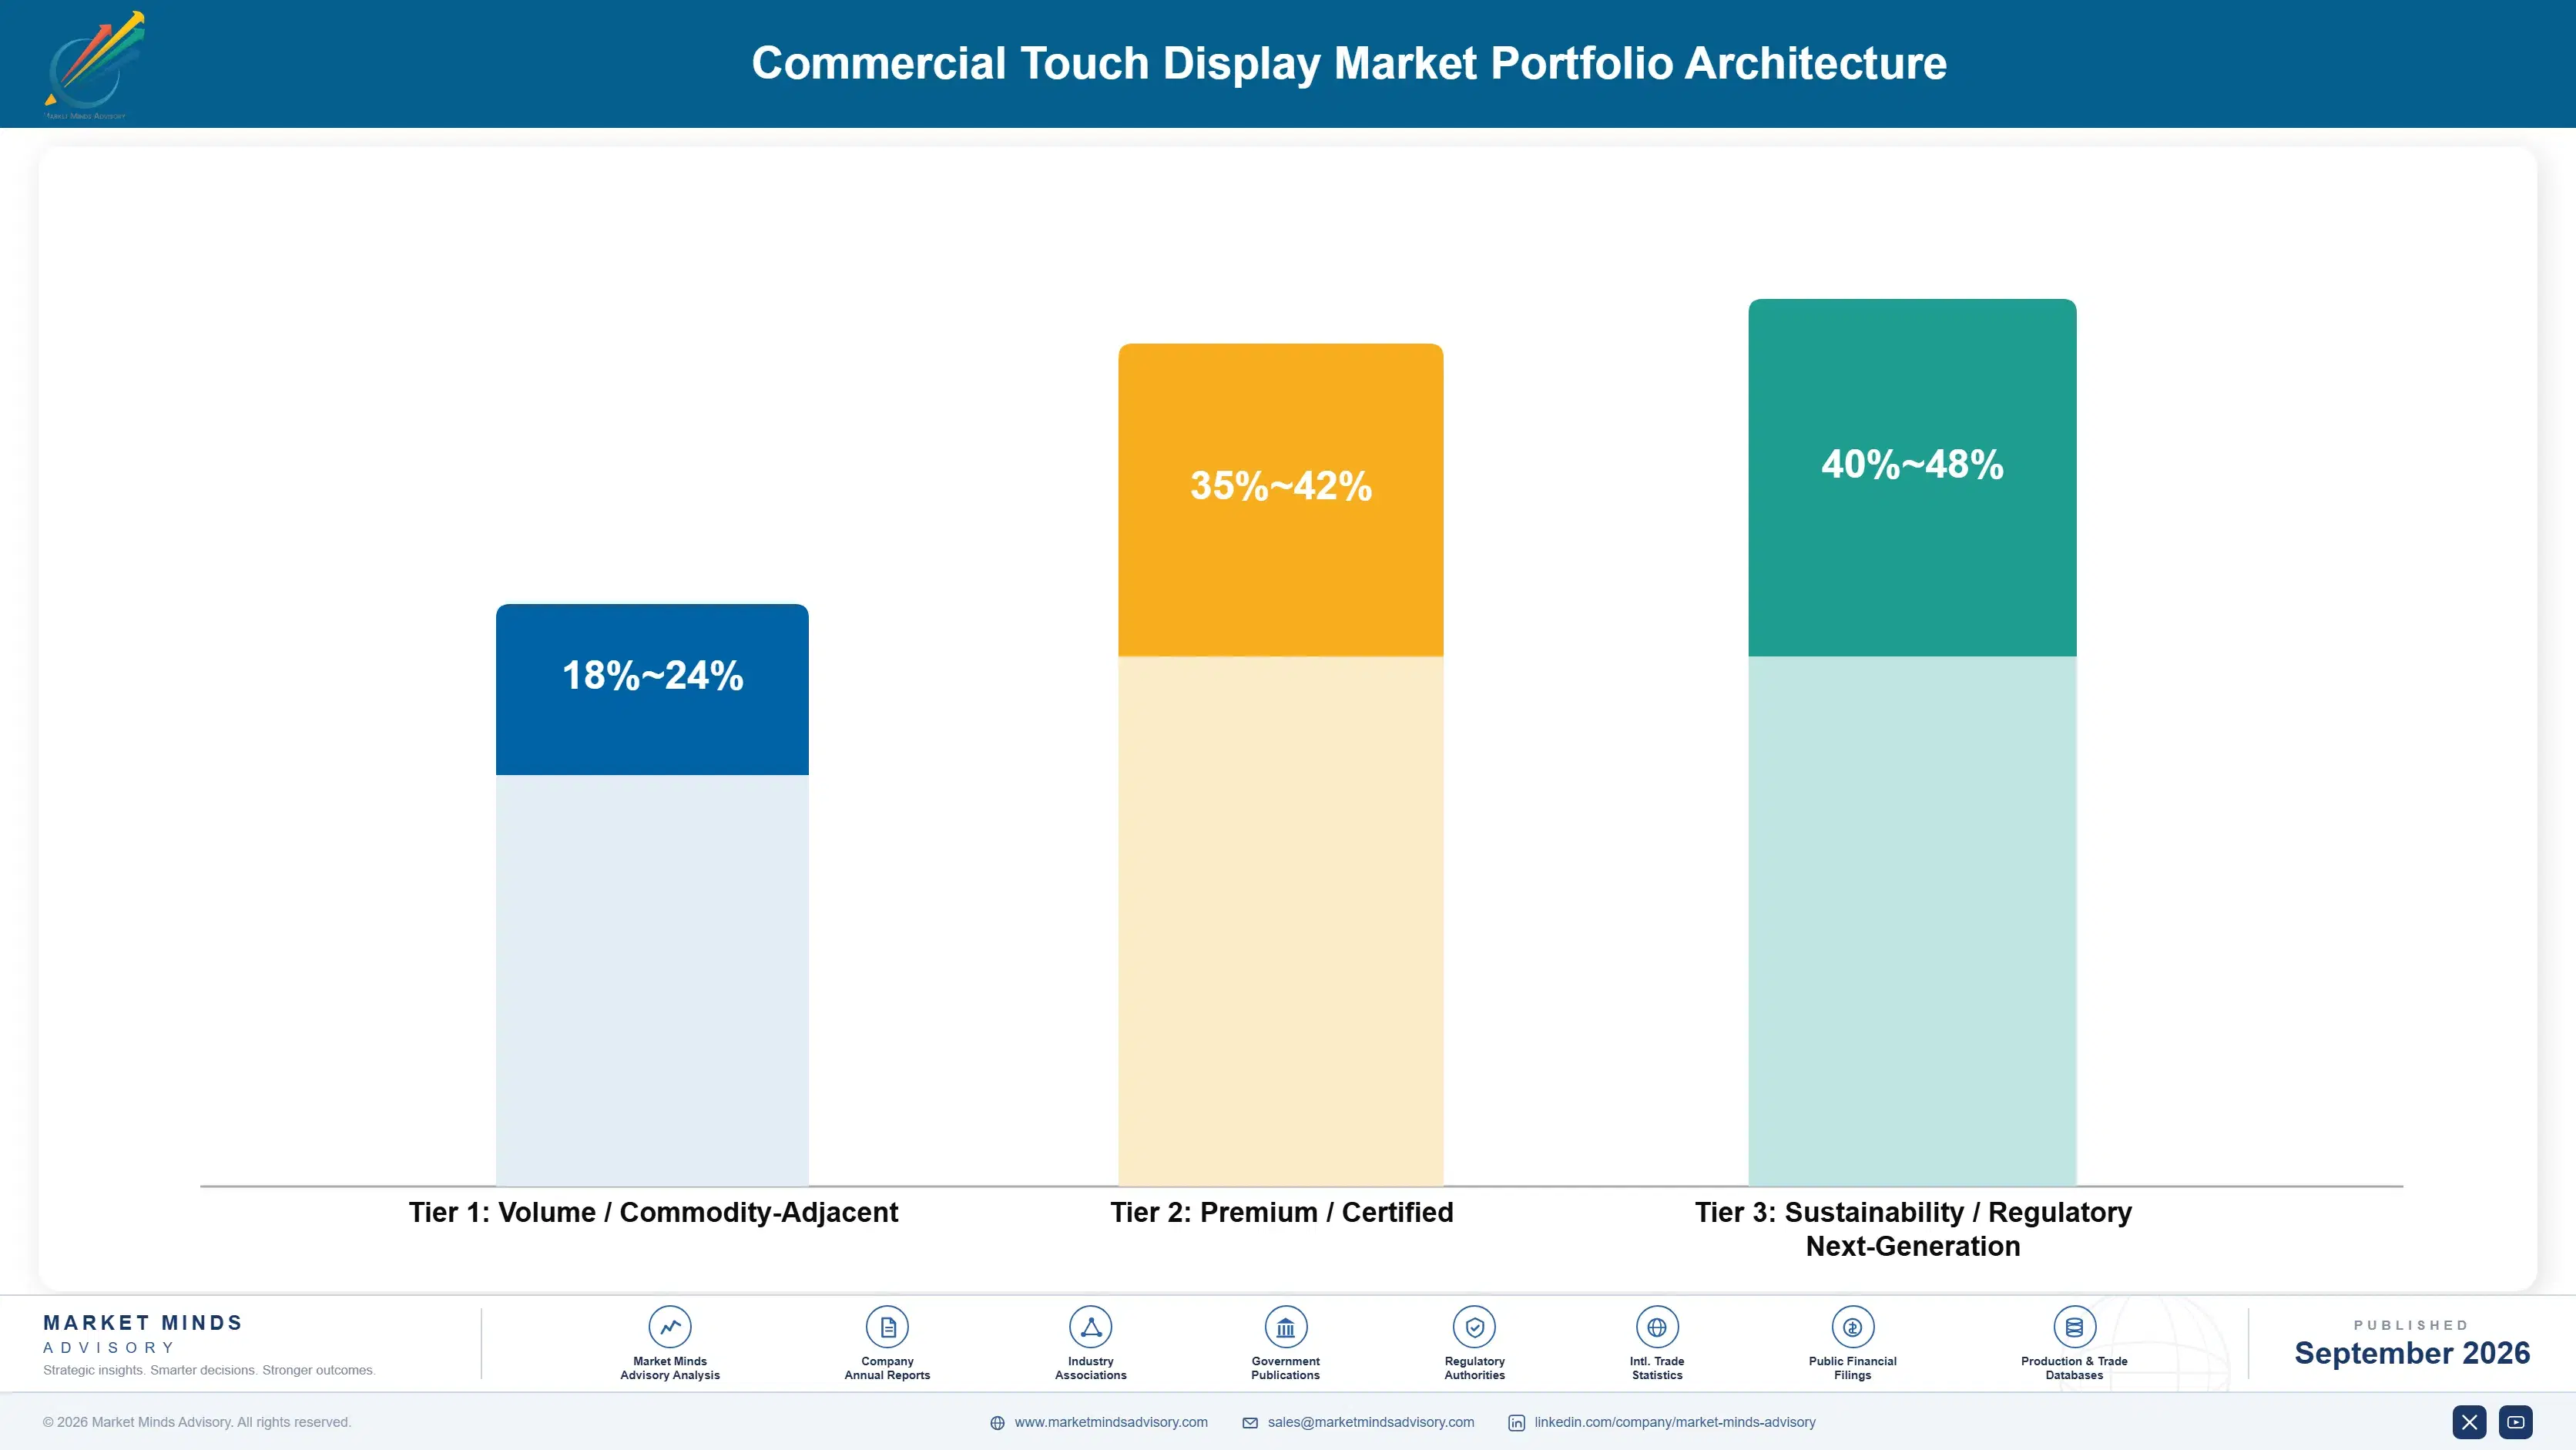
Gross margin in commercial touch displays spreads across a wide range depending almost entirely on how much software and service the vendor bundles alongside the physical panel itself. A bare commodity display sold with no service attach clears barely double-digit margin, while the same physical unit sold with a fleet management contract and analytics subscription attached can clear three to four times that same figure across its full lifespan.
Volume and premium tiers pull vendors in genuinely opposite strategic directions. Volume players compete on price and distribution reach into thousands of small independent restaurant locations, while premium players concentrate on large enterprise chains willing to pay for uptime guarantees and integrated software platforms. Few vendors execute both strategies well simultaneously, since the sales motion, service infrastructure, and underlying cost structure required for each differ substantially from one another.

High-value margin pools concentrate specifically in signage analytics, payment processing revenue share, and multi-year service contracts rather than in the hardware transaction itself, which increasingly functions as a low-margin entry point into a much larger recurring commercial relationship that unfolds over the following several years of the entire deployment lifecycle across the full contract term.

Volume / Commodity-Adjacent

Bare displays sold into small independent restaurants and retailers with minimal service attach, competing almost entirely on unit price, delivery lead time, and broad distribution reach into fragmented, price-sensitive buyer bases across many regions.
Gross Margin: 18-24%

Premium / Certified

Displays bundled with multi-year service contracts, fleet management software, and uptime guarantees sold to large enterprise chains that value total cost of ownership far more than sticker price alone at purchase.
Gross Margin: 35-42%

Sustainability / Regulatory / Next-Generation

Antimicrobial-coated, hover-sensing, and energy-efficient panel lines meeting emerging health and environmental procurement standards adopted by hospitals, airports, government facilities, and increasingly privacy-conscious retail chains seeking differentiated hardware specifications across their store networks.
Gross Margin: 40-48%
commercial-touch-display-market-portfolio-architecture-1789995709978

High-value Sub-segments and Strategic Watch-out

Signage Analytics Subscriptions

Standalone data products sold alongside signage hardware, generating the highest margin pool in the entire category and growing fastest as retailers increasingly treat interaction data as a distinct commercial asset entirely separate from advertising revenue itself, sold on its own subscription basis to merchandising teams.
Gross Margin: 44-50%

Outdoor and Drive-Thru Displays

High-value hardware commanding premium pricing for brightness and weatherproofing, growing at a strong clip as franchise operators retrofit thousands of existing drive-thru lanes over the next several years across every major regional and national quick-service chain currently operating in this fast-moving, hardware-intensive competitive space today.
Gross Margin: 38-44%

Point-of-Sale Countertop Units

The largest volume core of the market, mature and price-competitive, generating steady but unremarkable margin and facing continued commoditization pressure from lower-cost regional manufacturers entering the segment aggressively on price, delivery lead time, warranty terms, and basic feature parity across every single deployment location nationwide.
Gross Margin: 20-26%

Meeting Room Collaboration Panels

A strategic watch-out segment where hybrid work adoption trends remain genuinely uncertain, and where enterprise software vendors rather than display hardware makers increasingly capture the most valuable layer of recurring revenue from the underlying collaboration platform itself, not the physical panel it happens to run on.
Gross Margin: 15-20%

Why Displays Anchor Multi-Year Relationships

A commercial touch display purchase is rarely a one-time transaction anymore. Once a vendor's operating system, payment integration, and fleet management dashboard sit inside a chain's technology stack, switching costs rise sharply, since replacing the hardware also means retraining staff, re-certifying payment compliance, and migrating years of accumulated analytics history to a competitor's platform entirely from scratch across every single store location involved.
Stickiness varies meaningfully by end-use vertical. Quick-service restaurants show the deepest lock-in because kiosk software integrates directly with kitchen order routing systems that took months of configuration to get working correctly across every location. Retail signage buyers show moderate stickiness tied mainly to content management contracts, while airport and healthcare buyers, procuring through slower public tender cycles, show the shallowest year-to-year loyalty of any vertical tracked in this study.

Buyer profiles are shifting generationally as digital-native operations teams replace facilities managers who once treated displays as a one-time capital purchase rather than a recurring technology decision requiring ongoing vendor management, contract renegotiation, and continuous performance benchmarking against alternative suppliers entering the market with newer and often more attractively priced, software-forward offerings built for a subscription-first commercial relationship.
commercial-touch-display-market-end-use-penetration-index-1789995710472

Where to Play in Display Hardware

These are among the four positions where our research anticipates prominent divergence between winners and laggards over the coming forecast period. Each is grounded in the demand model, the regulatory perimeter, and the announced capacity pipeline.
01 / SERVICE NETWORK INVESTMENT

Build rural field service coverage before competitors close the gap

Rural response time remains the single most exploitable weakness across nearly every vendor in this category today, and it shows no sign of closing on its own. A challenger that invests early in a distributed technician network, even at a near-term cost disadvantage, can win franchise chain contracts on service reliability alone, since operators weigh downtime cost heavily against sticker price during any budget review. Waiting until the largest incumbents close that gap through remote diagnostics erases this window within roughly two to three years at most.
02 / SOFTWARE ATTACH STRATEGY

Price hardware near cost and monetize through service and data

The vendors capturing the strongest margin already treat the physical display as a low-margin entry point rather than the primary profit center in the overall commercial relationship they build with each buyer. New entrants clinging to hardware-first pricing will struggle against competitors willing to subsidize the unit sale to win the far more valuable multi-year service and analytics contract that follows shortly after installation. This shift in underlying pricing philosophy is what increasingly separates the fastest-growing vendors from the stagnant ones across the entire category today.
03 / OUTDOOR SEGMENT ENTRY

Target drive-thru retrofit demand while incumbents remain focused indoors

Outdoor and drive-thru displays represent the fastest-growing hardware category tracked in this entire study, yet most established indoor-display leaders have not yet built comparable brightness and weatherproofing expertise of their own to compete. A specialist entering now, backed by the right component sourcing relationships and field-tested designs, can establish a technical reputation before the larger incumbents redirect meaningful engineering resources toward this specific category. That window will not stay open indefinitely once margin pressure elsewhere pushes incumbents to react decisively and reallocate capital.
04 / SUPPLY CHAIN RESILIENCE

Qualify secondary glass and controller suppliers before the next disruption

The 2024 glass fabrication disruption demonstrated clearly how quickly single-source exposure can compress margin industrywide for vendors caught without any qualified alternative supplier already lined up in advance. Vendors that qualify a second supplier now pay a modest cost premium today but avoid the far larger cost of an uncontrolled price spike later during the next inevitable shortage or disruption. This single supply chain decision increasingly separates resilient, well-prepared vendors from those forced into reactive, margin-destroying pricing when disruption strikes again.

Engagement Snapshot From the Field

A live engagement with an industry participant carrying material or product regulatory and market exposure ahead of a defining policy shift, showing how our research translates into a defensible multi-year portfolio strategy.
MARKET MINDS ADVISORY · CLIENT ENGAGEMENT SUMMARY
Commercial Touch Display Producer Strategic Portfolio Review and Transition Roadmap 2026·Investment Scenario on Commercial Touch Display Exposure Evaluation 2025-26
CLIENT PROFILE
The client operates over 200 quick-service restaurant locations across five US states under a national franchise agreement, generating client-reported annual system-wide revenue of roughly $180 million (client-reported, unverified by MMA). Facing rising labor costs and inconsistent customer wait times across its footprint, ownership sought an independent assessment of whether a full kiosk conversion program justified the capital outlay across its remaining lease terms.
STRATEGIC CHALLENGE
The franchisee had received competing proposals from three hardware vendors with wildly different pricing structures and service commitments, and lacked the internal expertise to evaluate total cost of ownership beyond the sticker price on each quote. Leadership needed an independent framework for comparing vendors before committing capital across two hundred locations.
MMA APPROACH
MMA analysts built a total cost of ownership model incorporating hardware price, service contract terms, expected downtime cost per location, and labor savings under three deployment scenarios. The team conducted site visits at a representative sample of locations and interviewed regional operations managers to validate assumptions about local labor market conditions and existing point-of-sale integration constraints.
KEY FINDINGS
  1. The lowest upfront bid carried a service structure that would have cost the client roughly $2.4 million more over five years (client-reported, unverified by MMA) once downtime risk was modeled.
  2. Labor savings varied sharply by state minimum wage level, with payback periods ranging from 11 months in high-wage states to over 30 months in lower-wage locations within the same franchise system.
  3. None of the three vendors under consideration offered rural-market service coverage adequate for roughly 40 of the client's 200 locations, a gap that would have required a separate contractor.
  4. Bundling payment processing directly into the kiosk hardware, an option only one vendor offered, added a projected $410,000 in annual processing revenue share (client-reported, unverified by MMA) across the full fleet.
CLIENT PROFILE
The client operates over 200 quick-service restaurant locations across five US states under a national franchise agreement, generating client-reported annual system-wide revenue of roughly $180 million (client-reported, unverified by MMA). Facing rising labor costs and inconsistent customer wait times across its footprint, ownership sought an independent assessment of whether a full kiosk conversion program justified the capital outlay across its remaining lease terms.
STRATEGIC CHALLENGE
The franchisee had received competing proposals from three hardware vendors with wildly different pricing structures and service commitments, and lacked the internal expertise to evaluate total cost of ownership beyond the sticker price on each quote. Leadership needed an independent framework for comparing vendors before committing capital across two hundred locations.
MMA APPROACH
MMA analysts built a total cost of ownership model incorporating hardware price, service contract terms, expected downtime cost per location, and labor savings under three deployment scenarios. The team conducted site visits at a representative sample of locations and interviewed regional operations managers to validate assumptions about local labor market conditions and existing point-of-sale integration constraints.
KEY FINDINGS
  1. The lowest upfront bid carried a service structure that would have cost the client roughly $2.4 million more over five years (client-reported, unverified by MMA) once downtime risk was modeled.
  2. Labor savings varied sharply by state minimum wage level, with payback periods ranging from 11 months in high-wage states to over 30 months in lower-wage locations within the same franchise system.
  3. None of the three vendors under consideration offered rural-market service coverage adequate for roughly 40 of the client's 200 locations, a gap that would have required a separate contractor.
  4. Bundling payment processing directly into the kiosk hardware, an option only one vendor offered, added a projected $410,000 in annual processing revenue share (client-reported, unverified by MMA) across the full fleet.
RECOMMENDED STRATEGY
Phase 1: Phase 1 (Months 1 to 4): Deploy the recommended vendor's kiosks across the 60 highest-wage, highest-volume locations first to capture the fastest payback and validate integration assumptions. Phase 2: Phase 2 (Months 5 to 10): Expand deployment to the remaining metro and suburban locations while negotiating a supplemental rural service agreement to close the coverage gap identified. Phase 3: Phase 3 (Months 11 to 15): Complete rollout across remaining rural locations and activate the bundled payment processing revenue share option across the full fleet.
OUTCOME
The client selected the mid-priced vendor and completed the phased rollout roughly two months ahead of the original schedule. Reported labor cost savings across the first year of full deployment reached approximately $3.1 million (client-reported, unverified by MMA), and average order value rose measurably once upsell prompts were standardized across every kiosk in the fleet.

Frequently Asked Questions

Foundational context covering the market sizes, CAGR, scope, country, region and competition that inform every finding below. This section is provided to cover basics and most often pre-purchase conversations, answered from the MMA Primary Research Dataset.

What is the current size of the Commercial Touch Display Market?

The Commercial Touch Display Market reached $9.5 billion in base-year value in 2025, reflecting deployment across quick-service restaurants, retail signage, kiosks, and collaboration displays sold worldwide.

How large will the Commercial Touch Display Market be by 2036?

The market is projected to reach $23.31 billion by 2036, expanding roughly 2.26 times its 2026 value as kiosk conversion and signage analytics adoption continue accelerating across every major region.

What is the CAGR for the Commercial Touch Display Market 2026 to 2036?

The market is forecast to grow at a compound annual growth rate of 8.5 percent between 2026 and 2036, supported by labor cost pressure and expanding self-service adoption.

Which segment is growing fastest?

Self-service ordering and check-in displays lead all segments at a 12.0 percent CAGR, roughly 1.41 times the overall market rate, driven by quick-service restaurant labor economics.

Who are the major companies in the Commercial Touch Display Market?

Samsung Electronics, LG Electronics, Elo Touch Solutions, NCR Voyix, and Sharp NEC Display Solutions lead the competitive field, evaluated on annual commercial display revenue across all markets.

Which country is growing fastest?

Saudi Arabia leads all countries tracked at a 13.0 percent CAGR, fueled by large-scale retail and hospitality construction tied to national economic diversification programs underway.

Report Segmentation Architecture

The full report scope spans multiple orthogonal segmentation dimensions, with cross-tabulated demand data provided for each dimension pair. Coverage extends further to regional breakdowns, trend trajectories, and the competitive detail needed to support segment-level decision-making.

By Primary Market Dimension

  • Self-Service Ordering and Check-In Displays
  • Interactive Digital Signage Displays
  • Point-of-Sale Countertop Displays
  • Interactive Information Kiosks
  • Meeting Room and Collaboration Displays
  • Drive-Thru Order Confirmation Displays

By End-Use Industry

  • Quick-Service and Fast-Casual Restaurants
  • Retail and Grocery
  • Transportation and Airports
  • Healthcare and Hospitality
  • Corporate and Government Facilities

By Commercial Dimension

  • Direct Hardware Purchase
  • Hardware-as-a-Service Subscription
  • Service-Bundled Enterprise Contract
  • Systems Integrator Channel Sale

By Region

  • North America
  • Western Europe
  • East Asia
  • South Asia and Pacific
  • Latin America
  • Middle East and Africa
  • Eastern Europe

Scope, Methodology, and Coverage

Every figure in this report is reproducible from documented input assumptions. The scope below maps the historical period, the forecast horizon, the segmentation dimensions, and the countries covered, alongside the underlying primary and qualitative methodology.
Historical Period
2020 to 2025
Forecast Period
2026 to 2036
Base Year
2025 (USD billions; MMA Primary Research Dataset, September 2026)
Market Definition
The Commercial Touch Display Market covers ruggedized touchscreen displays deployed in interactive kiosks, point-of-sale terminals, self-service ordering stations, and digital signage across retail, hospitality, and transportation environments. It excludes consumer-grade personal computing touchscreens, industrial human-machine interface panels used in manufacturing control systems, and non-touch digital signage.
Quantitative Units
USD billions (current prices); unit shipment volume where applicable
Segmentation Dimensions
By Primary Market Dimension; By End-Use Industry; By Commercial Dimension; By Region
Regions Covered
North America, Western Europe, East Asia, South Asia and Pacific, Latin America, Middle East and Africa, Eastern Europe
Countries Covered
USA, China, Germany, France, UK, Japan, South Korea, India, Australia, Canada, Brazil, Mexico, Indonesia, Vietnam, Thailand, Malaysia, UAE, Saudi Arabia, South Africa, Nigeria, Turkey, Poland, Netherlands, Italy, Spain, Sweden, Switzerland, Argentina, Colombia, Singapore, and additional markets relevant to this sector
Key Companies Profiled
Samsung Electronics, LG Electronics, Elo Touch Solutions, NCR Voyix, Sharp NEC Display Solutions, Planar Systems, Panasonic Connect, BenQ Corporation, ViewSonic Corporation, AU Optronics, Diebold Nixdorf, Zebra Technologies, Toshiba Tec Corporation, Fujitsu Frontech, Posiflex Technology, PARTTEAM & OEMKIOSKS, Kiosk Information Systems, Advantech, Christie Digital Systems, Crystal Display Systems
Quantitative Methodology
Primary survey, n=3,800 respondents, Q4 2025, six countries; demand-side model with trade association cross-validation
Qualitative Methodology
47 expert interviews, Q4 2025; applied to validate demand model assumptions, identify emerging dynamics, and assess competitive positioning
Report Format
PDF and XLSX data workbook (Word format preview document)
Publisher
Market Minds Advisory
Report Code
MMA-2026-TEC-208
Published
September 2026
Contact
sales@marketmindsadvisory.com | www.marketmindsadvisory.com

Purchase the full Commercial Touch Display Market Report (2026 to 2036).

This report delivers a comprehensive assessment of the Commercial Touch Display Market from 2026 through 2036, covering sizing, segmentation, and regional demand patterns across all seven world regions tracked. It profiles twenty companies competing on hardware durability, software integration, and field service capability rather than raw display specifications alone. Readers get detailed analysis of revenue levers, input cost exposure, and portfolio margin economics specific to this hardware category and its buyers. The report closes with a strategic verdict identifying exactly where new capital should concentrate over the coming decade.
Full seven-region market sizing and forecast data
Twenty-company competitive profiling and moat analysis
Segment-level CAGR and market share breakdown
Input cost exposure and mitigation pathway analysis
Revenue lever and portfolio margin economics detail
Anonymized client case study with recommended strategy

Built For The People Who Decide

From boardroom strategy to bench-side execution, this report is read cover-to-cover by leaders shaping the next decade of their industry, turning demand scenarios, market dynamics and valuation benchmarks into decisions.
CXOs/ Presidents/ VPs/ Managers
M&A and Corporate Development
Strategy Teams and R&D Heads
Procurement and Product Directors
Regulatory and Compliance Leaders
Investor Relations and Equity Analysts