

Market Minds Advisory
Commercial Earth Observation (CEO) Market

Commercial Earth Observation (CEO) Market: Commercial Earth Observation Market: Sensing Modalities, Collection Reliability and Analytics Value Capture 2026 to 2036

Optical satellites only see when the sky is clear and the sun is up, which across most of the planet is a minority of the time. Radar sees through all of it, always.

Lead Analyst

Published

September 2026

Make Smarter Decisions with Customized Research Insights

Request a free sample report and evaluate market opportunities, growth trends, and competitive dynamics relevant to your business needs.

2025 MARKET VALUE$5.8BMarket Size 2025
2036 FORECAST VALUE$22.7BBase Case , 2026 to 2036
CAGR 2026 TO 203613.2 %Bull 14.5% / Bear 12.0%
INCREMENTAL OPPORTUNITY$16.1BNet 10- year value creation
EXPANSION MULTIPLE3.45x2036 value over 2026 base
Strategic Levers
M&A Pipeline
Regional Outlook
Country Rankings
Competitive Intelligence
Segmental Deep-dive
Call-Us : 91 93563 13602

Executive Snapshot and Market Trajectory.

This industry spent thirty years selling pictures, and the picture was never the product. Customers want an answer: is that ship where it claims to be, did the pipeline leak, how much wheat is standing in that field. Optical imagery answers only in daylight under clear sky.
The market reaches USD 6.57 billion in 2026 and USD 22.70 billion by 2036, a 3.45 times expansion at 13.2%. Synthetic aperture radar grows at 19.8%, half again the market rate of 13.2%, because only 31% of attempted optical collections come back usable. North America holds 37% of data and analytics revenue, and India grows fastest at 18.6%. Radar answers the question every time it is asked. Optical does not, and cannot.
Five operators hold 52% of data and analytics revenue. Maxar and Airbus built the high resolution optical positions decades ago on government programmes. Planet Labs took a different route entirely, flying many cheap satellites for daily global coverage. ICEYE and BlackSky arrived with radar and rapid revisit. Around 64% of what all of them sell goes to defence and intelligence buyers. That is the whole business, honestly.
Market Definition
This report covers commercially sold Earth observation data and derived analytics from satellite platforms: synthetic aperture radar imaging, hyperspectral imaging, very high resolution optical imaging, medium resolution optical imaging, radio frequency signal geolocation, and thermal and infrared imaging. It excludes government owned and operated observation programmes, satellite manufacturing and launch services, ground station hardware, airborne and drone imagery collection, and weather forecasting services sold to consumers.
Base Year Value
$5.8B in 2025 (MMA Primary Research Dataset, September 2026)
Forecast Period
2026 to 2036, eleven discrete annual values
CAGR
13.2% base case. Bull 14.5%. Bear 12.0%.
Fastest Growth Segment
Synthetic Aperture Radar Imaging: 19.8% CAGR
Fastest Growth Country
India: 18.6% CAGR
Fastest Growth Region
South Asia and Pacific: 15.4% CAGR
Largest Region
North America: 37% of 2025 global value
Market Leaders
Maxar Intelligence, Planet Labs, Airbus Defence and Space, ICEYE and BlackSky Technology lead on Earth observation data and analytics revenue. Source: MMA Analysis.
Primary Survey
n=3,800 procurement and R&D decision-makers, Q4 2025, six countries
Methodology
Demand-side build-up, cross-validated against public data, 47 expert interviews

Commercial Earth Observation (CEO) Market Forecast Scenarios

commercial-earth-observation-ceo-market-size-forecast-scenario-1789988830153
Between 2020 and 2025 the category compounded at 12.0%, and the shape of it changed more than the rate suggests. Launch costs fell far enough that a small radar spacecraft now costs around USD 4 million to build and orbit, which brought in operators who could never have afforded a place before. Pixel prices fell accordingly and value moved upward into analytics.
The base case holds 13.2% on three mechanisms. Defence and intelligence procurement across the United States, Europe and Asia keeps expanding, and around 64% of commercial sales already go to those buyers. Radar constellations reaching six hour revisit make persistent monitoring commercially practical for the first time, which opens maritime, energy and insurance applications intermittent optical never served. And methane reporting rules are creating a hyperspectral demand class that did not exist five years ago.
The bull case at 14.5% assumes analytics revenue grows faster than imagery pricing falls, which would mean operators finally capturing value above the pixel. The bear case at 12.0% is a defence procurement pause combined with continued price erosion: with 64% of revenue from one buyer type, a budget change lands directly and no commercial demand is deep enough to absorb it.

Selling Answers, Not Selling Pixels

The commercial problem with optical imagery is not resolution, it is availability. Around 31% of attempted collections come back usable, because the target has to be cloud free and sunlit at the moment the satellite passes over it. For a customer who wants to know whether a ship moved last night, an image that might arrive is not a service. Synthetic aperture radar has no such dependency and that single fact reorganised the industry.
TOP FIVE CONCENTRATION52%Concentrated by constellation capital and government contract access
CLOUD FREE OPTICAL AVAILABILITY31%Share of attempted optical collections usable over target areas
SAR REVISIT INTERVAL6 hoursTime between passes for a mature radar constellation
GOVERNMENT REVENUE SHARE64%Portion of commercial sales made to defence and intelligence
ARCHIVE IMAGERY PRICEUSD 9Per square kilometre for archived high resolution optical
SMALL SATELLITE BUILD COSTUSD 4 millionTypical small radar spacecraft including launch and commissioning
The second uncomfortable fact is who actually buys. Around 64% of commercial Earth observation revenue comes from defence and intelligence agencies, overwhelmingly American ones, purchasing through commercial contracting vehicles. That makes the demand durable, well funded and politically stable in the short run. It also means this is a government market wearing commercial clothing, and that concentration risk is severe and rarely discussed.
Value moved upward and most operators failed to follow it. Archived high resolution optical now sells around USD 9 per square kilometre, down by an order of magnitude across a decade, because a small radar spacecraft costs about USD 4 million. The margin sits in the answer rather than in the image, and the firms selling answers frequently own no satellites at all.
"Every Earth observation pitch deck opens with a beautiful image of a city at dusk. No customer has ever bought one. They buy the sentence underneath it, and most of these companies are still charging for the picture instead."
Director, Space Data and Geospatial Intelligence Practice · MMA Technology Practice · September 2026

Market Trends

Radar Displaced Optical Wherever Reliability Actually Matters

Around 31% of attempted optical collections come back usable, because the target must be both cloud free and sunlit when the satellite passes. That is adequate for mapping and useless for monitoring. Synthetic aperture radar images through cloud, smoke and darkness with no degradation whatsoever, which turns an intermittent service into a dependable one. Radar compounds at 19.8% against 13.2% for the market on that difference alone. The imagery is harder to interpret and looks nothing like a photograph, which slowed adoption for years among buyers who expected pictures. Buyers wanted photographs and got physics instead.
Market Impact: Government buyers supply 64% of revenue
Analytics Captured The Margin The Imagery Lost

Archived high resolution optical sells around USD 9 per square kilometre, an order of magnitude below where it sat a decade ago, because a small radar spacecraft costs roughly USD 4 million and a great many organisations built one. Pixels commoditised exactly as they should have. The commercial value migrated into the interpretation layer, where a vessel detection, a crop yield estimate or a methane plume attribution carries pricing unrelated to collection cost. Most constellation operators have been slow to move up, and several analytics firms with no satellites earn better margins.
Market Impact: Hyperspectral compounds at 17.4% annually

Market Opportunities and Growth Drivers

Defence Procurement Underwrites The Entire Commercial Category

Around 64% of commercial Earth observation revenue comes from defence and intelligence buyers, principally American agencies purchasing through commercial imagery contracting vehicles rather than building their own systems. European and Asian defence ministries have followed the same model, since buying commercial capacity is faster and cheaper than developing sovereign constellations. That demand expands with security spending rather than with any commercial cycle, which makes it unusually predictable. It also means the category grows and contracts on political decisions taken well outside the industry, and operators price accordingly. Nobody in the industry controls that variable at all.
Market Impact: One buyer type supplies 64%

Emissions Reporting Created A Hyperspectral Demand Class

Methane reporting requirements from the European Union and the United States Environmental Protection Agency now oblige operators to quantify emissions rather than to estimate them from activity factors, and satellite measurement is the only method that scales across dispersed infrastructure. Hyperspectral instruments detect and attribute plumes to individual facilities, which regulators and litigants both find compelling. The segment compounds at 17.4% on demand that did not exist five years ago, and the buyers are energy companies, regulators and insurers rather than anybody in defence. Regulators and litigants both find satellite measurement persuasive in a way estimates never were.
Market Impact: Optical archive fell to USD 9

Market Restraints and Challenges

Customer Concentration Is Severe And Rarely Discussed

Around 64% of commercial revenue comes from defence and intelligence agencies, and a large share of that from a single national customer buying through a handful of contract vehicles. The root cause is that no commercial application yet generates demand at comparable scale, since agriculture, insurance and energy customers pay far less per unit and buy far less often. Commercially this makes every operator's forecast a bet on one procurement decision. Mitigation runs through analytics products aimed at commercial verticals, though nobody has yet built one large enough to change the ratio.
Market Impact: Optical usable only 31% of attempts

Pixel Prices Keep Falling Faster Than Volumes Grow

Archived high resolution optical sells around USD 9 per square kilometre against roughly ten times that a decade ago, and the decline has not stopped. The root cause is that a capable small satellite now costs about USD 4 million including launch, so supply expands whenever anybody raises capital, regardless of whether demand justifies it. Commercially this erodes revenue per collection even as collection volume rises. Mitigation runs through moving up into analytics, locking multi-year government contracts at agreed pricing, and building modalities where competing supply is thinner. None of the three reverses the underlying supply expansion.
Market Impact: Archive optical fell to USD 9
3 additional market trends, 4 additional growth drivers, and 2 additional restraints and challenges are covered in the full report. Contact sales@marketmindsadvisory.com to access the complete intelligence.

Segment CAGR and Growth Architecture

Segmentation follows sensing modality, since what an instrument measures determines when it can collect, what questions it answers and what customers will pay. Six modalities cover the market: synthetic aperture radar, hyperspectral imaging, radio frequency signal geolocation, thermal and infrared imaging, very high resolution optical, and medium resolution optical. Customer vertical and delivery model are separate dimensions entirely.
commercial-earth-observation-ceo-market-market-share-analysis-1789988830743

Synthetic Aperture Radar Imaging

Synthetic aperture radar grows at 19.8%, half again the market rate of 13.2%, and the reason is reliability rather than resolution. Only around 31% of attempted optical collections come back usable, because the target must be cloud free and sunlit at the exact moment of overflight. Radar images through cloud, smoke and darkness without degradation, which converts an intermittent service into one a customer can build an operational process around. Mature constellations now revisit every six hours. The imagery looks nothing like a photograph and takes trained interpretation, which held back adoption for years among buyers who genuinely expected to receive pictures they could recognise. Physics beat photography, and it took years for buyers to accept it.
CAGR 19.8%

Hyperspectral Imaging

Hyperspectral imaging compounds at 17.4% on a demand class that did not exist five years ago. Methane reporting rules from the European Union and the United States Environmental Protection Agency now require operators to quantify emissions rather than estimate them, and satellites are the only measurement method that scales across dispersed infrastructure at reasonable cost. Hyperspectral instruments identify chemical signatures and attribute plumes to individual facilities, which regulators and litigators both find persuasive. Agricultural applications around crop stress and soil composition follow the same physics. The buyers here are energy companies, insurers and regulators rather than anybody sitting inside defence procurement. That is an entirely different customer with a different budget cycle.
CAGR 17.4%
Full segment breakdown across 6 segments available in the complete report.

Regional Architecture and Country Demand Map

North America takes 37% of data and analytics revenue, above the standard band, because American defence and intelligence agencies are the largest customer in this industry by a wide margin. Western Europe follows at 24% on a genuine commercial and institutional mix that nowhere else matches.

North America

North America holds 37% of data and analytics revenue, above the 32% band ceiling, and the mechanism is a single customer class rather than a broad market. American intelligence and defence agencies buy commercial imagery at a scale nobody else approaches, through contracting vehicles designed to substitute commercial capacity for sovereign systems. Maxar Intelligence, Planet Labs, BlackSky, Capella Space and HawkEye 360 all built their businesses on that demand. Commercial applications in insurance, agriculture and energy exist and remain small beside it. Growth at 12.6% sits below the global rate on a large established base. The concentration here is the industry's defining commercial fact. Everything else in this market sits downstream of that one fact.
Share: 37% | CAGR: 12.6% (2026 to 2036)

Western Europe

Twenty-four percent of revenue reaches Western Europe, and the demand mix here is genuinely broader than anywhere else. Airbus Defence and Space operates the established optical and radar constellations, while ICEYE built a leading radar position from Finland and e-GEOS operates from Italy. European Union emissions reporting requirements create hyperspectral and thermal demand that no other jurisdiction generates at this scale. European Space Agency and Copernicus programmes seed commercial services rather than competing with them directly. Growth at 11.8% is the slowest of any region, reflecting institutional procurement that moves on schedules fixed years in advance and rarely accelerates. Institutional demand here is broader and considerably more durable than the American concentration, even at a smaller total.
Share: 24% | CAGR: 11.8% (2026 to 2036)
Regional intelligence for 5 additional markets available in the complete report: East Asia, South Asia and Pacific, Latin America, Middle East and Africa, Eastern Europe. Contact sales@marketmindsadvisory.com.
commercial-earth-observation-ceo-market-country-cagr-analysis-1789988831317

Where Observation Revenue Actually Sits

Pixel prices fall every year, one customer type supplies most of the money, and the collection asset is no longer the scarce thing at all. Every one of the levers below responds to one of those three facts. None of them involves building a better camera, which is what this industry spent thirty years doing instead.

Sell The Detection, Not The Collection

Archived high resolution optical sells around USD 9 per square kilometre and keeps falling, because a capable small satellite costs roughly USD 4 million and supply expands whenever anybody raises money. A vessel detection, a crop yield estimate or a methane attribution carries pricing that has nothing to do with collection cost, because the customer is buying a decision rather than data. Operators who sell imagery are competing on a commodity they helped commoditise. The analytics layer requires different people and a different sales motion, which is precisely why so few constellation owners have built it properly.
Market Impact: Analytics escapes the falling USD 9 pixel floor

Build Modalities Where Supply Stays Thin

Very high resolution optical has more capacity chasing it than demand justifies, which is why pricing collapsed to around USD 9 per square kilometre. Synthetic aperture radar compounds at 19.8% and hyperspectral at 17.4%, both on far thinner competing supply and both answering questions optical physically cannot. Radar images through cloud and darkness; hyperspectral identifies chemistry. Building into those modalities costs more per spacecraft and faces a fraction of the price pressure. The industry keeps launching optical because it is familiar and because customers ask for pictures they can recognise.
Market Impact: Radar compounds at 19.8% on thin competing supply

Contract Government Demand On Multi-Year Terms

Around 64% of commercial revenue comes from defence and intelligence buyers, and the difference between a spot purchase and a multi-year capacity agreement is the difference between a business and a pipeline. Long-term contracts fix pricing above spot, guarantee volume against which capacity can be financed, and survive the annual budget conversation that kills discretionary purchases. Operators still selling imagery per collection to agencies willing to commit for years are leaving both margin and stability on the table, and financing a constellation against spot revenue is very difficult. Several operators are still trying to do exactly that.
Market Impact: Multi-year terms secure the whole 64% revenue base

Serve Commercial Verticals That Buy Repeatedly

Insurance, agriculture, energy and maritime logistics all buy Earth observation continuously rather than episodically, which is a completely different revenue profile from a defence contract that renews every few years. Individual transaction values are far smaller, at times a small fraction of a government collection tasking, and the aggregate is the only realistic route to reducing a 64% dependency on one buyer type. Serving them requires products rather than data feeds, integrated into workflows those industries already run. Nobody in this industry has yet built one at genuine scale. Products rather than data feeds are the requirement.
Market Impact: Commercial verticals dilute the severe 64% buyer concentration

Who Controls the Margin Pool

Five operators hold 52% of Earth observation data and analytics revenue, concentrated by constellation capital and by access to government contract vehicles. Maxar Intelligence and Airbus Defence and Space built high resolution optical positions across decades of institutional programmes. Planet Labs took the opposite approach with many inexpensive satellites and daily global coverage. ICEYE and BlackSky arrived later with radar and rapid revisit. All participants are assessed on Earth observation data and analytics revenue.
Competition runs on revisit rate and reliability rather than on resolution, which is a reversal of how this industry sold itself for thirty years. A customer monitoring an area wants to know what changed since yesterday, and a superb image that arrives when the weather permits does not answer that. Radar operators compete on how often they can look; optical operators increasingly compete on price.

Rankings shift on who captures the analytics layer, since imagery pricing keeps falling and interpretation pricing does not. Several firms owning no satellites earn better margins than constellation operators do. The second pressure is national capability building: Indian, Japanese and Gulf operators are entering with cost positions or sovereign backing that established players cannot answer directly.
commercial-earth-observation-ceo-market-company-positioning-matrix-1789988831851

Competitive Moat and Risk Dimensions

MAXAR INTELLIGENCE

Moat: Institutional Contract Incumbency

Maxar holds long-standing positions inside American intelligence imagery programmes built across decades and renewed repeatedly, and those relationships involve accreditation, cleared personnel and workflow integration no competitor replicates quickly. Government imagery buyers change suppliers rarely and reluctantly. The archive itself, spanning many years of consistent collection, has value no new constellation can create at any speed.
MAXAR INTELLIGENCE

Risk: Single Customer Dependency

A revenue base weighted heavily toward one national customer moves entirely on procurement decisions taken outside the company, and the 64% government share across the industry understates the concentration at this particular operator. Commercial diversification requires products and a sales organisation built for entirely different buyers. Programme restructuring removes revenue with no commercial substitute available at comparable scale.
PLANET LABS

Moat: Daily Global Coverage Archive

Planet built a constellation designed for frequency rather than resolution and has collected the whole land surface daily for years, producing a temporal archive nobody else holds. Change detection over time is a fundamentally different product from a single sharp image, and the archive gets more valuable every day. Recreating it needs a decade nobody can compress.
PLANET LABS

Risk: Optical Weather Dependency

Daily coverage still means daily attempts, and only around 31% of optical collections come back usable because targets must be cloud free and sunlit. For customers in persistently cloudy regions the promise of daily imagery is not what it appears to be. Radar operators answer that objection directly, and the company has no equivalent modality of its own.

Players Tracked

Prominent Players

Maxar Intelligence
Planet Labs
Airbus Defence and Space
ICEYE
BlackSky Technology

Other Key Players

Capella Space
HawkEye 360
Satellogic
Synspective
iQPS
Chang Guang Satellite Technology
e-GEOS
Spire Global
Umbra
Pixxel
Satellite Vu
GHGSat
Kongsberg Satellite Services
MDA Space
Ursa Space Systems

Recent Developments

APRIL 2025

ICEYE Expands Radar Constellation Toward Shorter Revisit Intervals

ICEYE added spacecraft to its synthetic aperture radar constellation to shorten revisit intervals across priority regions, an organic capacity expansion rather than an acquisition or joint venture. Radar collects through cloud and darkness without degradation, which turns an intermittent monitoring service into one customers can build operational processes around.
Signal: Revisit frequency rather than image resolution is now the specification that actually wins these contracts outright.
OCTOBER 2024

Planet Labs Extends Analytics Products Above Imagery Delivery

Planet Labs extended its analytics product range to deliver detections and change indicators rather than imagery alone, an organic product development rather than any transaction. Archived optical pricing has fallen by an order of magnitude across a decade, and commercial value migrated into the interpretation layer above collection.
Signal: Constellation operators are finally chasing the margin that firms owning no satellites have been quietly taking.
JULY 2025

Pixxel Brings Hyperspectral Constellation Capacity Into Commercial Service

Pixxel brought additional hyperspectral spacecraft into commercial service from India, an organic capacity expansion rather than a partnership or merger. Methane reporting rules in Europe and the United States require quantified emissions rather than estimates, and hyperspectral instruments attribute plumes to individual facilities in a way regulators accept.
Signal: Indian launch and build costs are creating price positions that established Western operators simply cannot match.

What Observation Capacity Costs

Spacecraft build and launch account for roughly 38% of delivered cost across a constellation's life, with a capable small radar satellite now around USD 4 million including its ride to orbit. Ground segment operation carries about 22%. Data processing and storage absorb around 18%, rising with collection volume rather than revenue. Engineering and analytics staff take the remainder.
Launch pricing fell substantially through the past decade as reusable vehicles reached regular cadence, and the effect on this industry was to lower the entry barrier rather than to improve incumbent margins. Airbus Annual Report 2024 and Planet Labs Annual Report 2024 both record capacity expansion and pricing pressure occurring together. Cloud storage pricing rose through 2023 and 2024, affecting operators holding multi-year archives more than newer entrants.

The competitive disadvantage mechanism is archive carrying cost rather than collection cost. An operator holding a decade of daily global imagery pays continuously to store and index data that mostly nobody requests, while a newer entrant carries none of that. The archive is valuable and permanently expensive, a tension the newest constellations do not face and the oldest cannot escape.
commercial-earth-observation-ceo-market-cost-volatility-analysis-1789988832048

Tier Archive Storage Against Actual Retrieval Patterns

Data processing and storage run around 18% of delivered cost and grow with collection volume regardless of what customers request. Most archive imagery is never retrieved after its first year, yet operators frequently hold everything on the same storage tier. Moving older collections to cold storage cuts that expense substantially, and almost no customer notices the difference.

Buy Launch Capacity On Committed Multi-Flight Terms

Spacecraft build and launch carry roughly 38% of constellation lifetime cost, and launch pricing varies considerably between spot bookings and committed multi-flight agreements. Constellation replenishment is predictable years ahead, since satellite design lives are known at build time. Contracting several launches together against that schedule secures both better pricing and guaranteed slots, which spot buyers routinely fail to obtain.

Share Ground Station Capacity Rather Than Building It

Ground segment operation runs about 22% of delivered cost, and a dedicated station network sized for peak downlink sits idle most of the time by design. Commercial ground station services priced per contact convert that fixed asset into a variable expense that scales with actual collection. Operators building their own networks are solving a control problem, not an economic one.

Portfolio Architecture for Margin Defence

Margin architecture separates on how much interpretation sits between the sensor and the invoice. Medium and very high resolution optical imagery earn least, competing on price at around USD 9 per square kilometre against supply that expands whenever anybody raises capital. Thermal and radio frequency products sit in the middle. Radar, hyperspectral and analytics products earn most, because each answers a question no competing supply answers as well.
The volume versus premium tension is a capital allocation problem with a five year lag built into it. A constellation ordered today flies in three years and operates for five after that, so the modality choice commits an operator well beyond any real visibility. Optical is familiar, customers ask for it and the supply is already excessive. Radar and hyperspectral cost more per spacecraft and face a fraction of the pricing pressure.

High-value pools concentrate in the analytics layer and in thin-supply modalities, and neither is reached by launching more of what an operator already flies. Analytics requires domain specialists who understand insurance, agriculture or maritime operations rather than remote sensing. Thin-supply modalities require different instruments and more capital per satellite. Both are decided years ahead of the revenue.

Volume / Commodity-Adjacent

Medium and very high resolution optical imagery sold by area at around USD 9 per square kilometre into a market with excess supply. The ten point spread separates operators with amortised constellations from those still carrying build and launch cost on recent spacecraft.
Gross Margin: 26% to 36%

Premium / Certified

Thermal, infrared and radio frequency geolocation products sold into defence and specialist commercial applications on multi-year terms. The twelve point spread tracks how much of an operator's book sits in committed capacity agreements rather than in spot collection tasking sold individually.
Gross Margin: 44% to 56%

Sustainability / Regulatory / Next-Generation

Synthetic aperture radar, hyperspectral imaging and derived analytics products, where competing supply is thin and the customer buys an answer rather than data. The fourteen point spread reflects how far each operator has moved above the collection layer into interpretation.
Gross Margin: 62% to 76%
commercial-earth-observation-ceo-market-portfolio-architecture-1789988832560

High-value Sub-segments and Strategic Watch-out

Synthetic Aperture Radar Imaging

Grows at 19.8% because only 31% of optical collections come back usable while radar images through cloud and darkness without degradation. The fourteen point spread reflects analytics depth. Mature constellations now revisit every six hours, which makes persistent monitoring genuinely practical. Reliability finally beat resolution here.
Gross Margin: 62% to 76%

Hyperspectral Imaging

Grows at 17.4% on methane reporting rules that require quantified emissions rather than estimates from activity factors. The fourteen point spread reflects attribution accuracy. Buyers here are energy companies, insurers and regulators rather than anybody in defence procurement at all. That budget behaves entirely differently.
Gross Margin: 62% to 76%

Radio Frequency Signal Geolocation

Grows at 15.6% on maritime domain awareness demand, detecting vessels that have switched off their transponders and do not wish to be found. The twelve point spread reflects constellation geometry. Almost all revenue comes from defence and coastguard buyers today. Commercial demand remains genuinely thin here.
Gross Margin: 44% to 56%

Medium Resolution Optical Imaging

Grows at 5.4%, slowest of the six modalities, against free public programme data and commercial supply that expands whenever anybody raises capital. The ten point spread separates amortised constellations from recent ones. Pricing near USD 9 per square kilometre keeps falling steadily. Nothing arrests that decline.
Gross Margin: 26% to 36%

How Observation Revenue Recurs

The annuity is the monitoring process rather than any contract. Once a customer builds an operational workflow around a data feed, whether that is weekly crop assessment or continuous port surveillance, switching supplier means revalidating every downstream model against different sensor characteristics. Radar and optical data are not interchangeable, and two radar constellations differ enough to require rework. That switching cost is technical rather than commercial, which makes it durable.
Depth varies enormously by customer type. A defence agency with cleared integration, accredited delivery and analysts trained on a specific product is effectively permanent. An insurer running catastrophe models against a historical archive is nearly as embedded, because the archive itself is the dependency. An agricultural platform buying medium resolution imagery changes supplier for a better price without hesitating.

The buyer has been shifting from an imagery analyst to a domain professional who has never opened a satellite image. An insurance underwriter wants a flood extent polygon. A commodity trader wants a storage tank fill estimate. Neither wants pixels and neither will learn to interpret them. Operators still selling to remote sensing specialists address a shrinking share of the deciders.
commercial-earth-observation-ceo-market-end-use-penetration-index-1789988833062

Where This Industry Makes Money

These are among the four positions where our research anticipates prominent divergence between winners and laggards over the coming forecast period. Each is grounded in the demand model, the regulatory perimeter, and the announced capacity pipeline.
01 / ANALYTICS LAYER CAPTURE

Charge For The Answer, Not The Image

Archived high resolution optical sells around USD 9 per square kilometre and continues falling, because a capable small satellite costs roughly USD 4 million and supply expands whenever anybody raises capital anywhere. A vessel detection, a crop yield estimate or a methane attribution carries pricing wholly unrelated to collection cost, since the customer is buying a decision rather than data. Operators selling imagery compete on a commodity they helped create, and several firms owning no satellites earn better margins than they do.
02 / MODALITY SUPPLY DISCIPLINE

Fly Instruments Nobody Else Is Flying

Very high resolution optical has considerably more capacity chasing it than demand justifies, which is exactly why pricing collapsed to around USD 9 per square kilometre across a single decade. Synthetic aperture radar compounds at 19.8% and hyperspectral at 17.4%, both on thinner competing supply and both answering questions optical physically cannot address at all. Building into those modalities costs more per spacecraft and encounters a fraction of the price pressure that familiar optical capacity now faces every single year.
03 / GOVERNMENT CONTRACT STRUCTURING

Convert Spot Tasking Into Committed Capacity

Around 64% of commercial revenue comes from defence and intelligence buyers, and the gap between a spot purchase and a multi-year capacity agreement is the gap between a pipeline and an actual business. Long-term contracts fix pricing above spot, guarantee the volume against which constellation capital can be financed, and survive the annual budget conversation that reliably kills discretionary purchases. Financing spacecraft against spot revenue is difficult, and several operators in this industry are still trying to do exactly that.
04 / COMMERCIAL VERTICAL BUILDING

Reduce The Dependency On One Buyer

Insurance, agriculture, energy and maritime logistics buy Earth observation continuously rather than episodically, which is a completely different revenue profile from defence contracts renewing every few years on political timescales. Individual transaction values are far smaller, and the aggregate is the only realistic route to reducing a 64% dependency on a single buyer type. Serving them requires finished products sitting inside the workflows those industries already run, and nobody in this industry has yet built one at genuine commercial scale.

Engagement Snapshot From the Field

A live engagement with an industry participant carrying material or product regulatory and market exposure ahead of a defining policy shift, showing how our research translates into a defensible multi-year portfolio strategy.
MARKET MINDS ADVISORY · CLIENT ENGAGEMENT SUMMARY
Commercial Earth Observation (CEO) Producer Strategic Portfolio Review and Transition Roadmap 2026·Investment Scenario on Commercial Earth Observation (CEO) Exposure Evaluation 2025-26
CLIENT PROFILE
A global marine insurer underwriting hull and cargo risk across roughly 40,000 vessels, buying optical satellite imagery from two suppliers to verify vessel positions and port congestion. Claims disputes frequently turned on where a vessel actually was on a given night, and the imagery answered that question far less often than the procurement contract implied it would. Nobody had measured how often.
STRATEGIC CHALLENGE
The claims function wanted better evidence and assumed the answer was higher resolution imagery at greater cost. Procurement was negotiating renewal on price per square kilometre, which was the only metric either supplier had offered. Neither had established the collection success rate on actual claims, and the renewal decision was scheduled before anybody could measure it properly.
MMA APPROACH
MMA reconstructed 18 months of claims requiring positional evidence and measured how often each supplier delivered usable imagery within the required window. We modelled radar alternatives against the same case set, since radar collects through cloud and darkness, and priced detection products against raw imagery delivery. The work drew on 47 expert interviews conducted in Q4 2025 with operators, analytics firms and comparable insurers.
KEY FINDINGS
  1. Optical suppliers delivered usable imagery on 29% of claim requests, close to the 31% industry rate and far below what the contract language had implied to procurement.
  2. Radar alternatives would have delivered on 91% of the same requests, because collection does not depend on cloud cover or on daylight at all.
  3. Buying vessel detections rather than raw imagery cost about 40% less per answered claim, since the insurer was paying to interpret pixels internally (client-reported, unverified by MMA).
  4. Higher resolution optical, the option claims had assumed it needed, would have changed the outcome on 2 of the 340 cases reviewed.
CLIENT PROFILE
A global marine insurer underwriting hull and cargo risk across roughly 40,000 vessels, buying optical satellite imagery from two suppliers to verify vessel positions and port congestion. Claims disputes frequently turned on where a vessel actually was on a given night, and the imagery answered that question far less often than the procurement contract implied it would. Nobody had measured how often.
STRATEGIC CHALLENGE
The claims function wanted better evidence and assumed the answer was higher resolution imagery at greater cost. Procurement was negotiating renewal on price per square kilometre, which was the only metric either supplier had offered. Neither had established the collection success rate on actual claims, and the renewal decision was scheduled before anybody could measure it properly.
MMA APPROACH
MMA reconstructed 18 months of claims requiring positional evidence and measured how often each supplier delivered usable imagery within the required window. We modelled radar alternatives against the same case set, since radar collects through cloud and darkness, and priced detection products against raw imagery delivery. The work drew on 47 expert interviews conducted in Q4 2025 with operators, analytics firms and comparable insurers.
KEY FINDINGS
  1. Optical suppliers delivered usable imagery on 29% of claim requests, close to the 31% industry rate and far below what the contract language had implied to procurement.
  2. Radar alternatives would have delivered on 91% of the same requests, because collection does not depend on cloud cover or on daylight at all.
  3. Buying vessel detections rather than raw imagery cost about 40% less per answered claim, since the insurer was paying to interpret pixels internally (client-reported, unverified by MMA).
  4. Higher resolution optical, the option claims had assumed it needed, would have changed the outcome on 2 of the 340 cases reviewed.
RECOMMENDED STRATEGY
Phase 1: Phase one: move positional verification to a radar supplier and measure the delivery rate monthly against the 91% modelled figure. Phase 2: Phase two: buy vessel detections rather than raw imagery, and stop paying analysts to interpret pixels the supplier can interpret. Phase 3: Phase three: renegotiate on delivered answers per claim rather than on price per square kilometre, which measured nothing useful at all.
OUTCOME
The insurer moved positional verification to radar and switched to detection products rather than imagery (client-reported, unverified by MMA). Evidence availability rose from under a third of claims to over nine in ten, and cost per answered claim fell materially. Procurement now specifies delivered answers rather than area purchased, which is the change that outlasted the engagement itself.

Frequently Asked Questions

Foundational context covering the market sizes, CAGR, scope, country, region and competition that inform every finding below. This section is provided to cover basics and most often pre-purchase conversations, answered from the MMA Primary Research Dataset.

What is the current size of the Commercial Earth Observation (CEO) Market?

Global value reaches USD 6.57 billion in 2026, measured as commercial Earth observation data and derived analytics revenue. The 2025 base is USD 5.8 billion.

How large will the Commercial Earth Observation (CEO) Market be by 2036?

Data and analytics revenue reaches USD 22.70 billion by 2036, an increase of USD 16.13 billion over the forecast period. That represents 3.45 times expansion from the 2026 base.

What is the CAGR for the Commercial Earth Observation (CEO) Market 2026 to 2036?

The base case runs at 13.2% annually, with a bull case at 14.5% if analytics revenue outgrows imagery price erosion and a bear case at 12.0% if defence procurement pauses.

Which segment is growing fastest?

Synthetic aperture radar imaging grows at 19.8%, half again the market rate of 13.2%. Only around 31% of optical collections come back usable, while radar images through cloud and darkness without degradation.

Who are the major companies in the Commercial Earth Observation (CEO) Market?

Maxar Intelligence, Planet Labs, Airbus Defence and Space, ICEYE and BlackSky Technology lead on data and analytics revenue, together holding 52%. Capella Space, Synspective and Pixxel hold smaller positions.

Which country is growing fastest?

India leads at 18.6%, on space sector liberalisation and launch costs that give domestic operators a position nobody in Europe or America can match. Japan and the United Arab Emirates follow.

Report Segmentation Architecture

The full report scope spans multiple orthogonal segmentation dimensions, with cross-tabulated demand data provided for each dimension pair. Coverage extends further to regional breakdowns, trend trajectories, and the competitive detail needed to support segment-level decision-making.

By Sensing Modality

  • Synthetic Aperture Radar Imaging
  • Hyperspectral Imaging
  • Radio Frequency Signal Geolocation
  • Thermal And Infrared Imaging
  • Very High Resolution Optical Imaging
  • Medium Resolution Optical Imaging

By End-Use Industry

  • Defence And Intelligence
  • Energy And Extractives
  • Agriculture And Forestry
  • Insurance And Financial Services
  • Maritime And Logistics
  • Government And Civil Administration

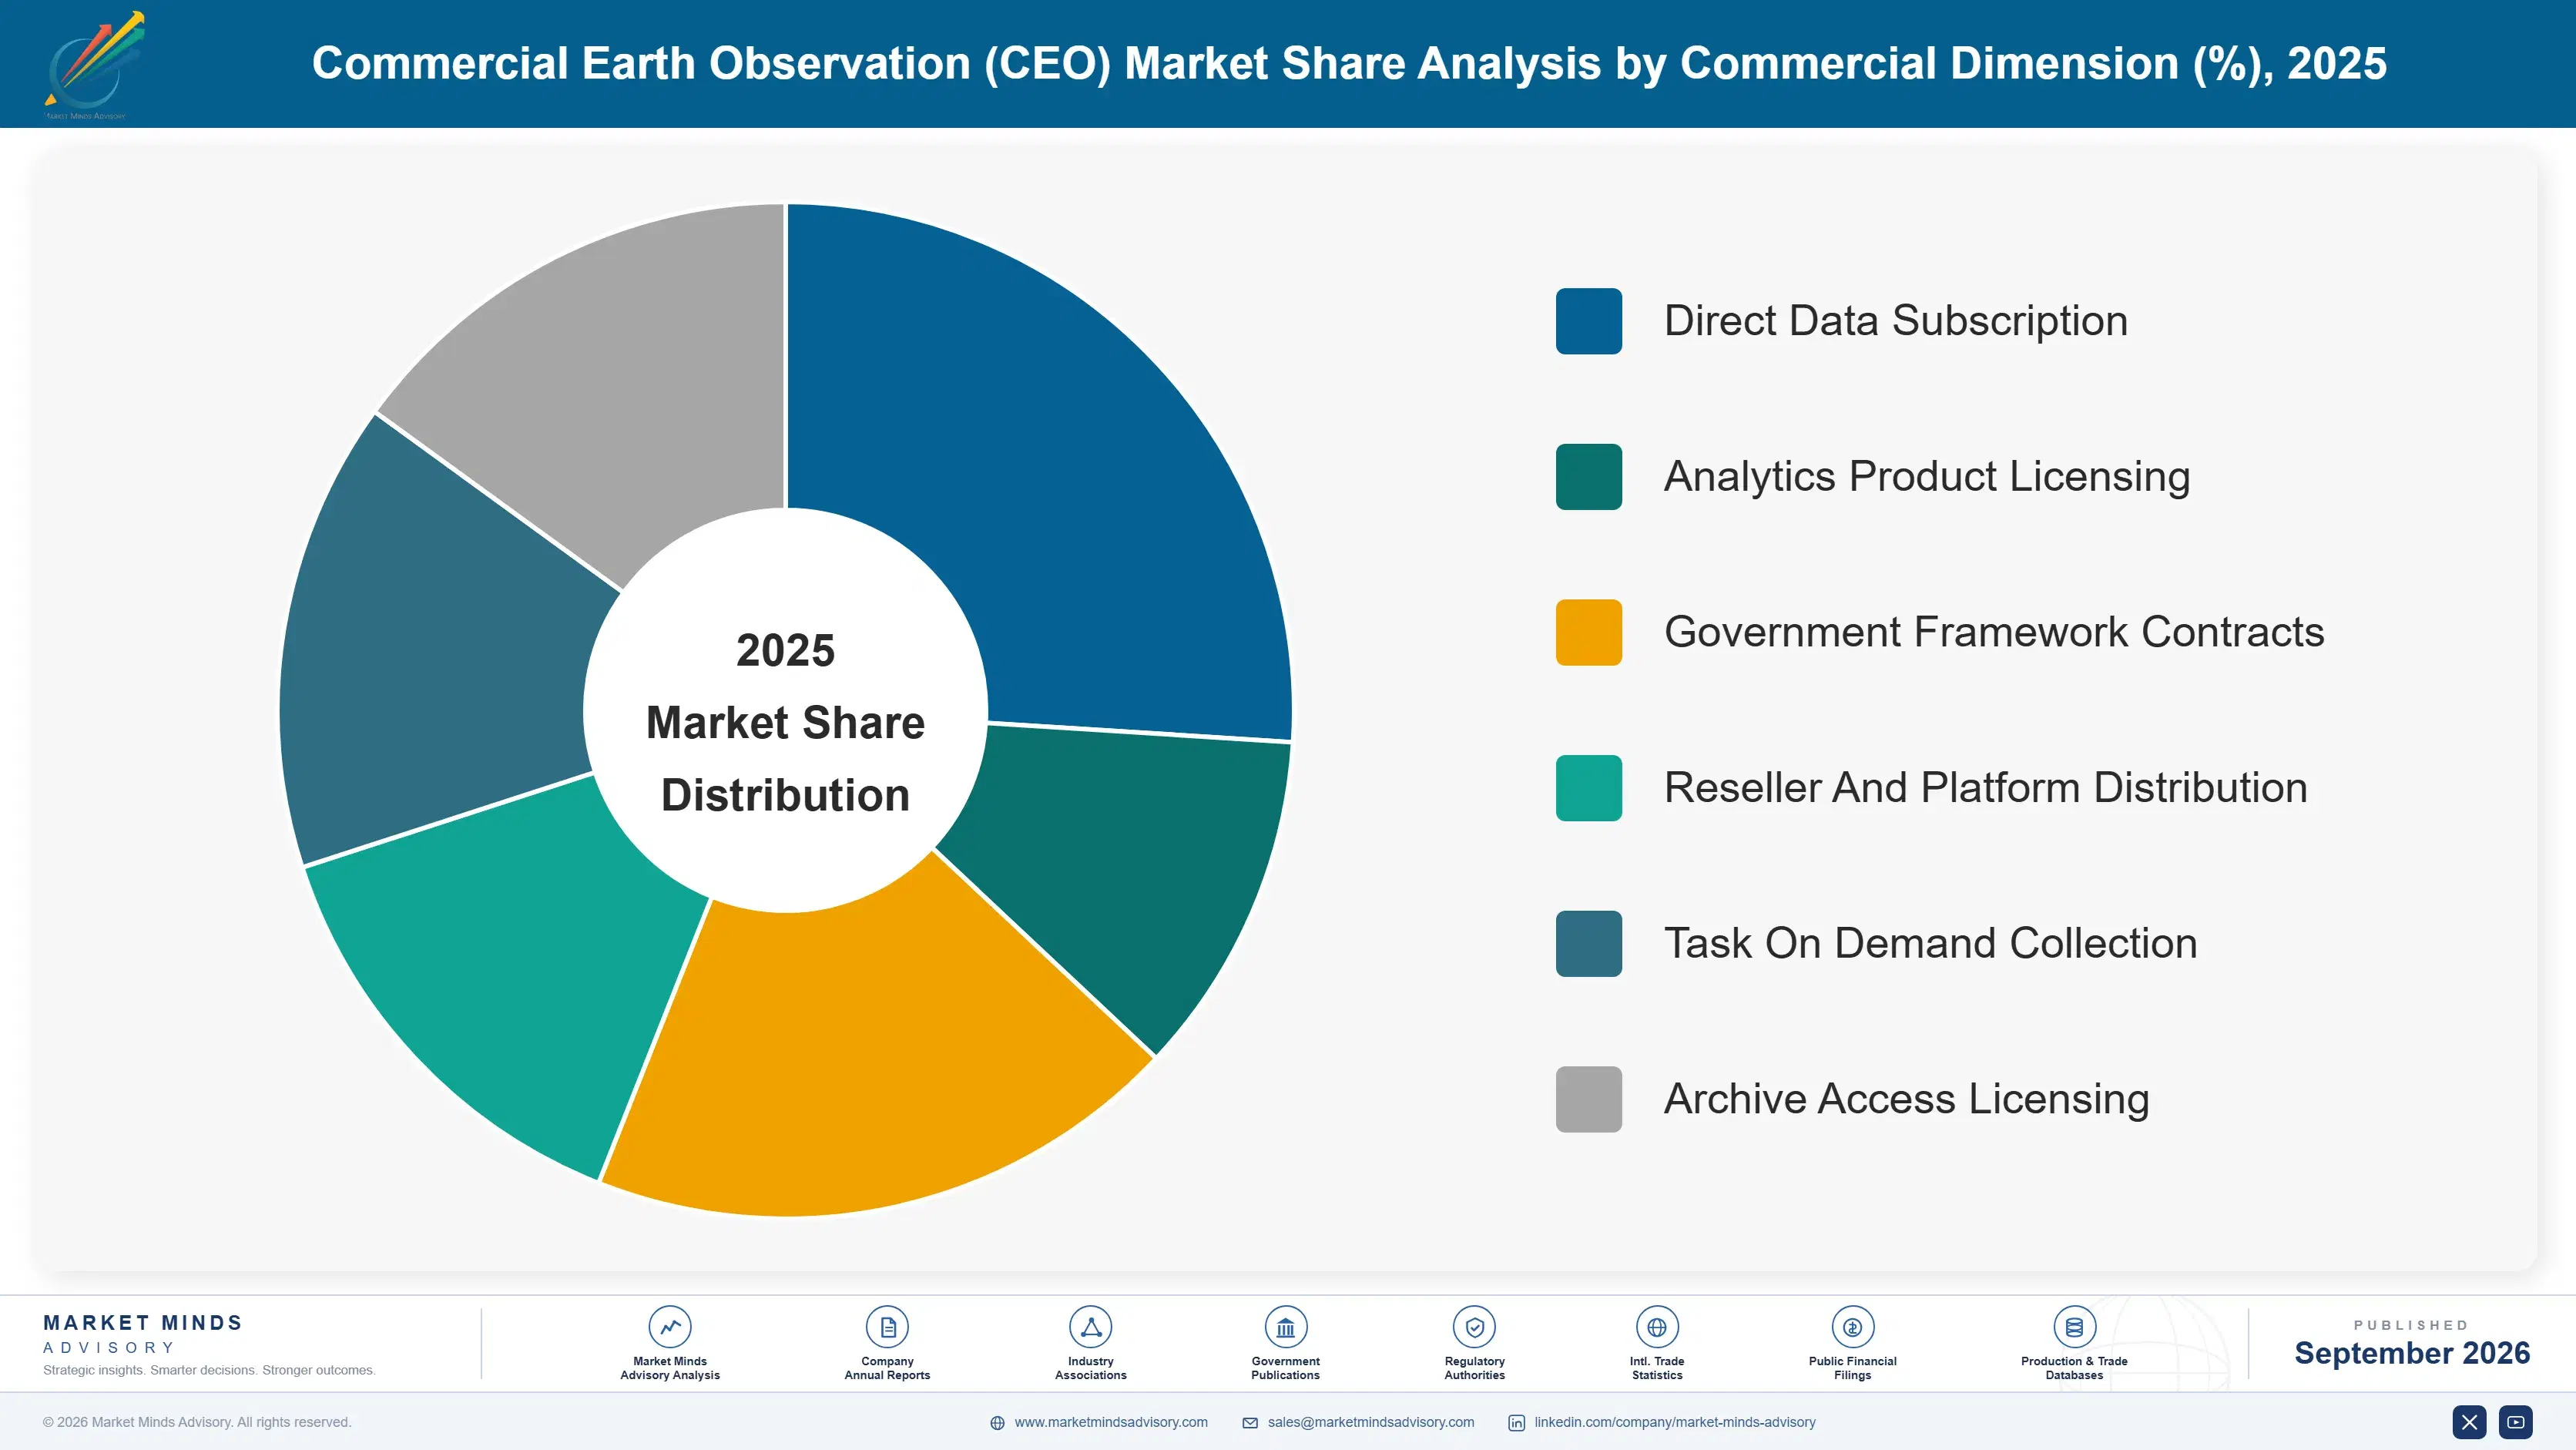
By Commercial Dimension

  • Direct Data Subscription
  • Analytics Product Licensing
  • Government Framework Contracts
  • Reseller And Platform Distribution
  • Task On Demand Collection
  • Archive Access Licensing

By Region

  • North America
  • Western Europe
  • East Asia
  • South Asia and Pacific
  • Latin America
  • Middle East and Africa
  • Eastern Europe

Scope, Methodology, and Coverage

Every figure in this report is reproducible from documented input assumptions. The scope below maps the historical period, the forecast horizon, the segmentation dimensions, and the countries covered, alongside the underlying primary and qualitative methodology.
Historical Period
2020 to 2025
Forecast Period
2026 to 2036
Base Year
2025 (USD billions; MMA Primary Research Dataset, September 2026)
Market Definition
This report covers commercially sold Earth observation data and derived analytics from satellite platforms: synthetic aperture radar imaging, hyperspectral imaging, very high resolution optical imaging, medium resolution optical imaging, radio frequency signal geolocation, and thermal and infrared imaging. It excludes government owned and operated observation programmes, satellite manufacturing and launch services, ground station hardware, airborne and drone imagery collection, and weather forecasting services sold to consumers.
Quantitative Units
USD millions, Earth observation data and derived analytics revenue basis; collected area in square kilometres; revisit interval in hours; collection success rate as a percentage; imagery price per square kilometre in USD.
Segmentation Dimensions
Sensing modality; customer industry; commercial delivery model; geography across seven regions.
Regions Covered
North America, Western Europe, East Asia, South Asia and Pacific, Latin America, Middle East and Africa, Eastern Europe
Countries Covered
United States, Canada, Mexico, Brazil, Argentina, United Kingdom, France, Germany, Italy, Finland, Spain, Poland, Estonia, China, Japan, South Korea, India, Australia, United Arab Emirates, Israel.
Key Companies Profiled
Maxar Intelligence, Planet Labs, Airbus Defence and Space, ICEYE, BlackSky Technology, Capella Space, HawkEye 360, Satellogic, Synspective, iQPS, e-GEOS, Spire Global, Umbra, Pixxel, GHGSat.
Quantitative Methodology
Primary survey, n=3,800 respondents, Q4 2025, six countries; demand-side model with trade association cross-validation
Qualitative Methodology
47 expert interviews, Q4 2025; applied to validate demand model assumptions, identify emerging dynamics, and assess competitive positioning
Report Format
PDF and XLSX data workbook (Word format preview document)
Publisher
Market Minds Advisory
Report Code
MMA-2026-TEC-471
Published
September 2026
Contact
sales@marketmindsadvisory.com | www.marketmindsadvisory.com

Purchase the full Commercial Earth Observation (CEO) Market Report (2026 to 2036).

This report sizes the global commercial Earth observation market from 2026 to 2036 across six sensing modalities, six customer industries and seven regions. It explains why only 31% of optical collections come back usable and what that does to competitive position, why 64% of revenue comes from one buyer type, and how imagery pricing fell to around USD 9 per square kilometre. Cost composition is sourced to company annual reports, with archive carrying cost analysed as the persistent constraint. Regional analysis explains why North America holds 37% while India grows at 18.6%. Competitive assessment covers 20 named operators with four revenue lever analyses.
Six sensing modalities sized through to 2036
Collection reliability modelled as the decisive commercial factor
Archive and launch cost composition from company filings
Twenty named operators assessed on data revenue
Four revenue levers with quantified commercial impact
Anonymised marine insurer sourcing engagement included in full

Built For The People Who Decide

From boardroom strategy to bench-side execution, this report is read cover-to-cover by leaders shaping the next decade of their industry, turning demand scenarios, market dynamics and valuation benchmarks into decisions.
CXOs/ Presidents/ VPs/ Managers
M&A and Corporate Development
Strategy Teams and R&D Heads
Procurement and Product Directors
Regulatory and Compliance Leaders
Investor Relations and Equity Analysts