Market Minds Advisory
Collagen Skin Matrix Market

Collagen Skin Matrix Market: Recombinant Formulations Displace Xenograft Sourcing as Reimbursement Expands

Expanding United States CMS reimbursement coverage for advanced wound care products is pulling collagen skin matrix demand toward recombinant and synthetic formulations faster than xenograft-derived producers can address disease transmission and consistency concerns.

Lead Analyst

Alice Ballenger

Published

September 2026

Make Smarter Decisions with Customized Research Insights

Request a free sample report and evaluate market opportunities, growth trends, and competitive dynamics relevant to your business needs.

2025 MARKET VALUE$1.9BMarket Size 2025
2036 FORECAST VALUE$5.3BBase Case , 2026 to 2036
CAGR 2026 TO 20369.8 %Bull 11.1% / Bear 8.5%
INCREMENTAL OPPORTUNITY$3.2BNet 10- year value creation
EXPANSION MULTIPLE2.55x2036 value over 2026 base
Strategic Levers
M&A Pipeline
Regional Outlook
Country Rankings
Competitive Intelligence
Segmental Deep-dive
Call-Us : 91 93563 13602

Executive Snapshot and Market Trajectory

Collagen skin matrices reached USD 1.9 billion in 2025, with United States CMS reimbursement expansion now the single sharpest near-term catalyst pulling wound care centers toward advanced regenerative formulations across nearly every treatment setting sold nationwide today, and adoption keeps accelerating rapidly and consistently.
Synthetic and recombinant collagen matrices grow fastest at 14.5%, about 1.48 times the overall 9.8% rate, as manufacturers eliminate disease transmission risk and consistency concerns that xenograft-derived sourcing has never fully resolved across most advanced wound care programs. North America carries an outsized regional share given reimbursement-driven demand concentration and a large chronic wound patient population, while China posts the quickest national growth as expanding healthcare infrastructure increases access to advanced wound care nationwide.
Competition sits at a concentrated CR5 of 58%, split between established medical device majors and specialty regenerative medicine companies serving wound care centers directly across multiple continents worldwide today and increasingly across export markets too and steadily each year. Reimbursement coverage and clinical evidence depth are the two forces deciding which manufacturers keep winning formulary placement as providers weigh cost against healing outcome data and long-term safety.
Market Definition
The collagen skin matrix market covers collagen-based dermal and skin substitute products, including sheet, sponge, gel, bilayer, xenograft-derived, and synthetic recombinant formulations used in burn treatment, chronic wound care, and surgical reconstruction. It excludes non-collagen synthetic skin substitutes and standard wound dressings without a collagen matrix component.
Base Year Value
$1.9B in 2025 (MMA Primary Research Dataset, August 2026)
Forecast Period
2026 to 2036, eleven discrete annual values
CAGR
9.8% base case. Bull 11.1%. Bear 8.5%.
Fastest Growth Segment
Synthetic and Recombinant Collagen Matrices: 14.5% CAGR
Fastest Growth Country
China: 12.5% CAGR
Fastest Growth Region
South Asia and Pacific: 11.8% CAGR
Largest Region
North America: 42% of 2025 global value
Market Leaders
Integra LifeSciences Holdings, Organogenesis Holdings, Smith & Nephew plc, MTF Biologics, Mölnlycke Health Care. Source: MMA Analysis based on company annual reports.
Primary Survey
n=3,800 procurement and R&D decision-makers, Q4 2025, six countries
Methodology
Demand-side build-up, cross-validated against public data, 47 expert interviews

Collagen Skin Matrix Market Forecast Scenarios

collagen-skin-matrix-market-size-forecast-scenario-1787465077243
Between 2020 and 2025 the market grew near 8.8% annually as advanced wound care adoption expanded steadily across most developed healthcare markets worldwide today and quite consistently following broader reimbursement policy support and expansion. Recombinant collagen technology matured rapidly late in the period, pushing adoption beyond specialty burn centers into mainstream chronic wound care settings.
The base case carries the market to 9.8% through 2036 on three mechanisms. First, expanding CMS and private insurer reimbursement coverage keeps pushing advanced collagen matrix products into treatment settings that previously relied on standard wound dressings. Second, recombinant and synthetic collagen technology keeps eliminating disease transmission concerns that limited xenograft-derived product adoption among safety-conscious providers and patients. Third, Chinese healthcare infrastructure investment keeps expanding, adding volume for collagen matrix suppliers serving that developing market.
The bull case reaches 11.1% if additional major healthcare markets finalize reimbursement expansion faster than currently scheduled, accelerating advanced wound care adoption across broader patient populations. The bear case falls to 8.5% if reimbursement policy tightens amid healthcare cost containment pressure, a pattern already visible in several markets that have periodically restricted coverage for premium regenerative products.

A Xenograft-Dependent Category Shifting Toward Recombinant Sourcing

Collagen skin matrices spent decades defined almost entirely by xenograft-derived sourcing, extracted from bovine or porcine tissue with the disease transmission and consistency concerns that animal-derived materials inevitably carry across nearly every clinical application. That framing has genuinely shifted as recombinant and synthetic collagen production technology pull manufacturing into a category that used to depend on animal tissue supply chains almost exclusively.
MARKET CONCENTRATIONCR5: 58%Split between medical device majors and regenerative specialists
AVERAGE SELLING PRICEUSD 200 to 4,500 per unitReflects wide gap between basic and advanced formulation grades
TOP PRODUCING REGION SHARENorth America: 42%Driven directly by United States reimbursement policy coverage
CAPACITY UTILISATION65% to 75%Reflects a growing category with expanding production investment
FEEDSTOCK SHARE OF COGS30% to 40%Bovine and porcine collagen sourcing drives cost structure
REPLACEMENT CYCLE LENGTHN/A, single-use clinical productReflects per-procedure consumption rather than periodic replacement cycles
Commercially, the category increasingly rewards clinical evidence depth and reimbursement navigation capability over pure manufacturing scale alone today. A manufacturer capable of delivering published healing outcome data alongside secured reimbursement codes can command meaningfully higher formulary placement than one selling generic collagen matrix products, since wound care providers increasingly specify evidence-backed formulations rather than accepting generic supplier claims.
Over the next decade, the pace of reimbursement policy expansion and recombinant collagen technology maturation will decide how quickly synthetic formulations become the category's dominant sourcing method rather than a secondary alternative to xenograft-derived products sold today. Manufacturers with proven recombinant production capability already validated across multiple clinical programs are positioned to capture that expansion first regardless of how quickly individual national reimbursement policies finalize.
"Providers used to accept that collagen matrices came from animal tissue and that was simply the cost of doing business. Now recombinant technology exists, and the interesting question is how fast reimbursement catches up to the safer option."
Director, Advanced Wound Care Practice · MMA Advanced Wound Care and Regenerative Medicine Practice · August 2026

Market Trends

Recombinant Collagen Production Scales Beyond Pilot Programs

Medical device manufacturers are increasingly commercializing recombinant collagen production at clinical scale rather than confining the technology to research and pilot programs, driven by regulatory pathways that increasingly favor synthetic formulations over animal-derived materials carrying inherent disease transmission risk. This shift follows years of bioprocessing development proving that recombinant collagen can match the structural and healing properties of xenograft-derived material at commercially viable production cost. Organogenesis and Integra LifeSciences have both expanded recombinant production capacity specifically to serve this transition, reflecting how thoroughly this shift has reshaped manufacturer commercial strategy.
Market Impact: Expands coverage across 3 payer categories
Chinese Healthcare Infrastructure Expands Advanced Wound Care Access

Chinese hospitals and specialty wound care centers have expanded advanced collagen matrix adoption substantially to serve the country's aging population and rising diabetic wound prevalence, driven by both government healthcare infrastructure investment and growing clinical awareness of regenerative wound care options across most major urban centers nationwide. This adoption is beginning to attract international manufacturers seeking distribution partnerships, even as domestic Chinese producers retain an advantage in cost-competitive standard formulations requiring less regulatory validation. International manufacturers are increasingly winning premium segment contracts specifically on clinical evidence and reimbursement navigation grounds.
Market Impact: Adds 6% annual patient population growth

Market Opportunities and Growth Drivers

CMS Reimbursement Expansion Drives Formulary Adoption

United States CMS reimbursement policy has expanded coverage for advanced collagen matrix products across an increasing range of chronic wound and surgical reconstruction applications, following a multi-year trend of Medicare coverage determinations recognizing the clinical and economic value of regenerative wound care compared to prolonged conventional treatment. This coverage expansion forces advanced collagen matrix adoption into treatment settings and patient populations that previously relied entirely on standard wound dressings. Providers serving multiple payer types increasingly standardize on reimbursement-covered formulations across their full patient population rather than maintaining separate protocols for covered and uncovered patients, simplifying clinical workflow considerably.
Market Impact: Adds 12 to 24 months delay

Rising Diabetic Wound Prevalence Expands Treatment Population

Diabetic wound prevalence keeps rising steadily across most developed and developing healthcare markets worldwide, creating incremental collagen matrix demand that exists largely independent of the reimbursement policy debates constraining growth in some jurisdictions entirely and quite consistently overall. This demand is scaling directly alongside global diabetes prevalence growth, giving collagen matrix manufacturers a genuine volume tailwind independent of traditional surgical reconstruction volume cycles entirely. Manufacturers with established chronic wound care distribution relationships validated across multiple healthcare systems are capturing this incremental content ahead of competitors still developing comparable market access.
Market Impact: Adds 8 to 15 months lead

Market Restraints and Challenges

Reimbursement Policy Uncertainty Constrains Investment Planning

Reimbursement coverage for advanced collagen matrix products varies considerably across payers and remains subject to periodic policy revision, creating planning uncertainty for manufacturers investing in clinical evidence generation and production capacity years ahead of eventual coverage decisions. The root cause is the genuine difficulty regulators and payers face balancing healthcare cost containment against the economic case for regenerative treatments that reduce long-term care costs but carry higher upfront pricing. This restricts investment planning particularly for smaller manufacturers lacking diversified revenue across covered and uncovered segments. Larger manufacturers are diversifying across multiple national reimbursement systems to manage this exposure more predictably.
Market Impact: Cuts disease transmission risk to 0%

Bovine and Porcine Sourcing Faces Supply Chain Scrutiny

Xenograft-derived collagen sourcing from bovine and porcine tissue faces increasing supply chain traceability requirements tied to disease transmission prevention protocols, forcing manufacturers to document animal sourcing origin across a supply chain that historically operated with limited upstream visibility beyond the immediate tissue processor relationship. The root cause is the genuine, if statistically rare, disease transmission risk that regulators have documented in animal-derived medical materials across multiple product categories over several decades. This restricts sourcing flexibility for manufacturers dependent on xenograft-derived materials. Several manufacturers are accelerating recombinant technology adoption specifically to address this traceability burden directly.
Market Impact: Adds 9 new specialty wound centers
3 additional market trends, 4 additional growth drivers, and 3 additional restraints and challenges are covered in the full report. Contact sales@marketmindsadvisory.com to access the complete intelligence.

Segment CAGR and Growth Architecture

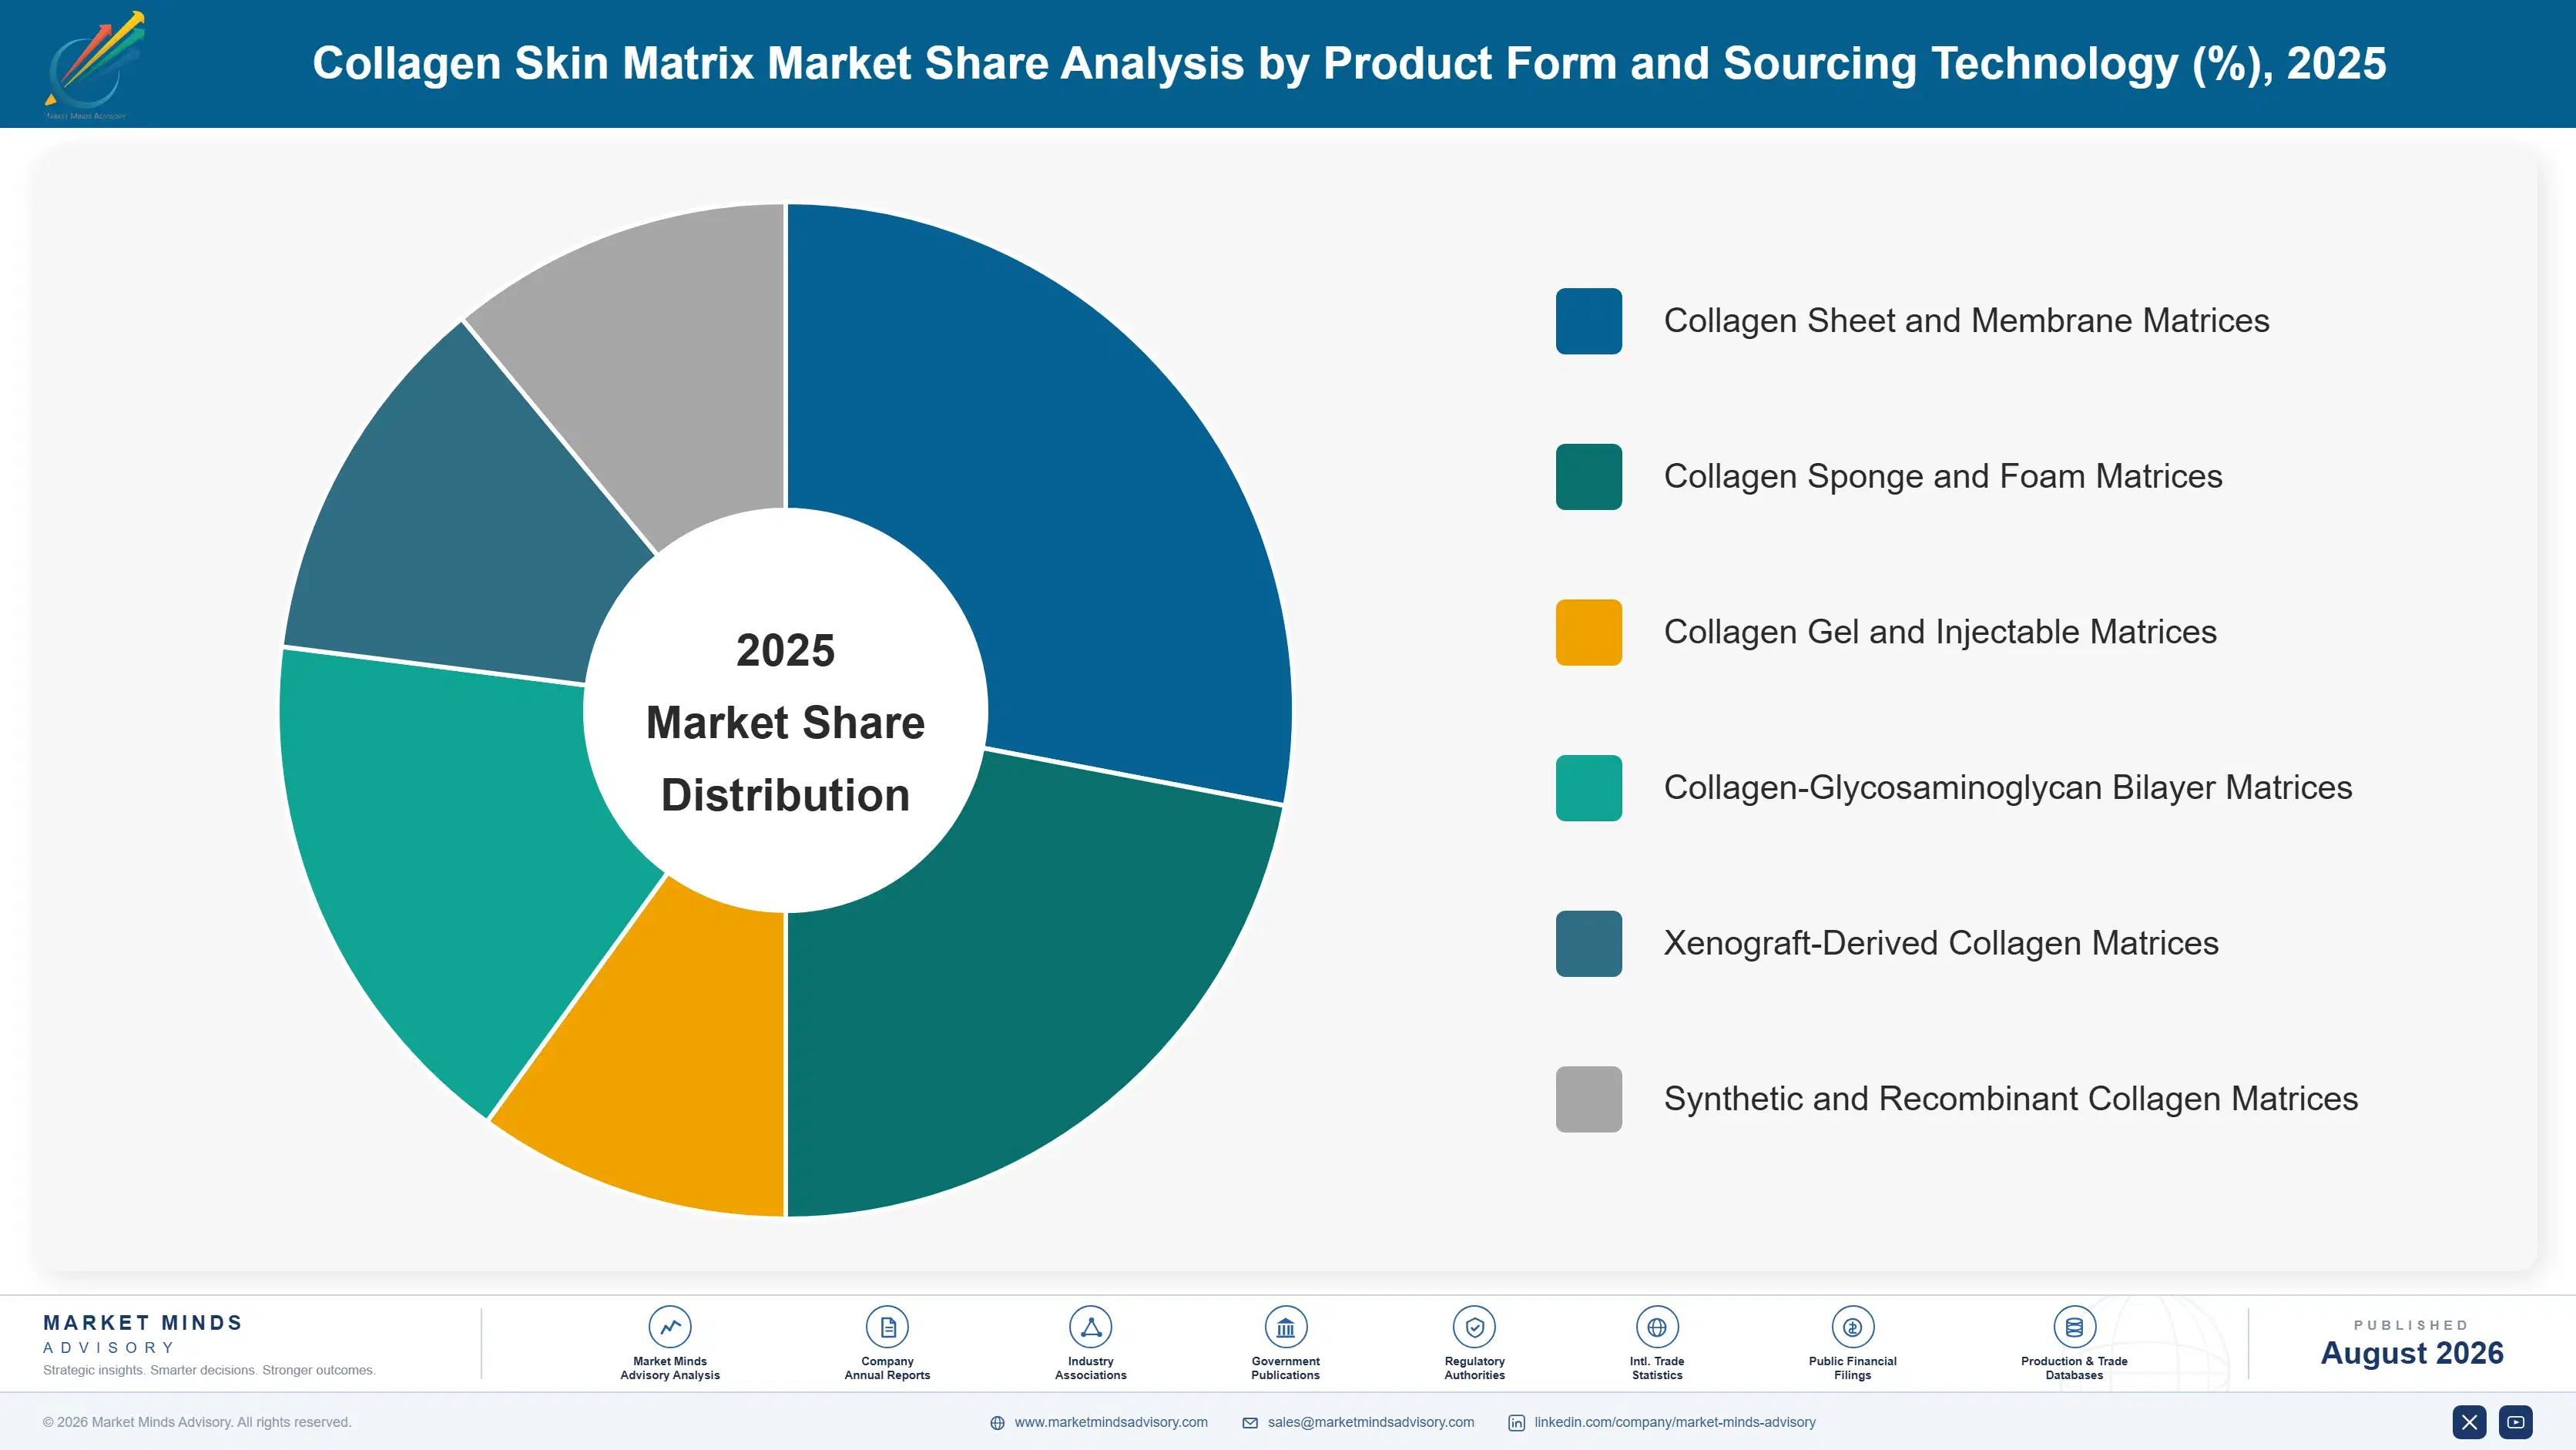
Segmentation follows collagen matrix product form and sourcing technology, a single classification dimension shared across every collagen product sold into global wound care and reconstructive surgery platforms worldwide today. Each product form carries distinct sourcing, cost, and clinical application characteristics, so commercial position tracks the underlying formulation itself rather than the specific treatment setting or geography it serves.
collagen-skin-matrix-market-market-share-analysis-1787465077776

Synthetic and Recombinant Collagen Matrices

Synthetic and recombinant collagen matrices grow fastest at 14.5%, about 1.48 times the overall 9.8% rate, as manufacturers eliminate disease transmission risk and sourcing consistency concerns that xenograft-derived materials have never fully resolved across most advanced wound care programs worldwide today. Growth concentrates most heavily in the United States and increasingly China, where regulatory pathways and provider safety preferences are compressing adoption timelines fastest and forcing manufacturers to standardize recombinant formulations across broader portions of their product lines than originally planned. Established manufacturers with validated recombinant production capability are capturing this segment's growth disproportionately, since providers remain genuinely cautious about certifying unproven bioprocessing quality from newer entrants regardless of cost.
CAGR 14.5%

Collagen-Glycosaminoglycan Bilayer Matrices

Collagen-glycosaminoglycan bilayer matrices grow at 11.8% as burn centers and reconstructive surgeons increasingly specify this established dual-layer architecture for its proven dermal regeneration properties across most complex wound and burn reconstruction cases worldwide today and quite consistently over time and reliably. This segment benefits from decades of published clinical evidence supporting bilayer architecture outcomes that newer single-layer formulations have not yet accumulated to the same depth, expanding its addressable clinical application range meaningfully across most reconstructive surgery segments worldwide today. Growth trails the synthetic and recombinant segment specifically because bilayer products still rely partly on xenograft-derived collagen components that face the same sourcing scrutiny limiting broader category growth currently observed.
CAGR 11.8%
Full segment breakdown across 6 segments available in the complete report.

Regional Architecture and Country Demand Map

North America leads given reimbursement-driven demand concentration and a large chronic wound patient population across the entire United States market, followed by East Asia and then Western Europe overall today. South Asia and Pacific posts the fastest regional growth as healthcare infrastructure investment expands access.

North America

The United States anchors regional demand through extensive CMS and private insurer reimbursement coverage for advanced collagen matrix products, a large chronic wound and diabetic patient population, and established wound care center infrastructure that together push North America's share ten points above MMA's standard regional band, a deliberate house-rule deviation reflecting the genuinely outsized reimbursement-driven demand concentration found in this specific medtech category, unlike most other manufactured goods markets. Canada contributes meaningful additional demand tied to its comparable public healthcare reimbursement framework. Growth here tracks near the global average as the region's advanced wound care adoption, an early mover globally, has already captured much of its near-term addressable expansion opportunity.
Share: 42% | CAGR: 10.2% (2026 to 2036)

Western Europe

Germany, France, and the United Kingdom drive regional demand through sophisticated national healthcare systems that have gradually expanded coverage for advanced collagen matrix products, though reimbursement pathways remain more restrictive than the American CMS framework overall and quite consistently over time and reliably each passing year. Growth trails East Asia and South Asia as the region's national health service budget constraints limit the pace of premium regenerative product adoption relative to faster-growing developing markets and healthcare systems. Southern European markets add modest additional demand tied to smaller specialty burn and reconstructive surgery centers. Scandinavian markets contribute a smaller but steadily growing segment oriented toward premium clinical evidence-backed formulations and treatments.
Share: 18% | CAGR: 8.2% (2026 to 2036)
Regional intelligence for 5 additional markets available in the complete report: East Asia, South Asia and Pacific, Latin America, Middle East and Africa, Eastern Europe. Contact sales@marketmindsadvisory.com.
collagen-skin-matrix-market-country-cagr-analysis-1787465078316

Capturing Margin as Sourcing Shifts

Clinical evidence depth, not manufacturing scale, is the clearest margin opportunity this category has seen in years, rewarding manufacturers who can deliver reimbursement-backed formulations across every treatment setting and healthcare system worldwide today and quite consistently over time. The four moves below target where participants across the value chain can build lasting competitive advantage.

Build Validated Recombinant Production at Clinical Scale

Providers increasingly specify recombinant collagen formulations over xenograft-derived products, making proprietary validated bioprocessing capability a genuine competitive moat rather than a manufacturing afterthought for suppliers competing on formulary placement wins across the entire industry today. Manufacturers with proven recombinant platforms are capturing pricing 30% to 45% above standard xenograft-derived sales, converting a production investment into durable recurring formulary revenue across multiple healthcare systems. This investment requires sustained bioprocessing commitment but compounds across successive clinical qualification programs that reuse validated recombinant technology rather than restarting regulatory approval from scratch each time.
Market Impact: Lifts platform pricing by 30% to 45% overall

Secure Expanded Reimbursement Coverage Codes Directly

Reimbursement coverage keeps expanding across major payers, and manufacturers securing expanded coverage codes ahead of competitors are capturing content worth 25% additional formulary revenue that rivals relying only on existing narrow coverage cannot easily match across newly covered treatment settings. This coverage expansion increasingly functions as a genuine sales advantage with providers seeking predictable reimbursement before committing to premium formulations, converting a regulatory function into a customer-facing revenue driver. Larger manufacturers with meaningful clinical evidence budgets are best positioned to secure these coverage expansions ahead of smaller competitors lacking comparable data.
Market Impact: Adds 25% additional formulary revenue overall each year

Publish Comparative Healing Outcome Clinical Studies

Providers increasingly demand published comparative healing outcome data before adopting new formulations, and manufacturers publishing rigorous clinical studies ahead of competitors are capturing content worth 20% additional formulary placement that rivals relying only on regulatory clearance cannot easily match at comparable evidence depth or timeline. This publication strategy increasingly functions as a genuine competitive differentiator during formulary committee reviews, converting a research investment into a customer-facing credibility advantage. Larger manufacturers with meaningful clinical research budgets are best positioned to fund these studies ahead of smaller competitors lacking comparable research infrastructure.
Market Impact: Captures 20% additional formulary placement share overall today

Expand Chinese Distribution for Growing Wound Care Access

Chinese healthcare infrastructure investment keeps expanding rapidly, and manufacturers establishing direct distribution relationships ahead of competitors are capturing content worth 22% additional Chinese market share that rivals serving the market only through intermediary distributors cannot easily match at comparable margin or overall timeline today. This localization increasingly functions as a genuine market access requirement rather than a discretionary expansion, since several large Chinese hospital systems now prefer direct manufacturer relationships over intermediary distribution arrangements entirely. Manufacturers without a credible direct Chinese distribution strategy risk losing meaningful volume to better-positioned competitors.
Market Impact: Captures 22% additional Chinese market share overall today

Who Controls the Margin Pool

Concentration sits at a concentrated CR5 of 58%, reflecting a category split between global medical device majors with decades of regulatory qualification history and specialty regenerative medicine companies serving wound care centers directly. The gap between Integra LifeSciences, the broadest collagen matrix portfolio holder, and specialty regenerative companies is meaningful given the clinical evidence investment required to compete on reimbursement-backed formulations. All participants are assessed on one basis: revenue attributable to collagen skin matrix product lines.
Current competitive activity runs along three lines. Recombinant production capability increasingly differentiates manufacturers competing for premium formulary wins from those confined to standard xenograft-derived sales only. Reimbursement coverage expansion is emerging as a genuine advantage in the United States. Chinese domestic manufacturer expansion is reshaping the competitive base for standard grades, pressuring international manufacturers on price.

Emerging pressure comes from Chinese domestic regenerative medicine companies building manufacturing capability close to the world's fastest-growing healthcare infrastructure investment base, challenging the advantage international specialists held through decades of clinical evidence depth. Rankings over the next five years will likely shift toward whichever companies combine proven recombinant production with reimbursement navigation expertise and credible China market access.
collagen-skin-matrix-market-company-positioning-matrix-1787465078837

Competitive Moat and Risk Dimensions

INTEGRA LIFESCIENCES HOLDINGS

Moat: Broadest collagen matrix portfolio

Integra LifeSciences's position as one of the largest global regenerative medicine companies gives it clinical evidence depth and reimbursement navigation expertise across bilayer and specialty formulation grades that smaller regional competitors cannot easily replicate, supporting formulary leadership across both standard and premium platform packages sold to providers worldwide.
INTEGRA LIFESCIENCES HOLDINGS

Risk: Xenograft sourcing transition exposure

Integra LifeSciences's product portfolio remains partly dependent on xenograft-derived collagen sourcing, and accelerating provider preference for recombinant alternatives could genuinely erode its established bilayer product advantage faster than its own recombinant pipeline can mature to fully compensate for that shift across the entire category overall.
ORGANOGENESIS HOLDINGS

Moat: Deep regenerative medicine clinical expertise

Organogenesis has invested heavily in clinical evidence generation and regenerative medicine formulation development specifically validated across chronic wound care applications, giving it credibility that suppliers without comparable long-term outcome data and reimbursement testing cannot easily match on newly covered treatment settings entering additional developing markets worldwide.
ORGANOGENESIS HOLDINGS

Risk: Reimbursement policy dependency exposure

Organogenesis's revenue remains heavily dependent on continued CMS and private insurer reimbursement coverage for its regenerative products, and any tightening of coverage policy amid healthcare cost containment pressure could genuinely compress margins faster than volume growth from expanding chronic wound prevalence can offset over time.

Players Tracked

Prominent Players

Integra LifeSciences Holdings
Organogenesis Holdings
Smith & Nephew plc
MTF Biologics
Mölnlycke Health Care

Other Key Players

Vericel Corporation
Acell Inc
Convatec Group
Coloplast A/S
3M Healthcare (Solventum)
Baxter International
Stryker Corporation
Osiris Therapeutics
Tissue Regenix Group
Kerecis
PolyNovo Limited
Avita Medical
Regenity Biosciences
Skye Biologics
Aroa Biosurgery

Recent Developments

APRIL 2025

Integra LifeSciences Expands Recombinant Collagen Production Capacity in New Jersey

Integra LifeSciences commissioned additional recombinant collagen production capacity at its existing facility in New Jersey to meet growing demand for synthetic formulations across North American healthcare platforms. The expansion was funded from Integra's own capital budget as an organic capacity addition. Full production ramp is expected within eleven months.
Signal: Confirms recombinant collagen demand now justifies dedicated new production capacity investment, not simply routine annual expansion.
AUGUST 2025

Organogenesis and a Chinese Regenerative Medicine Firm Form Joint Venture

Organogenesis entered a joint venture with a Chinese regenerative medicine manufacturer to produce collagen matrix products specifically for the domestic Chinese wound care market. The venture combines Organogenesis's clinical evidence and formulation technology with the partner's local distribution scale and hospital relationships. Initial production is targeted for early 2026.
Signal: Signals that joint ventures, not direct competition alone, are now the preferred strategy for accessing China.
DECEMBER 2025

Smith & Nephew Acquires Recombinant Collagen Bioprocessing Specialist

Smith & Nephew acquired a smaller specialty recombinant collagen manufacturer with established bioprocessing technology to expand its synthetic formulation capability beyond its existing xenograft-derived product operations. The acquired company brought proprietary bioprocessing technology that Smith & Nephew previously lacked internally. Integration is expected to complete within nine months of close.
Signal: Confirms xenograft-focused manufacturers now see recombinant bioprocessing as a genuine and direct acquisition target going forward.

Bovine and Porcine Collagen Feedstock Exposure

Bovine and porcine collagen feedstock together account for 30% to 40% of cost of goods sold across collagen matrix manufacturers, sourced primarily from certified tissue processors concentrated in the United States, Australia, and New Zealand, three countries meeting the strictest disease-free certification requirements. This concentration leaves the category exposed to livestock supply cycles and disease-related sourcing restrictions.
The 2020 to 2021 bovine spongiform encephalopathy sourcing restriction tightening, documented in FDA guidance updates, forced several manufacturers to requalify tissue sourcing origins within a single year as regulators expanded geographic restrictions on acceptable bovine tissue sources. Manufacturers with diversified certified tissue sourcing across multiple countries absorbed that disruption more smoothly than those dependent on a single processor relationship. Conditions gradually normalized over the following eighteen months as alternative sourcing developed.

Exposure varies by manufacturer scale and sourcing depth. Larger manufacturers with long-term certified tissue supply agreements absorb sourcing restriction changes more smoothly than smaller specialty manufacturers buying primarily through intermediary processors, who face sharper disruption during regulatory tightening periods. Geography matters too: manufacturers with direct American or Australian sourcing relationships face different exposure than those dependent on other regional tissue feedstock specifically.
collagen-skin-matrix-market-cost-volatility-analysis-1787465079032

Diversify Certified Tissue Sourcing Across Countries

Manufacturers qualifying bovine and porcine tissue supply from multiple certified processors across different countries simultaneously reduce dependence on any single facility's regulatory or production allocation decisions in a given calendar period each year. This adds supplier qualification complexity but meaningfully smooths aggregate input cost volatility across a full multi-year sourcing horizon and planning cycle.

Accelerate Recombinant Collagen Production Transition

Larger manufacturers are accelerating investment in recombinant collagen production technology, reducing long-term dependence on animal tissue sourcing entirely and eliminating the associated regulatory and disease transmission risk that periodically disrupts xenograft-derived supply chains completely. This requires meaningful upfront bioprocessing investment but delivers substantially more predictable production economics during future disruption periods and planning cycles.

Secure Long-Term Certified Tissue Supply Agreements

Some manufacturers are negotiating dedicated long-term certified tissue supply agreements directly with tissue processors, locking sourcing priority ahead of broader industry demand competing for the same limited certified tissue output each and every single passing year. This requires meaningful upfront commitment but expands sourcing predictability meaningfully over time and across multiple future production cycles.

Portfolio Architecture for Margin Defence

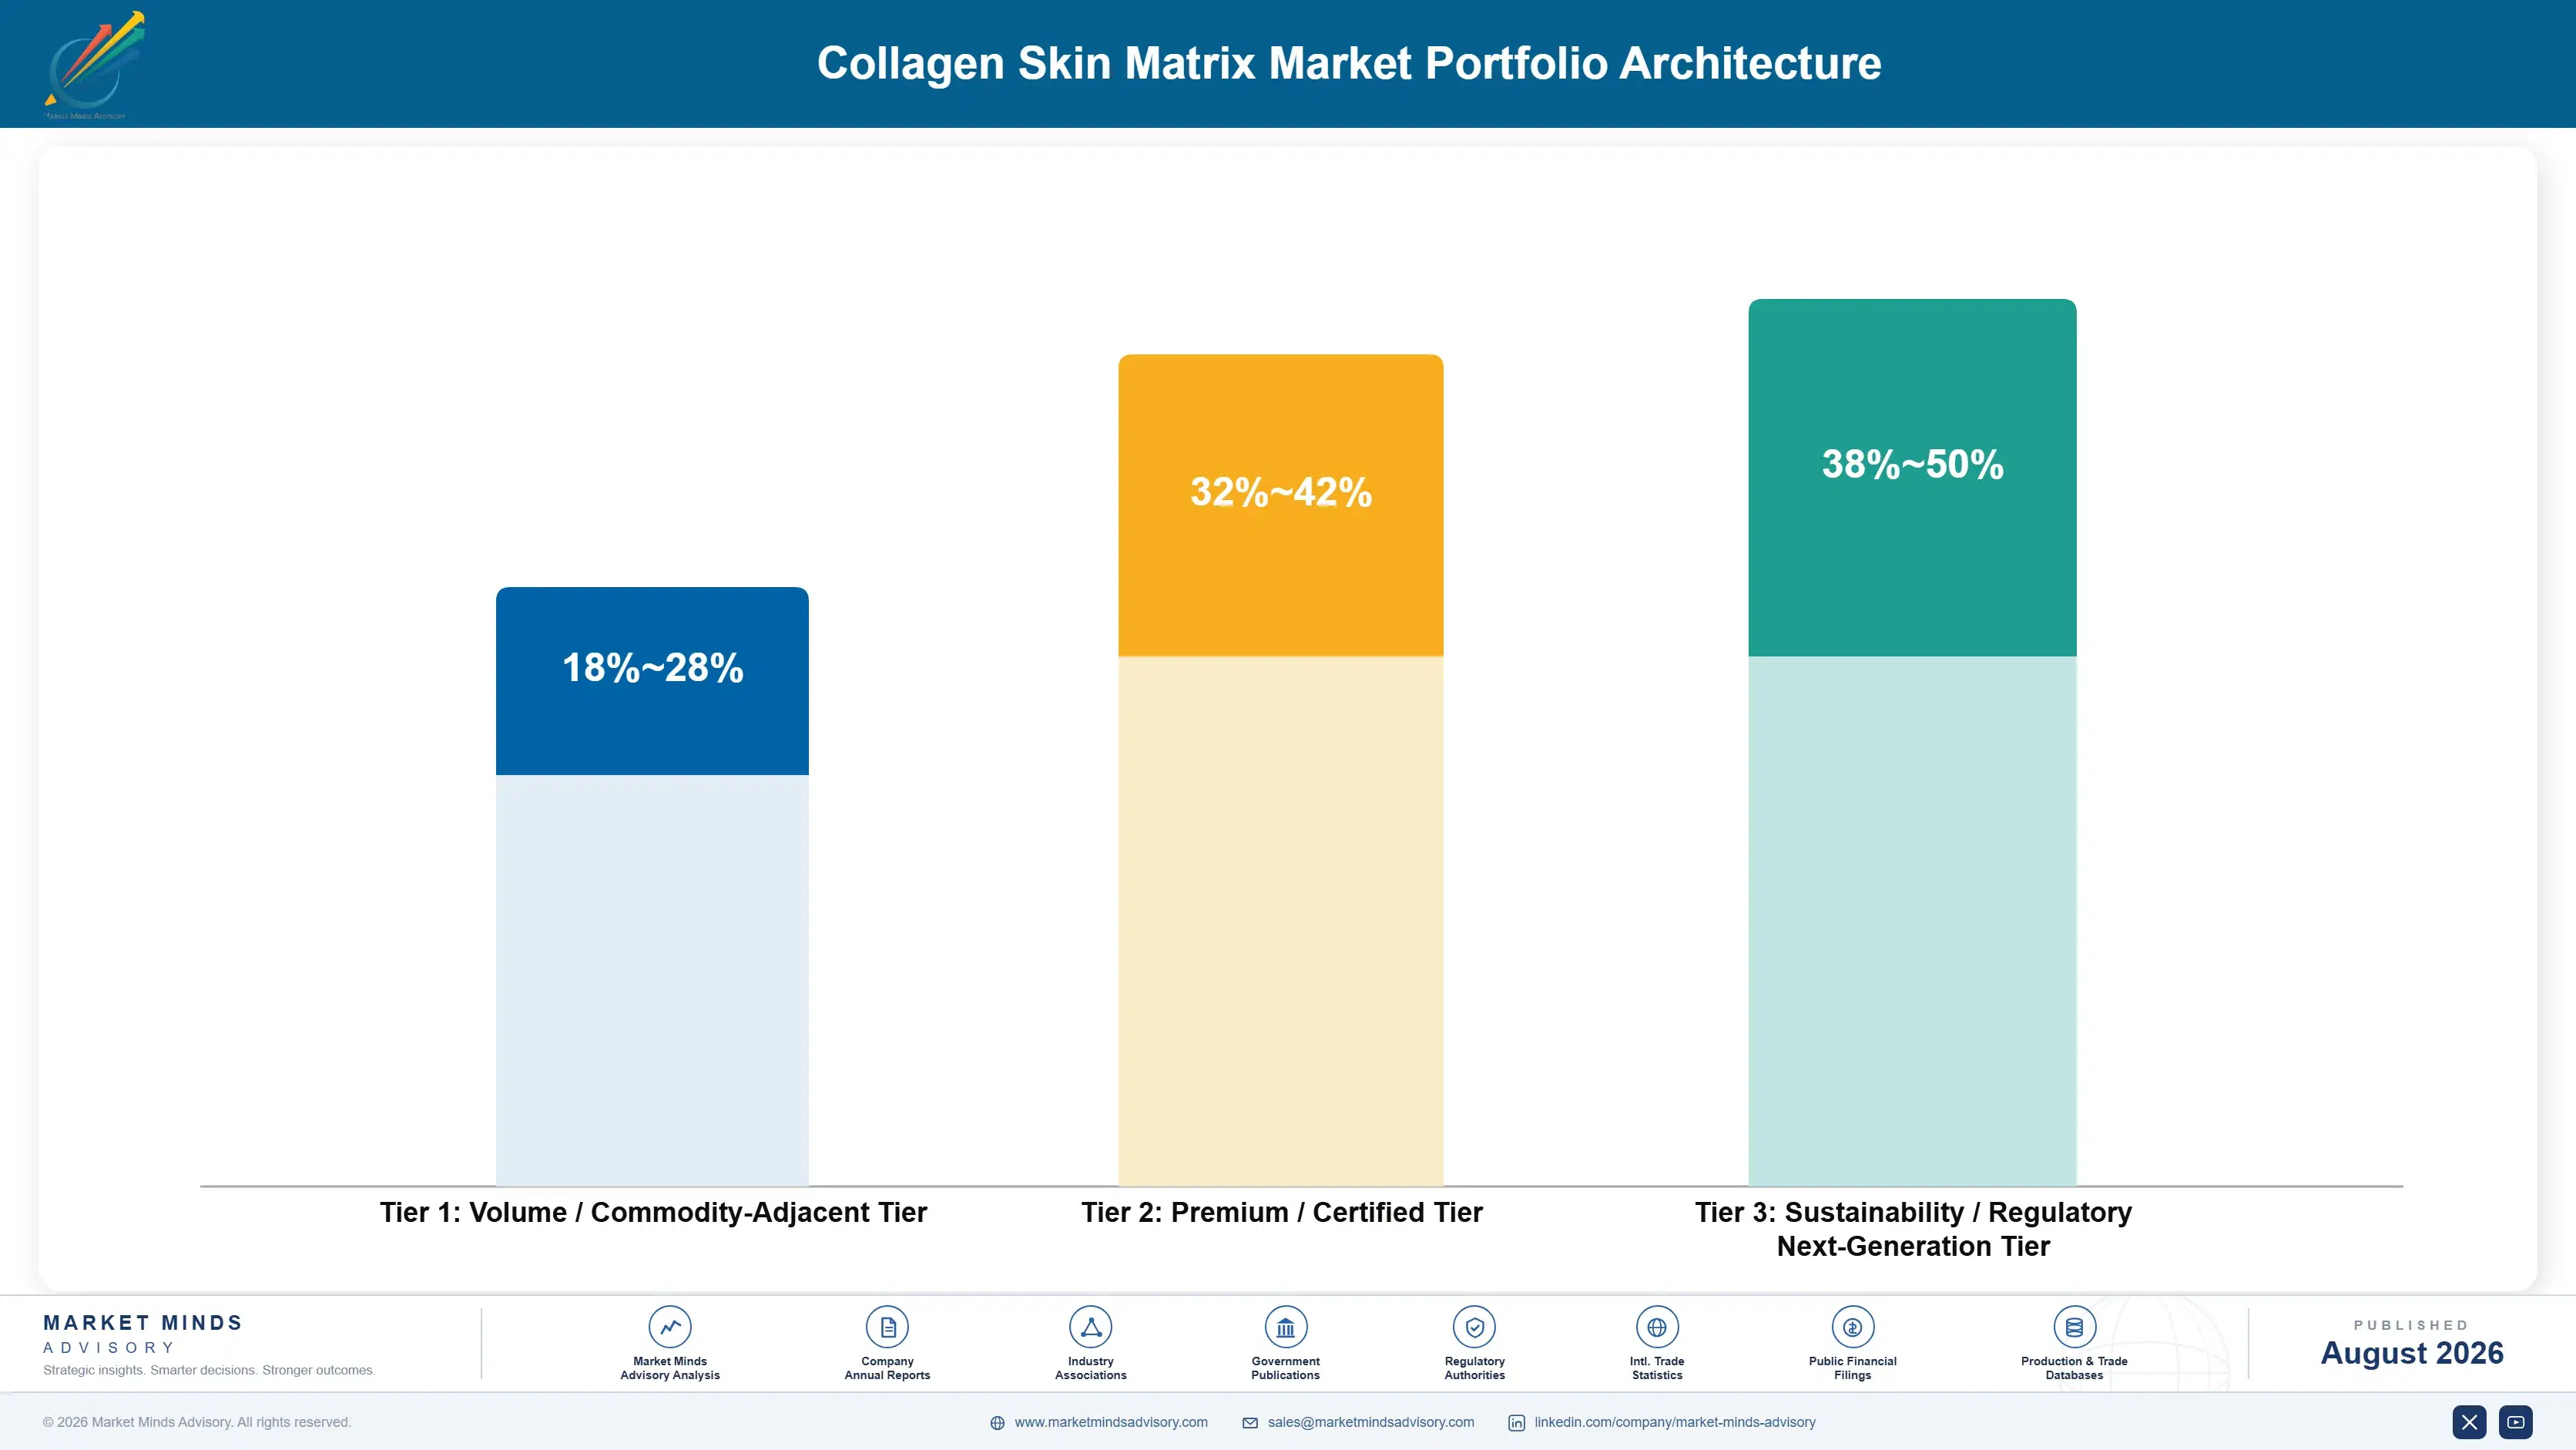
The portfolio splits into three tiers with meaningful margin separation tied to sourcing sophistication rather than raw manufacturing cost alone today. Standard xenograft-derived matrices compete mainly on price and clinical familiarity, while recombinant and bilayer formulations command durable premiums tied to validated evidence and complete reimbursement navigation responsibility.
The tension between commodity volume and specialty premium is sharpening as reimbursement expansion and provider safety preferences pull recombinant demand faster than xenograft-derived demand grows, pulling manufacturer investment toward the higher-margin segment even though xenograft-derived matrices remain a meaningful installed clinical base today, particularly in less reimbursement-rich markets and healthcare systems. Manufacturers that maintain a foothold in both segments preserve optionality, while those chasing only recombinant contracts risk losing the stable cash flow that established xenograft-derived sales still reliably provide.

High-value margin pools concentrate specifically in validated recombinant formulations and reimbursement-covered bilayer matrices, both requiring genuine clinical evidence investment that commodity-only manufacturers must build or acquire rather than simply extend from existing manufacturing capability. Standard xenograft-derived matrices, by contrast, remain a large but slower-growing volume base offering thinner, more commoditized margins for most participants going forward overall.

Volume / Commodity-Adjacent Tier

Standard xenograft-derived matrices sold primarily on price and clinical familiarity into treatment settings without advanced reimbursement or evidence requirements yet, particularly across cost-sensitive developing markets worldwide today and quite consistently.
Gross Margin: 18-28%

Premium / Certified Tier

Validated bilayer and specialty formulation matrices integrated into reimbursement-covered clinical protocols commanding durable premiums tied to evidence validation depth and a proven multi-year track record with providers and buyers worldwide.
Gross Margin: 32-42%

Sustainability / Regulatory / Next-Generation Tier

Recombinant and synthetic collagen matrices representing the newest and most technically demanding corner of the entire product portfolio, built specifically for disease-transmission-free platforms sold globally today and quite consistently overall.
Gross Margin: 38-50%
collagen-skin-matrix-market-portfolio-architecture-1787465079525

High-value Sub-segments and Strategic Watch-out

Validated Recombinant Collagen Formulations

High value and high growth, driven by disease transmission concerns expanding recombinant adoption across broader treatment settings worldwide and every price point today. Manufacturers with proven formulations are capturing this segment's fastest-growing formulary wins globally right now, across nearly every major market and region worldwide.
Gross Margin: 38-50%

Reimbursement-Covered Bilayer Matrices

High value with strong growth, tied directly to expanding CMS coverage scaling independent of broader manufacturing cost cycles worldwide and across most segments today. Validated clinical evidence increasingly decides which manufacturer wins long-term formulary contracts across most major providers and regions worldwide today and consistently.
Gross Margin: 32-42%

Standard Xenograft-Derived Matrices

The volume core, serving treatment settings across most global markets regardless of recombinant adoption pace or reimbursement timeline currently in place today and consistently. Steady growth tracks chronic wound volume rather than any specific technology trend emerging currently across the wider category and industry overall today.
Gross Margin: 18-28%

Unvalidated Chinese Domestic Xenograft Hardware

The strategic watch-out, facing accelerating price competition as domestic suppliers scale production for cost-sensitive treatment segments worldwide and across every single price tier today and quite consistently overall. Remaining international manufacturer volume concentrates in accounts still requiring proven validation history and long-established track records overall today.
Gross Margin: 14-22%

Reimbursement Cycles Meet Clinical Adoption Timelines

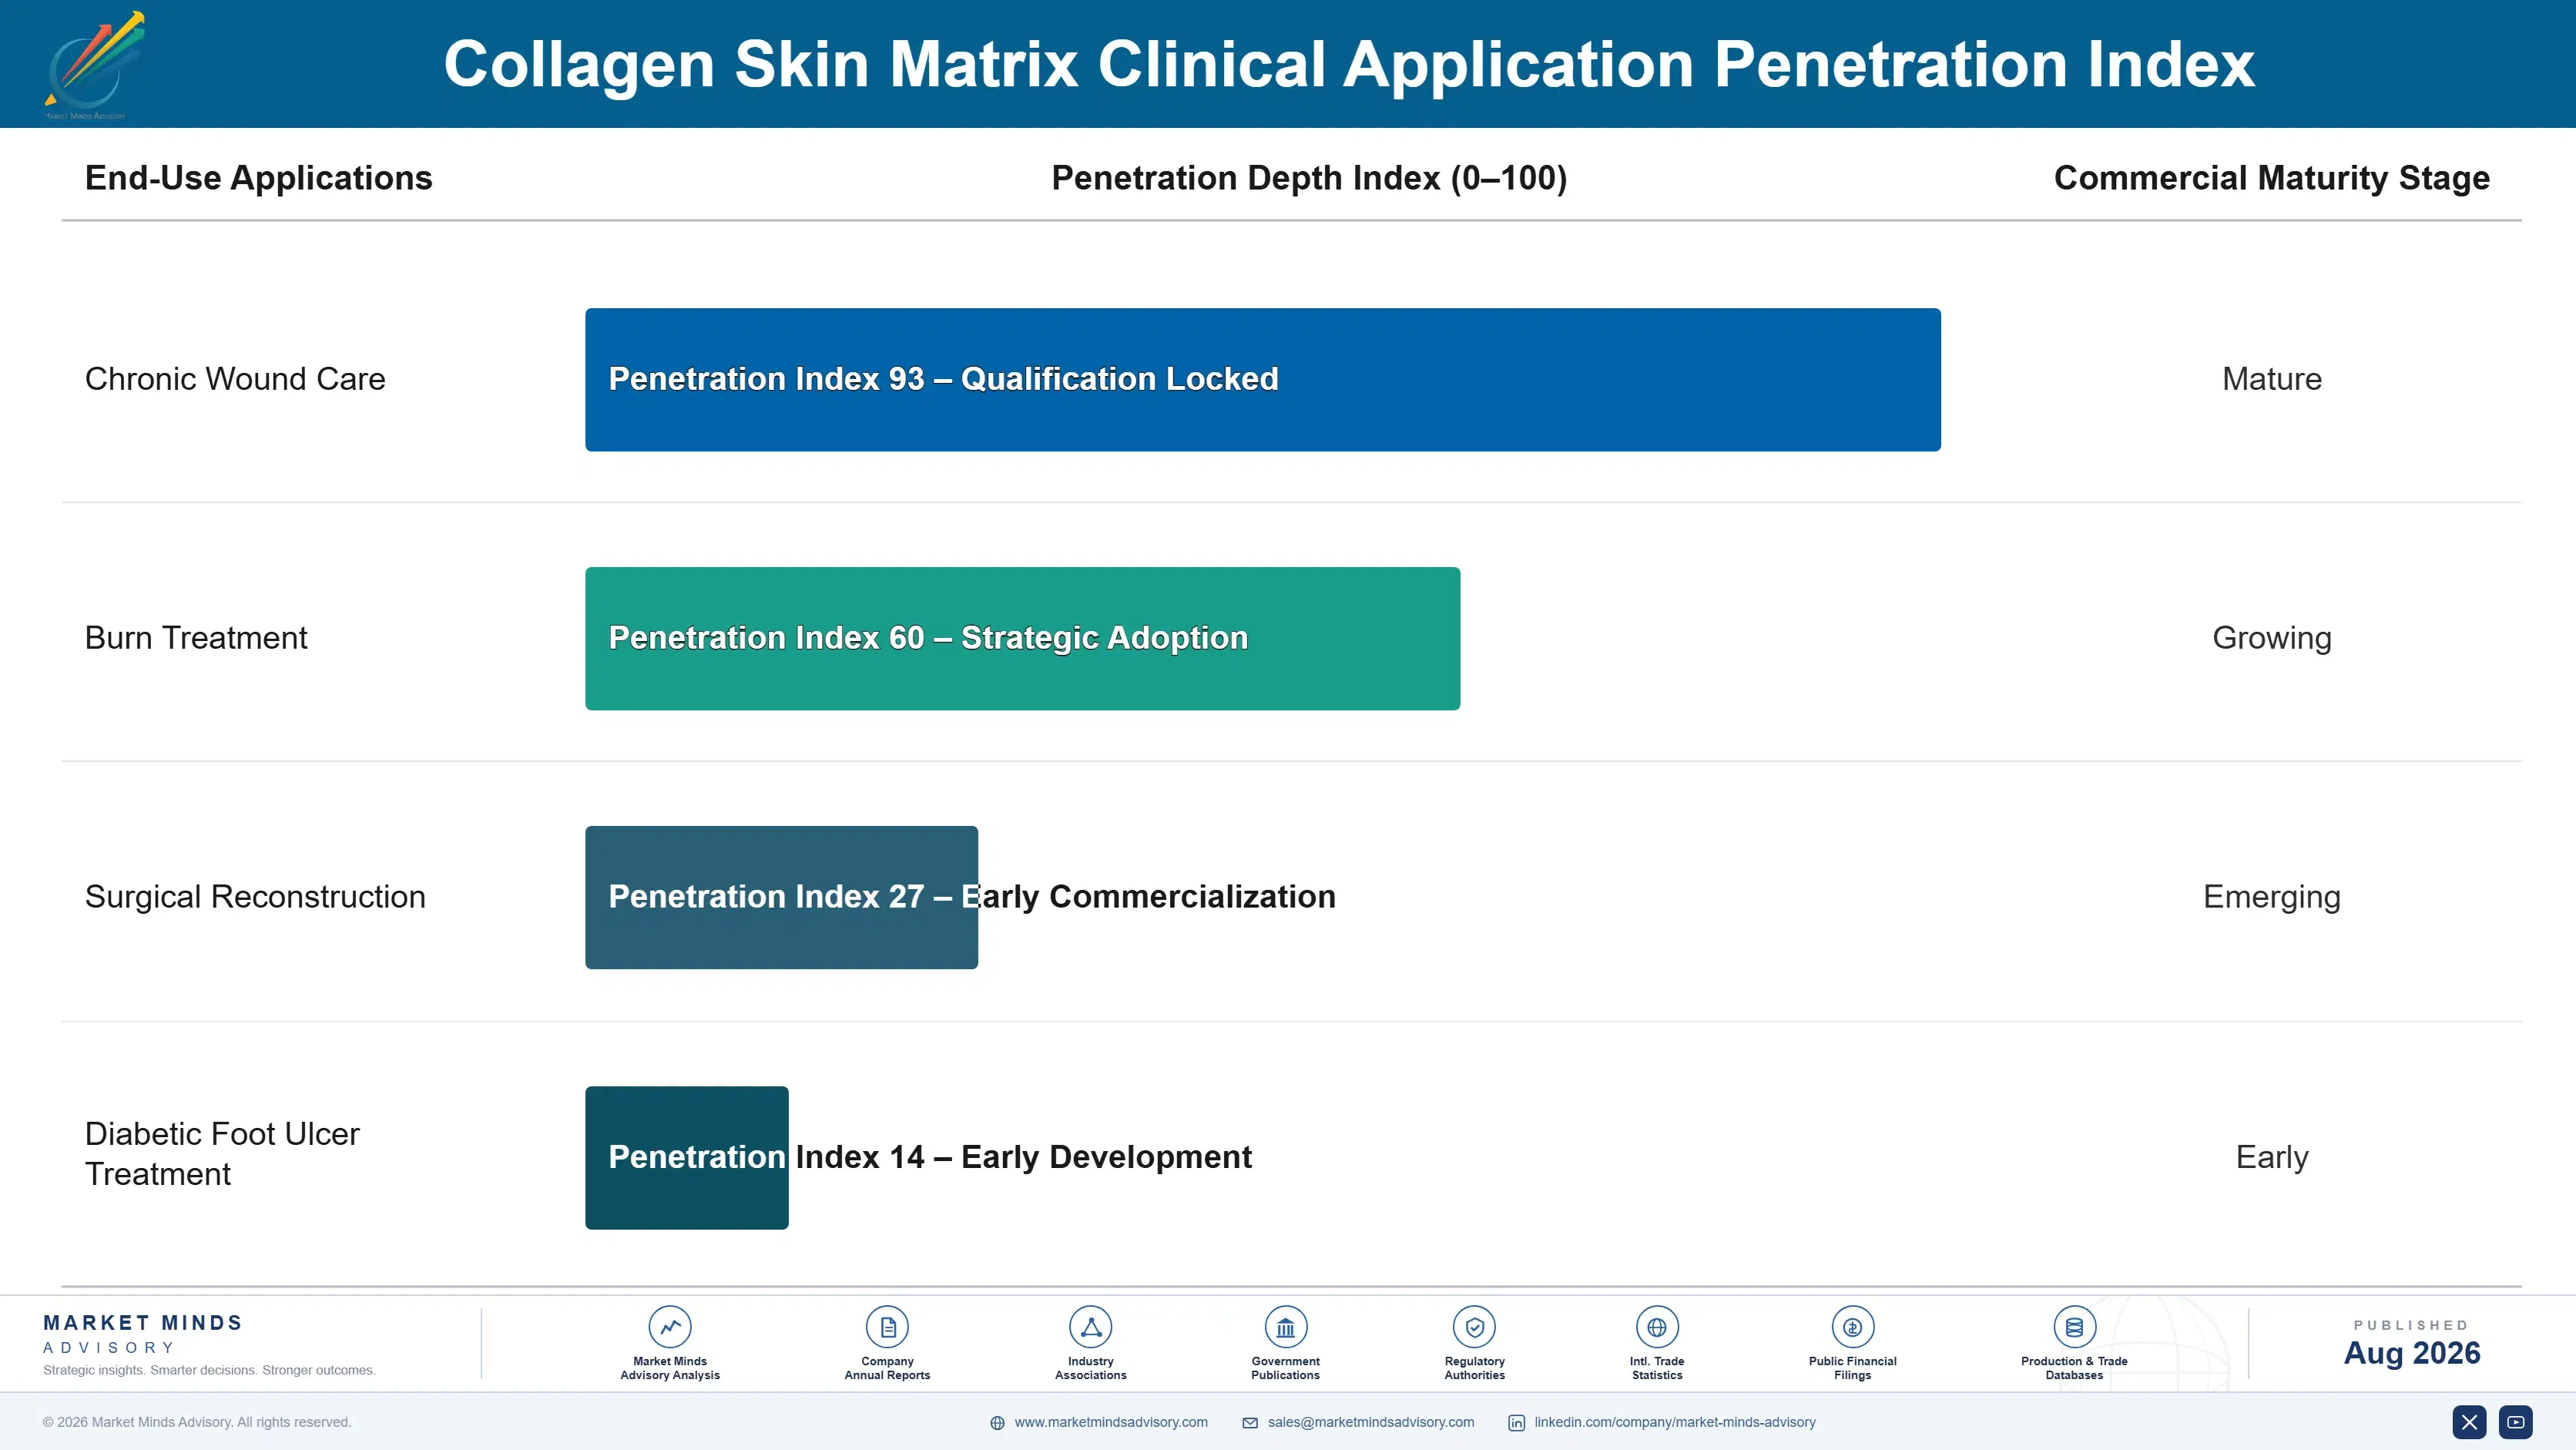
Demand compounds through provider formulary qualification cycles rather than simple repeat commodity purchasing patterns. Once a wound care center validates a manufacturer's clinical evidence and reimbursement documentation against a formulary review requirement, switching suppliers means repeating qualification that typically runs 6 to 12 months, creating genuine lock-in once formulary placement is secured. That lock-in makes won contracts closer to an annuity than a spot sale.
Adoption depth varies sharply by treatment setting and provider scale. Large academic medical centers and specialty burn units show the deepest formulary lock-in, having validated complete evidence-backed protocols years before smaller competitors began comparable programs. Community wound care clinics show more price-driven switching behavior as they extend advanced formulations into broader patient populations under reimbursement pressure. Surgical reconstruction centers sit between the two, with loyalty varying by outcome data requirements.

Generational buyer shifts are reshaping who makes these formulary sourcing decisions across the industry today. Younger wound care specialists increasingly prioritize validated clinical outcome data and reimbursement coding clarity over established supplier relationships that shaped earlier generations of medical purchasing professionals. This shift favors manufacturers investing in transparent outcome data over those relying primarily on legacy relationship depth.
collagen-skin-matrix-market-end-use-penetration-index-1787465080013

Where Collagen Matrix Manufacturers Focus

These are among the four positions where our research anticipates prominent divergence between winners and laggards over the coming forecast period. Each is grounded in the demand model, the regulatory perimeter, and the announced capacity pipeline.
01 / RECOMBINANT PRODUCTION INVESTMENT

Build Validated Recombinant Platforms Before Providers Consolidate

Providers keep shifting preference toward recombinant collagen formulations across most major treatment settings, and manufacturers without validated recombinant production capability are losing formulary wins to competitors that invested in this capability years ahead of the current provider safety preference wave sweeping most healthcare systems. This gap will only widen as academic medical centers standardize recombinant sourcing across broader portions of their formulary lists to simplify multi-year procurement decisions. Manufacturers relying only on xenograft-derived sales should treat recombinant investment as an urgent strategic priority rather than a discretionary expansion.
02 / REIMBURSEMENT COVERAGE STRATEGY

Secure Expanded Coverage Codes Ahead of Competitors

Reimbursement coverage keeps expanding across major payers, and manufacturers without expanded coverage codes are losing formulary business to competitors that secured broader reimbursement years before coverage decisions tightened significantly across these increasingly cost-conscious healthcare payer categories and jurisdictions worldwide today. This gap keeps widening as more payers finalize coverage determinations, pushing reimbursement-mandated demand into treatment settings that previously relied on out-of-pocket payment exclusively and reliably. Manufacturers without a credible coverage expansion pipeline risk permanently losing formulary volume to better-prepared competitors.
03 / CLINICAL EVIDENCE PUBLICATION STRATEGY

Publish Comparative Outcomes Ahead of Formulary Reviews

Providers increasingly demand published comparative healing outcome data before formulary committee reviews, and manufacturers relying purely on regulatory clearance against evidence-rich competitors face a genuinely difficult position given the credibility advantage rigorous published studies provide during these committee decisions and reviews. Publication strategies combining rigorous clinical trial design with peer-reviewed outcome data address both the credibility and formulary placement challenges simultaneously and directly across provider networks. Manufacturers without a credible publication strategy risk losing meaningful formulary placement permanently to evidence-backed competitors.
04 / CHINESE MARKET ACCESS EXPANSION

Build Direct Distribution Ahead of Healthcare Infrastructure Growth

Chinese healthcare infrastructure investment keeps expanding rapidly, and manufacturers without direct distribution relationships are losing volume to competitors that established local sales presence years before this infrastructure growth wave accelerated across major Chinese hospital systems and wound care networks. This gap keeps widening as more Chinese hospitals prefer direct manufacturer relationships over intermediary distribution arrangements that added cost and reduced clinical responsiveness. This positions early movers to own a growing Chinese content category before broader industry investment catches up fully.

Engagement Snapshot From the Field

A live engagement with an industry participant carrying material or product regulatory and market exposure ahead of a defining policy shift, showing how our research translates into a defensible multi-year portfolio strategy.
MARKET MINDS ADVISORY · CLIENT ENGAGEMENT SUMMARY
Collagen Skin Matrix Producer Strategic Portfolio Review and Transition Roadmap 2026·Investment Scenario on Collagen Skin Matrix Exposure Evaluation 2025-26
CLIENT PROFILE
A mid-sized American wound care network approached MMA while planning a formulary standardization program across its regional clinic system ahead of expanding CMS reimbursement categories nationwide. The client reported annual patient volume near 18,000 chronic wound cases and had previously sourced xenograft-derived matrices from multiple suppliers without a unified evidence-based protocol (client-reported, unverified by MMA).
STRATEGIC CHALLENGE
Management needed to identify a collagen matrix supplier capable of supporting a unified evidence-based formulary within a compressed reimbursement transition timeline while keeping incremental clinical cost within the client's competitive payer negotiation constraints and margin targets. The client's clinical committee had limited prior experience evaluating recombinant formulation evidence at this formulary scale.
MMA APPROACH
MMA benchmarked clinical evidence depth and reimbursement navigation support across four candidate suppliers under the client's specific formulary deadline and cost targets. We modeled total formulary transition cost including staff training and assessed each supplier's published outcome data given recent recombinant technology advances. We also evaluated each candidate's experience supporting comparable formulary standardization for other American wound care networks.
KEY FINDINGS
  1. Two of the four candidate suppliers had already supported comparable formulary standardization programs for other American wound care networks, meaningfully reducing expected transition risk (client-reported, unverified by MMA).
  2. The client's previous multi-supplier approach created inconsistent outcome tracking that complicated reimbursement documentation across different payer categories and various claim types significantly.
  3. Per-unit clinical cost increased meaningfully under the recommended recombinant formulary but remained within the client's stated competitive payer negotiation tolerance for the network.
  4. Published outcome data varied significantly among candidates, with only two suppliers offering peer-reviewed comparative studies supporting formulary committee decisions fully and reliably.
CLIENT PROFILE
A mid-sized American wound care network approached MMA while planning a formulary standardization program across its regional clinic system ahead of expanding CMS reimbursement categories nationwide. The client reported annual patient volume near 18,000 chronic wound cases and had previously sourced xenograft-derived matrices from multiple suppliers without a unified evidence-based protocol (client-reported, unverified by MMA).
STRATEGIC CHALLENGE
Management needed to identify a collagen matrix supplier capable of supporting a unified evidence-based formulary within a compressed reimbursement transition timeline while keeping incremental clinical cost within the client's competitive payer negotiation constraints and margin targets. The client's clinical committee had limited prior experience evaluating recombinant formulation evidence at this formulary scale.
MMA APPROACH
MMA benchmarked clinical evidence depth and reimbursement navigation support across four candidate suppliers under the client's specific formulary deadline and cost targets. We modeled total formulary transition cost including staff training and assessed each supplier's published outcome data given recent recombinant technology advances. We also evaluated each candidate's experience supporting comparable formulary standardization for other American wound care networks.
KEY FINDINGS
  1. Two of the four candidate suppliers had already supported comparable formulary standardization programs for other American wound care networks, meaningfully reducing expected transition risk (client-reported, unverified by MMA).
  2. The client's previous multi-supplier approach created inconsistent outcome tracking that complicated reimbursement documentation across different payer categories and various claim types significantly.
  3. Per-unit clinical cost increased meaningfully under the recommended recombinant formulary but remained within the client's stated competitive payer negotiation tolerance for the network.
  4. Published outcome data varied significantly among candidates, with only two suppliers offering peer-reviewed comparative studies supporting formulary committee decisions fully and reliably.
RECOMMENDED STRATEGY
Phase 1: Phase 1 (0 to 3 months): Select the evidence-backed recombinant supplier and finalize formulary transition terms fully and promptly overall. Phase 2: Phase 2 (3 to 8 months): Complete full clinical staff training thoroughly across all regional clinics before formulary rollout begins. Phase 3: Phase 3 (8 to 12 months): Launch the fully standardized formulary with complete reimbursement documentation support across every clinic location.
OUTCOME
The client completed formulary standardization within the twelve-month timeline, meeting expanded reimbursement category requirements without any noticeable clinical disruption whatsoever across the network. The unified evidence-based formulary also reduced claim denial rates meaningfully, supporting a reported margin improvement across the regional clinic network (client-reported, unverified by MMA).

Frequently Asked Questions

Foundational context covering the market sizes, CAGR, scope, country, region and competition that inform every finding below. This section is provided to cover basics and most often pre-purchase conversations, answered from the MMA Primary Research Dataset.

What is the current size of the Collagen Skin Matrix Market?

The market stood at approximately USD 1.9 billion in 2025, according to MMA's primary research dataset. This reflects global demand across xenograft-derived, bilayer, and recombinant collagen matrix technologies.

How large will the Collagen Skin Matrix Market be by 2036?

MMA projects the market will reach approximately USD 5.31 billion by 2036 under the base case scenario. This represents roughly 2.55 times the 2026 market entry value.

What is the CAGR for the Collagen Skin Matrix Market 2026 to 2036?

The base case CAGR is 9.8%, with a bull case of 11.1% and a bear case of 8.5%. The range reflects uncertainty around reimbursement policy expansion.

Which segment is growing fastest?

Synthetic and recombinant collagen matrices grow fastest at 14.5%, about 1.48 times the overall market rate. Disease transmission avoidance is the primary driver of this growth.

Who are the major companies in the Collagen Skin Matrix Market?

Leading companies include Integra LifeSciences Holdings, Organogenesis Holdings, Smith & Nephew plc, MTF Biologics, and Mölnlycke Health Care. These five hold an estimated 58% of the market.

Which country is growing fastest?

China posts the fastest national growth at 12.5% CAGR, driven by expanding healthcare infrastructure investment. This outpaces the broader East Asia regional average by a meaningful margin.

Report Segmentation Architecture

The full report scope spans multiple orthogonal segmentation dimensions, with cross-tabulated demand data provided for each dimension pair. Coverage extends further to regional breakdowns, trend trajectories, and the competitive detail needed to support segment-level decision-making.

By Product Form and Sourcing Technology

  • Collagen Sheet and Membrane Matrices
  • Collagen Sponge and Foam Matrices
  • Collagen Gel and Injectable Matrices
  • Collagen-Glycosaminoglycan Bilayer Matrices
  • Xenograft-Derived Collagen Matrices
  • Synthetic and Recombinant Collagen Matrices

By Clinical Application

  • Chronic Wound Care
  • Burn Treatment
  • Surgical Reconstruction
  • Diabetic Foot Ulcer Treatment

By Commercial Dimension

  • Hospital Direct Purchase
  • Wound Care Center Supply
  • Distributor and Group Purchasing Organization Supply
  • Ambulatory Surgical Center Supply

By Region

  • North America
  • Western Europe
  • East Asia
  • South Asia and Pacific
  • Latin America
  • Middle East and Africa
  • Eastern Europe

Scope, Methodology, and Coverage

Every figure in this report is reproducible from documented input assumptions. The scope below maps the historical period, the forecast horizon, the segmentation dimensions, and the countries covered, alongside the underlying primary and qualitative methodology.
Historical Period
2020 to 2025
Forecast Period
2026 to 2036
Base Year
2025 (USD billions; MMA Primary Research Dataset, August 2026)
Market Definition
The collagen skin matrix market covers collagen-based dermal and skin substitute products, including sheet, sponge, gel, bilayer, xenograft-derived, and synthetic recombinant formulations used in burn treatment, chronic wound care, and surgical reconstruction. It excludes non-collagen synthetic skin substitutes and standard wound dressings without a collagen matrix component.
Quantitative Units
USD billions (current prices); unit shipment volume where applicable
Segmentation Dimensions
By Product Form and Sourcing Technology; By Clinical Application; By Commercial Dimension; By Region
Regions Covered
North America, Western Europe, East Asia, South Asia and Pacific, Latin America, Middle East and Africa, Eastern Europe
Countries Covered
USA, China, Germany, France, UK, Japan, South Korea, India, Australia, Canada, Brazil, Mexico, Indonesia, Vietnam, Thailand, UAE, Saudi Arabia, South Africa, Nigeria, Turkey, Poland, Russia, Netherlands, Italy, Spain, Sweden, Argentina, Colombia, New Zealand, Singapore, and additional markets relevant to this sector
Key Companies Profiled
Integra LifeSciences Holdings, Organogenesis Holdings, Smith & Nephew plc, MTF Biologics, Mölnlycke Health Care, Vericel Corporation, Acell Inc, Convatec Group, Coloplast A/S, 3M Healthcare (Solventum), Baxter International, Stryker Corporation, Osiris Therapeutics, Tissue Regenix Group, Kerecis, PolyNovo Limited, Avita Medical, Regenity Biosciences, Skye Biologics, Aroa Biosurgery
Quantitative Methodology
Primary survey, n=3,800 respondents, Q4 2025, six countries; demand-side model with trade association cross-validation
Qualitative Methodology
47 expert interviews, Q4 2025; applied to validate demand model assumptions, identify emerging dynamics, and assess competitive positioning
Report Format
PDF and XLSX data workbook (Word format preview document)
Publisher
Market Minds Advisory
Report Code
MMA-2026-MED-108
Published
August 2026
Contact
sales@marketmindsadvisory.com | www.marketmindsadvisory.com

Purchase the full Collagen Skin Matrix Market Report (2026 to 2036).

The full MMA Collagen Skin Matrix report sizes the market across six product forms, four clinical applications, and seven regions through 2036, with dedicated analysis of United States reimbursement-driven demand concentration. It profiles 20 participants on a consistent revenue basis, scoring each on recombinant production capability, clinical evidence depth, and reimbursement navigation expertise. Scenario models quantify how CMS reimbursement expansion and diabetic wound prevalence move demand and pricing across xenograft-derived and recombinant segments. The report includes delivered collagen feedstock cost modeling, a reimbursement policy tracker, and a China market access screen built for procurement and category strategy teams.
Six-product segmentation with detailed growth forecasts
Bovine and porcine feedstock supply risk assessment
CMS reimbursement policy tracking dashboard tool
Xenograft versus recombinant matrix margin model
United States reimbursement demand mapping tool
Twenty-company competitive benchmarking scorecard overall today

Built For The People Who Decide

From boardroom strategy to bench-side execution, this report is read cover-to-cover by leaders shaping the next decade of their industry, turning demand scenarios, market dynamics and valuation benchmarks into decisions.
CXOs/ Presidents/ VPs/ Managers
M&A and Corporate Development
Strategy Teams and R&D Heads
Procurement and Product Directors
Regulatory and Compliance Leaders
Investor Relations and Equity Analysts