Market Minds Advisory
Cold Insulation Market

Cold Insulation Market: Vapour Barrier Integrity, Cryogenic Demand, and the Blowing Agent Transition Reshaping Foam Economics

Insulating below ambient temperature is a moisture problem disguised as a thermal one, and the liquefied gas buildout is now testing that distinction at a scale the industry has not handled before.

Lead Analyst

Bilal Shaikh

Published

September 2026

Make Smarter Decisions with Customized Research Insights

Request a free sample report and evaluate market opportunities, growth trends, and competitive dynamics relevant to your business needs.

2025 MARKET VALUE$6.4BMarket Size 2025
2036 FORECAST VALUE$13.2BBase Case , 2026 to 2036
CAGR 2026 TO 20366.8 %Bull 8.0% / Bear 5.5%
INCREMENTAL OPPORTUNITY$6.4BNet 10- year value creation
EXPANSION MULTIPLE1.93x2036 value over 2026 base
Strategic Levers
M&A Pipeline
Regional Outlook
Country Rankings
Competitive Intelligence
Segmental Deep-dive
Call-Us : 91 93563 13602

Executive Snapshot and Market Trajectory

Cold insulation fails in a way hot insulation never does. Water vapour drives inward toward the cold surface, condenses inside the material, and destroys both the thermal performance and the pipe beneath it. Vapour barrier integrity, not thermal conductivity, decides whether a system lasts. Everything commercial follows from it.
Commercial power sits with producers who supply a tested system including the vapour barrier, sealants, and supports rather than the insulation alone. Aerogel blanket grows fastest at 12.4%, roughly 1.82 times the market, from a base that stays small against foam volumes. East Asia holds 30% of global value, carried by cold chain construction and by liquefied gas terminal work spread across the region.
Concentration is moderate at roughly 34% for the top five, and material specialisation matters more than overall scale in most tenders. Liquefied natural gas and cryogenic projects account for 28% of demand and specify differently from everything else, which splits the competitive field. Blowing agent regulation keeps forcing reformulation. Each transition costs thermal performance and forces requalification across the range. Producers have absorbed three transitions in two decades, each with a requalification bill.
Market Definition
The market comprises insulation materials supplied for below-ambient and cryogenic service, covering polyisocyanurate and polyurethane foam, cellular glass, phenolic foam, elastomeric nitrile rubber foam, extruded and expanded polystyrene, and aerogel blanket. Value is measured at manufacturer level across process, refrigeration, cold storage, and liquefied gas applications. Above-ambient process and building envelope insulation, refrigeration equipment, vapour barrier films sold separately, and installation labour fall outside scope.
Base Year Value
$6.4B in 2025 (MMA Primary Research Dataset, August 2026)
Forecast Period
2026 to 2036, eleven discrete annual values
CAGR
6.8% base case. Bull 8.0%. Bear 5.5%.
Fastest Growth Segment
Aerogel Blanket Insulation: 12.4% CAGR
Fastest Growth Country
India: 9.6% CAGR
Fastest Growth Region
South Asia and Pacific: 9.0% CAGR
Largest Region
East Asia: 30% of 2025 global value
Market Leaders
Armacell, Owens Corning, Kingspan Group, BASF, and Aspen Aerogels lead on cold insulation revenue. Source: company annual reports and MMA Analysis, July 2026.
Primary Survey
n=3,800 procurement and R&D decision-makers, Q4 2025, six countries
Methodology
Demand-side build-up, cross-validated against public data, 47 expert interviews

Cold Insulation Market Forecast Scenarios

cold-insulation-market-trends-size-forecast-scenario-1787465402829
Between 2020 and 2025 growth came from two directions that barely overlap. Cold chain construction expanded across Asia and North America as pharmaceutical distribution and food retail both scaled their chilled capacity. Liquefied gas investment restarted forcefully after 2022 as European buyers replaced pipeline supply. Raw material prices rose sharply through the same period. The 5.6% historical growth mixes project volume with a good deal of pass-through pricing.
The 6.8% base case rests on three mechanisms. Liquefied natural gas liquefaction and regasification capacity under construction globally converts into cryogenic insulation demand on a defined engineering timetable, and it specifies premium materials. Cold chain buildout continues across Asia and Latin America where chilled storage capacity per capita remains far below developed market levels. And corrosion under insulation remediation on ageing process plant generates replacement demand independent of any new construction at all.
The 8.0% bull case assumes the current liquefied gas project pipeline reaches final investment decision broadly on schedule and cold chain investment holds. The 5.5% bear case reflects project deferrals, weaker industrial capital spending, and blowing agent transitions raising foam costs faster than customers will absorb them. Project timing, not demand, is the real uncertainty in both cases.

Where Moisture, Not Heat, Sets the Engineering Problem

Three things set the commercial shape of this market. Moisture physics comes first, because on a cold surface the vapour drive runs inward permanently and any breach in the barrier admits water that never leaves. Service temperature comes second, since a chilled water line at five degrees and a liquefied gas line at minus 162 are different engineering problems with different qualified materials. Installation quality comes third and arguably matters most of all.
TOP-FIVE CONCENTRATION34%Share of global cold insulation supply held by leading producers
AVERAGE INSTALLED PRICEUSD 62 per metreTypical delivered and fitted cost on chilled process piping
CRYOGENIC DEMAND SHARE28%Portion of demand from liquefied gas and cryogenic projects
BLOWING AGENT SHARE17%Blowing agent and polyol input within total foam cost
INSTALLATION LABOUR MULTIPLE2.4xFitting cost relative to delivered material on typical projects
REPLACEMENT CYCLE LENGTH14 yearsTypical service life before wet insulation demands system replacement
That last point is the one buyers underestimate. Fitting cost runs roughly 2.4 times the delivered material cost, and the system almost always fails at a joint, a support penetration, or a badly sealed termination rather than through the material itself. Producers who train and certify installers protect their material against being blamed for somebody else's workmanship.
Corrosion under insulation is the resulting commercial reality across process industry. Wet insulation holds water against carbon steel and the pipe corrodes invisibly for years until a failure or an inspection finds it. Remediation programmes on ageing plant now generate a meaningful stream of replacement demand, and they specify closed-cell materials that will not hold water in the first place.
"Everyone specifies cold insulation on thermal conductivity, and almost nobody fails on it. Systems fail because water got in at a pipe support somebody rushed on a Friday afternoon, and then the pipe rotted quietly for eleven years. The material data sheet is the least interesting document in the package."
Practice Director, Industrial Materials and Process Equipment · MMA Chemicals and Materials Practice · August 2026

Market Trends

Liquefied Gas Buildout Pulls Demand Toward Cryogenic Specification

Liquefaction and regasification capacity under construction across the United States Gulf Coast, Qatar, and East Asia converts into cryogenic insulation demand on an engineering timetable that project schedules make visible years ahead. Service at minus 162 degrees Celsius eliminates most materials outright and leaves cellular glass, specialised polyisocyanurate, and multi-layer systems competing. Around 28% of demand now comes from this application, and it prices very differently from chilled water or cold storage work. Producers without cryogenic qualification are locked out of the fastest-growing project category regardless of what their foam costs per cubic metre.
Market Impact: Adds capacity growing above 9%
Corrosion Under Insulation Drives Replacement Independent of Construction

Process operators have moved from reactive repair to inspection-led remediation programmes, and wet insulation on carbon steel is the mechanism they are chasing. Water trapped against pipework corrodes it invisibly, and the failures tend to be expensive and occasionally dangerous. Typical replacement now happens near the fourteen-year mark rather than being deferred indefinitely. Commercially this creates a demand stream that continues through capital spending downturns, because the driver is asset integrity rather than expansion. It also favours closed-cell materials that do not absorb water, which reshuffles material share on every remediation specification written.
Market Impact: Supports 28% of total demand

Market Opportunities and Growth Drivers

Cold Chain Construction Expands Across Asia and Latin America

Chilled and frozen storage capacity per capita in India, Southeast Asia, and much of Latin America remains a fraction of developed market levels, and food loss statistics keep the issue on government agendas. India's cold chain investment programmes under agricultural infrastructure funding have supported steady warehouse construction, and pharmaceutical distribution requirements add a higher specification layer on top. Cold storage insulates large flat surfaces rather than complex pipework, which suits panel and board products. The demand is less technically demanding than cryogenic work but far larger in volume terms, and it grows with construction rather than with industrial capital cycles.
Market Impact: Blowing agents are 17% of cost

Liquefied Gas Investment Restarted Forcefully After European Supply Shifts

European buyers replacing pipeline gas with seaborne liquefied natural gas triggered terminal and liquefaction investment that IEA gas market reporting has tracked through successive editions. Regasification capacity added across Europe since 2022 plus liquefaction under construction in North America and Qatar represents a project pipeline visible years in advance. Each terminal, each carrier, and each storage tank carries cryogenic insulation content measured in thousands of cubic metres. This is the single most predictable demand driver in the market, because engineering procurement schedules publish long before the material is ordered. Ordering follows a schedule anyone can read.
Market Impact: Labour runs 2.4 times material

Market Restraints and Challenges

Blowing Agent Regulation Forces Repeated Costly Foam Reformulation

Rigid foam performance depends on the gas trapped in its cells, and successive regulations have removed the best-performing options. The root cause is atmospheric: chlorofluorocarbons damaged ozone and hydrofluorocarbons carry high global warming potential, so the Kigali Amendment phase-down keeps closing options. Each transition costs thermal performance and requires requalification, and blowing agent plus polyol already accounts for 17% of foam cost. Producers are mitigating through hydrofluoroolefin adoption, water-blown formulations, and vacuum or aerogel alternatives that avoid the chemistry entirely. None of these routes restores the performance the industry started with.
Market Impact: Cryogenic work reaches 28% of demand

Installation Quality Determines Whether Any Material Actually Performs

Fitting cost runs about 2.4 times material cost, and the vapour barrier is only as good as its worst joint. The root cause is that cold insulation is a system assembled on site by contractors under schedule pressure, not a product installed in a factory. A single unsealed penetration admits moisture that migrates through the whole run. Producers respond with installer certification schemes, prefabricated pipe sections, factory-applied jacketing, and detailed installation specifications. Each helps, and none removes the fundamental exposure that somebody else's workmanship decides whether the material gets blamed.
Market Impact: Replacement cycles run near 14 years
4 additional market trends, 3 additional growth drivers, and 2 additional restraints and challenges are covered in the full report. Contact sales@marketmindsadvisory.com to access the complete intelligence.

Segment CAGR and Growth Architecture

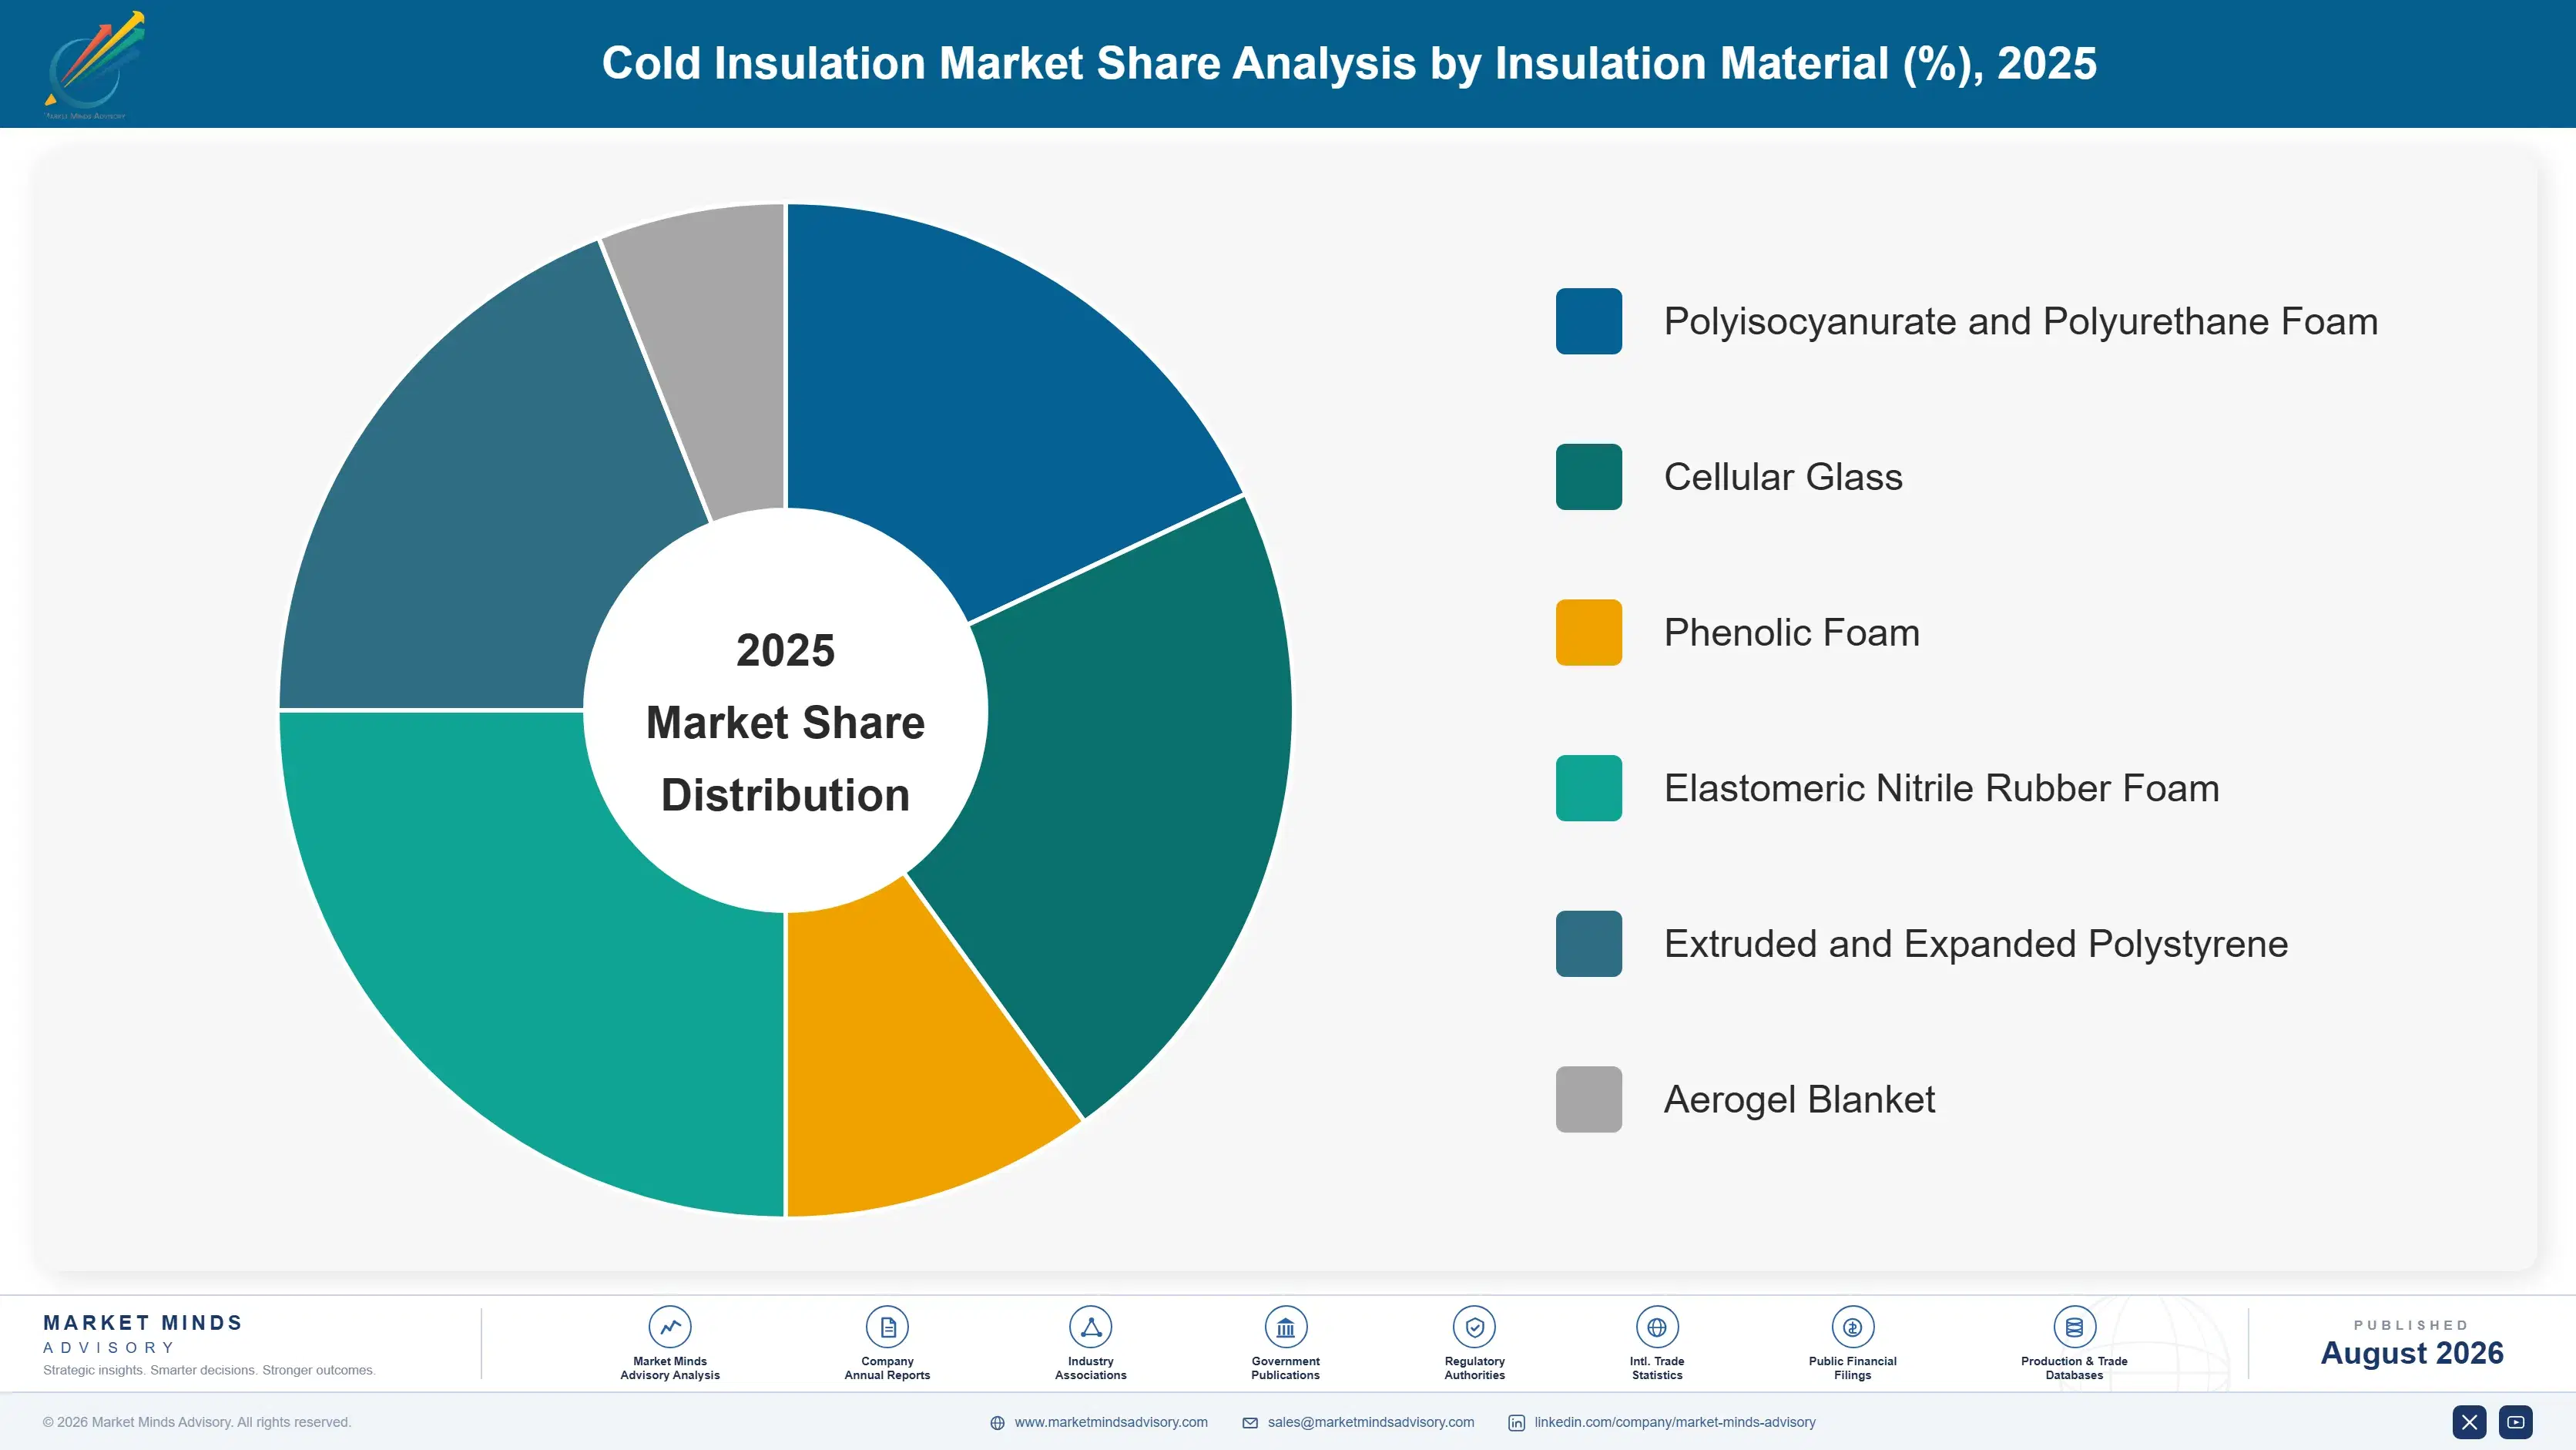
Segmentation follows insulation material, because material determines the service temperature range a system can hold, whether the structure absorbs water, which blowing agent regulations apply, and what the installed cost looks like. Six material families cover commercial supply, and they compete only across parts of the temperature range rather than everywhere. Cryogenic service narrows the field to two of them.
cold-insulation-market-trends-market-share-analysis-1787465403378

Aerogel Blanket Insulation

The fastest-growing family at 12.4%, roughly 1.82 times the market, and the smallest by volume by a wide margin. Aerogel blanket delivers thermal performance per millimetre that no foam approaches, and it is hydrophobic, which addresses the moisture problem at the material level rather than through a barrier that installers must get right. Both properties matter on congested process plant where pipe spacing was designed decades ago for thinner systems. Cost is the constraint: material runs several times foam pricing per cubic metre, and the case only closes where space is genuinely unavailable or where corrosion history has made reliability expensive. Aspen Aerogels and Cabot both supply this application directly.
CAGR 12.4%

Cellular Glass

Second fastest at 7.6%, and the default answer wherever cryogenic service and fire performance both matter. Cellular glass absorbs no water at all, which removes the entire corrosion under insulation mechanism rather than managing it, and it is dimensionally stable from minus 260 degrees Celsius upward. Liquefied gas terminals, tank bases, and cryogenic pipework specify it routinely, which ties the segment directly to the project pipeline driving 28% of market demand. The drawbacks are cost, weight, and brittleness during handling, and installed cost sits well above foam alternatives. Owens Corning holds the dominant position in this material through its Foamglas business worldwide. Handling damage on site is the recurring commercial complaint.
CAGR 7.6%
Full segment breakdown across 6 segments available in the complete report.

Regional Architecture and Country Demand Map

Regional shares follow project construction and cold chain investment rather than population or industrial output. Liquefied gas terminal work, refinery and petrochemical maintenance cycles, and chilled warehouse building each dominate in different regions, which makes the demand mix look different market by market. Specification standards vary as widely.

North America

Gulf Coast liquefaction is the defining demand pool here, and the projects under construction and permitting carry cryogenic insulation content measured in thousands of cubic metres each. Alongside that sits an ageing refining and petrochemical base where corrosion under insulation remediation has become a funded inspection-led programme rather than reactive repair. Cold storage construction adds a third stream, driven by food retail distribution and pharmaceutical handling requirements that keep specifications tight. Contractor availability rather than material supply is frequently the binding constraint on project schedules across the region. Owens Corning, Armacell, and Johns Manville hold most of the qualified supply positions. Growth of 7.2% is project-led and therefore lumpy year to year.
Share: 25% | CAGR: 7.2% (2026 to 2036)

Western Europe

Regasification capacity added since 2022 lifted cryogenic demand sharply from a base that had been flat for years, and several floating and onshore terminals remain in commissioning. Beyond that, the region behaves like a maintenance market: petrochemical and refining assets are old, remediation is regular, and new industrial construction is modest. Fire performance and emissions regulation are applied more strictly here than anywhere, which favours cellular glass and mineral options over foams in several applications. Energy costs weigh on European foam production against imports. Armacell, Kingspan, and Recticel all hold meaningful positions across the region. Growth of 5.3% reflects a mature installed base rather than any weakness in specification standards.
Share: 19% | CAGR: 5.3% (2026 to 2036)
Regional intelligence for 5 additional markets available in the complete report: East Asia, South Asia and Pacific, Latin America, Middle East and Africa, Eastern Europe. Contact sales@marketmindsadvisory.com.
cold-insulation-market-trends-country-cagr-analysis-1787465403894

Four Moves That Change the Economics

Advantage in cold insulation comes from system responsibility, application qualification, and installer relationships rather than from thermal conductivity, which competitors match easily. Four moves are worth capital and management attention across the forecast period, and only one of them requires building any additional manufacturing capacity at all. The other three cost people rather than plant.

Take responsibility for the whole vapour barrier system

Cold systems fail at joints, supports, and terminations rather than through the material, and the producer who supplies only the insulation carries the blame without controlling the outcome. Selling the tested system, meaning insulation plus barrier, sealants, supports, and jacketing with a performance warranty, carries gross margins 9 to 15 percentage points above material-only supply. It also locks out competitors who can offer one component. The investment sits in testing, technical documentation, and field support rather than in plant, which makes it available to producers who cannot fund capacity expansion.
Market Impact: Adds 9 to 15 points of gross margin

Qualify for cryogenic service before the projects arrive

Liquefied gas work is 28% of demand and grows faster than the rest, but service at minus 162 degrees Celsius requires material qualification, project references, and engineering contractor approval that take years to assemble. Producers without that package cannot bid regardless of price. Qualification costs perhaps $3 million to $6 million in testing, sample supply, and technical engagement, against project awards that run into tens of millions. The engineering procurement schedules publish years ahead, so the timing is knowable, and the producers who moved early on the current pipeline are the ones bidding it now.
Market Impact: Opens 28% of total demand up to bidding

Build installer certification into the commercial offer

Fitting costs 2.4 times the material and determines whether the system performs, yet most producers treat installation as somebody else's problem. Certified installer networks reduce warranty exposure, protect the material from being blamed for workmanship failures, and give contractors a reason to specify a brand they know their crews can fit correctly. Producers running certification schemes typically hold 6 to 11 percentage points of price advantage on comparable specification. It costs training infrastructure and field engineers rather than capital, and it compounds because certified crews keep specifying what they were trained on.
Market Impact: Holds 6 to 11 points of price advantage

Chase remediation demand, not just new construction

Corrosion under insulation programmes generate replacement demand on a fourteen-year cycle that continues through capital spending downturns, because the driver is asset integrity rather than expansion. Remediation specifies differently too, favouring closed-cell and hydrophobic materials that will not repeat the failure. Producers weighted entirely toward new project work carry cyclicality they need not accept. Serving remediation requires inspection-led selling into maintenance and integrity teams rather than into engineering contractors, which is a different sales organisation entirely and one that most material producers have never properly built. Producers running that channel typically hold 20 to 30% of revenue in remediation work.
Market Impact: Taps into a recurring 14 year replacement cycle

Who Controls the Margin Pool

Concentration is moderate: the top five producers hold roughly 34% of global cold insulation revenue, and material specialisation splits the field more than overall scale does. Armacell leads on elastomeric foam and breadth of application coverage. Owens Corning holds a dominant cellular glass position through Foamglas that gives it the cryogenic segment almost by default, while Kingspan and BASF compete on rigid foam volume where the economics look quite different.
Competitive activity runs on three fronts. Application qualification is the first, because cryogenic and pharmaceutical work require references and testing that cannot be bought quickly. System responsibility is the second, and producers who warrant the whole assembly rather than the material are taking share from those who will not. Installer relationships are the third, and they are quietly the most durable of the three.

Pressure is building from two directions. Chinese and Indian foam producers are competitive on commodity cold storage and chilled water work in any market they can reach, which compresses margin at the volume end. And aerogel suppliers are taking premium process applications from foam on space and reliability arguments rather than on price.
cold-insulation-market-trends-company-positioning-matrix-1787465404425

Competitive Moat and Risk Dimensions

ARMACELL

Moat: Elastomeric foam application breadth

Flexible closed-cell elastomeric foam covers chilled water, refrigeration, and process cooling across an enormous range of pipe sizes and geometries, and Armacell supplies it from plants close to most major markets. That combination of material position and delivery reach lets the company serve specifications that single-plant or single-material competitors cannot cover economically at all.
ARMACELL

Risk: Blowing agent and feedstock exposure

Elastomeric foam economics depend on nitrile rubber, blowing agents, and process energy, all of which have moved sharply and none of which the company controls. Successive regulatory transitions on blowing chemistry force reformulation and requalification on a cycle that adds cost without adding any performance the customer will pay extra for.
OWENS CORNING

Moat: Cellular glass cryogenic position

Foamglas absorbs no water, holds dimensional stability far below cryogenic service temperatures, and carries decades of liquefied gas project references behind it. Engineering contractors specify it by name on tank bases and cryogenic pipework, which makes the position closer to a standard than to a preference and leaves competitors bidding around it rather than against it.
OWENS CORNING

Risk: Cost and handling disadvantage

Cellular glass is expensive, heavy, and brittle during installation, and installed cost sits well above foam alternatives on any application where cryogenic performance is not strictly required. Aerogel now competes directly on space-constrained process work, and any material offering comparable water resistance at lower installed cost would erode the position quickly.

Players Tracked

Prominent Players

Armacell
Owens Corning
Kingspan Group
BASF
Aspen Aerogels

Other Key Players

Johns Manville
Huntsman
Dow
Rockwool A/S
Knauf Insulation
L'Isolante K-Flex
NMC SA
Zotefoams
Cabot Corporation
Recticel
Saint-Gobain
Unifrax
Sekisui Chemical
Nichias
Anhui Huaneng Insulation

Recent Developments

APRIL 2025

Aspen Aerogels expands industrial blanket capacity

The company added manufacturing capacity for hydrophobic aerogel blanket directed at process and cryogenic applications, extending supply beyond its energy infrastructure base. Demand has come from operators replacing wet foam on congested plant where pipe spacing prevents thicker conventional systems being fitted. Pricing remains well above foam.
Signal: Space constraint and corrosion history, rather than thermal performance alone, are what actually sell aerogel here
JULY 2025

Armacell commissions additional Asian production capacity

New elastomeric foam capacity entered service to serve cold chain and chilled water demand across the region. The expansion was organic rather than acquisitive, and it shortens delivery distance into markets where local competitors had been winning on freight cost and lead time. Regional demand looks durable.
Signal: Delivery proximity is becoming genuinely decisive in commodity applications where the material specification differences are largely marginal
OCTOBER 2025

Cellular glass supply contracted for Gulf liquefaction

A multi-year supply agreement was concluded covering cellular glass for cryogenic tank base and pipework insulation on Gulf liquefaction expansion. The award was a supply agreement rather than any joint venture, and it commits capacity across several years of phased construction work. Phasing extends well beyond 2030.
Signal: Cryogenic project awards lock capacity years ahead, which rewards producers who qualified before the pipeline formed

What Sets the Cost Base

Petrochemical feedstocks dominate. Polyol, isocyanate, and nitrile rubber together account for roughly 38% of production cost across foam products, and all three track oil and gas derivative pricing. Blowing agents contribute 17%, driven by hydrofluoroolefins costing several times the hydrofluorocarbons they replaced. Process energy takes 12%, rising sharply for melt-based cellular glass. Facings, jacketing, and packaging absorb the remainder.
The 2022 energy shock exposed the exposure clearly. European propylene and isocyanate pricing followed gas costs upward, IEA reporting documented industrial gas prices in Europe reaching several times North American levels, and foam producers passed through what they could while losing volume to imports on the rest. BASF and Armacell both referenced raw material and energy cost pressure across their 2022 and 2023 reporting. Cellular glass production, being melt-based, took the energy increase directly.

Exposure divides on material chemistry and production geography rather than on scale. Foam producers carry petrochemical and blowing agent risk that moves with oil and regulation, while cellular glass and mineral producers carry furnace energy risk instead. European operations of either type pay more than American or Gulf competitors for the same inputs. Aerogel producers face precursor chemistry and drying energy instead.
cold-insulation-market-trends-cost-volatility-analysis-1787465404623

Move formulations to lower-cost blowing agent chemistry early

Hydrofluoroolefin adoption is required eventually by the Kigali phase-down, and producers who reformulate ahead of the deadline avoid paying spot premiums for scarce compliant material later. Early movers also complete requalification before customers demand it. The cost is thermal performance and development effort, and both are easier to absorb outside a period of regulatory scarcity pricing.

Index long-term project contracts to feedstock benchmarks

Cryogenic and cold chain projects contract material years before delivery, and fixed pricing across that horizon proved painful when petrochemical costs moved several hundred percent. Indexing to published polyol, isocyanate, or energy benchmarks shifts risk to buyers better placed to carry it. Engineering contractors resist, though resistance softens noticeably after any severe input cost cycle passes.

Locate foam production close to major project regions

Foam ships volume rather than weight, so delivered cost rises steeply with distance and local producers win on freight in commodity applications. Regional plants also shorten lead times that project schedules increasingly demand. Capital cost is the obstacle, and the decision depends on whether regional demand is durable or tied to a single construction cycle that will end.

Portfolio Architecture for Margin Defence

Margin follows qualification and system responsibility rather than volume. Commodity foam board and pipe section sold into cold storage and chilled water earns low to mid teens gross margin, because several producers meet the specification and the buyer picks on delivered price. Cryogenic materials, warranted systems, and aerogel earn several times that, since the buyer is purchasing project references, asset integrity, or space that cannot otherwise be found.
The volume and premium tension is real because foam lines need loading. Extrusion and moulding capacity is expensive and runs continuously, so producers take commodity cold storage work to hold utilisation even where margin barely covers conversion cost. That is defensible as long as the premium capacity stays available when a cryogenic project calls for it, and several producers have been caught committing capacity at the wrong moment.

High-value pools concentrate in three places: cryogenic project supply, warranted vapour barrier systems, and hydrophobic materials sold into corrosion remediation. Each is defended by qualification, warranty exposure, or physics rather than by price. Price competition arrives in each of them only when a competitor matches the qualification, accepts the same warranty exposure, or offers equivalent water resistance, and none of those happens quickly.

Volume / Commodity-Adjacent Tier

Standard polystyrene, polyisocyanurate board, and elastomeric pipe section supplied into cold storage and chilled water work. Wins on delivered cost from the nearest plant. The wide range reflects large regional differences in feedstock and energy cost.
Gross Margin: 11%-19%

Premium / Certified Tier

Cryogenic qualified materials and warranted vapour barrier systems supplied with performance guarantees. The buyer purchases project references and asset integrity rather than thermal conductivity, and engineering contractors specify by name.
Gross Margin: 26%-36%

Sustainability / Regulatory / Next-Generation Tier

Aerogel blanket, hydrofluoroolefin-blown foam, and low global warming potential formulations sold on space constraint or compliance. Small volumes at premium pricing. The range is wide because aerogel pricing has not yet settled commercially.
Gross Margin: 30%-46%
cold-insulation-market-trends-portfolio-architecture-1787465405148

High-value Sub-segments and Strategic Watch-out

Cryogenic Liquefied Gas Project Supply

The highest-value pool in the market and the one with the most visible forward pipeline. Qualification and project references take years to build, which keeps the bidding field small. Awards commit capacity across phased construction lasting several years. Early qualification is the only realistic entry route.
Gross Margin: 28%-38%

Warranted Vapour Barrier Systems

Selling the assembly rather than the material shifts responsibility toward the producer and margin along with it. Failures happen at joints and terminations, so the warranty is priced on installation control. Certified installer networks are what make the exposure manageable. Field engineering capability is what makes it work.
Gross Margin: 24%-34%

Volume Cold Storage and Chilled Water

The utilisation engine rather than the profit engine. Foam lines must run continuously, and this business keeps them loaded through project cycles that would otherwise leave capacity idle. Price it for contribution and expect nothing beyond that. Negotiate a contribution floor and hold it firmly.
Gross Margin: 11%-18%

Hydrophobic Remediation Materials

The strategic watch-out. Growth is genuine as corrosion programmes mature, but aerogel pricing sits several times above foam and the case only closes where space or failure history justifies it. Selling requires reaching integrity teams rather than contractors. Patience matters more than pricing in this pool.
Gross Margin: 30%-44%

How Demand Actually Reaches Producers

The annuity here is unusually good and widely underestimated. Cold insulation gets wet, and wet insulation stops working and starts corroding the pipe underneath, so systems are replaced on roughly a fourteen-year cycle whether or not anything new is built. Process operators running inspection-led integrity programmes now schedule that replacement rather than deferring it, which converts what used to be reactive repair into a predictable recurring stream that continues through capital spending downturns.
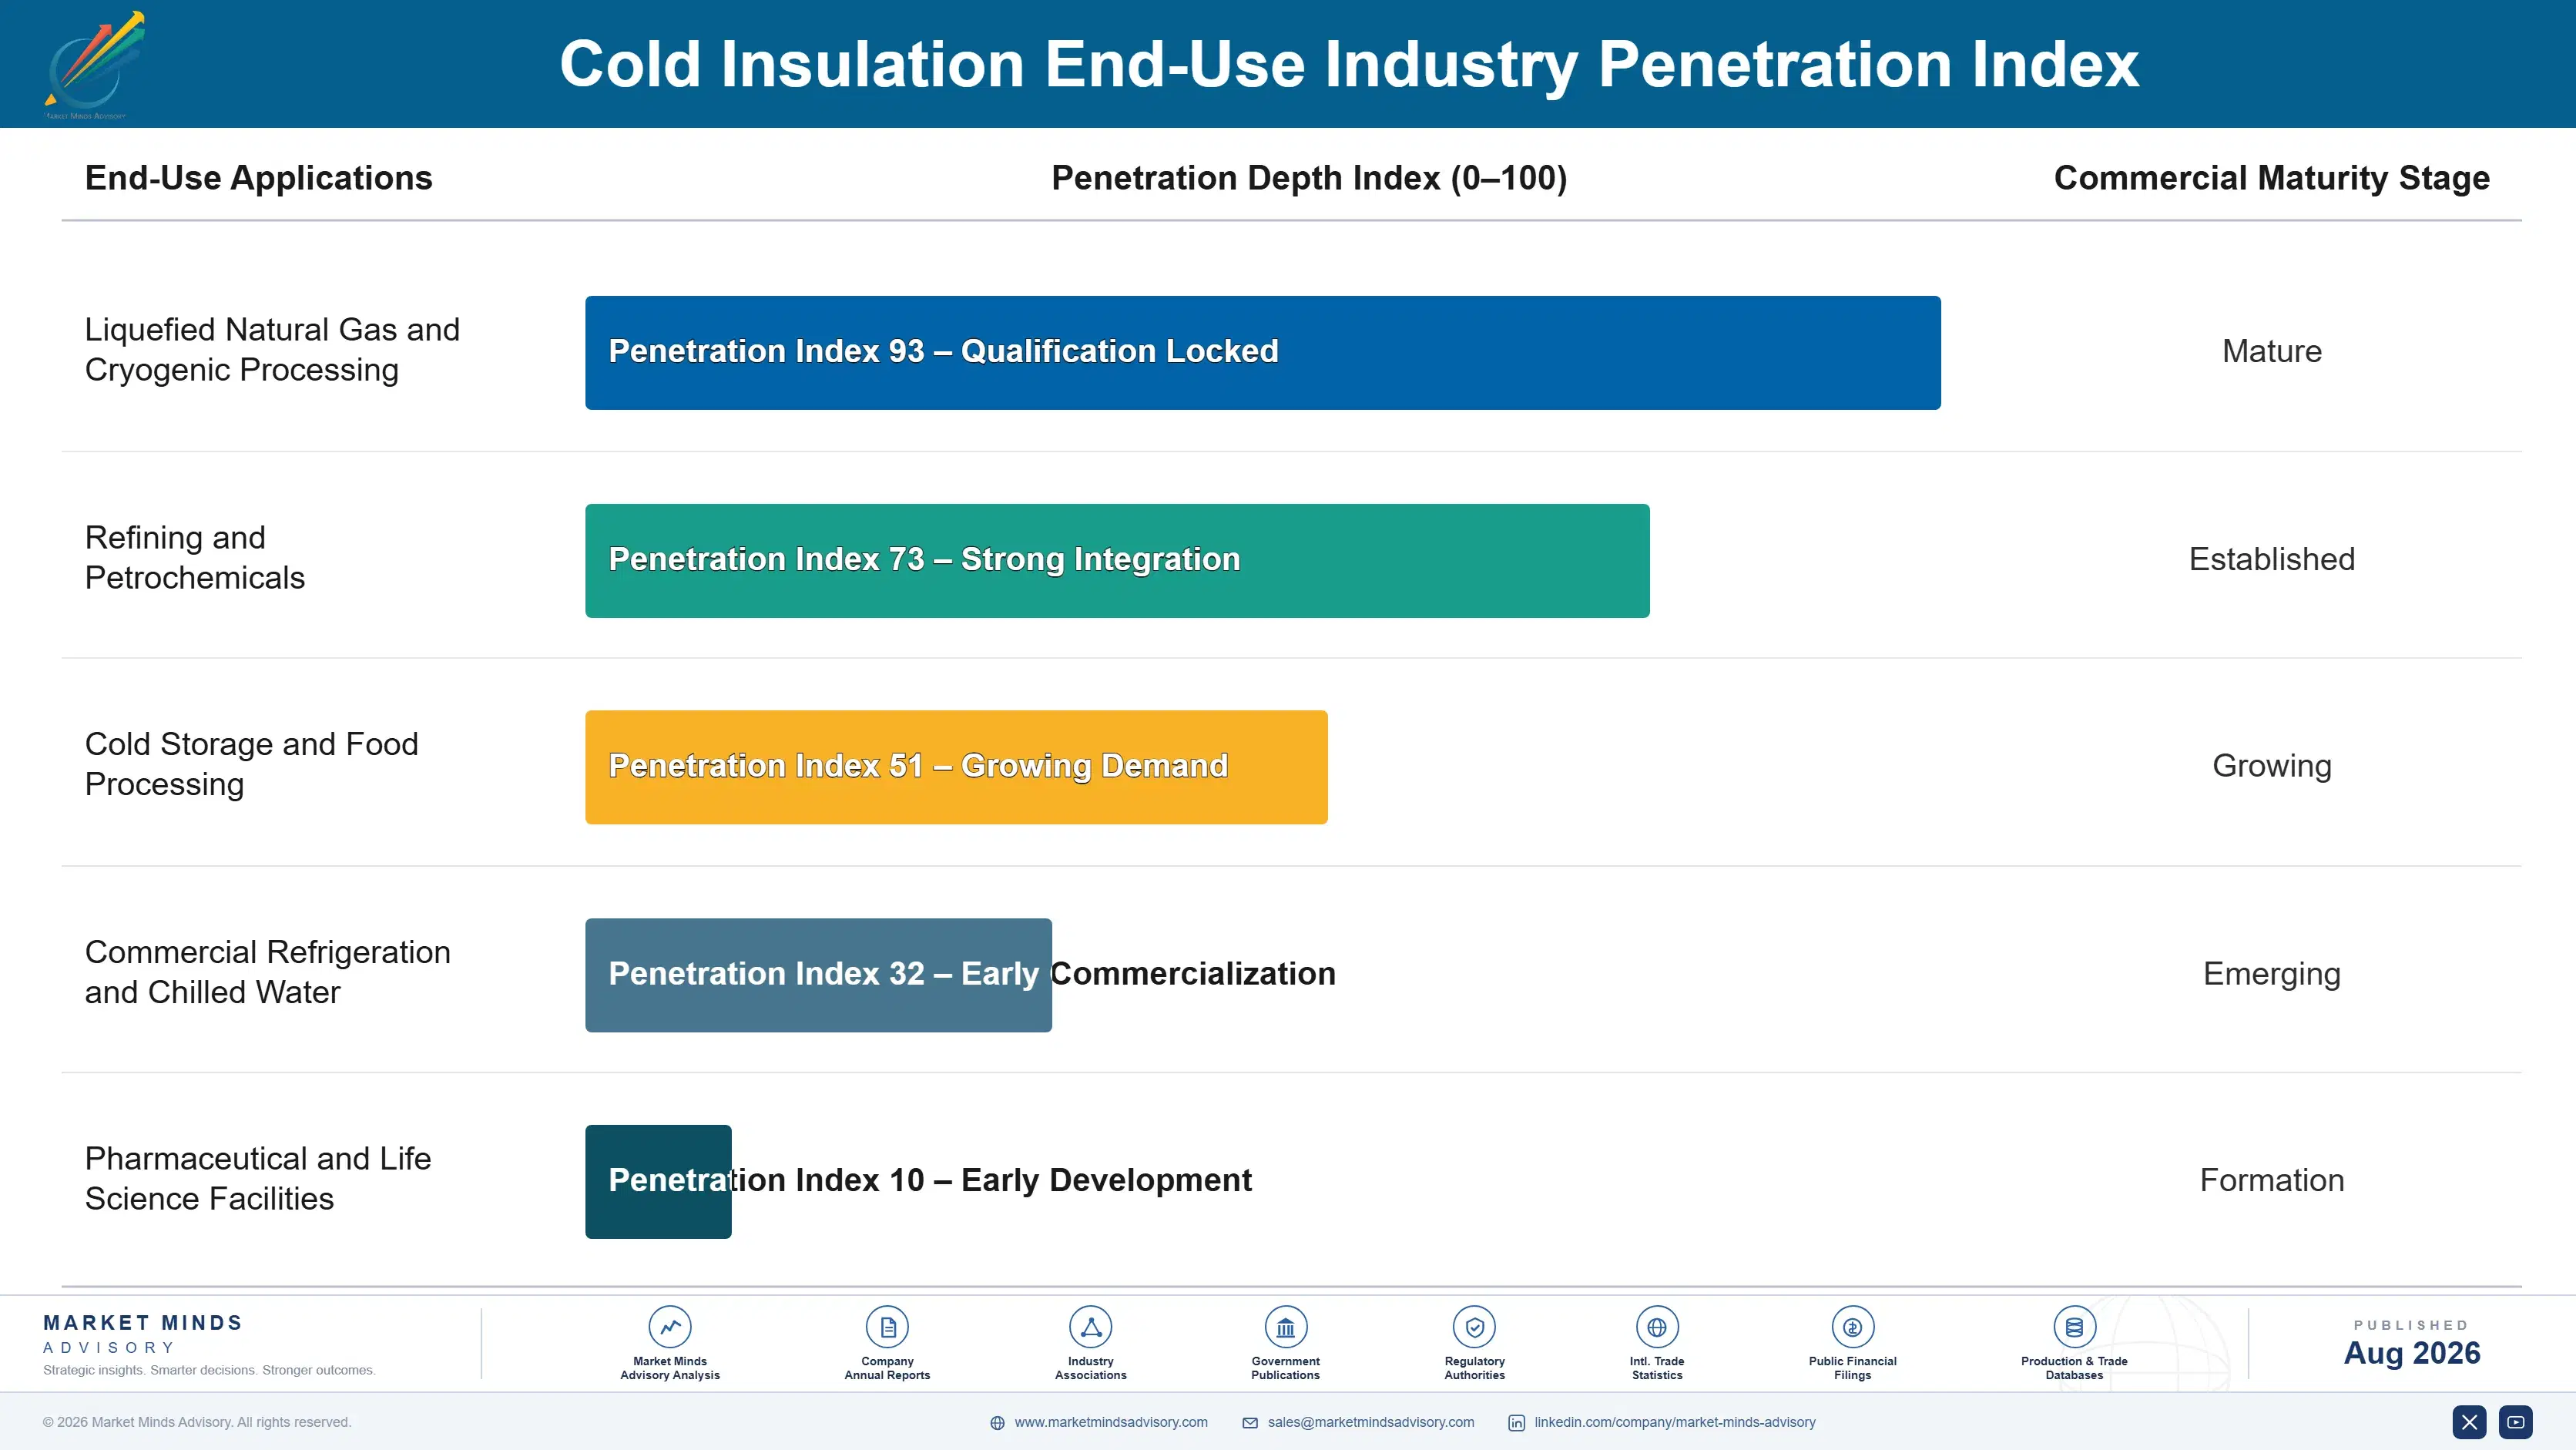
Adoption depth varies sharply by vertical. Liquefied gas and cryogenic operators specify to engineering standards with no discretion at all, and material choice is effectively fixed by service temperature. Petrochemical and refining operators have more latitude and increasingly choose on integrity history rather than on installed cost. Cold storage buyers are price-led and switch freely. Pharmaceutical distribution sits between the two, with validation requirements adding stickiness.

The buyer has shifted as well. Purchasing that once sat with engineering contractors now increasingly sits with asset integrity and maintenance teams who have seen what wet insulation does to carbon steel. Those teams buy on failure history rather than installed cost, and they treat a repeat failure as a supplier problem, which changes both specification and price.
cold-insulation-market-trends-end-use-penetration-index-1787465405692

Where the Money Sits

These are among the four positions where our research anticipates prominent divergence between winners and laggards over the coming forecast period. Each is grounded in the demand model, the regulatory perimeter, and the announced capacity pipeline.
01 / SYSTEM RESPONSIBILITY PRICING

Warrant the whole assembly, because material alone carries blame anyway

Cold systems fail at joints, supports, and terminations rather than through the insulation, yet the material supplier is blamed for failures it had no ability to prevent or control. Selling the warranted system including barrier, sealants, and jacketing moves 9 to 15 percentage points of gross margin toward producers willing to take that exposure. The investment is technical documentation and field support rather than plant, which puts the move within reach of producers who could never fund a capacity expansion.
02 / CRYOGENIC QUALIFICATION TIMING

Qualify years ahead, because project schedules publish long before orders

Liquefied gas work is 28% of demand and grows faster than the rest, but bidding requires material qualification and project references that take years rather than months to assemble properly. Qualification costs perhaps $3 million to $6 million against awards running into tens of millions, and engineering procurement schedules make the timing entirely knowable in advance. Producers who moved on the current pipeline are bidding it now, and everyone else is simply watching the awards go elsewhere without being able to respond.
03 / INSTALLER NETWORK CONTROL

Own the crews, because their workmanship decides your warranty

Fitting costs 2.4 times the material and determines whether any system performs, yet most producers still treat installation as somebody else's contractor problem that has nothing at all to do with them. Certification schemes reduce warranty exposure directly and hold 6 to 11 percentage points of price advantage on otherwise comparable specification work. The advantage also compounds over time, because certified crews keep specifying what they were trained on and contractors strongly prefer materials their own people can fit without callbacks.
04 / REMEDIATION CHANNEL BUILDING

Sell to integrity teams, not only to engineering contractors

Corrosion under insulation remediation runs on a fourteen-year replacement cycle driven by asset integrity rather than by expansion, so it continues through the capital spending downturns that flatten project demand. Reaching it requires inspection-led selling into maintenance and integrity organisations, which is a different buyer with different criteria and a different purchasing rhythm entirely. Most material producers have never built that channel at all, and the few that have carry visibly steadier volumes through industrial cycles that flatten everyone else.

Engagement Snapshot From the Field

A live engagement with an industry participant carrying material or product regulatory and market exposure ahead of a defining policy shift, showing how our research translates into a defensible multi-year portfolio strategy.
MARKET MINDS ADVISORY · CLIENT ENGAGEMENT SUMMARY
Cold Insulation Producer Strategic Portfolio Review and Transition Roadmap 2026·Investment Scenario on Cold Insulation Exposure Evaluation 2025-26
CLIENT PROFILE
A North American producer of rigid foam and elastomeric insulation with three plants and revenue concentrated in commodity cold storage and chilled water supply through distribution. Annual revenue ran near USD 210 million (client-reported, unverified by MMA). The business held no cryogenic qualification and sold material rather than systems, competing almost entirely on delivered price and lead time.
STRATEGIC CHALLENGE
Commodity margins had compressed for six consecutive quarters as imported foam reached inland markets, while Gulf Coast liquefaction projects the client could see from its own plants were awarding cryogenic packages to competitors. Management needed to know whether qualification was achievable in time to matter, and what it would cost to change how the business sold.
MMA APPROACH
MMA mapped the liquefied gas project pipeline against qualification requirements and engineering contractor approval processes, modelled margin outcomes for material supply against warranted system supply, and assessed the corrosion remediation channel across regional refining assets. Forty-seven expert interviews with integrity engineers, contractors, and specifiers established what actually drives material selection.
KEY FINDINGS
  1. Cryogenic qualification would take between three and four years including project references, placing the client outside the current award cycle but inside the following phase of Gulf Coast construction.
  2. Warranted system supply carried gross margin 12 points above material-only sales, and the required investment was technical documentation and field engineers rather than any new manufacturing capacity.
  3. Corrosion remediation demand across regional refining assets exceeded the client's entire cold storage revenue, and it was being served by competitors selling directly into integrity teams.
  4. Certified installer coverage explained most of the price variation observed between competing suppliers on technically identical chilled water specifications across the three states examined.
CLIENT PROFILE
A North American producer of rigid foam and elastomeric insulation with three plants and revenue concentrated in commodity cold storage and chilled water supply through distribution. Annual revenue ran near USD 210 million (client-reported, unverified by MMA). The business held no cryogenic qualification and sold material rather than systems, competing almost entirely on delivered price and lead time.
STRATEGIC CHALLENGE
Commodity margins had compressed for six consecutive quarters as imported foam reached inland markets, while Gulf Coast liquefaction projects the client could see from its own plants were awarding cryogenic packages to competitors. Management needed to know whether qualification was achievable in time to matter, and what it would cost to change how the business sold.
MMA APPROACH
MMA mapped the liquefied gas project pipeline against qualification requirements and engineering contractor approval processes, modelled margin outcomes for material supply against warranted system supply, and assessed the corrosion remediation channel across regional refining assets. Forty-seven expert interviews with integrity engineers, contractors, and specifiers established what actually drives material selection.
KEY FINDINGS
  1. Cryogenic qualification would take between three and four years including project references, placing the client outside the current award cycle but inside the following phase of Gulf Coast construction.
  2. Warranted system supply carried gross margin 12 points above material-only sales, and the required investment was technical documentation and field engineers rather than any new manufacturing capacity.
  3. Corrosion remediation demand across regional refining assets exceeded the client's entire cold storage revenue, and it was being served by competitors selling directly into integrity teams.
  4. Certified installer coverage explained most of the price variation observed between competing suppliers on technically identical chilled water specifications across the three states examined.
RECOMMENDED STRATEGY
Phase 1: Phase one: launch warranted system supply with field engineering support in the existing chilled water base, where the customer relationships already exist and qualification is unnecessary. Phase 2: Phase two: build direct selling into refinery and petrochemical integrity teams, targeting corrosion remediation demand that continues through industrial capital spending downturns. Phase 3: Phase three: begin cryogenic qualification and reference building immediately, accepting that revenue arrives only in the following liquefaction construction phase.
OUTCOME
The client launched warranted system supply within seven months and opened a dedicated integrity sales function the following quarter. System and remediation revenue reached 31% of the total within two years, and blended gross margin improved 4.1 percentage points while commodity volumes were deliberately held flat (client-reported, unverified by MMA).

Frequently Asked Questions

Foundational context covering the market sizes, CAGR, scope, country, region and competition that inform every finding below. This section is provided to cover basics and most often pre-purchase conversations, answered from the MMA Primary Research Dataset.

What is the current size of the Cold Insulation Market?

The market was valued at USD 6.4 billion in 2025, rising to an estimated USD 6.84 billion in 2026. East Asia holds the largest regional share at 30% of global value.

How large will the Cold Insulation Market be by 2036?

MMA forecasts USD 13.20 billion by 2036 under the base case, an expansion multiple of 1.93 times the 2026 value. That represents USD 6.36 billion of incremental value across the forecast period.

What is the CAGR for the Cold Insulation Market 2026 to 2036?

The base case CAGR is 6.8%, with a bull case of 8.0% and a bear case of 5.5%. The spread reflects uncertainty over liquefied gas project timing and blowing agent cost transitions.

Which segment is growing fastest?

Aerogel blanket grows fastest at 12.4%, roughly 1.82 times the market rate. Cellular glass follows at 7.6%, driven by cryogenic liquefied gas project demand across several regions.

Who are the major companies in the Cold Insulation Market?

Armacell, Owens Corning, Kingspan Group, BASF, and Aspen Aerogels lead on cold insulation revenue. The top five hold roughly 34% of global value, with strong material specialisation between them.

Which country is growing fastest?

India grows fastest at 9.6%, driven by cold chain capacity expansion under agricultural infrastructure funding alongside refinery and petrochemical construction. Chilled storage per capita remains far below developed market levels.

Report Segmentation Architecture

The full report scope spans multiple orthogonal segmentation dimensions, with cross-tabulated demand data provided for each dimension pair. Coverage extends further to regional breakdowns, trend trajectories, and the competitive detail needed to support segment-level decision-making.

By Insulation Material

  • Polyisocyanurate and Polyurethane Foam
  • Cellular Glass
  • Phenolic Foam
  • Elastomeric Nitrile Rubber Foam
  • Extruded and Expanded Polystyrene
  • Aerogel Blanket

By End-Use Industry

  • Liquefied Natural Gas and Cryogenic Processing
  • Refining and Petrochemicals
  • Cold Storage and Food Processing
  • Commercial Refrigeration and Chilled Water
  • Pharmaceutical and Life Science Facilities

By Sales Model

  • Engineering Contractor Project Supply
  • Distributor and Insulation Contractor Channel
  • Direct Maintenance and Integrity Supply
  • Original Equipment Manufacturer Supply
  • Warranted System Supply

By Region

  • North America
  • Western Europe
  • East Asia
  • South Asia and Pacific
  • Latin America
  • Middle East and Africa
  • Eastern Europe

Scope, Methodology, and Coverage

Every figure in this report is reproducible from documented input assumptions. The scope below maps the historical period, the forecast horizon, the segmentation dimensions, and the countries covered, alongside the underlying primary and qualitative methodology.
Historical Period
2020 to 2025
Forecast Period
2026 to 2036
Base Year
2025 (USD billions; MMA Primary Research Dataset, August 2026)
Market Definition
The market comprises insulation materials supplied for below-ambient and cryogenic service, covering polyisocyanurate and polyurethane foam, cellular glass, phenolic foam, elastomeric nitrile rubber foam, extruded and expanded polystyrene, and aerogel blanket. Value is measured at manufacturer level across liquefied gas, refining and petrochemical, cold storage, commercial refrigeration, and pharmaceutical facility applications. Above-ambient process insulation, building envelope insulation, refrigeration and chiller equipment, separately sold vapour barrier films and jacketing, and installation labour fall outside scope.
Quantitative Units
USD billions (current prices); million cubic metres of cold insulation shipped annually; USD per linear metre installed on reference pipe diameter
Segmentation Dimensions
By Insulation Material; By End-Use Industry; By Sales Model; By Region
Regions Covered
North America, Western Europe, East Asia, South Asia and Pacific, Latin America, Middle East and Africa, Eastern Europe
Countries Covered
United States, Canada, Mexico, Germany, Netherlands, United Kingdom, France, Italy, Spain, Belgium, Poland, Romania, China, Japan, South Korea, India, Australia, Singapore, Malaysia, Brazil, Chile, Qatar, Saudi Arabia, United Arab Emirates, South Africa
Key Companies Profiled
Armacell, Owens Corning, Kingspan Group, BASF, Aspen Aerogels, Johns Manville, Huntsman, Dow, Rockwool A/S, Knauf Insulation, L'Isolante K-Flex, NMC SA, Zotefoams, Cabot Corporation, Recticel, Saint-Gobain, Unifrax, Sekisui Chemical, Nichias, Anhui Huaneng Insulation
Quantitative Methodology
Primary survey, n=3,800 respondents, Q4 2025, six countries; demand-side model with trade association cross-validation
Qualitative Methodology
47 expert interviews, Q4 2025; applied to validate demand model assumptions, identify emerging dynamics, and assess competitive positioning
Report Format
PDF and XLSX data workbook (Word format preview document)
Publisher
Market Minds Advisory
Report Code
MMA-2026-CHM-141
Published
August 2026
Contact
sales@marketmindsadvisory.com | www.marketmindsadvisory.com

Purchase the full Cold Insulation Market Report (2026 to 2036).

The full report sizes cold insulation demand across six material families, five end-use categories, and seven regions with 2026 to 2036 forecasts under base, bull, and bear cases. It maps the liquefied gas project pipeline against cryogenic qualification requirements to show where awards will land and when. Competitive profiles cover twenty producers assessed consistently on cold insulation revenue, material position, and application qualification. Cost analysis traces petrochemical feedstock and blowing agent exposure through successive regulatory transitions. Commercial guidance addresses warranted system supply, cryogenic qualification timing, installer certification, and corrosion remediation channel building.
Six material families sized separately by region
Liquefied gas project pipeline mapped to cryogenic demand
Corrosion remediation replacement cycle quantified by industry
Blowing agent transition costs modelled through regulatory phase-down
Twenty producers assessed on one consistent revenue basis
Warranted system margin economics compared against material supply

Built For The People Who Decide

From boardroom strategy to bench-side execution, this report is read cover-to-cover by leaders shaping the next decade of their industry, turning demand scenarios, market dynamics and valuation benchmarks into decisions.
CXOs/ Presidents/ VPs/ Managers
M&A and Corporate Development
Strategy Teams and R&D Heads
Procurement and Product Directors
Regulatory and Compliance Leaders
Investor Relations and Equity Analysts