Market Minds Advisory
Coiled Tubing Market

Coiled Tubing Market: Coiled Tubing Market: String Fatigue Accounting, Crew Scarcity and Utilisation Nobody Discloses 2026 to 2036

A coiled tubing string dies by arithmetic rather than by failure. Operators who track fatigue properly retire strings early and get paid for it; the ones who do not eventually lose a well.

Lead Analyst

Published

September 2026

Make Smarter Decisions with Customized Research Insights

Request a free sample report and evaluate market opportunities, growth trends, and competitive dynamics relevant to your business needs.

2025 MARKET VALUE$4.8BMarket Size 2025
2036 FORECAST VALUE$9.7BBase Case , 2026 to 2036
CAGR 2026 TO 20366.6 %Bull 7.8% / Bear 5.4%
INCREMENTAL OPPORTUNITY$4.6BNet 10- year value creation
EXPANSION MULTIPLE1.90x2036 value over 2026 base
Strategic Levers
M&A Pipeline
Regional Outlook
Country Rankings
Competitive Intelligence
Segmental Deep-dive
Call-Us : 91 93563 13602

Executive Snapshot and Market Trajectory.

A coiled tubing string dies by arithmetic rather than by visible failure. Operators tracking fatigue properly retire strings early and charge for the discipline, and the ones who do not eventually lose a well and the reputation attached to it. Records rather than equipment win the work.
The market reaches USD 5.1 billion in 2026 and USD 9.7 billion by 2036, a 1.90 times expansion at 6.6% annually. Extended reach milling and intervention strings grow at 9.9%, half again the market rate of 6.6%, because horizontal laterals keep getting longer than the tubing that has to reach the end of them. North America holds 39% of activity, well above the usual band, on unconventional well intervention volume.
Five providers hold 56% of coiled tubing service revenue, and the position rests on crew availability and string management discipline rather than on equipment. SLB, Halliburton, Baker Hughes, Nine Energy Service and STEP Energy Services lead. Experienced supervisor scarcity constrains how many units can actually work. Units work around 41% of available days across the active fleet. Disciplined fleet sizing earns more than chasing share. Crew scarcity holds pricing better than those utilisation figures suggest.
Market Definition
This report covers coiled tubing services and equipment: continuous tubing deployed into wells for intervention, completion and drilling support work. It spans extended reach milling and intervention strings, well intervention and cleanout services, hydraulic fracturing plug milling, coiled tubing drilling and underbalanced applications, coiled tubing units and injector equipment manufacturing, and the tubing string manufacturing and fatigue management systems supporting them. It excludes wireline services, conventional workover rigs, drilling rigs and jointed pipe, downhole completion hardware sold separately, and pressure pumping services.
Base Year Value
$4.8B in 2025 (MMA Primary Research Dataset, September 2026)
Forecast Period
2026 to 2036, eleven discrete annual values
CAGR
6.6% base case. Bull 7.8%. Bear 5.4%.
Fastest Growth Segment
Extended Reach Milling And Intervention Strings: 9.9% CAGR
Fastest Growth Country
India: 11.3% CAGR
Fastest Growth Region
South Asia and Pacific: 8.6% CAGR
Largest Region
North America: 39% of 2025 global value
Market Leaders
SLB, Halliburton, Baker Hughes, Nine Energy Service and STEP Energy Services lead on coiled tubing service and equipment revenue. Source: MMA Analysis.
Primary Survey
n=3,800 procurement and R&D decision-makers, Q4 2025, six countries
Methodology
Demand-side build-up, cross-validated against public data, 47 expert interviews

Coiled Tubing Market Forecast Scenarios

coiled-tubing-market-size-forecast-scenario-1790002830654
Between 2020 and 2025 the category compounded at 5.4%, and the work changed more than the total did. Plug milling after hydraulic fracturing became the dominant application while conventional intervention grew slowly, and laterals kept extending until reaching the toe of a well became a genuine engineering problem rather than a routine operation. Utilisation stayed poor throughout, which nobody in the industry discusses openly.
The base case holds 6.6% on three mechanisms. Lateral lengths keep extending, which pushes work toward extended reach strings and larger diameter tubing that fewer providers can supply. Ageing wells keep requiring intervention as production declines and mechanical problems accumulate. And crew scarcity keeps constraining supply enough that pricing holds better than utilisation figures alone would suggest it should across the cycle. Those three mechanisms run largely independently of one another.
The bull case at 7.8% assumes intervention on existing wells accelerates as operators favour production optimisation over new drilling, which suits this service directly. The bear case at 5.4% is drilling activity contraction, where plug milling volume falls with completion counts and the units built for that work sit idle against a fixed cost base nobody can reduce quickly.

Strings Die By Arithmetic

Fatigue is the whole commercial discipline. A string accumulates damage every time it bends through the injector and over the gooseneck, and it reaches the end of usable life after around 120 runs whether or not anything looks wrong. Providers tracking that arithmetic retire strings early and price for it. Those who run strings past the calculation eventually part one in a well, which costs far more than the tubing.
TOP FIVE CONCENTRATION56%Held by providers with crew depth and string management discipline
UNIT UTILISATION RATE41%Working days against available days across the active fleet
STRING WORKING LIFE120 runsTypical usable string life before fatigue accumulation forces retirement
PLUG MILLING REVENUE SHARE53%Service revenue from milling completion plugs rather than conventional intervention
SUPERVISOR EXPERIENCE REQUIREMENT7 yearsField time before a supervisor runs extended reach work unaided
STRING COST SHARE27%Tubing string consumption within total service delivery cost
Utilisation is worse than anybody publishes. Units work around 41% of available days across the active fleet, because demand arrives in bursts tied to completion schedules and equipment cannot follow crews between basins economically. That figure sits underneath every pricing discussion in this industry and explains why providers with disciplined fleet sizing earn more than those chasing market share with equipment they cannot keep working.
Plug milling reshaped what this service is. Around 53% of revenue now comes from milling completion plugs after hydraulic fracturing rather than from conventional intervention work, which tied the category directly to drilling and completion cycles it was previously insulated from. Extended reach milling and intervention strings grow at 9.9% against 6.6% for the market as laterals keep getting longer.
"The whole business is a fatigue spreadsheet and a supervisor with seven years of scars. Everything else is trucks. I have watched companies with newer equipment lose work to competitors whose string records were credible enough that the operator slept at night."
Director, Well Intervention and Oilfield Services Practice · MMA Energy Practice · September 2026

Market Trends

Lateral Extension Outpaces What Tubing Can Reach

Horizontal laterals keep getting longer while the tubing that must reach the toe stays subject to the same buckling and friction limits it always had, which pushes work toward extended reach strings and larger diameters that fewer providers stock. Extended reach milling and intervention strings grow at 9.9% against 6.6% for the market. The engineering is genuinely harder and the string investment is larger, which narrows the competing field on exactly the work that is growing. String cost absorbs around 27% of service delivery cost and rises with diameter. Capital commitment narrows entry.
Market Impact: India compounds at 11.3% yearly
Plug Milling Tied The Service To Drilling Cycles

Around 53% of service revenue now comes from milling completion plugs after hydraulic fracturing rather than from conventional intervention, which connected this category directly to drilling and completion activity it had previously been partly insulated from. That improved growth during expansion and removed the countercyclical intervention work that once smoothed downturns. Providers that built fleets for milling volume carry a fixed cost base tied to completion counts they do not control at all. The countercyclical intervention work that once smoothed downturns was displaced rather than added to, which most providers only discover during a contraction.
Market Impact: Supervisors need 7 years experience

Market Opportunities and Growth Drivers

Ageing Well Stock Requires Continuous Intervention Work

Producing wells accumulate scale, sand, mechanical damage and declining productivity, and intervention becomes the cheaper alternative to drilling replacements when operators favour optimisation over expansion. India compounds at 11.3%, ahead of every other market, as domestic production programmes push intervention on mature fields rather than funding new drilling. That work is also less cyclical than plug milling, which makes it valuable to providers whose fleets are otherwise tied to completion counts. It also uses strings less aggressively than milling, which extends usable life beyond the typical 120 run figure meaningfully.
Market Impact: Utilisation runs near 41% only

Supervisor Scarcity Constrains How Much Fleet Works

A supervisor needs around seven years of field time before running extended reach work unaided, and the industry stopped hiring through two downturns that removed most of an intermediate generation. Units without qualified supervision do not work whatever the day rate offered. That constraint holds pricing better than utilisation near 41% would otherwise allow, and it advantages providers who kept training through the downturns rather than those rebuilding crews now. Rebuilding a supervisor pipeline takes the better part of a decade, which is why the constraint persists well beyond any single cycle.
Market Impact: Strings retire after 120 runs

Market Restraints and Challenges

Utilisation Stays Poor Across The Whole Fleet

Units work around 41% of available days because demand arrives in bursts tied to completion schedules and equipment cannot follow crews between basins economically. The root cause is that mobilisation cost and crew logistics make chasing work across regions uneconomic below a threshold most jobs never reach. Commercially this punishes fleet growth. Mitigation runs through disciplined fleet sizing, through basin-focused rather than national coverage, and through intervention work that schedules more predictably. The industry relearns this after every completion cycle and reliably forgets it during the following expansion. Nobody escapes it.
Market Impact: Strings last about 120 runs

String Failure Costs Far More Than The Tubing

A string parted in a well creates a fishing operation costing many times the tubing value and stopping production throughout, which is why fatigue tracking rather than equipment age determines what an operator will accept. The root cause is that fatigue accumulates invisibly and only arithmetic reveals it. Commercially this makes records a qualification requirement. Mitigation runs through automated fatigue logging, through conservative retirement policies, and through third party string audits operators can verify. Operators increasingly require those audits before awarding work at all, which turns a discipline into a qualification.
Market Impact: Plug milling drives 53% of revenue
3 additional market trends, 4 additional growth drivers, and 2 additional restraints and challenges are covered in the full report. Contact sales@marketmindsadvisory.com to access the complete intelligence.

Segment CAGR and Growth Architecture

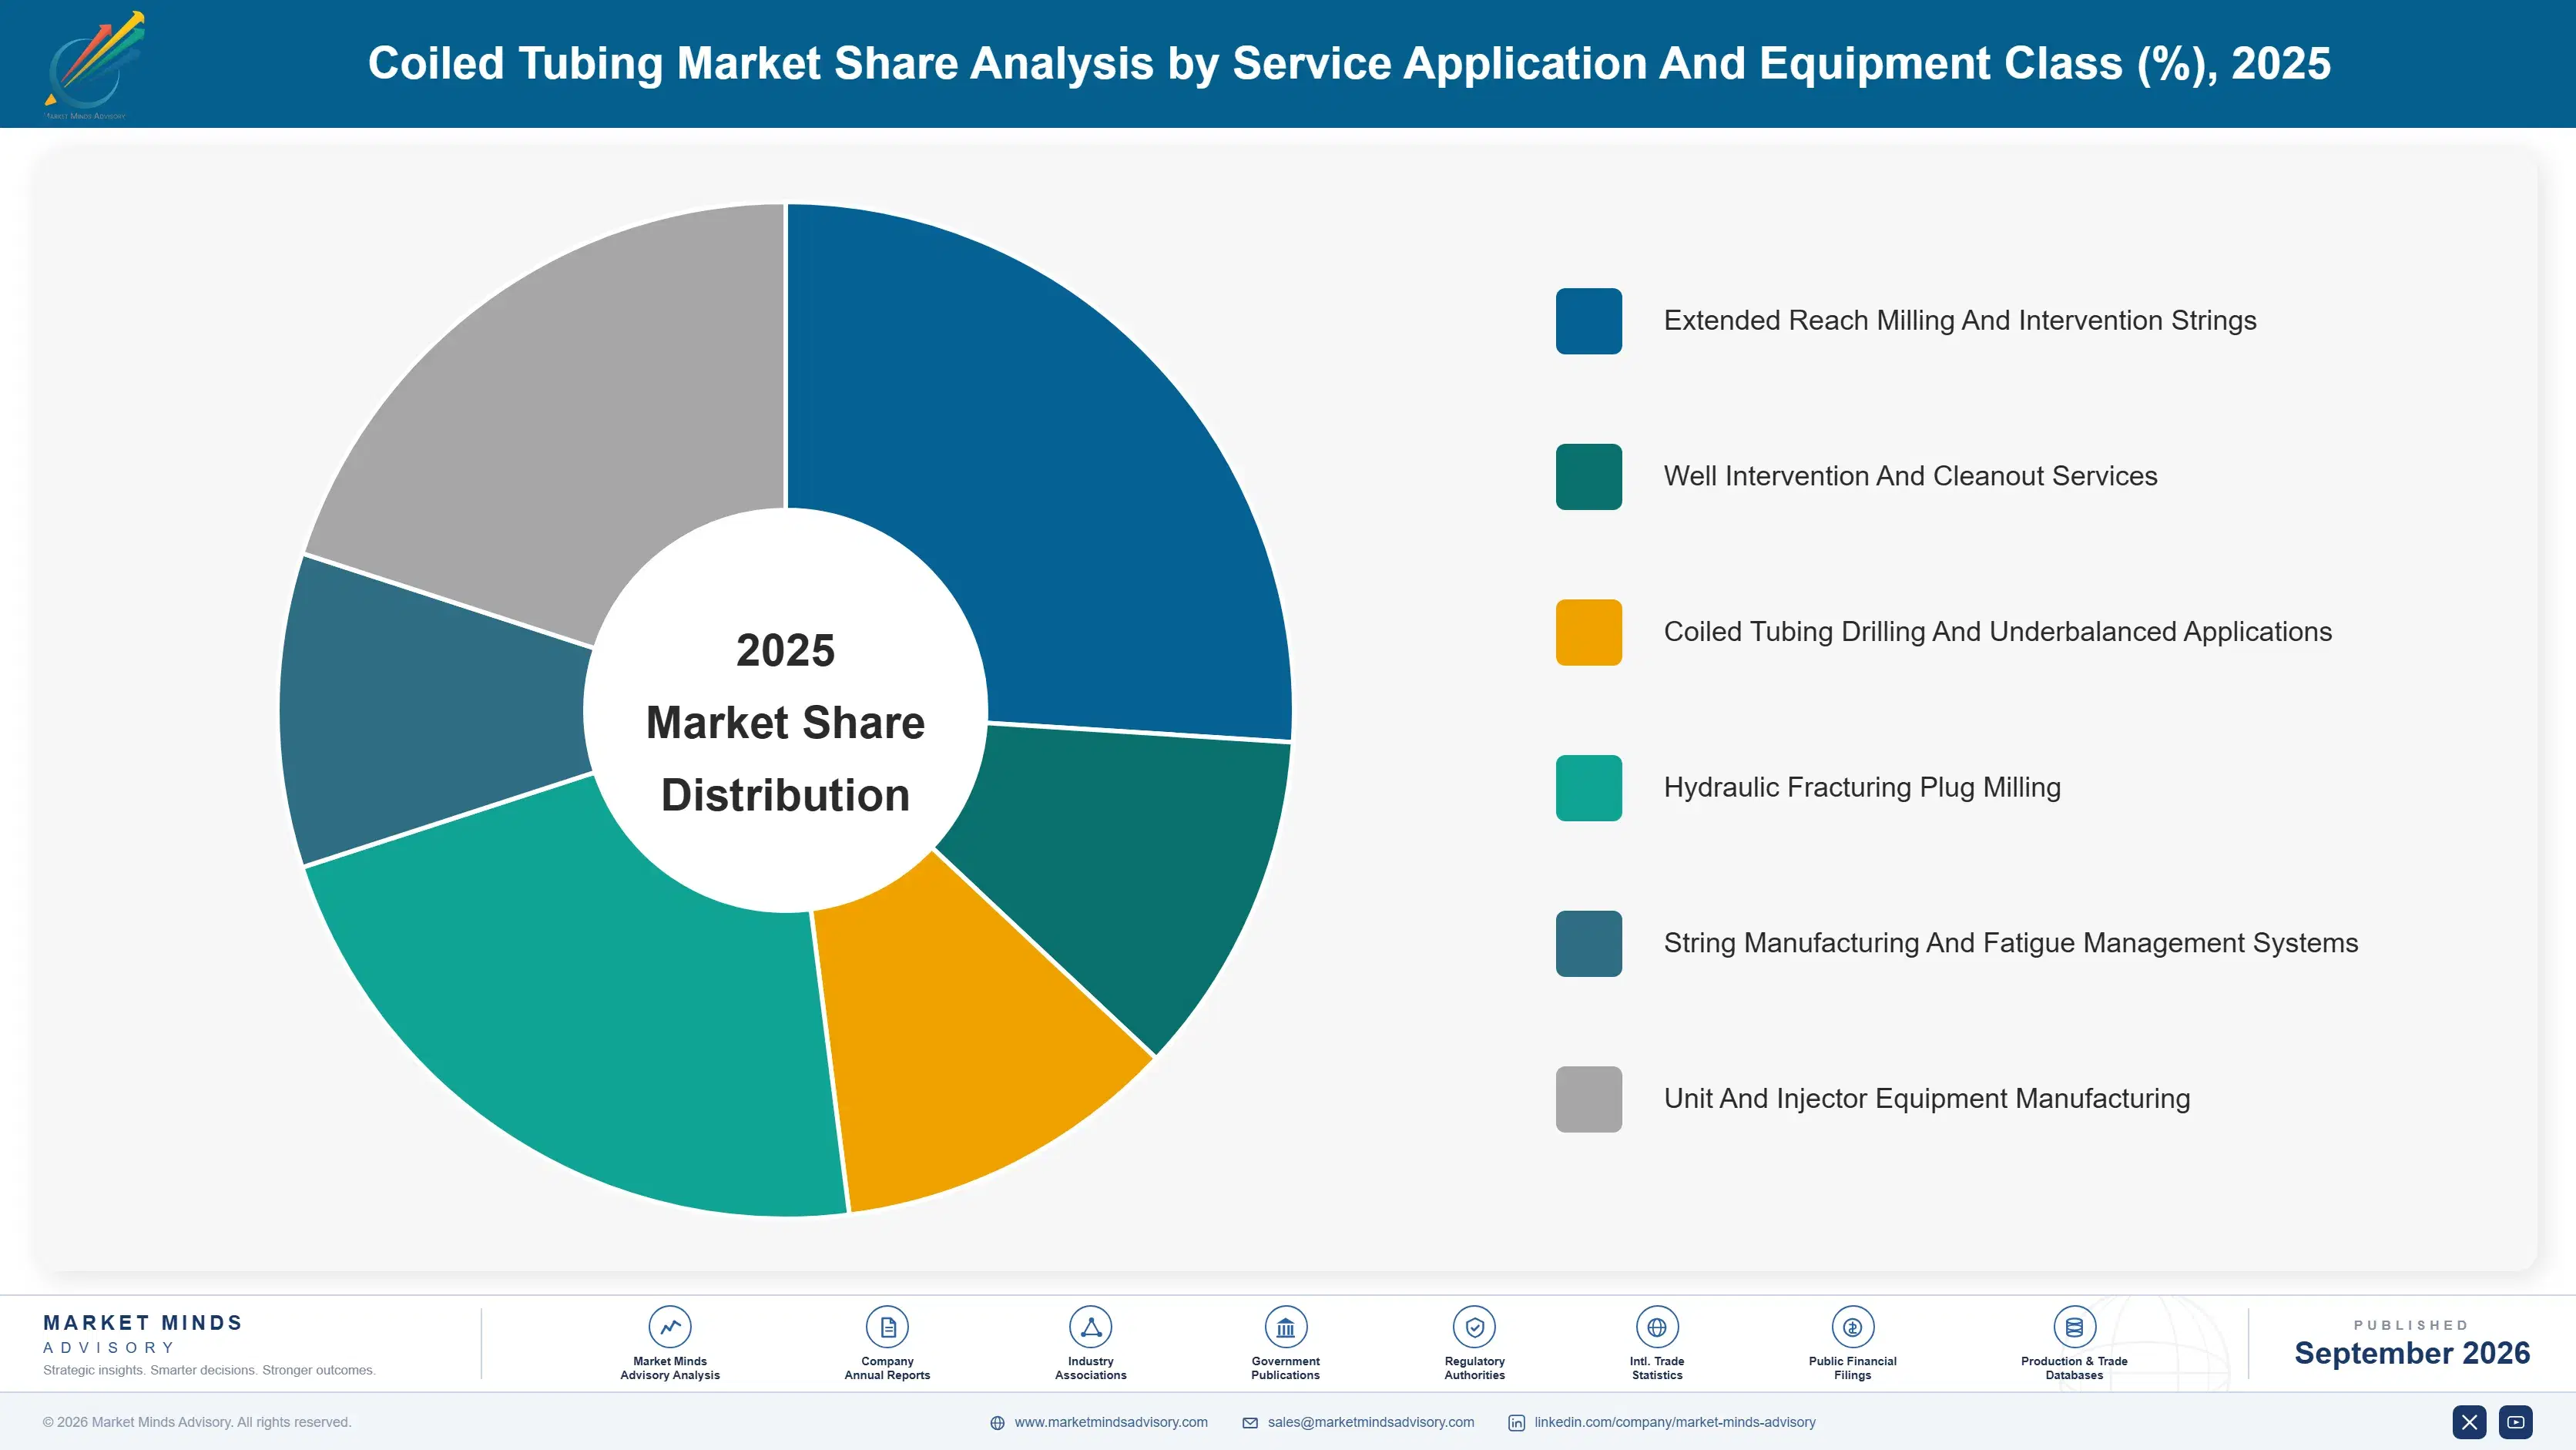
Segmentation follows service application and equipment class, since each carries quite different string consumption, crew requirement and exposure to drilling cycles. Six classes cover the market: extended reach milling and intervention strings, hydraulic fracturing plug milling, well intervention and cleanout services, coiled tubing drilling and underbalanced applications, unit and injector equipment manufacturing, and string manufacturing and fatigue management systems.
coiled-tubing-market-market-share-analysis-1790002831214

Extended Reach Milling And Intervention Strings

Extended reach milling and intervention strings grow at 9.9%, half again the market rate of 6.6%, because horizontal laterals keep extending while the tubing reaching the toe faces the same buckling and friction limits it always did. That pushes work toward larger diameter strings and friction reduction techniques fewer providers have invested in. String cost absorbs around 27% of service delivery cost and rises with diameter, so the capital commitment per string is substantially higher here, which narrows the competing field on precisely the work that is growing fastest. Engineering support requirements narrow it further still. The competing field on the fastest growing work is correspondingly narrow, which is unusual in a service business built largely on comparable equipment.
CAGR 9.9%

Well Intervention And Cleanout Services

Well intervention and cleanout services compound at 7.4% because producing wells accumulate scale, sand and mechanical damage continuously and intervention becomes cheaper than drilling a replacement when operators favour optimisation. This work schedules more predictably than plug milling and is considerably less tied to completion counts, which makes it valuable to providers whose utilisation near 41% otherwise swings with drilling activity. It also uses strings less aggressively than milling does, which extends usable life beyond the 120 run typical figure. That predictability is worth more to a provider than the day rate difference, because utilisation rather than pricing is what determines whether a fleet earns anything at all. Mix balance matters.
CAGR 7.4%
Full segment breakdown across 6 segments available in the complete report.

Regional Architecture and Country Demand Map

North America holds 39% of activity, well above the usual band, because unconventional completion volumes generate plug milling work at a scale no other region approaches. East Asia follows at 17% on Chinese domestic production programmes. India compounds fastest at 11.3% on mature field intervention.

North America

North America takes 39% of coiled tubing activity, well above the 32% band ceiling, because unconventional completion volumes generate plug milling work at a scale no other region approaches and around 53% of category revenue globally comes from that application. Nine Energy Service and STEP Energy Services operate almost entirely here. Utilisation near 41% is a North American problem before it is anybody else's, since fleet growth followed completion counts closely. Growth at 6.9% tracks completion activity rather than intervention demand. Extended reach work is also most advanced here, since laterals in the major unconventional basins are the longest anywhere in the world. Fleet overhang is worst here too. Growth tracks completion counts.
Share: 39% | CAGR: 6.9% (2026 to 2036)

East Asia

East Asia accounts for 17% of activity, driven by Chinese domestic production programmes on mature and increasingly complex fields where intervention substitutes for drilling that would cost considerably more. Chinese national operators run their own service capability alongside international providers, which limits the addressable share for outside participants. Regional string manufacturing capacity is expanding. Growth at 7.3% runs above the global rate on intervention demand rather than on any completion activity resembling North American volumes. Intervention on complex mature fields is technically demanding work that suits providers with engineering depth rather than those competing on fleet scale. National operator capability limits how much work reaches outside participants at all. String manufacturing capacity is expanding.
Share: 17% | CAGR: 7.3% (2026 to 2036)
Regional intelligence for 5 additional markets available in the complete report: Middle East and Africa, Western Europe, Latin America, South Asia and Pacific, Eastern Europe. Contact sales@marketmindsadvisory.com.
coiled-tubing-market-country-cagr-analysis-1790002831743

Where Intervention Margin Actually Sits

Fatigue arithmetic rather than equipment condition determines what operators accept, supervisor scarcity limits how much fleet can work, and utilisation near 41% punishes anybody who grows a fleet carelessly. The four levers below follow those conditions rather than any argument about equipment specification. Each addresses a commercial or labour condition instead. Equipment converged long ago.

Make String Records Auditable By The Operator

A string reaches usable life after around 120 runs and fatigue accumulates invisibly, so an operator accepting a provider is accepting its arithmetic rather than inspecting anything. Automated logging and third party audits convert that trust into something verifiable. Providers with credible records win work from competitors with newer equipment, because a parted string costs many times the tubing and stops production while the fishing operation runs. Trust takes years and one failure to destroy. Operators increasingly audit records before awarding anything at all. Discipline became a qualification. Equipment age matters less.
Market Impact: Strings now retire after around 120 working runs

Size The Fleet For Utilisation Not Market Share

Units work around 41% of available days because demand arrives in bursts and equipment cannot chase crews between basins economically. Providers adding units to claim share carry fixed cost against days that never materialise. Disciplined fleet sizing earns more than aggressive growth in this category, which is a lesson the industry relearns after every completion cycle and forgets again during the following expansion. Fixed cost against absent days is what kills providers in this business rather than pricing pressure. Expansion cycles teach nothing. Every cycle repeats it. Discipline outperforms growth.
Market Impact: Utilisation now runs near just 41% of days

Train Supervisors Ahead Of The Requirement

A supervisor needs around 7 years of field time before running extended reach work unaided, and two downturns removed most of an intermediate generation from this industry entirely. Units without qualified supervision do not work at any day rate. Providers who kept training through those downturns can deploy fleet that competitors cannot staff, which is worth considerably more than equipment advantage in a market where crews rather than units are scarce. Crews rather than units are scarce. Rebuilding a pipeline takes the better part of a decade. Equipment advantage matters less.
Market Impact: Supervisors now need 7 years of field time

Balance Milling Volume With Intervention Work

Around 53% of revenue comes from plug milling, which ties fleet utilisation directly to completion counts that providers do not control and that fall sharply in any downturn. Intervention and cleanout work schedules more predictably and uses strings less aggressively, extending life beyond the 120 run figure. Providers weighted entirely toward milling carry a fixed cost base against the most cyclical demand available in this whole service category. Intervention persists through downturns. Strings also last longer on intervention work, which extends usable life beyond the 120 run figure and improves the economics further.
Market Impact: Plug milling now drives 53% of all revenue

Who Controls the Margin Pool

Five providers hold 56% of coiled tubing service and equipment revenue, and that position rests on crew depth and string management discipline rather than on any equipment advantage, since units are broadly comparable across serious participants. SLB, Halliburton, Baker Hughes, Nine Energy Service and STEP Energy Services lead. All participants are assessed on coiled tubing service and equipment revenue rather than on broader oilfield service businesses they also operate. Concentration has held because crew depth cannot be bought quickly and string records cannot be borrowed at all.
Competition runs on string records and supervisor availability far more than on equipment specification, which converged years ago across the fleet. The second dimension is basin presence, because mobilisation cost and crew logistics make chasing work across regions uneconomic and utilisation near 41% cannot absorb unproductive travel days.

Pressure is emerging from operators bringing intervention capability in house on large mature field programmes, which removes the service purchase. Rankings shift where completion counts move and where national programmes fund intervention, particularly across India, the Gulf and Argentina at present. Providers weighted entirely toward plug milling carry the most exposure to any completion contraction.
coiled-tubing-market-company-positioning-matrix-1790002832271

Competitive Moat and Risk Dimensions

SLB

Moat: Extended Reach Capability

SLB holds extended reach string inventory, friction reduction technique and the engineering support that reaching the toe of a long lateral now requires, which is where work is moving. Fewer providers carry the larger diameter strings that application needs. Competitors capable of conventional intervention are excluded from the fastest growing work by capital they have not committed.
SLB

Risk: Utilisation Cost Exposure

Extended reach capability carries string inventory and specialised crews against a fleet working around 41% of available days, which makes the fixed cost base heavier than conventional operations carry. Utilisation punishes capital intensity. A provider holding the most capable and most expensive assets feels a completion downturn considerably harder than a lighter competitor does.
NINE ENERGY SERVICE

Moat: Basin Focused Operations

Nine Energy Service concentrates operations within basins rather than spreading nationally, which keeps mobilisation cost low and crews close to work in a business where utilisation near 41% cannot absorb travel days. Local crew relationships also help retention where supervisor scarcity binds. Competitors covering wider geography carry logistics cost that basin-focused operations simply do not.
NINE ENERGY SERVICE

Risk: Completion Cycle Concentration

Basin focus in unconventional regions ties revenue directly to completion counts, and around 53% of category revenue already comes from plug milling that falls sharply in any drilling downturn. Geographic concentration removes the smoothing that broader coverage provides. A provider positioned where completions are heaviest is most exposed when those completions stop.

Players Tracked

Prominent Players

SLB
Halliburton
Baker Hughes
Nine Energy Service
STEP Energy Services

Other Key Players

NexTier Oilfield Solutions
Cudd Energy Services
Superior Energy Services
Trican Well Service
Calfrac Well Services
Basic Energy Services
National Energy Services Reunited
ADES Holding
Weatherford International
KLX Energy Services
Tenaris
Global Tubing
Quality Tubing
Sandvik Materials Technology
Serva Group

Recent Developments

MARCH 2025

Operators Require Auditable String Fatigue Records

Operators increasingly required verifiable string fatigue records before awarding intervention work, a qualification development rather than any corporate transaction. Strings reach usable life after around 120 runs and fatigue accumulates invisibly, so accepting a provider means accepting its own arithmetic rather than inspecting anything physically at all.
Signal: Credible fatigue records now win work from competitors that hold newer and considerably better equipment everywhere.
SEPTEMBER 2024

Supervisor Scarcity Constrains Fleet Deployment Across Basins

Service providers left units idle for want of qualified supervision across several active basins, a labour development rather than any acquisition. A supervisor needs around seven years of field time before running extended reach work unaided, and two downturns removed most of an intermediate generation from the industry.
Signal: Crews rather than units limit capacity here, which pricing reflects better than utilisation figures ever do.
JUNE 2025

Indian Operators Fund Intervention Over New Drilling

Indian domestic operators funded intervention programmes on mature fields ahead of new drilling, a capital allocation development rather than any corporate event. India compounds at 11.3%, and intervention work schedules considerably more predictably than plug milling while using strings far less aggressively across each individual job.
Signal: Intervention demand smooths a fleet that plug milling ties directly to completion counts nobody actually controls.

What A Coiled Tubing Job Costs

Tubing string consumption absorbs roughly 27% of service delivery cost, and that figure rises with diameter as extended reach work demands larger strings. Crew wages and per diem take around 24%, weighted heavily toward supervisors whose scarcity sets the rate. Equipment depreciation and maintenance absorb about 21%, with fuel, mobilisation and location logistics taking the remaining balance.
High strength steel strip costs rose through 2022 and 2023 while extended reach demand pulled larger diameter tubing that consumes considerably more steel per string. Tenaris Annual Report 2024 and SLB Annual Report 2024 both record steel input costs and labour availability among principal operating variables. Providers holding string inventory purchased before the increase carried a cost advantage that competitors buying currently could not match at all.

The competitive disadvantage mechanism is utilisation rather than input cost. A provider working units around 41% of available days spreads fixed equipment and crew cost across far fewer revenue days than the fleet was sized for. Exposure concentrates among providers who grew fleets during completion expansions, since those units carry full cost against days that arrive only when drilling activity is running near its peak.
coiled-tubing-market-cost-volatility-analysis-1790002832471

Retire Strings On Arithmetic Rather Than Appearance

Tubing consumption absorbs roughly 27% of service cost and a string reaches usable life after around 120 runs whether or not anything looks wrong to an inspection. Retiring on the fatigue calculation costs tubing and avoids a parted string that costs many times more. The discipline is commercial rather than technical, and operators increasingly audit it before awarding any work.

Concentrate Operations Within Basins Rather Than Nationally

Fuel, mobilisation and location logistics absorb a meaningful share of delivery cost, and utilisation near 41% cannot absorb travel days that generate no revenue at all. Basin concentration keeps crews close to work and mobilisation short. The trade is forgoing work outside the basin, which is worth less than the utilisation and logistics cost that chasing it consumes.

Hold String Inventory Ahead Of Steel Price Moves

High strength steel strip drives string cost and moved sharply upward while extended reach demand pulled larger diameters consuming more steel per string. Inventory purchased ahead of price moves carries a genuine cost advantage across the strings involved. The working capital commitment is real and it is smaller than the margin difference across a fleet running for several years.

Portfolio Architecture for Margin Defence

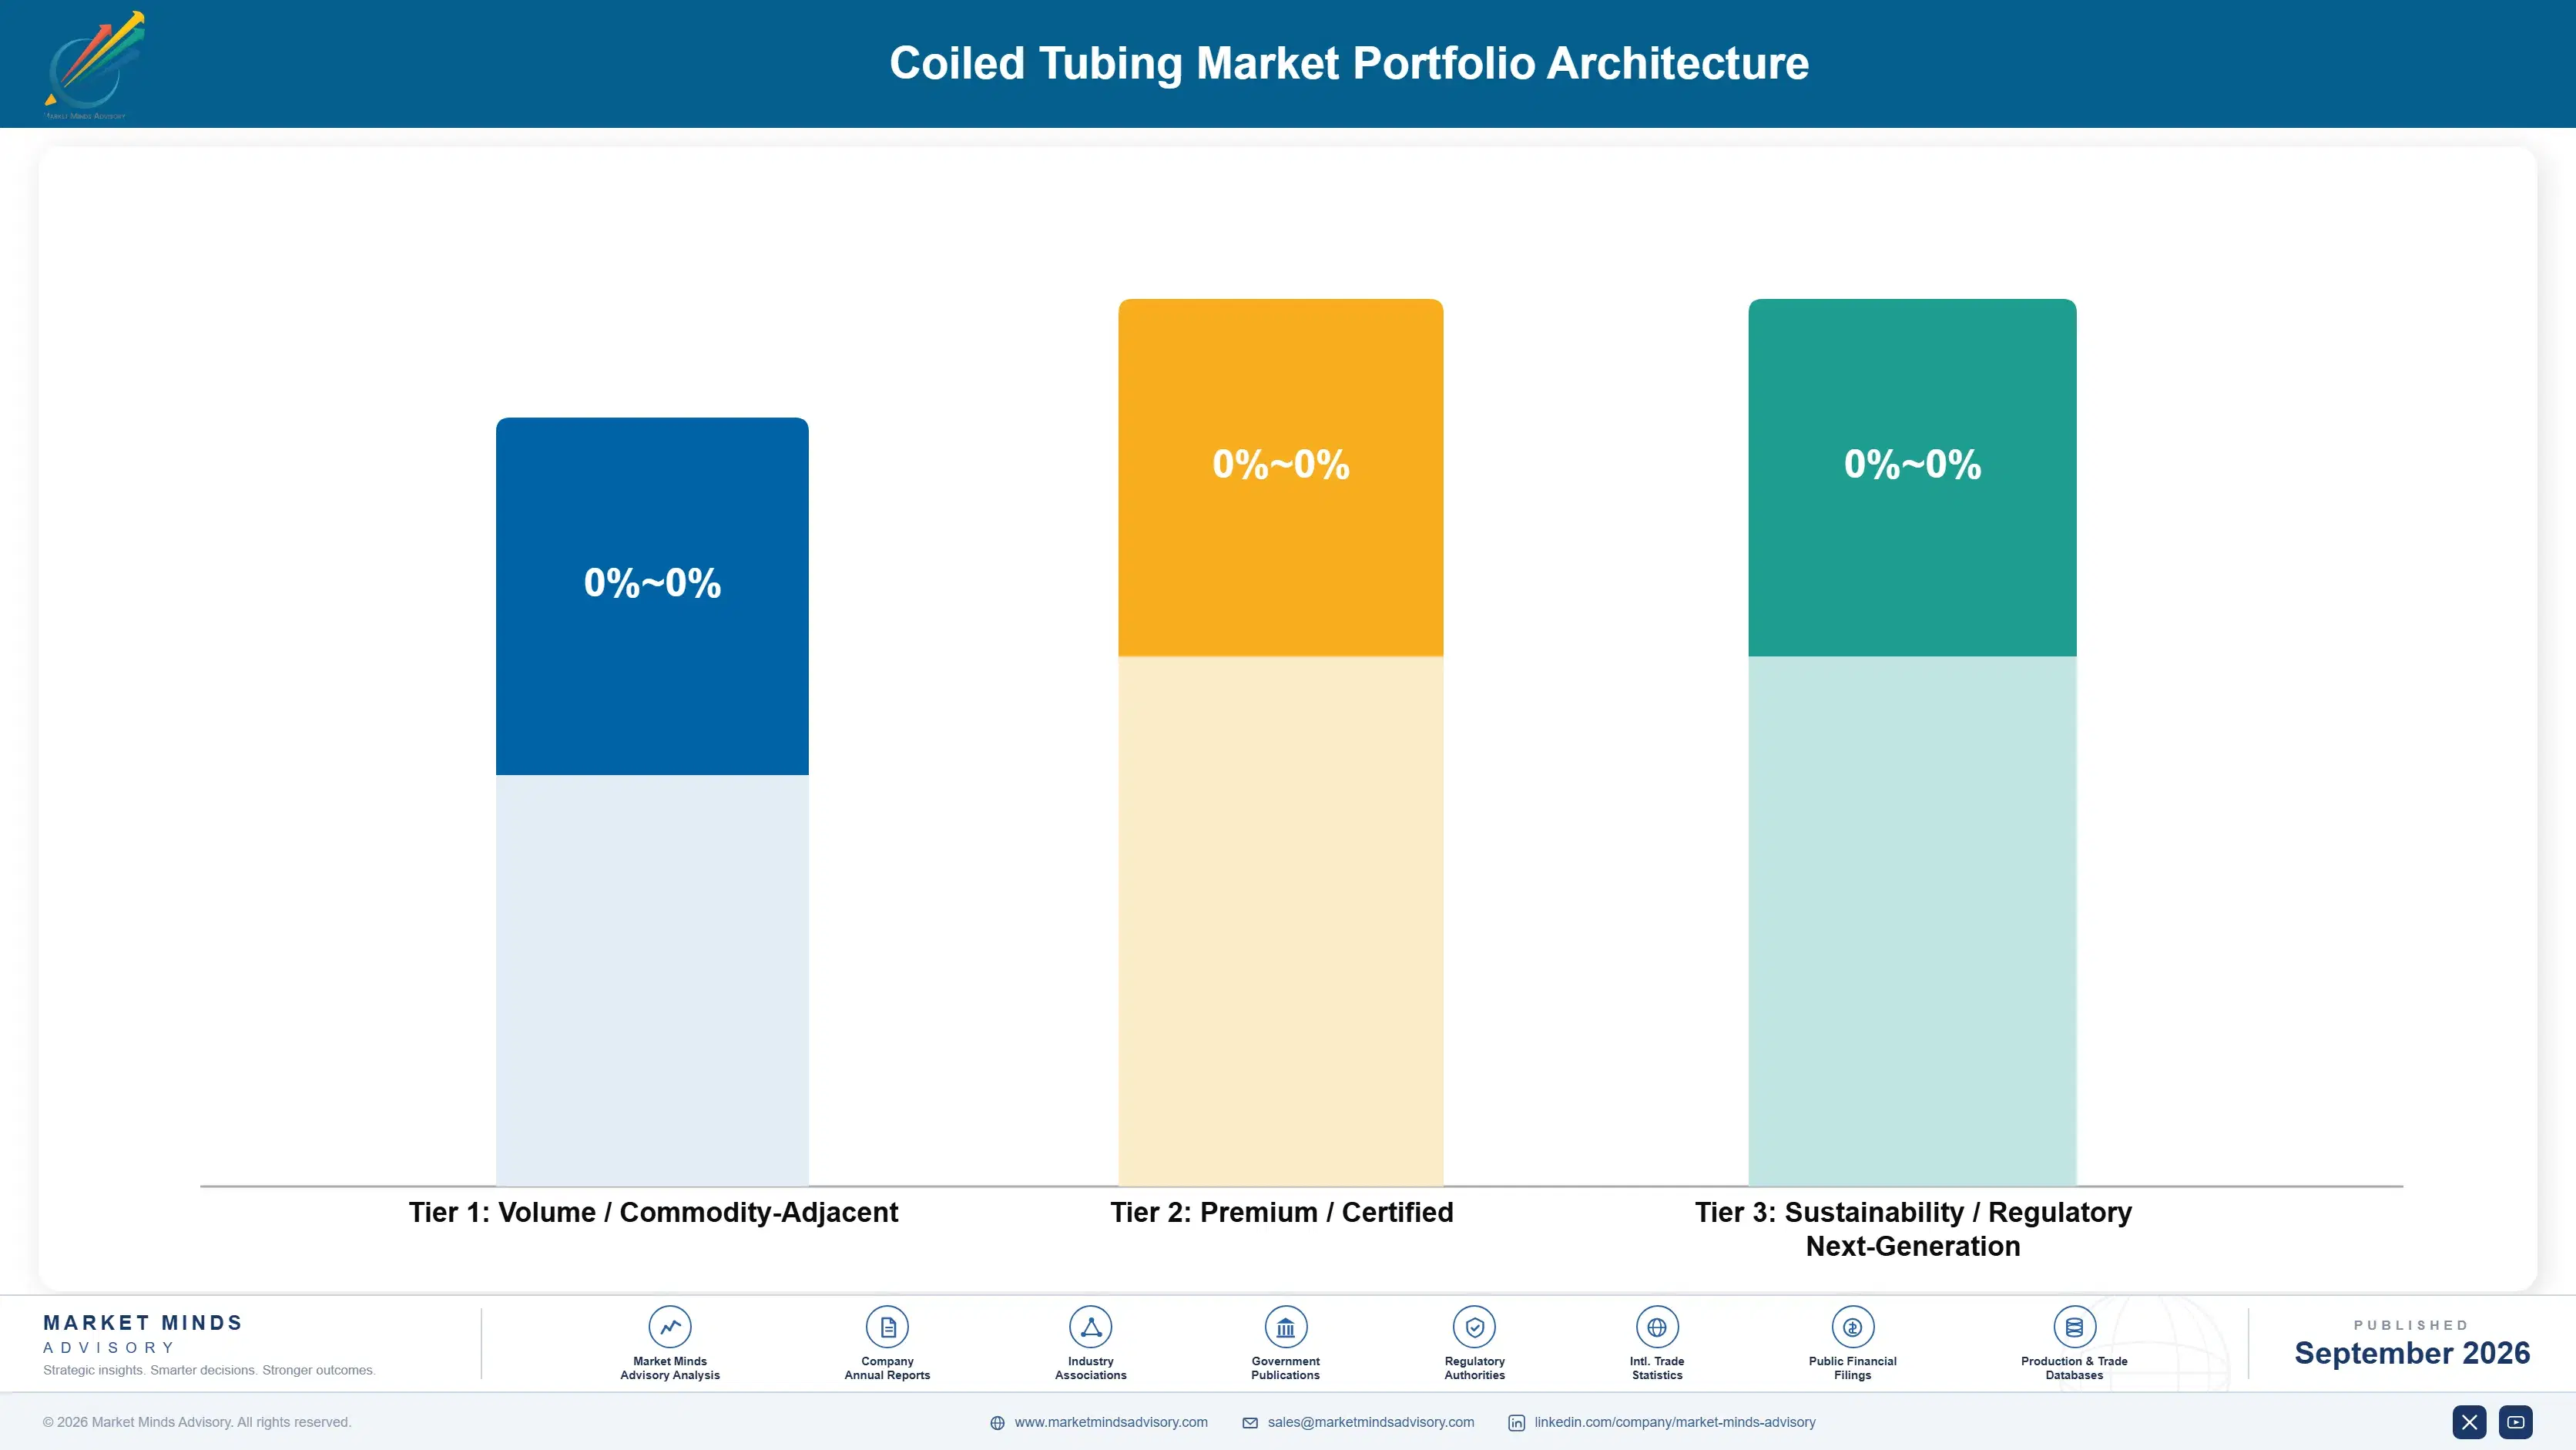
Margin architecture separates on capability scarcity rather than on equipment cost. Unit and injector equipment manufacturing earns least, since it is capital equipment sold into a fleet that already exceeds what utilisation supports. Plug milling and conventional cleanout sit above on volume. Extended reach work, coiled tubing drilling and fatigue management systems earn most, because each requires capability that most providers have not built.
The volume versus premium tension runs between plug milling throughput and extended reach capability, which reward opposite investments entirely. Milling rewards fleet scale and cost discipline against completion counts nobody controls. Extended reach rewards string inventory, engineering support and scarce supervisors at far better rates. Providers chasing milling volume with capable equipment carry premium cost into commodity pricing and lose money quietly.

High-value pools concentrate in extended reach work and in fatigue management, and neither is reached through fleet size. Extended reach requires larger diameter string inventory and friction technique that took years and capital to assemble. Fatigue management requires records credible enough for an operator to audit. Both explain why five providers hold 56% while the equipment underneath this industry is broadly available to anybody.

Volume / Commodity-Adjacent

Coiled tubing unit and injector equipment manufacturing, capital equipment sold into a fleet already larger than utilisation near 41% supports across most active basins. The eleven point spread separates manufacturers with service parts annuities from those selling units alone into a saturated fleet.
Gross Margin: 14% to 25%

Premium / Certified

Hydraulic fracturing plug milling and well intervention and cleanout services, where crew availability and basin presence determine selection more than any equipment specification does. The thirteen point spread tracks utilisation achieved across each provider's fleet rather than day rates negotiated.
Gross Margin: 29% to 42%

Sustainability / Regulatory / Next-Generation

Extended reach milling and intervention strings, coiled tubing drilling and underbalanced applications and fatigue management systems, each requiring capability most providers have not built. The sixteen point spread reflects string inventory depth and supervisor availability taken together.
Gross Margin: 46% to 62%
coiled-tubing-market-portfolio-architecture-1790002832976

High-value Sub-segments and Strategic Watch-out

Extended Reach Milling And Intervention Strings

Grows at 9.9% because laterals keep extending while tubing faces the same buckling and friction limits it always had. The sixteen point spread reflects string inventory depth. Larger diameter strings carry capital commitment that narrows the competing field considerably. Engineering support narrows it further. Capital commitment is heavy.
Gross Margin: 46% to 62%

Well Intervention And Cleanout Services

Grows at 7.4% because producing wells accumulate scale, sand and mechanical damage continuously regardless of drilling activity. The thirteen point spread reflects utilisation achieved. This work schedules predictably and uses strings far less aggressively than milling. Production requirements persist through downturns. Strings last considerably longer here.
Gross Margin: 29% to 42%

Hydraulic Fracturing Plug Milling

Grows at 5.8% and carries around 53% of revenue, which ties fleet economics directly to completion counts providers do not control. The thirteen point spread reflects basin presence. Downturns in drilling remove this work faster than anything else in the category. Completion counts drive it entirely.
Gross Margin: 29% to 42%

Unit And Injector Equipment Manufacturing

Grows at 3.6%, slowest of the six classes, selling capital equipment into a fleet already larger than utilisation supports anywhere. The eleven point spread reflects parts annuity attachment. Fleet growth during expansions created the overhang currently limiting demand. Overhang limits new unit demand. Utilisation caps replacement.
Gross Margin: 14% to 25%

Why Records Win Work

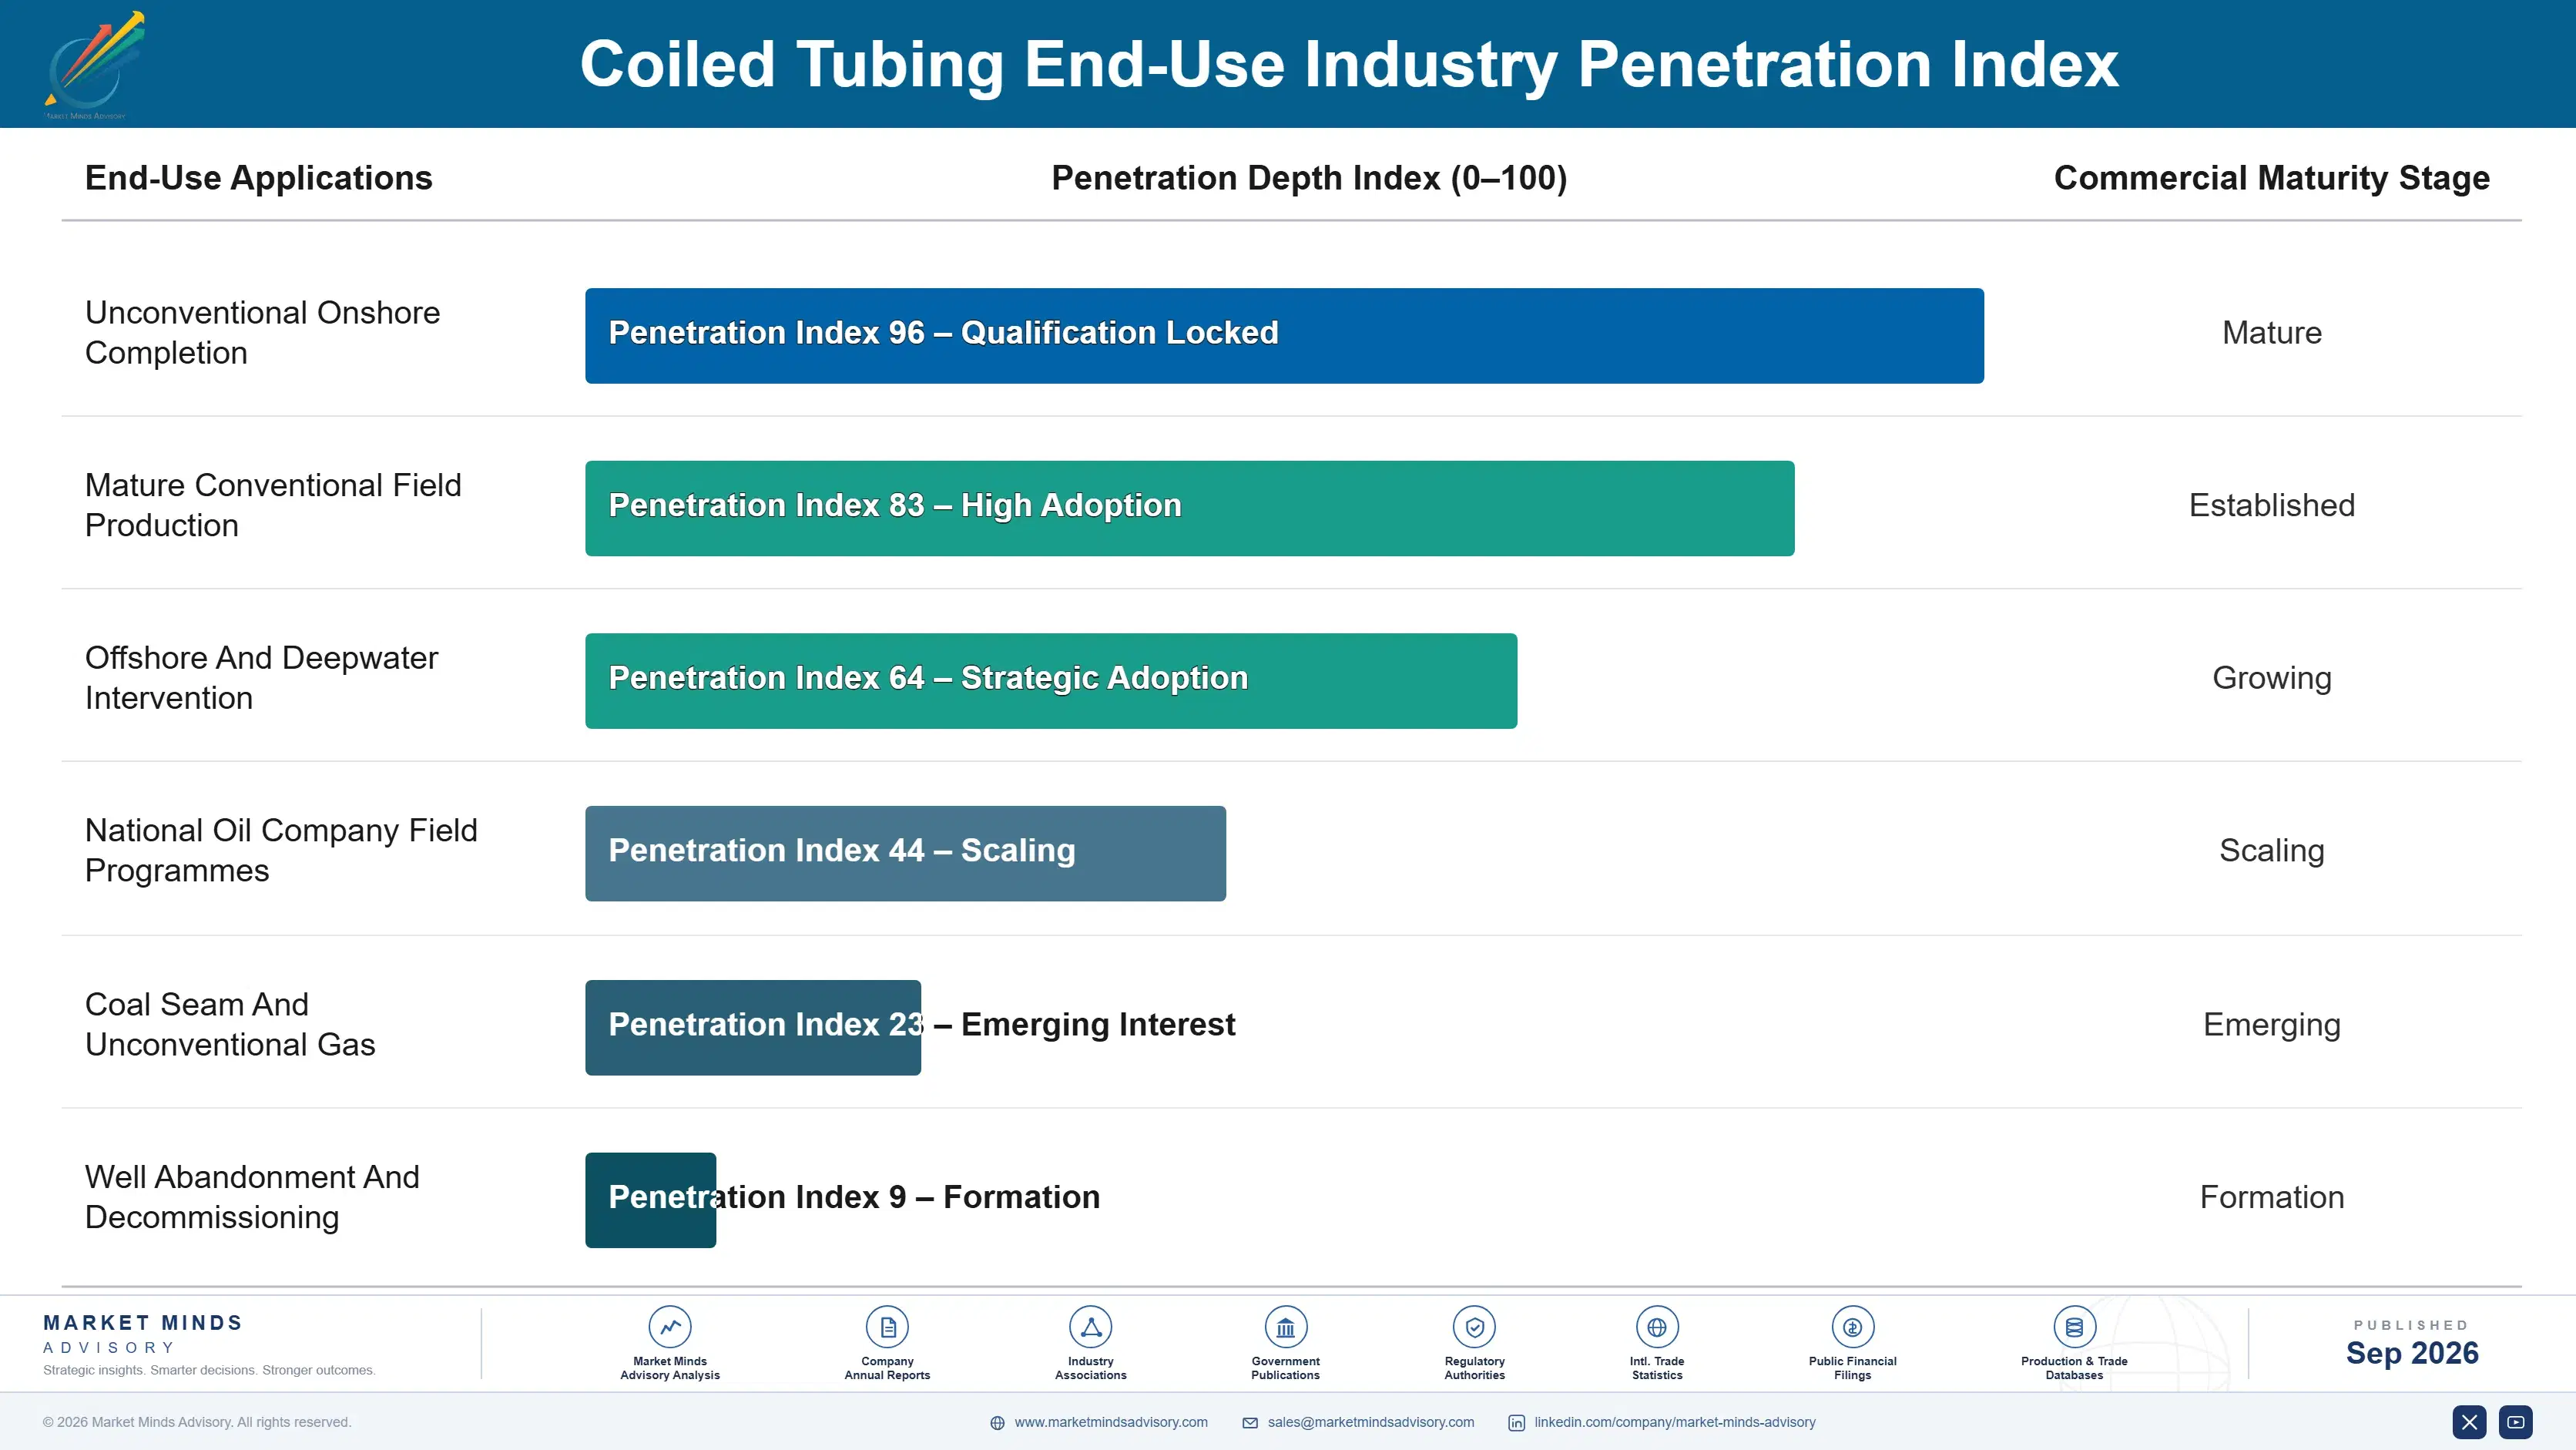
The annuity here is operator trust rather than any contract. A string reaches usable life after around 120 runs and fatigue accumulates invisibly, so an operator awarding work is accepting a provider's arithmetic rather than inspecting anything physical. Providers whose records survive an audit win work from competitors holding newer equipment. That trust takes years to build and one parted string to destroy, which makes it unusually asymmetric.
Depth varies by which work a provider holds. Plug milling revenue arrives with completion cycles and disappears with them, tying around 53% of category revenue to counts nobody controls. Intervention and cleanout work schedules against production requirements that persist through downturns. Providers holding both smooth a fleet whose utilisation near 41% cannot absorb long idle periods without damaging the crew base they depend on.

The buyer has changed less than the work has. A completion engineer evaluated milling speed and day rate against a schedule and largely still does. A production engineer evaluates whether intervention restores flow without risking the well. An operator procurement function increasingly evaluates string records and safety history before either conversation begins. The third gate is newer and it eliminates providers before capability is ever discussed.
coiled-tubing-market-end-use-penetration-index-1790002833533

What Wins Intervention Work

These are among the four positions where our research anticipates prominent divergence between winners and laggards over the coming forecast period. Each is grounded in the demand model, the regulatory perimeter, and the announced capacity pipeline.
01 / FATIGUE RECORD CREDIBILITY

Publish The Arithmetic, Not The Equipment Age

A string reaches usable life after around one hundred and twenty runs and fatigue accumulates invisibly, so an operator awarding work is accepting a provider's arithmetic rather than inspecting anything at all. Automated logging and third party audits convert that trust into something a procurement function can actually verify before awarding. Providers with credible records win work from competitors holding newer equipment, because a parted string costs many times the tubing and stops production throughout for the duration of the fishing operation.
02 / FLEET SIZING RESTRAINT

Grow Utilisation Before Growing Fleet

Units work around 41% of available days because demand arrives in bursts tied to completion schedules and equipment cannot chase crews between basins economically at all. Providers adding units to claim market share carry fixed cost against revenue days that never materialise for them. Disciplined fleet sizing earns more than aggressive growth here, which this industry relearns after every completion cycle and reliably forgets during the next expansion without exception and at considerable cost each time to the same providers.
03 / CREW PIPELINE INVESTMENT

Train Through Downturns, Deploy Through Recoveries

A supervisor needs around seven years of field time before running extended reach work unaided, and two downturns removed most of an intermediate generation from this industry permanently. Units without qualified supervision do not work at any day rate an operator might offer. Providers who kept training through those downturns deploy fleet that competitors simply cannot staff, which is worth considerably more than any equipment advantage available in this particular market where crews are genuinely scarce and hard to replace quickly.
04 / DEMAND MIX BALANCE

Hold Intervention Against The Milling Cycle

Around 53% of revenue comes from plug milling, which ties fleet utilisation directly to completion counts that no service provider controls and that fall sharply in any drilling downturn. Intervention and cleanout schedules more predictably and uses strings less aggressively, extending life beyond the typical figure. Providers weighted entirely toward milling carry a fixed cost base against the most cyclical demand available anywhere in this service category at any point in the cycle that anybody can identify in the whole sector.

Engagement Snapshot From the Field

A live engagement with an industry participant carrying material or product regulatory and market exposure ahead of a defining policy shift, showing how our research translates into a defensible multi-year portfolio strategy.
MARKET MINDS ADVISORY · CLIENT ENGAGEMENT SUMMARY
Coiled Tubing Producer Strategic Portfolio Review and Transition Roadmap 2026·Investment Scenario on Coiled Tubing Exposure Evaluation 2025-26
CLIENT PROFILE
A coiled tubing provider that had grown its fleet through a completion expansion and was carrying units it could neither staff nor keep working, while losing extended reach tenders to competitors with deeper string inventory. Management had approved further unit purchases to pursue share, without examining what the existing fleet was actually achieving. Nobody had measured utilisation honestly.
STRATEGIC CHALLENGE
Operations wanted more units to compete on availability in active basins. Finance wanted the capital committed elsewhere. Nobody had measured utilisation honestly or established how many units the available supervisor pool could actually staff, and the purchase decision was scheduled within the quarter. Neither position had been tested against what the supervisor pool could realistically support across the basins involved.
MMA APPROACH
MMA measured achieved utilisation against available days by unit and basin, and mapped qualified supervisor availability against the fleet already owned. We compared margin between plug milling and intervention work and modelled a mix shift toward the less cyclical half. Work drew on 47 expert interviews conducted in Q4 2025 with operators, service providers and string manufacturers.
KEY FINDINGS
  1. Achieved utilisation ran at 34% rather than the 41% industry figure, and the supervisor pool could staff only about two thirds of the units already owned.
  2. Extended reach tenders were being lost on string inventory depth rather than on price or equipment condition in every single case the review examined.
  3. Intervention work carried better margin and scheduled far more predictably, but represented under a fifth of total revenue (client-reported, unverified by MMA).
  4. Additional units would have reduced achieved utilisation further while adding fixed cost that the existing crew base could not have supported anywhere.
CLIENT PROFILE
A coiled tubing provider that had grown its fleet through a completion expansion and was carrying units it could neither staff nor keep working, while losing extended reach tenders to competitors with deeper string inventory. Management had approved further unit purchases to pursue share, without examining what the existing fleet was actually achieving. Nobody had measured utilisation honestly.
STRATEGIC CHALLENGE
Operations wanted more units to compete on availability in active basins. Finance wanted the capital committed elsewhere. Nobody had measured utilisation honestly or established how many units the available supervisor pool could actually staff, and the purchase decision was scheduled within the quarter. Neither position had been tested against what the supervisor pool could realistically support across the basins involved.
MMA APPROACH
MMA measured achieved utilisation against available days by unit and basin, and mapped qualified supervisor availability against the fleet already owned. We compared margin between plug milling and intervention work and modelled a mix shift toward the less cyclical half. Work drew on 47 expert interviews conducted in Q4 2025 with operators, service providers and string manufacturers.
KEY FINDINGS
  1. Achieved utilisation ran at 34% rather than the 41% industry figure, and the supervisor pool could staff only about two thirds of the units already owned.
  2. Extended reach tenders were being lost on string inventory depth rather than on price or equipment condition in every single case the review examined.
  3. Intervention work carried better margin and scheduled far more predictably, but represented under a fifth of total revenue (client-reported, unverified by MMA).
  4. Additional units would have reduced achieved utilisation further while adding fixed cost that the existing crew base could not have supported anywhere.
RECOMMENDED STRATEGY
Phase 1: Phase one: cancel the unit purchase programme, since the supervisor pool could staff only about two thirds of the fleet already owned. Phase 2: Phase two: redirect that capital into extended reach string inventory, which is where tenders were being lost rather than on price. Phase 3: Phase three: build intervention and cleanout revenue deliberately, since it schedules predictably and carries better margin than plug milling does.
OUTCOME
The provider cancelled its unit purchases and invested in extended reach string inventory instead (client-reported, unverified by MMA). Utilisation improved on the existing fleet and extended reach tender wins followed the inventory investment. Supervisor availability is now checked before any fleet decision, which is the change that outlasted the engagement itself.

Frequently Asked Questions

Foundational context covering the market sizes, CAGR, scope, country, region and competition that inform every finding below. This section is provided to cover basics and most often pre-purchase conversations, answered from the MMA Primary Research Dataset.

What is the current size of the Coiled Tubing Market?

Global value reaches USD 5.1 billion in 2026, measured as coiled tubing service and equipment revenue. The 2025 base was USD 4.8 billion on the same basis.

How large will the Coiled Tubing Market be by 2036?

The market reaches USD 9.7 billion by 2036, an increase of USD 4.6 billion across the forecast period. That represents 1.90 times expansion from the 2026 base.

What is the CAGR for the Coiled Tubing Market 2026 to 2036?

The base case runs at 6.6% annually, with a bull case at 7.8% if intervention accelerates over new drilling and a bear case at 5.4% if completion activity contracts sharply.

Which segment is growing fastest?

Extended reach milling and intervention strings grow at 9.9%, half again the market rate of 6.6%. Laterals keep extending while tubing faces the same friction limits.

Who are the major companies in the Coiled Tubing Market?

SLB, Halliburton, Baker Hughes, Nine Energy Service and STEP Energy Services lead on service revenue, holding 56% between them. Trican and Calfrac hold smaller positions.

Which country is growing fastest?

India leads at 11.3%, as domestic operators fund intervention on mature fields rather than new drilling programmes at comparable cost. Saudi Arabia and Argentina follow.

Report Segmentation Architecture

The full report scope spans multiple orthogonal segmentation dimensions, with cross-tabulated demand data provided for each dimension pair. Coverage extends further to regional breakdowns, trend trajectories, and the competitive detail needed to support segment-level decision-making.

By Service Application And Equipment Class

  • Extended Reach Milling And Intervention Strings
  • Well Intervention And Cleanout Services
  • Coiled Tubing Drilling And Underbalanced Applications
  • Hydraulic Fracturing Plug Milling
  • String Manufacturing And Fatigue Management Systems
  • Unit And Injector Equipment Manufacturing

By End-Use Industry

  • Unconventional Onshore Completion
  • Mature Conventional Field Production
  • Offshore And Deepwater Intervention
  • National Oil Company Field Programmes
  • Coal Seam And Unconventional Gas
  • Well Abandonment And Decommissioning

By Commercial Dimension

  • Call Off Service Contracting
  • Integrated Service Package Supply
  • National Operator Framework Agreements
  • Day Rate Equipment Provision
  • String Supply And Management Contracts
  • Equipment Sale To Regional Providers

By Region

  • North America
  • East Asia
  • Middle East and Africa
  • Western Europe
  • Latin America
  • South Asia and Pacific
  • Eastern Europe

Scope, Methodology, and Coverage

Every figure in this report is reproducible from documented input assumptions. The scope below maps the historical period, the forecast horizon, the segmentation dimensions, and the countries covered, alongside the underlying primary and qualitative methodology.
Historical Period
2020 to 2025
Forecast Period
2026 to 2036
Base Year
2025 (USD billions; MMA Primary Research Dataset, September 2026)
Market Definition
This report covers coiled tubing services and equipment: continuous tubing deployed into wells for intervention, completion and drilling support, spanning extended reach milling and intervention strings, well intervention and cleanout services, hydraulic fracturing plug milling, coiled tubing drilling and underbalanced applications, unit and injector equipment manufacturing, and string manufacturing and fatigue management systems. It excludes wireline services, conventional workover rigs, drilling rigs and jointed pipe, downhole completion hardware, and pressure pumping.
Quantitative Units
USD millions, coiled tubing service and equipment revenue; units in active fleet; utilisation as working days against available days; string working life in runs; supervisor experience requirements in years; string cost share of service delivery cost.
Segmentation Dimensions
Service application and equipment class; end-use field type; commercial contracting route; geography across seven regions.
Regions Covered
North America, East Asia, Middle East and Africa, Western Europe, Latin America, South Asia and Pacific, Eastern Europe
Countries Covered
United States, Canada, Mexico, Argentina, Brazil, Colombia, Saudi Arabia, United Arab Emirates, Oman, Kuwait, Algeria, Nigeria, China, India, Indonesia, Australia, United Kingdom, Norway, Netherlands, Romania.
Key Companies Profiled
SLB, Halliburton, Baker Hughes, Nine Energy Service, STEP Energy Services, Cudd Energy Services, Superior Energy Services, Trican Well Service, Calfrac Well Services, National Energy Services Reunited, Weatherford International, KLX Energy Services, Tenaris, Global Tubing, Quality Tubing.
Quantitative Methodology
Primary survey, n=3,800 respondents, Q4 2025, six countries; demand-side model with trade association cross-validation
Qualitative Methodology
47 expert interviews, Q4 2025; applied to validate demand model assumptions, identify emerging dynamics, and assess competitive positioning
Report Format
PDF and XLSX data workbook (Word format preview document)
Publisher
Market Minds Advisory
Report Code
MMA-2026-ENE-251
Published
September 2026
Contact
sales@marketmindsadvisory.com | www.marketmindsadvisory.com

Purchase the full Coiled Tubing Market Report (2026 to 2036).

This report sizes the global coiled tubing market from 2026 to 2036 across six service applications, six field types and seven regions. It explains why strings retiring after around 120 runs on fatigue arithmetic rather than inspection makes auditable records the qualification that wins work. Utilisation near 41% of available days is analysed as the constraint punishing fleet growth through every completion cycle. Supervisor scarcity requiring around seven years of field time is examined as the limit on how much fleet can actually work. Regional analysis explains why North America holds 39% of activity.
Six service applications sized through to 2036
String fatigue arithmetic quantified against operator qualification requirements
Fleet utilisation analysed against completion cycle exposure
Twenty named providers assessed on service revenue
Four revenue levers with quantified commercial impact
Anonymised provider fleet and mix engagement documented in full

Built For The People Who Decide

From boardroom strategy to bench-side execution, this report is read cover-to-cover by leaders shaping the next decade of their industry, turning demand scenarios, market dynamics and valuation benchmarks into decisions.
CXOs/ Presidents/ VPs/ Managers
M&A and Corporate Development
Strategy Teams and R&D Heads
Procurement and Product Directors
Regulatory and Compliance Leaders
Investor Relations and Equity Analysts