Market Minds Advisory
Cognitive Systems Spending Market

Cognitive Systems Spending Market: Cognitive Systems Spending Market: Absorption Limits, Data Access and Accountability Requirements, 2026 to 2036

Spending has outrun the capacity to absorb it. Around 31% of initiatives reach production, and of those only about 17% have a financial return that anybody has ever actually measured.

Lead Analyst

Published

September 2026

Make Smarter Decisions with Customized Research Insights

Request a free sample report and evaluate market opportunities, growth trends, and competitive dynamics relevant to your business needs.

2025 MARKET VALUE$148.0BMarket Size 2025
2036 FORECAST VALUE$880.3BBase Case , 2026 to 2036
CAGR 2026 TO 203617.6 %Bull 18.8% / Bear 16.4%
INCREMENTAL OPPORTUNITY$706.3BNet 10- year value creation
EXPANSION MULTIPLE5.06x2036 value over 2026 base
Strategic Levers
M&A Pipeline
Regional Outlook
Country Rankings
Competitive Intelligence
Segmental Deep-dive
Call-Us : 91 93563 13602

Executive Snapshot and Market Trajectory.

The constraint was never model capability. Around 31% of initiatives reach production, and the ones that stall fail on data access, permissions, and the question of who is accountable when an answer is wrong. None of those are technical problems in any useful sense.
Model assurance and monitoring grows at 26.4%, half again the market rate of 17.6%, because production requires evidence a pilot never needed. Data preparation and governance follows at 23.6%, since projects wait 5.8 months on average for the data they were scoped around. Both are the bottleneck rather than the technology, and spending has moved accordingly. Suppliers who built demonstration capability find this work less interesting to sell. Both are organisational rather than technical problems.
This is largely a labour market wearing a technology label. Services account for 64% of spending, so capacity scales with available consultants rather than with model progress. North America holds 37% of spending, above the usual band. Only 17% of production deployments have measured financial return. Innovation budgets bought potential; operating budgets buy outcomes, and most existing work was never built for that. Budgets are moving toward whatever survives examination.
Market Definition
This market covers organisational spending on deploying cognitive and artificial intelligence systems, including artificial intelligence application software, platform and development tooling, data preparation and governance services, model assurance and monitoring services, integration and implementation services, and change management and adoption services. It excludes accelerated compute infrastructure and cloud capacity, which is measured separately, alongside consumer subscriptions, semiconductor manufacture, and academic research funding.
Base Year Value
$148.0B in 2025 (MMA Primary Research Dataset, September 2026)
Forecast Period
2026 to 2036, eleven discrete annual values
CAGR
17.6% base case. Bull 18.8%. Bear 16.4%.
Fastest Growth Segment
Model Assurance And Monitoring Services: 26.4% CAGR
Fastest Growth Country
India: 22.4% CAGR
Fastest Growth Region
South Asia and Pacific: 19.6% CAGR
Largest Region
North America: 37% of 2025 global value
Market Leaders
Accenture, IBM, Microsoft, Deloitte, and Infosys lead the field. Source: MMA Primary Research Dataset, July 2026.
Primary Survey
n=3,800 procurement and R&D decision-makers, Q4 2025, six countries
Methodology
Demand-side build-up, cross-validated against public data, 47 expert interviews

Cognitive Systems Spending Market Forecast Scenarios

cognitive-systems-spending-market-size-forecast-scenario-1790012020290
Between 2020 and 2025 spending grew faster than organisations could absorb it. Budgets were approved on potential, initiatives launched in numbers no delivery capacity could support, and a substantial proportion stalled somewhere between demonstration and production. Historical growth of 16.2% therefore measures money committed rather than value created, and the gap between those two figures widened throughout the period.
The base case at 17.6% rests on three mechanisms. Assurance and monitoring grows because production deployment requires evidence, accountability, and failure detection that pilots never needed. Data preparation grows because projects wait almost six months for access to information they were scoped around. And budgets migrate from innovation funds toward operating budgets, which raises the evidence standard and redirects spending toward what survives it. None of the three depends on models improving further.
The bull case at 18.8% depends on production conversion improving materially from 31%, which would turn stalled pilot spending into deployed systems generating further work. The bear case at 16.4% is an evidence reckoning: only 17% of production deployments have measured return, and a serious review across several large adopters could compress budgets faster than any technology development would justify.

Spending Ahead Of Absorption

The most misleading thing about this market is its name. Around 64% of spending buys people rather than software, so capacity is bounded by how many capable consultants and engineers exist rather than by anything happening in model development. That makes this a labour market with a technology label, and it grows at whatever rate delivery capability can be assembled. Model progress sets no ceiling here.
TOP FIVE CONCENTRATION29%Share of spending captured by the leading suppliers
PRODUCTION DEPLOYMENT RATE31%Initiatives reaching production rather than remaining in pilot
MEASURED RETURN SHARE17%Production deployments with financial return actually being measured
SERVICES SHARE OF SPENDING64%Spending on people rather than on software licences
AVERAGE PROGRAMME BUDGETUSD 3.4 millionAnnual programme spending averaged across all enterprise adopters
DATA ACCESS DELAY5.8 monthsTypical wait before a project obtains the data it requires
Attrition between demonstration and production is where the money goes missing. About 31% of initiatives reach production, and the ones that stall rarely fail because the model was inadequate. They fail on data access averaging 5.8 months, on permissions nobody owns, and on the question of who answers for a wrong output, which a pilot never had to resolve. Sponsors lose patience rather than projects failing visibly, which is why so much of this attrition goes unrecorded anywhere.
Evidence is the coming pressure. Only 17% of production deployments have a financial return anybody measured, which was acceptable while innovation budgets funded the work and unacceptable now that line-of-business operating budgets increasingly do. Innovation budgets bought potential. Operating budgets buy measured outcomes, and the transition is already visible in how proposals are being evaluated.
"Every stalled programme we reviewed had the same shape. The demonstration worked, everybody was pleased, and then somebody asked who signs off when it gets something wrong and where the data comes from. Six months later the answer to both was still nobody and nowhere, and the budget had quietly moved elsewhere."
Practice Director, Applied Intelligence and Enterprise Transformation · MMA Technology Practice · September 2026

Market Trends

Production Demands Evidence Pilots Never Required

A demonstration needs to work once in front of an audience. A production system needs monitoring, failure detection, an accountable owner, and evidence it behaves acceptably across cases nobody anticipated. Model assurance and monitoring grows at 26.4% because that gap is where initiatives stall rather than where technology falls short. Suppliers who built demonstration capability find this work considerably less interesting and considerably more valuable than what they were previously selling. Assurance specialists are scarce, and their absence is visible in every programme that never left demonstration. That is an uncomfortable adjustment for several of them.
Market Impact: Services take 64% of spending
Data Access Delays Dominate Project Timelines

Projects wait 5.8 months on average for the data they were scoped around, held up by ownership disputes, permission processes, and quality problems nobody had documented before the project needed them documented. Data preparation and governance grows at 23.6% accordingly. The delay is organisational rather than technical, which means it cannot be shortened by better tooling alone and consumes budget while producing nothing anybody can demonstrate. Suppliers who treat data access as an explicit first phase deliver considerably more reliably than those who assume availability and discover otherwise. Budget is consumed while nothing demonstrable is produced.
Market Impact: Only 17% measure return

Market Opportunities and Growth Drivers

Delivery Capacity Rather Than Demand Sets The Pace

Services account for 64% of spending, which makes available consultants and engineers the binding constraint on how quickly organisations can deploy anything at all. Indian growth of 22.4% leads every country covered, driven by service organisations delivering programmes for clients headquartered elsewhere alongside rapid domestic adoption. Suppliers compete for the same scarce delivery people, and wage inflation in that population passes directly into programme cost. A supplier without production-experienced people cannot convert programmes whatever platforms it partners with, and those people take years to develop. Wage inflation passes directly into programme cost.
Market Impact: Only 31% reach production

Operating Budgets Replace Innovation Funding Sources

Initiatives funded from innovation budgets were approved on potential and rarely revisited, while line-of-business operating budgets require measured outcomes and revisit them annually. That shift is well underway and it redirects spending toward deployments that can demonstrate return rather than possibility. Only 17% of production deployments currently measure return, so a large proportion of existing work is not prepared for the standard now being applied to it. Suppliers baselining before deployment and defining attribution in advance are the ones whose work survives that review. Much existing work is not prepared for it.
Market Impact: Only 17% show measurement

Market Restraints and Challenges

Accountability Questions Stall Deployments For Years

About 31% of initiatives reach production, and the root cause of the attrition is that somebody must own the consequences of a wrong output before a system touches real decisions. Commercially this consumes budget on work that never deploys, and the sponsor eventually loses patience rather than the project failing visibly. Suppliers respond with accountability frameworks agreed before build, human review designs that make ownership explicit, and narrower initial scope where consequences are containable. The conversation is uncomfortable at proposal stage and far worse six months into a programme that cannot proceed.
Market Impact: Segment grows at 26.4%

Measured Return Is Largely Absent From Deployments

Only 17% of production deployments have financial return anybody measured, and the root cause is that measurement was not designed in because innovation funding never demanded it. Commercially this leaves a large installed base of work unable to defend itself as budgets move toward operating funds. Suppliers respond by designing measurement into scope from the outset, by baselining before deployment, and by declining engagements where no outcome can be attributed. Declining engagements where nothing can be attributed honestly costs revenue immediately and protects considerably more of it later. Few suppliers volunteer that.
Market Impact: Delays run 5.8 months
4 additional market trends, 3 additional growth drivers, and 2 additional restraints and challenges are covered in the full report. Contact sales@marketmindsadvisory.com to access the complete intelligence.

Segment CAGR and Growth Architecture

Segmentation follows spending category. Six categories cover the market: artificial intelligence application software, platform and development tooling, data preparation and governance services, model assurance and monitoring services, integration and implementation services, and change management and adoption services. Accelerated infrastructure spending is measured separately rather than being included in any category here. Programme management sits within the category it supports.
cognitive-systems-spending-market-market-share-analysis-1790012020883

Model Assurance And Monitoring Services

Assurance and monitoring grows at 26.4%, half again the market rate of 17.6%, because production requires something demonstrations never did. A system touching real decisions needs failure detection, behaviour monitoring across cases nobody anticipated, an accountable owner, and evidence it can be defended if challenged. That is where roughly two thirds of initiatives stall, and it is organisational as much as technical work. Suppliers who built demonstration capability find this considerably less interesting to sell and considerably more valuable to deliver, which is an uncomfortable adjustment for several of them. Standardised methods reduce the hours considerably where suppliers reuse them. Rebuilding assurance from first principles on every engagement consumes hours that reuse would remove entirely.
CAGR 26.4%

Data Preparation And Governance Services

Data preparation and governance grows at 23.6% because projects wait 5.8 months on average for access to information they were scoped around. The delay comes from ownership disputes, permission processes designed for other purposes, and quality problems nobody had ever needed to document. None of that is shortened by better tooling, since the obstacles are organisational rather than technical, and the waiting consumes budget while producing nothing demonstrable. Suppliers who treat data access as the first phase rather than an assumption deliver considerably more reliably than those who do not. Contracting it separately makes the delay visible and gives it an owner. Build teams otherwise sit idle against a clock nobody is watching or chasing.
CAGR 23.6%
Full segment breakdown across 6 segments available in the complete report.

Regional Architecture and Country Demand Map

Regional shares follow enterprise technology budgets and delivery capacity together rather than population or economic output. One region sits outside the standard bands, for the reason named in its paragraph and summarised for operator review below. Where work is approved and where it is performed frequently differ.

North America

At 37% this region sits above the standard band, and the explanation is budget concentration rather than any advantage in capability: enterprise technology spending per employee is the highest anywhere and innovation funding was most generous here during the period that built the current installed base of initiatives. Growth of 16.9% is close to the world rate. The transition from innovation to operating budgets is also furthest advanced, which makes this the region where the measured return question is being asked first and hardest. The measured return question is being asked here first and hardest, since the shift from innovation to operating budgets is furthest advanced in this region. Enterprise technology spending per employee is the highest anywhere.
Share: 37% | CAGR: 16.9% (2026 to 2036)

East Asia

Chinese enterprises deploy at considerable scale using domestic platforms and internal delivery teams, which generates activity that international suppliers do not capture in their revenue. Japanese and Korean adopters proceed more cautiously, with longer approval cycles and stronger emphasis on assurance before anything reaches production. Growth of 18.6% exceeds the world rate. Manufacturing and financial services account for most deployment, and delivery capacity constraints are less severe than in Western markets. Manufacturing and financial services account for most deployment, and delivery capacity constraints are noticeably less severe than in Western markets at present. Chinese enterprises deploy at considerable scale using domestic platforms and internal delivery teams, generating activity international suppliers never capture in revenue.
Share: 22% | CAGR: 18.6% (2026 to 2036)
Regional intelligence for 5 additional markets available in the complete report: Western Europe, South Asia and Pacific, Latin America, Middle East and Africa, Eastern Europe. Contact sales@marketmindsadvisory.com.
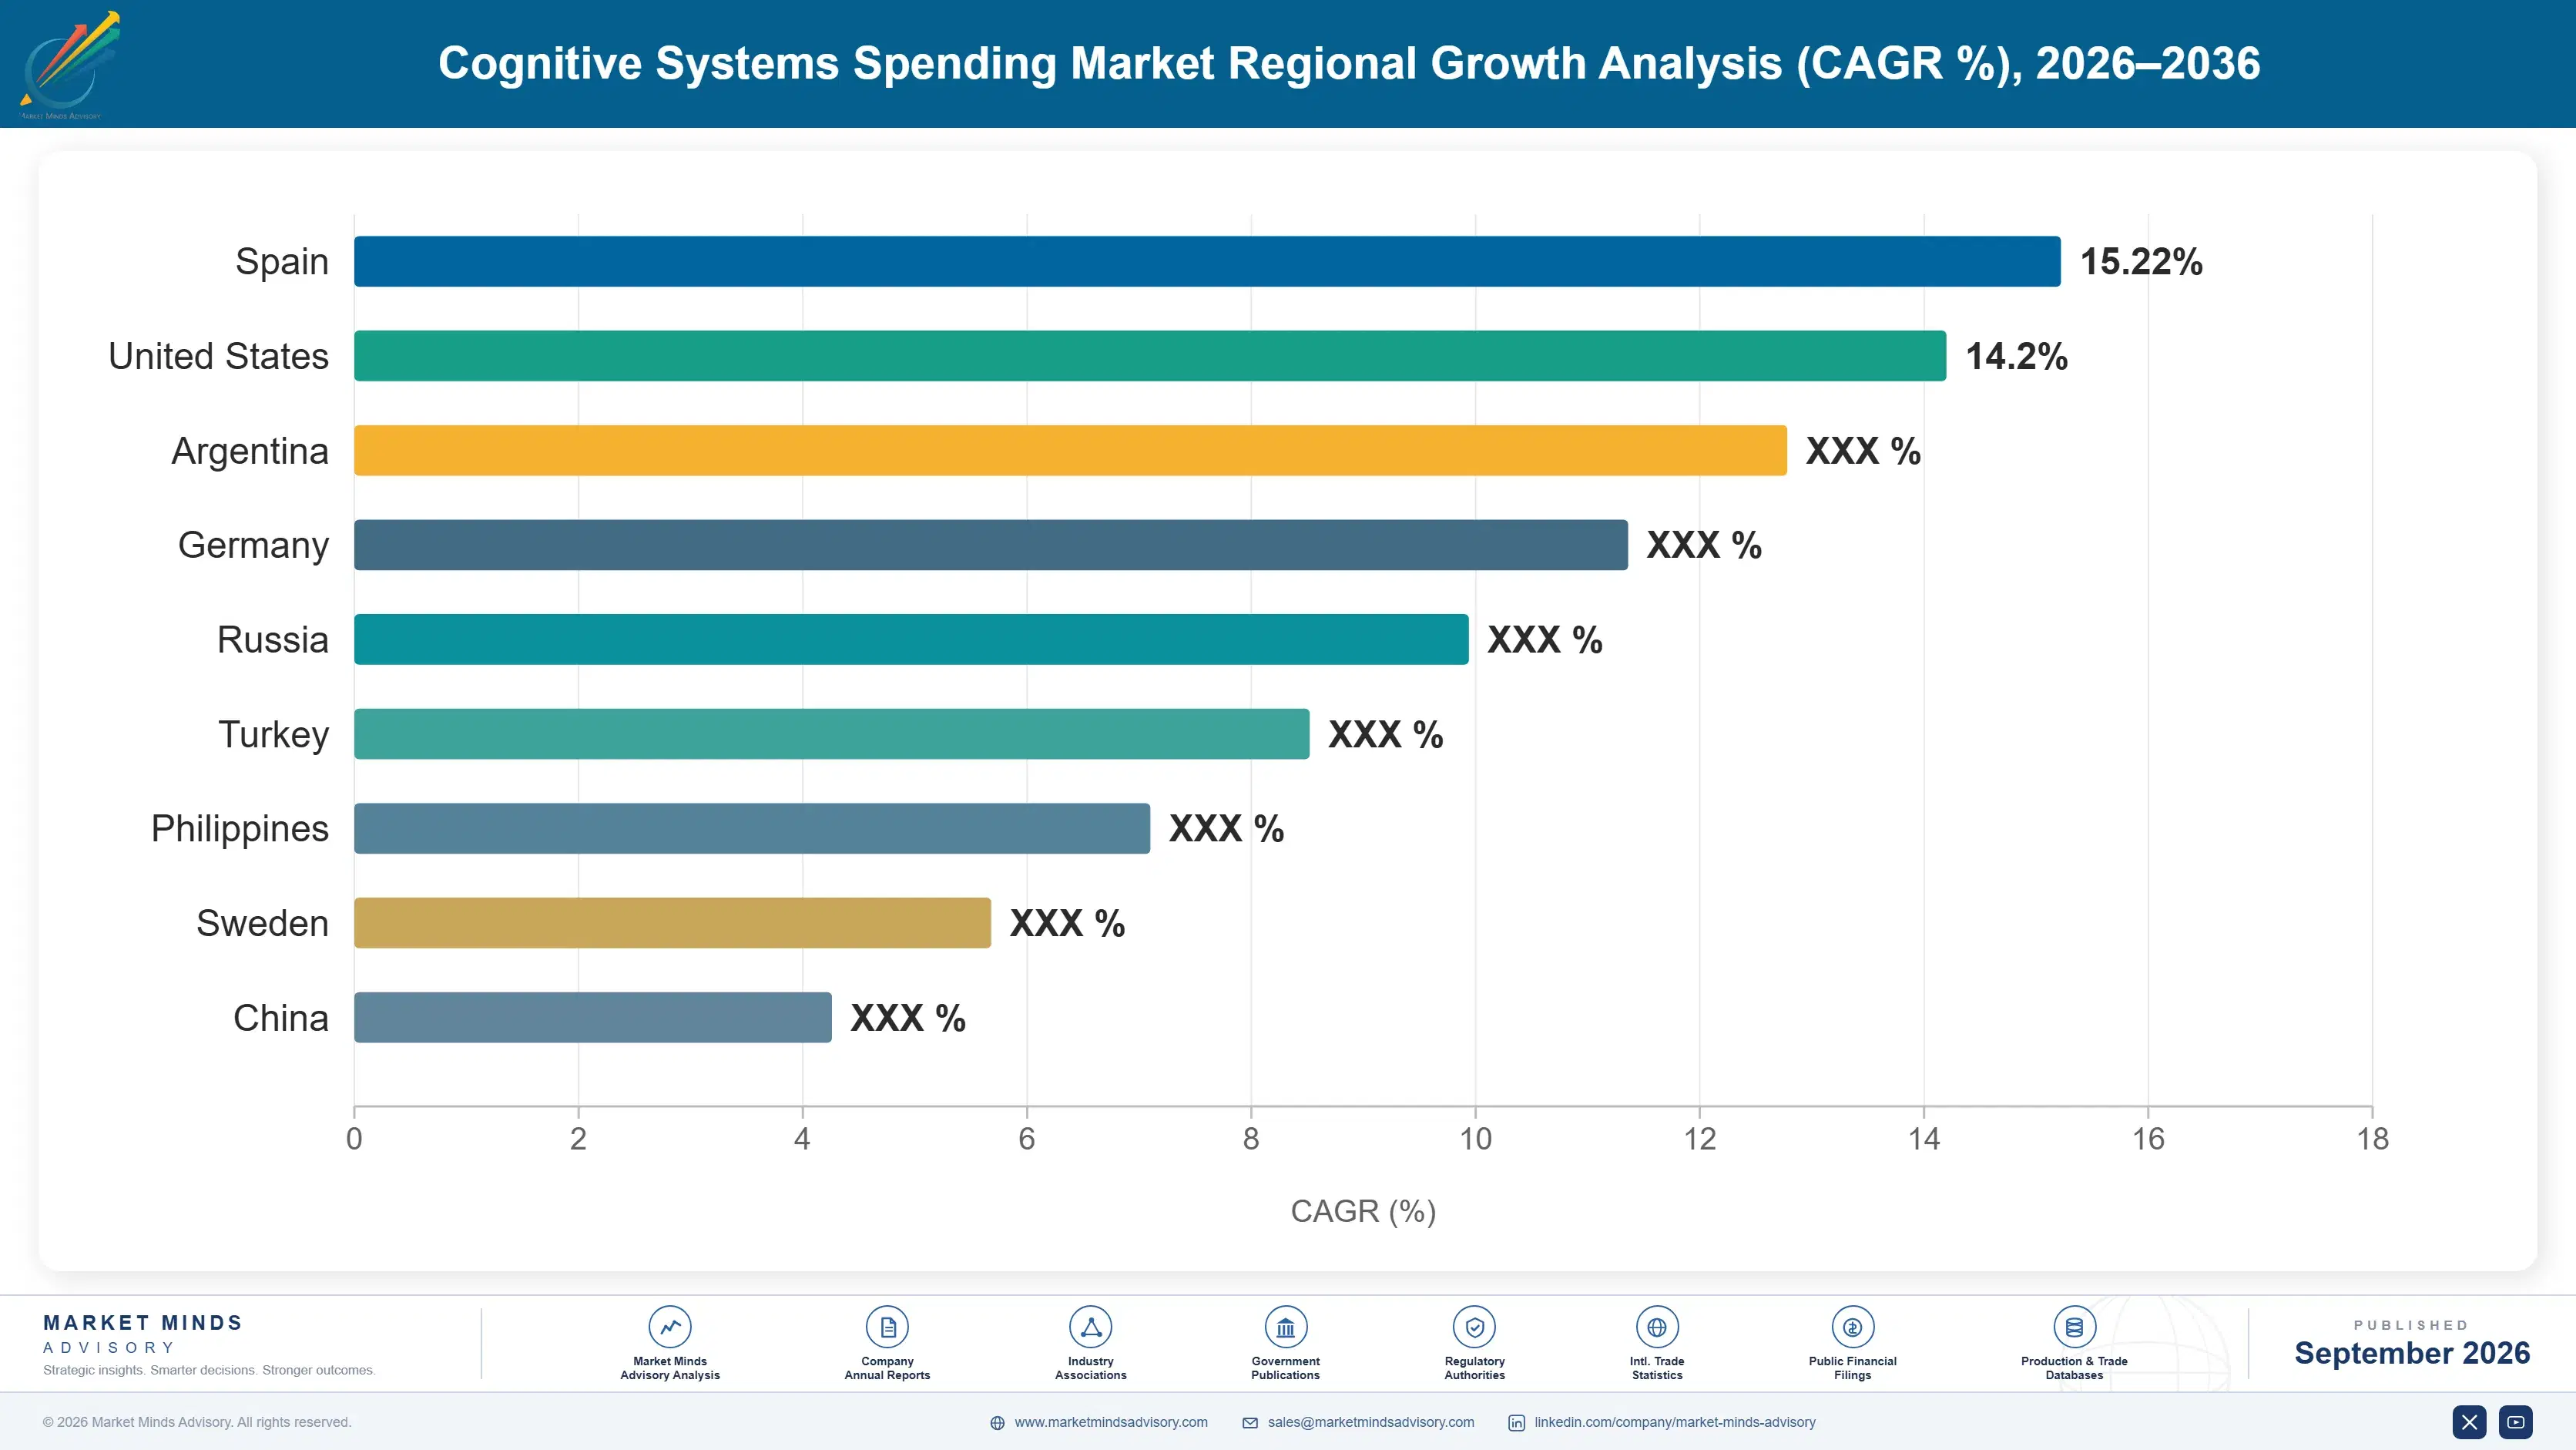
cognitive-systems-spending-market-country-cagr-analysis-1790012021433

Where Suppliers Earn Repeat Work

Four commercial moves separate suppliers building durable programmes from those selling demonstrations that stall before production. Each addresses an organisational obstacle rather than a technical one, which is uncomfortable for suppliers whose capability was built around the technology itself. The obstacles are organisational, and that is where the money now goes. Technology capability decides remarkably little.

Resolve Accountability Before Any Build Begins

About 31% of initiatives reach production, and the ones that stall usually fail on the question of who answers for a wrong output rather than on model performance. Suppliers agreeing accountability, review design, and escalation before build report production conversion 2.8 times higher than those raising it during deployment. Sponsors find the conversation uncomfortable at proposal stage and considerably more uncomfortable six months into a programme that cannot proceed. Nobody wants to accept that responsibility late, and asking early makes the answer somebody else's problem to arrange rather than the supplier's.
Market Impact: Raises production conversion rates by 2.8 times overall

Treat Data Access As Phase One, Not An Assumption

Projects wait 5.8 months on average for information they were scoped around, held up by ownership disputes and permission processes designed for other purposes entirely. Suppliers running data access as an explicit first phase with its own owner and timeline deliver programmes 41 to 58% closer to schedule than those assuming availability. It makes proposals look slower and it prevents the budget consumption that produces nothing anybody can show. Proposals look slower and programmes finish closer to what was promised. It prevents budget being consumed while build teams wait for something nobody is chasing on their behalf.
Market Impact: Improves schedule adherence by 41 to 58% overall

Design Measurement Into Scope From The Outset

Only 17% of production deployments have financial return anybody measured, which was tolerable under innovation funding and is not as operating budgets take over. Suppliers baselining before deployment and defining attribution in advance retain 3.1 times more follow-on work at budget review. It requires declining engagements where no outcome can be attributed honestly, which costs revenue immediately and protects considerably more of it later. It is a harder conversation and a much better commercial position afterwards. Baselining before deployment is the part most suppliers skip, and it is the part that decides whether follow-on work survives review.
Market Impact: Retains 3.1 times more follow-on programme work overall

Build Assurance Capability Rather Than Demonstrations

Production systems need failure detection, behaviour monitoring, and evidence they can be defended when challenged, and assurance work grows at 26.4% while demonstration capability commoditises rapidly. Suppliers with genuine assurance practices command day rates 22 to 34% above general delivery, because the skills are scarcer and the consequence of absence is visible. The work is less interesting to sell and it is what actually converts pilots into operating systems. Demonstration capability is commoditising quickly, and there is very little left to defend there. Selling it is harder and delivering it is what converts pilots into operating systems.
Market Impact: Commands day rates 22 to 34% above general

Who Controls the Margin Pool

Concentration is low for a market of this size. Five suppliers hold 29% of spending, measured consistently on that basis across all participants, and the field spans global system integrators, technology vendors selling services alongside products, professional services firms, and specialist consultancies. Delivery capacity rather than intellectual property distinguishes most of them from one another.
Competition currently turns on three things: available delivery people with production rather than demonstration experience, assurance capability that converts pilots into operating systems, and honest measurement design that survives a budget review. Model expertise is broadly available and decides very little, since capability is largely purchased rather than developed by these suppliers. Price competition happens on general build work where suppliers are numerous, and barely happens at all in assurance, where the specialists are scarce and their absence is visible.

Pressure comes from two directions. Technology vendors bundle delivery services with their own platforms, competing on integration rather than independence. Meanwhile client internal capability grows, taking work that was previously outsourced. Rankings will shift toward suppliers with assurance depth and measurement discipline, since both address why programmes stall rather than why they start. Demonstration-only suppliers hold the weakest position.
cognitive-systems-spending-market-company-positioning-matrix-1790012021968

Competitive Moat and Risk Dimensions

ACCENTURE

Moat: Delivery Scale And Reach

Delivery capacity at a scale competitors cannot match matters more than intellectual property in a market where services account for most spending and available people set the pace. Global reach also lets programmes staff across time zones and cost bases, which large multi-country deployments require and smaller firms cannot arrange.
ACCENTURE

Risk: Client Internal Capability Growth

Enterprises building their own delivery teams take work previously outsourced, and the most repeatable engagements are exactly the ones clients learn to perform themselves. Defending revenue means moving toward assurance and governance work that is harder to internalise, where the competition is specialist rather than scaled.
MICROSOFT

Moat: Platform And Services Together

Selling delivery services alongside the platform the client already runs removes an integration argument competitors must win separately, and it reaches buyers through existing commercial agreements rather than through competitive procurement. That combination is difficult for independent services firms to displace on price alone. Procurement rarely reopens it.
MICROSOFT

Risk: Independence Perception In Advice

Advice from the supplier of the platform being recommended carries an obvious conflict that sophisticated buyers weigh, particularly where the architecture decision has long consequences. Programmes involving genuine platform choice frequently go to firms with no product to protect, which limits the addressable portion of the market.

Players Tracked

Prominent Players

Accenture
IBM
Microsoft
Deloitte
Infosys

Other Key Players

Tata Consultancy Services
Cognizant
Capgemini
Wipro
HCLTech
EY
KPMG
PwC
Google
Amazon Web Services
Palantir
DXC Technology
NTT Data
Genpact
Fractal Analytics

Recent Developments

JANUARY 2026

Accenture Expands Model Assurance And Monitoring Delivery Capability

Accenture completed an organic expansion of its assurance and monitoring practice, funded internally with no acquisition involved, after client programmes repeatedly stalled at the point where production deployment required defensible evidence of behaviour. Assurance specialists were recruited and developed internally, since experienced people are scarce.
Signal: Assurance rather than model capability is where programmes stall, and suppliers are staffing accordingly. Demonstration skills commoditised fast.
SEPTEMBER 2025

IBM Acquires Data Governance Specialist For Access And Lineage

IBM completed an acquisition of a data governance specialist, addressing the access, ownership, and lineage problems that delay projects by almost six months before any model development can begin at all. Ownership disputes and permission processes designed for other purposes cause most of the delay rather than any technical limitation.
Signal: Data access is bought as a capability because tooling alone does not shorten an organisational delay.
MAY 2025

Deloitte Signs Programme Supply Agreement With National Government Body

Deloitte entered a multi-year supply agreement covering cognitive system deployment across a national government body, with measurement and assurance requirements written into the contract rather than added afterwards. Measurement and assurance obligations were written into the contract itself rather than being added once deployment had already begun.
Signal: Buyers are contracting for measured outcomes because innovation funding no longer covers this work. Evidence is contracted now.

What This Spending Actually Buys

One input dominates. Delivery labour runs 58% to 66% of supplier cost, covering engineers, data specialists, and change practitioners whose availability sets how fast any programme can proceed. Software and tooling licences take 16% to 22%, considerably less than the market's name implies. Compute for development, evaluation, and testing adds 14% to 20%, which is measured separately from the production infrastructure clients run themselves.
Delivery wage inflation ran ahead of general technology salaries through 2024 and 2025 as suppliers competed for the same scarce population of people with production rather than demonstration experience, and several described the margin pressure directly in their annual reports for those years. Assurance and governance specialists commanded the sharpest increases, since that capability was scarcest exactly as demand for it rose fastest across every market.

The competitive disadvantage mechanism runs through people rather than technology. A supplier without production-experienced delivery staff cannot convert programmes regardless of what platforms it partners with, and those people cannot be hired quickly because the experience takes years of shipped systems to acquire. Exposure varies by supplier type: scaled integrators can move people between engagements, while smaller firms carry idle specialists or turn work away.
cognitive-systems-spending-market-cost-volatility-analysis-1790012022170

Develop Production Experience Rather Than Recruiting It

People with genuine production experience are scarce, expensive, and pursued by every competitor simultaneously, which makes recruitment a losing strategy for anybody not already holding a large bench. Developing that experience internally through structured rotation onto live systems takes longer and produces capability nobody can bid away with a salary offer alone. Salary offers cannot bid it away.

Standardise Assurance Methods Across Client Programmes

Assurance work is repeated across programmes with far more in common than clients believe, yet it is frequently rebuilt from first principles on each engagement at full cost. Standard methods, evidence templates, and monitoring patterns reduce delivery hours substantially while improving the consistency that makes the output defensible when somebody eventually challenges it. Consistency also makes the output defensible.

Separate Data Access Work Into Its Own Engagement

Data access consumes almost six months on average and is organisational rather than technical work, yet it is usually absorbed inside a build engagement priced and scheduled as though the data were available. Contracting it separately makes the delay visible, gives it an owner, and prevents build teams sitting idle against a clock nobody is watching.

Portfolio Architecture for Margin Defence

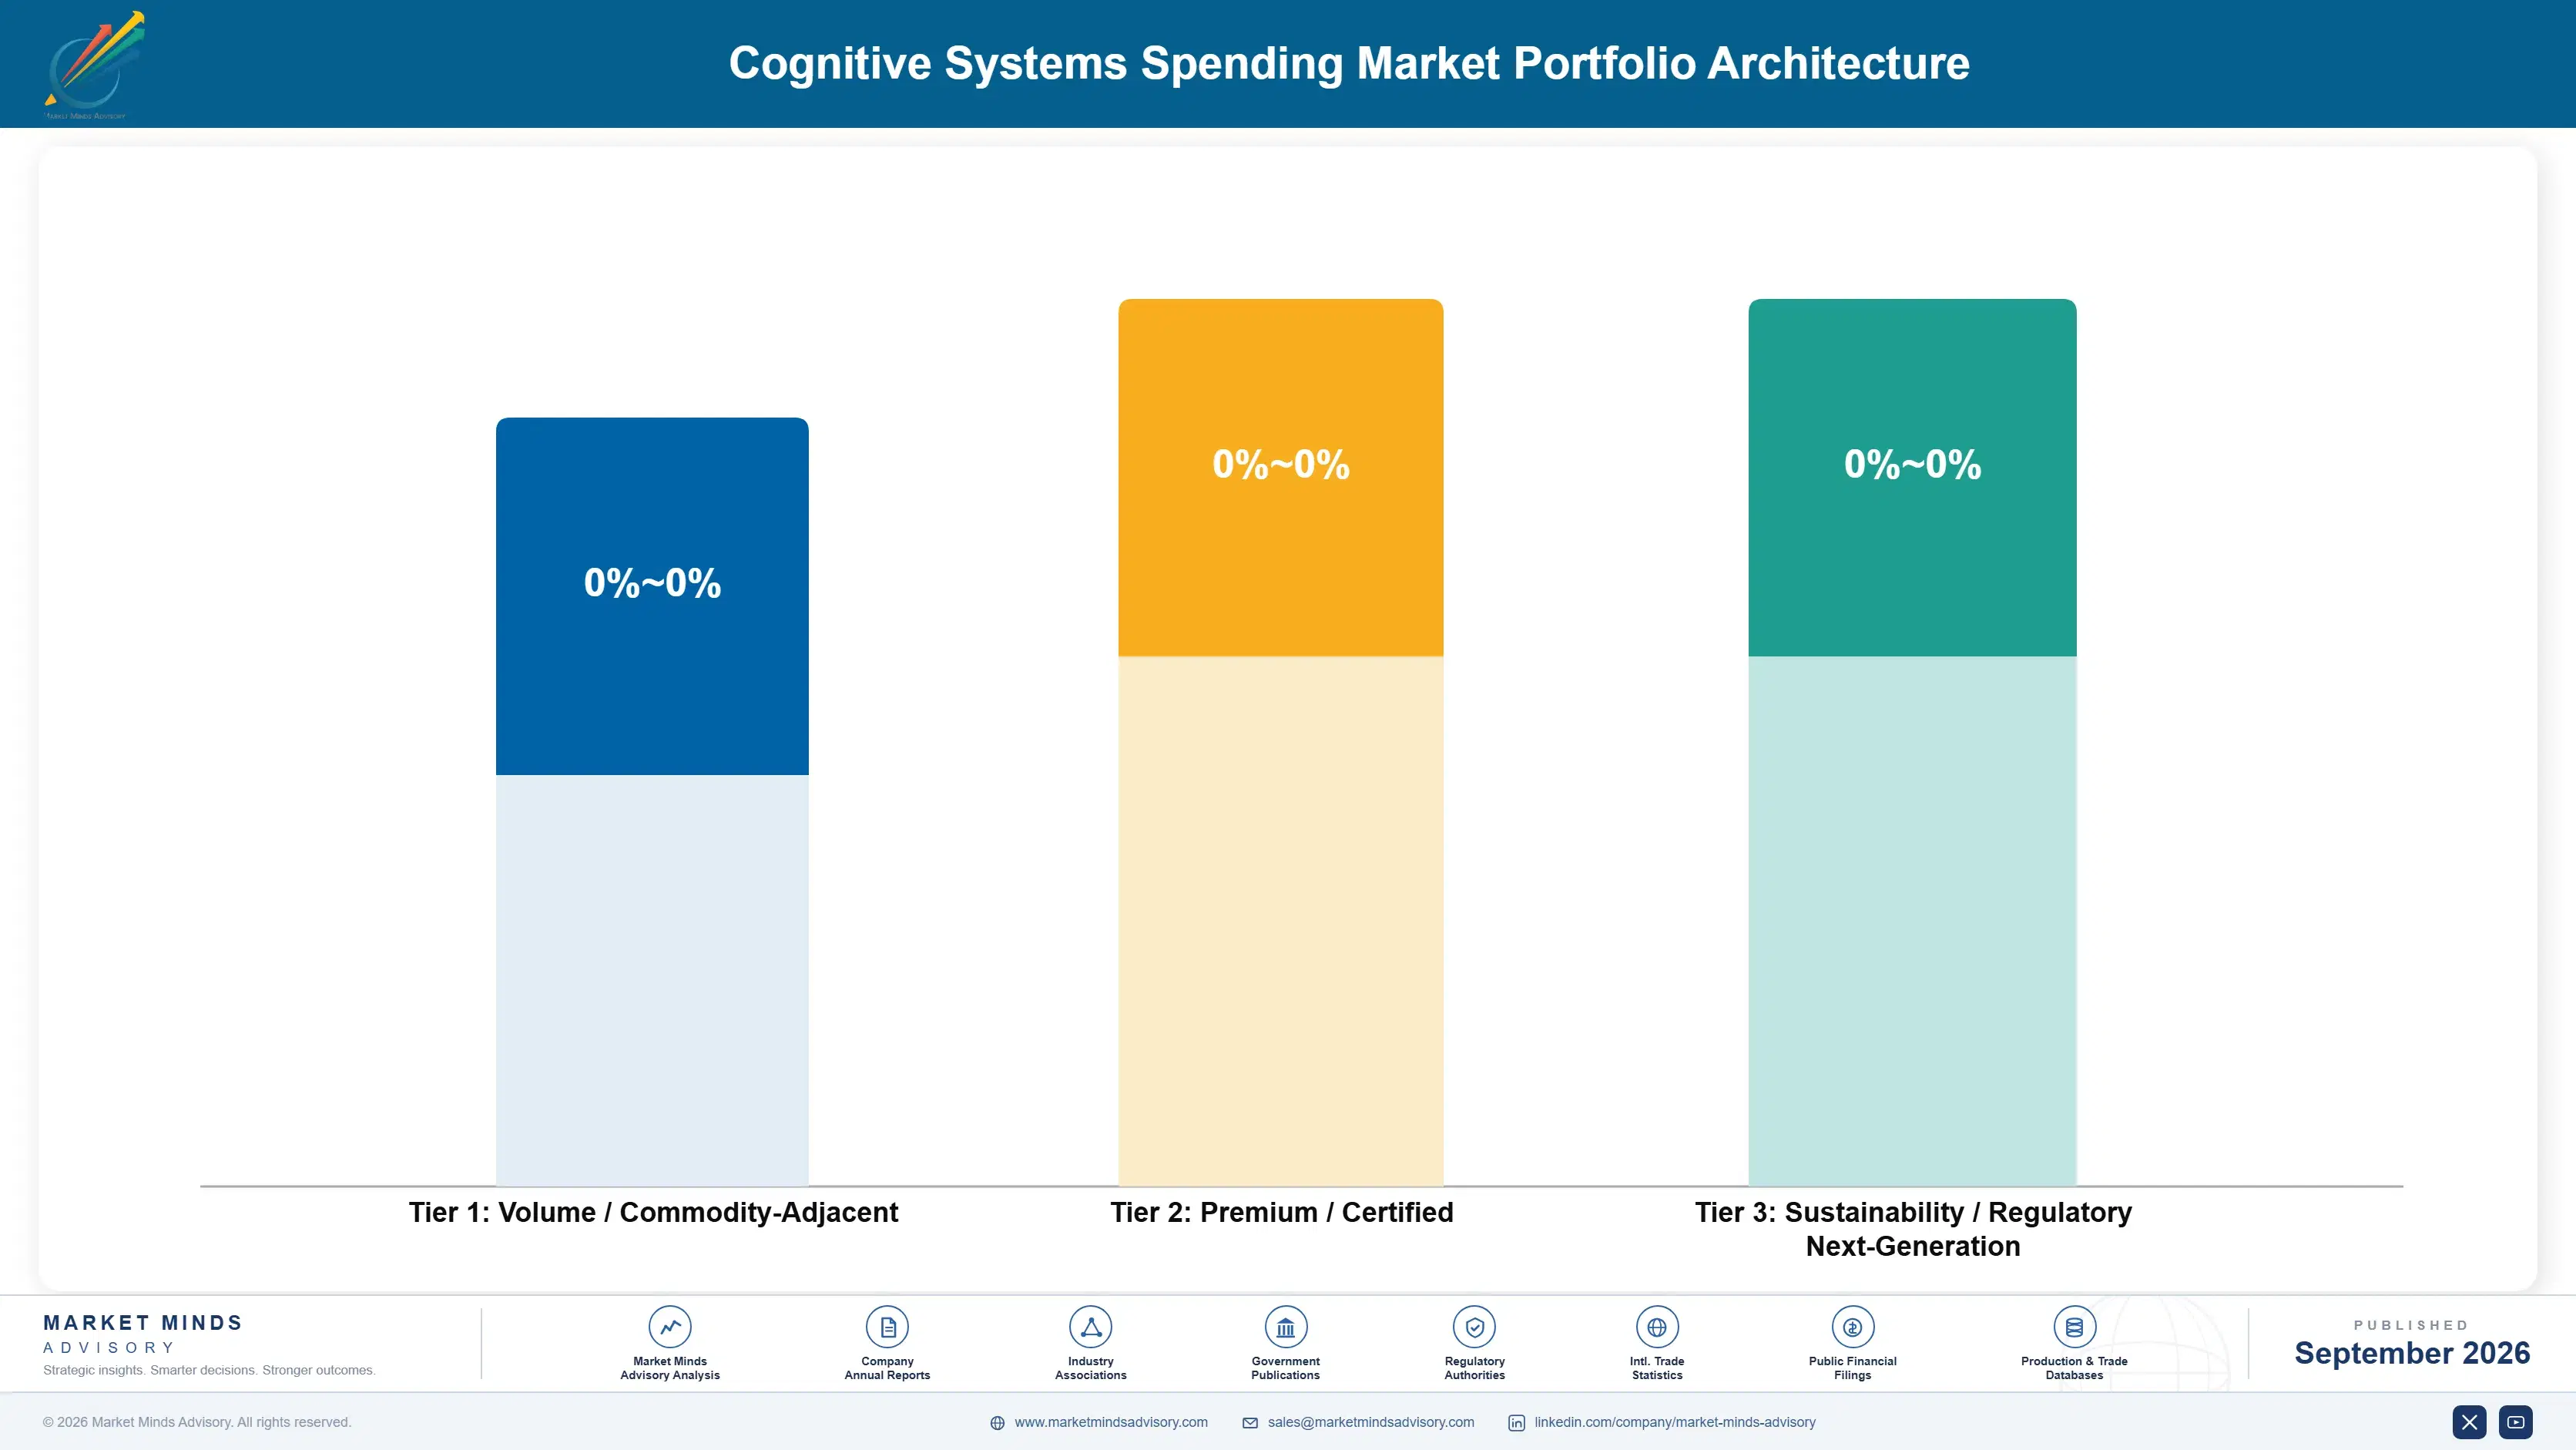
Margin follows scarcity of the people doing the work. General integration and change delivery are close to commodity, since capable firms are numerous and clients increasingly perform this internally. Application software and tooling earn better but represent a minority of spending. Assurance, governance, and measurement design earn most, because the specialists are scarce and the consequence of their absence is visible in stalled programmes. Scarcity of the right people rather than technology decides this hierarchy.
The tension between volume and premium runs through what the client is buying. An organisation running a proof of concept wants capability demonstrated cheaply and compares day rates across suppliers who can all do it. An organisation putting a system into production where wrong answers matter is buying defensibility, and it does not compare day rates in the same way at all.

High-value pools concentrate where consequences are real: regulated financial decisions, clinical and safety-related applications, and any deployment where a wrong output creates legal or reputational exposure. Those buyers fund assurance willingly. Where the application is internal productivity with containable consequences, delivery is a commodity and clients internalise it as soon as they reasonably can. Clients internalise that work quickly.

Volume / Commodity-Adjacent

General integration, build, and change delivery where capable suppliers are numerous and clients increasingly perform the work using their own teams. The ten-point range reflects delivery location mix and utilisation rather than any capability difference between the firms.
Gross Margin: 22% to 32%

Premium / Certified

Application software, platform tooling, and specialised data engineering where product margin or scarce technical skill lifts the economics above general delivery. The twelve-point range separates suppliers with proprietary tooling from those assembling entirely from third-party components.
Gross Margin: 36% to 48%

Sustainability / Regulatory / Next-Generation

Assurance, governance, measurement design, and regulated deployment work where specialists are scarce and absence is visible in stalled programmes. The fourteen-point range reflects how much standardised method each supplier reuses rather than rebuilding per engagement.
Gross Margin: 50% to 64%
cognitive-systems-spending-market-portfolio-architecture-1790012022683

High-value Sub-segments and Strategic Watch-out

Assurance And Monitoring Practice

Highest value and fastest growth at 26.4%, addressing exactly where roughly two thirds of initiatives stall before reaching production at all. The fourteen-point range reflects method standardisation, since rebuilding assurance per engagement consumes hours that reuse would eliminate. Specialists are scarce and heavily contested. Absence shows in stalled programmes.
Gross Margin: 52% to 66%

Data Access And Governance

High value growing at 23.6%, tackling the 5.8 month delay that consumes budget while producing nothing anybody can demonstrate. The twelve-point range reflects whether suppliers contract this separately with its own owner or absorb it inside build engagements. Obstacles are organisational rather than technical throughout.
Gross Margin: 44% to 56%

Regulated Deployment Programmes

High value where wrong outputs create legal or reputational exposure and buyers fund defensibility without comparing day rates. The fourteen-point range reflects regulatory depth by jurisdiction, which cannot be assembled quickly by any competitor arriving later. Buyers fund defensibility without comparing day rates. Jurisdictional depth cannot be assembled quickly.
Gross Margin: 46% to 60%

General Build And Integration

The strategic watch-out. Capable suppliers are numerous, clients internalise this work as their own teams mature, and day rate comparison decides most awards. The ten-point range reflects delivery location and utilisation rather than anything defensible. Internal teams take this work as they mature. Day rate comparison decides most awards.
Gross Margin: 20% to 30%

How This Spending Repeats

Programme spending recurs while a programme runs and stops when it concludes, which makes this a book of work rather than an annuity. Deployed systems then generate monitoring, retraining, and governance work that does recur, which is why suppliers pushing initiatives through to production build considerably more durable revenue than those accumulating pilots that quietly end without anybody declaring them finished. Pilots that quietly end generate nothing at all afterwards.
Attachment depth follows operating responsibility rather than relationship. A supplier monitoring a live system, holding the assurance evidence, and answerable when behaviour changes is difficult to replace without transferring accountability nobody wants to accept mid-flight. A supplier who delivered a demonstration has no attachment whatsoever and competes again for every subsequent piece of work.

The buyer has shifted from innovation functions toward line-of-business leadership and risk. Early programmes were sponsored by innovation teams evaluating possibility with budgets nobody revisited annually. Operating budget holders now fund the work, risk functions review accountability before production, and both ask for measured outcomes that only 17% of existing deployments can currently produce. Two functions now hold what one used to decide alone.
cognitive-systems-spending-market-end-use-penetration-index-1790012023177

Where This Market Rewards

These are among the four positions where our research anticipates prominent divergence between winners and laggards over the coming forecast period. Each is grounded in the demand model, the regulatory perimeter, and the announced capacity pipeline.
01 / ACCOUNTABILITY RESOLUTION FIRST

Ask who signs off before building

Around 31% of initiatives reach production, and those that stall generally fail on who answers for a wrong output rather than on anything the model does badly. Suppliers agreeing accountability, review design, and escalation before build report production conversion 2.8 times higher than those raising it later. Sponsors find the conversation uncomfortable at proposal stage and far more uncomfortable six months into a programme that cannot proceed, and nobody accepts that responsibility willingly once work is underway, which is why asking early moves it to somebody else.
02 / DATA ACCESS SEQUENCING

Six months waiting is the normal case

Projects wait 5.8 months on average for information they were scoped around, delayed by ownership disputes and permission processes designed for entirely different purposes. Suppliers running data access as an explicit first phase with its own owner deliver 41 to 58% closer to schedule than those assuming availability. It makes proposals look slower, and it prevents budget being consumed while build teams wait for something nobody is chasing, which is how most of this budget disappears without visible failure, and slower proposals are considerably better than stalled programmes.
03 / MEASUREMENT BY DESIGN

Operating budgets will ask for numbers

Only 17% of production deployments have financial return anybody measured, which innovation funding tolerated and operating budgets will not as they take over the funding of this work. Suppliers baselining before deployment and defining attribution in advance retain 3.1 times more follow-on work at budget review. It requires declining engagements where no outcome can be attributed honestly, which costs revenue now and protects much more later, and the alternative is defending work nobody can evidence, which is a position no supplier wants to be defending.
04 / ASSURANCE CAPABILITY BUILDING

The dull work converts the pilots

Production systems require failure detection, behaviour monitoring, and evidence defensible under challenge, and assurance work grows at 26.4% while demonstration capability commoditises quickly. Suppliers with genuine assurance practices command day rates 22 to 34% above general delivery, because the specialists are scarce and their absence shows in stalled programmes. It is less interesting to sell and it is what turns pilots into operating systems, which is exactly why it commands the rates it does, and demonstration capability is commoditising very quickly indeed.

Engagement Snapshot From the Field

A live engagement with an industry participant carrying material or product regulatory and market exposure ahead of a defining policy shift, showing how our research translates into a defensible multi-year portfolio strategy.
MARKET MINDS ADVISORY · CLIENT ENGAGEMENT SUMMARY
Cognitive Systems Spending Producer Strategic Portfolio Review and Transition Roadmap 2026·Investment Scenario on Cognitive Systems Spending Exposure Evaluation 2025-26
CLIENT PROFILE
An insurance group operating in eight countries with roughly 26,000 staff, running 34 cognitive system initiatives across underwriting, claims, and service functions at a combined annual cost near USD 47 million (client-reported, unverified by MMA). Nine initiatives had been running for more than two years without reaching production. No portfolio-level measurement had ever been attempted across the group.
STRATEGIC CHALLENGE
The board had asked what the programme had delivered and the answer assembled internally consisted of activity rather than outcomes. Innovation funding was being withdrawn in favour of line-of-business budgets, and nobody had established which initiatives could survive the evidence standard that change would impose. The board had asked twice already.
MMA APPROACH
MMA assessed each of the 34 initiatives against production status, data access position, accountability ownership, and whether any financial outcome had been baselined. Stalled initiatives were examined to identify what specifically had blocked them rather than accepting general explanations offered internally. Data ownership was traced for every stalled initiative individually.
KEY FINDINGS
  1. Of 34 initiatives, 11 had reached production and only 4 had any baselined financial measurement, so most of the portfolio could not defend itself against an operating budget review.
  2. Every one of the nine long-running stalled initiatives was blocked on data access or accountability ownership, and none on model performance or technical feasibility.
  3. Average data access wait across the portfolio was 6.9 months, and in four cases the data owner had never been formally identified at any point during the project.
  4. Two production deployments in claims showed measurable benefit exceeding the entire cost of the portfolio, which nobody had reported because measurement had been informal.
CLIENT PROFILE
An insurance group operating in eight countries with roughly 26,000 staff, running 34 cognitive system initiatives across underwriting, claims, and service functions at a combined annual cost near USD 47 million (client-reported, unverified by MMA). Nine initiatives had been running for more than two years without reaching production. No portfolio-level measurement had ever been attempted across the group.
STRATEGIC CHALLENGE
The board had asked what the programme had delivered and the answer assembled internally consisted of activity rather than outcomes. Innovation funding was being withdrawn in favour of line-of-business budgets, and nobody had established which initiatives could survive the evidence standard that change would impose. The board had asked twice already.
MMA APPROACH
MMA assessed each of the 34 initiatives against production status, data access position, accountability ownership, and whether any financial outcome had been baselined. Stalled initiatives were examined to identify what specifically had blocked them rather than accepting general explanations offered internally. Data ownership was traced for every stalled initiative individually.
KEY FINDINGS
  1. Of 34 initiatives, 11 had reached production and only 4 had any baselined financial measurement, so most of the portfolio could not defend itself against an operating budget review.
  2. Every one of the nine long-running stalled initiatives was blocked on data access or accountability ownership, and none on model performance or technical feasibility.
  3. Average data access wait across the portfolio was 6.9 months, and in four cases the data owner had never been formally identified at any point during the project.
  4. Two production deployments in claims showed measurable benefit exceeding the entire cost of the portfolio, which nobody had reported because measurement had been informal.
RECOMMENDED STRATEGY
Phase 1: Phase one: stop the nine stalled initiatives rather than continuing to fund work blocked on obstacles that no further build effort will resolve. Phase 2: Phase two: baseline and measure the eleven production deployments properly, starting with the two claims systems whose benefit is already visible informally. Phase 3: Phase three: require named data owners and accountability sign-off before any new initiative receives funding from line-of-business budgets. No exceptions were recommended.
OUTCOME
Portfolio spending fell 38% while production deployments rose from eleven to sixteen (client-reported, unverified by MMA). The two claims systems were expanded after measurement confirmed the informal estimates. New initiative approvals now require named data owners before funding. Stalled initiatives were closed rather than quietly continued.

Frequently Asked Questions

Foundational context covering the market sizes, CAGR, scope, country, region and competition that inform every finding below. This section is provided to cover basics and most often pre-purchase conversations, answered from the MMA Primary Research Dataset.

What is the current size of the Cognitive Systems Spending Market?

The market was worth USD 148.0 billion in 2025 and reaches USD 174.0 billion in 2026. Value covers software and services, excluding accelerated infrastructure measured separately.

How large will the Cognitive Systems Spending Market be by 2036?

MMA forecasts USD 880.3 billion by 2036, an increase of USD 706.3 billion across the forecast period. That represents 5.06 times the 2026 base of USD 174.0 billion.

What is the CAGR for the Cognitive Systems Spending Market 2026 to 2036?

The base case compound annual growth rate is 17.6%, with a bull case at 18.8% and a bear case at 16.4%. Historical growth from 2020 to 2025 ran at 16.2%.

Which segment is growing fastest?

Model assurance and monitoring services grow at 26.4%, half again the market rate of 17.6%. Production requires evidence and accountability that demonstrations never had to provide.

Who are the major companies in the Cognitive Systems Spending Market?

Accenture, IBM, Microsoft, Deloitte, and Infosys lead, together holding 29% of spending. Delivery capacity rather than intellectual property distinguishes most participants across this whole market.

Which country is growing fastest?

India grows at 22.4%, driven by service organisations delivering programmes for clients headquartered elsewhere alongside domestic adoption that is expanding quickly from a low base.

Report Segmentation Architecture

The full report scope spans multiple orthogonal segmentation dimensions, with cross-tabulated demand data provided for each dimension pair. Coverage extends further to regional breakdowns, trend trajectories, and the competitive detail needed to support segment-level decision-making.

By Spending Category

  • Artificial Intelligence Application Software
  • Platform and Development Tooling
  • Data Preparation and Governance Services
  • Model Assurance and Monitoring Services
  • Integration and Implementation Services
  • Change Management and Adoption Services

By End-Use Industry

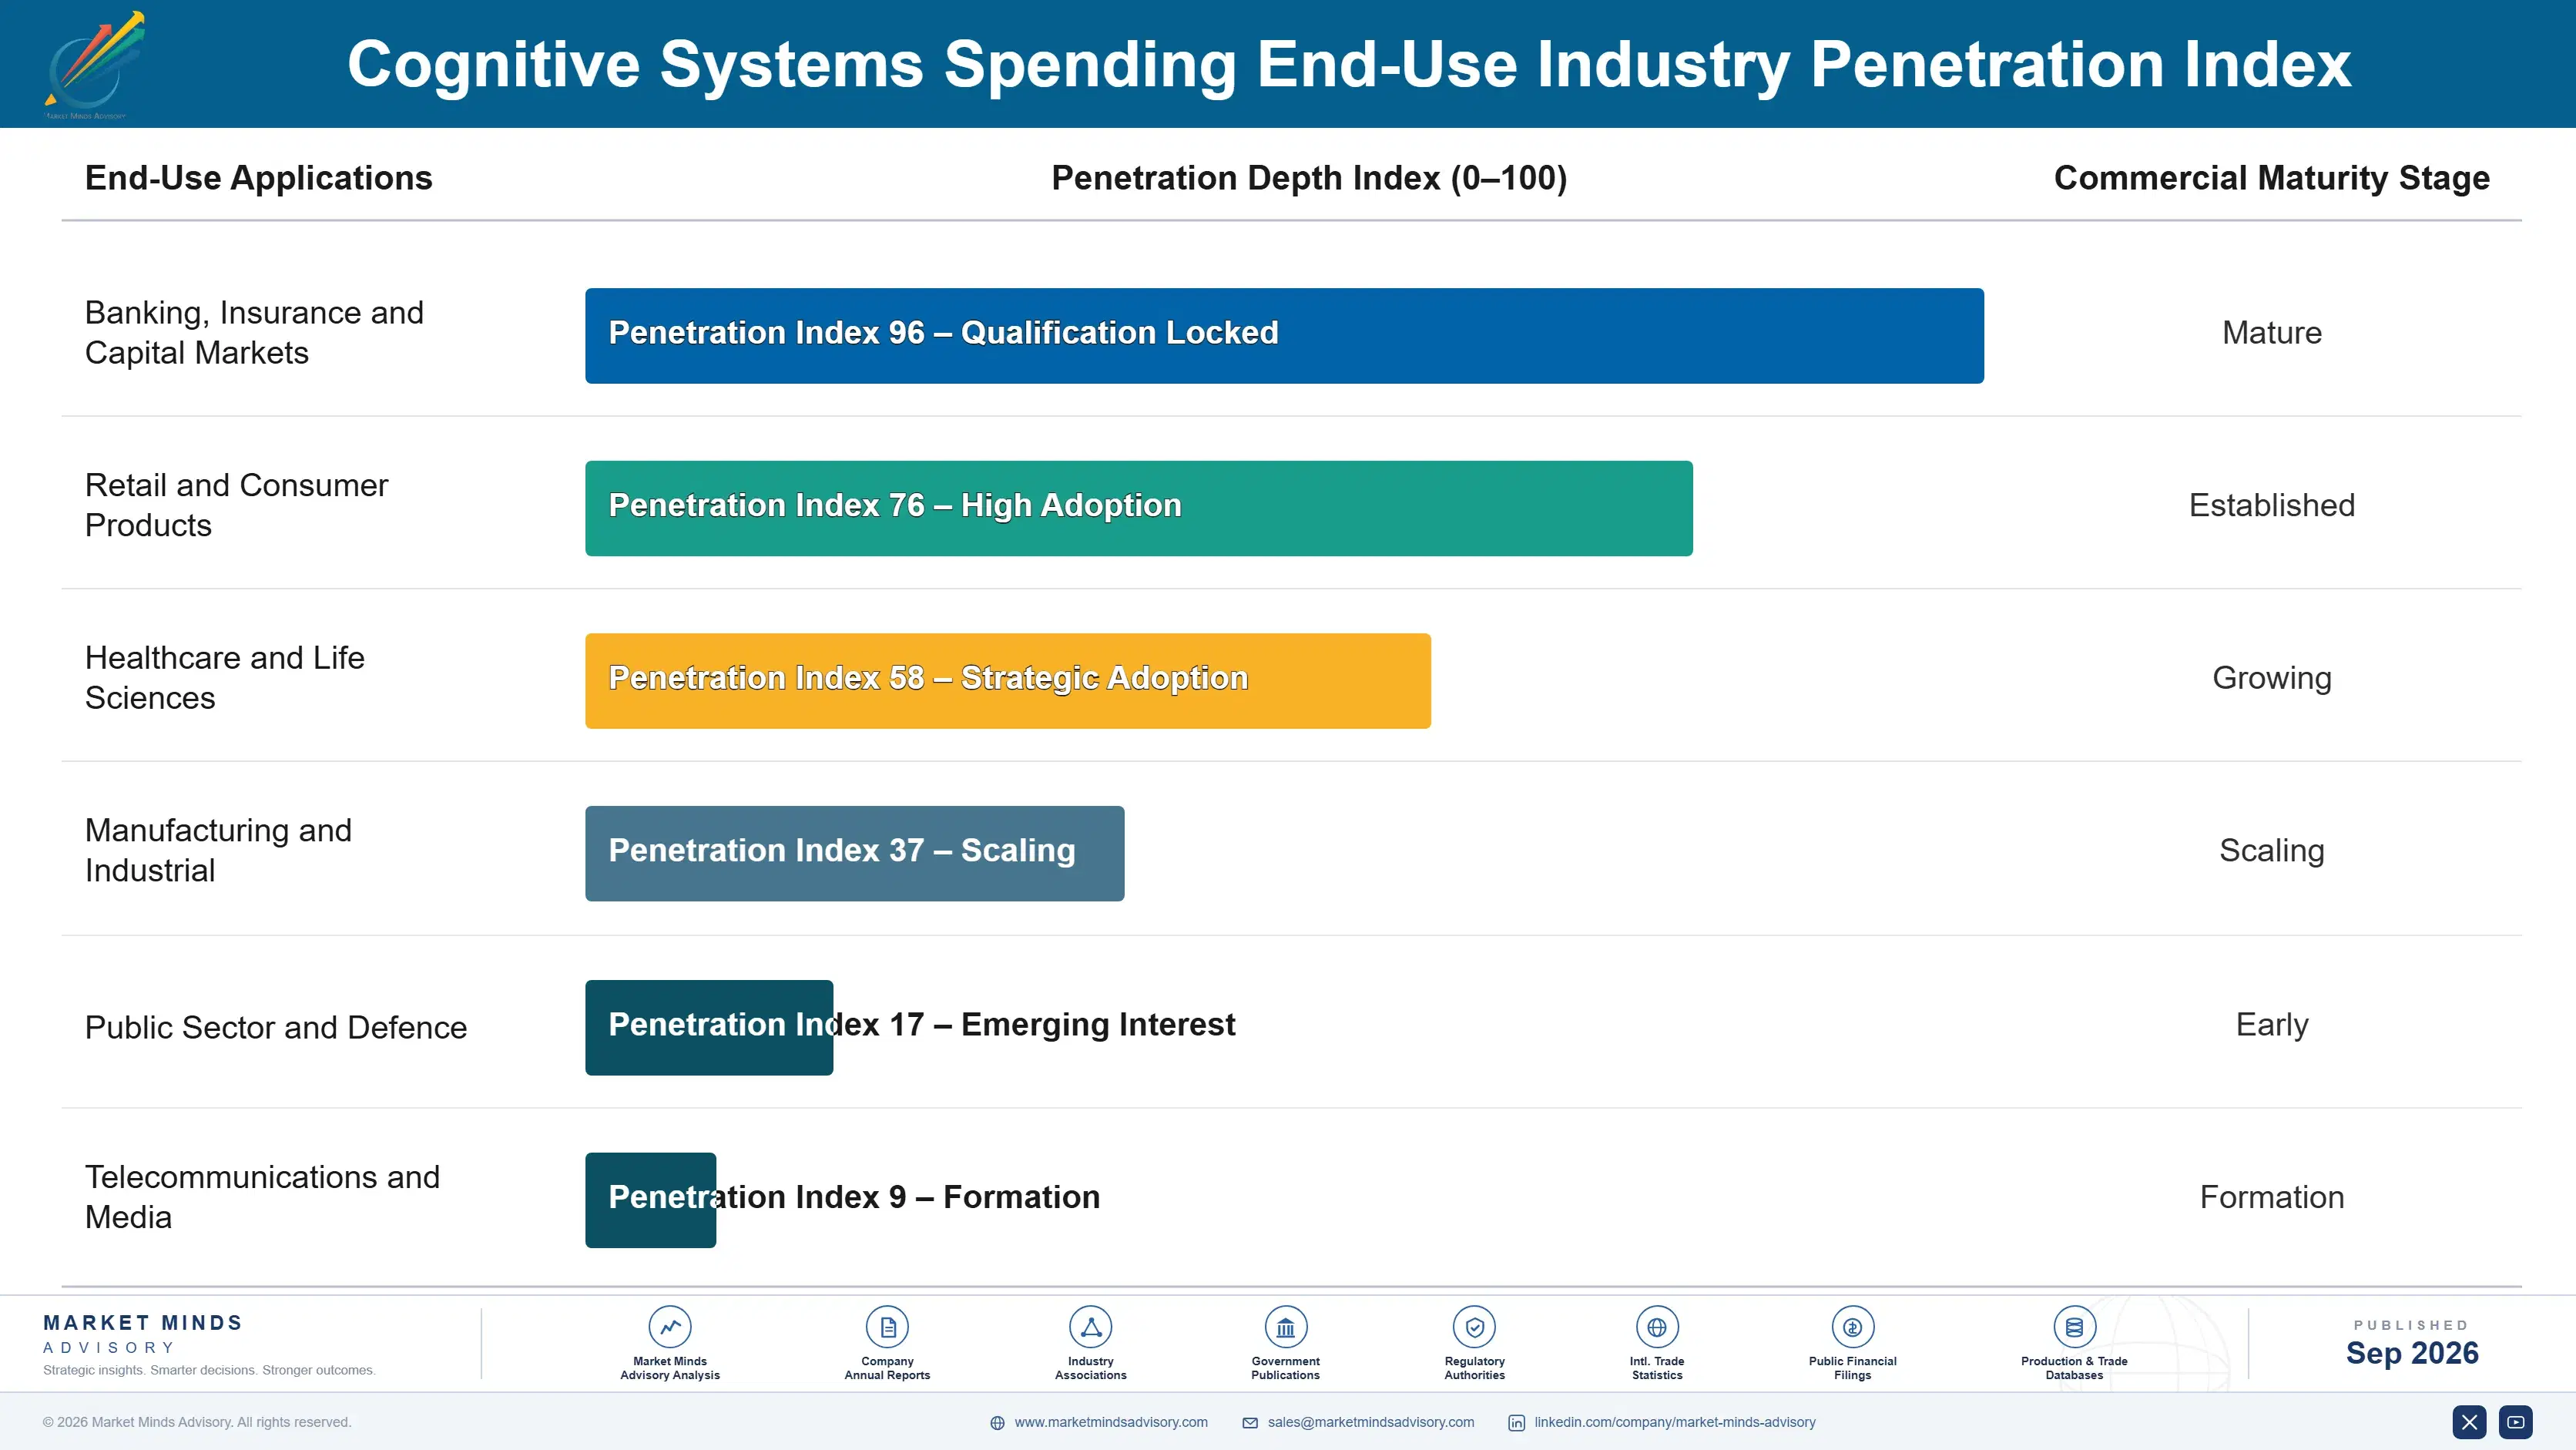
  • Banking, Insurance and Capital Markets
  • Retail and Consumer Products
  • Healthcare and Life Sciences
  • Manufacturing and Industrial
  • Public Sector and Defence
  • Telecommunications and Media

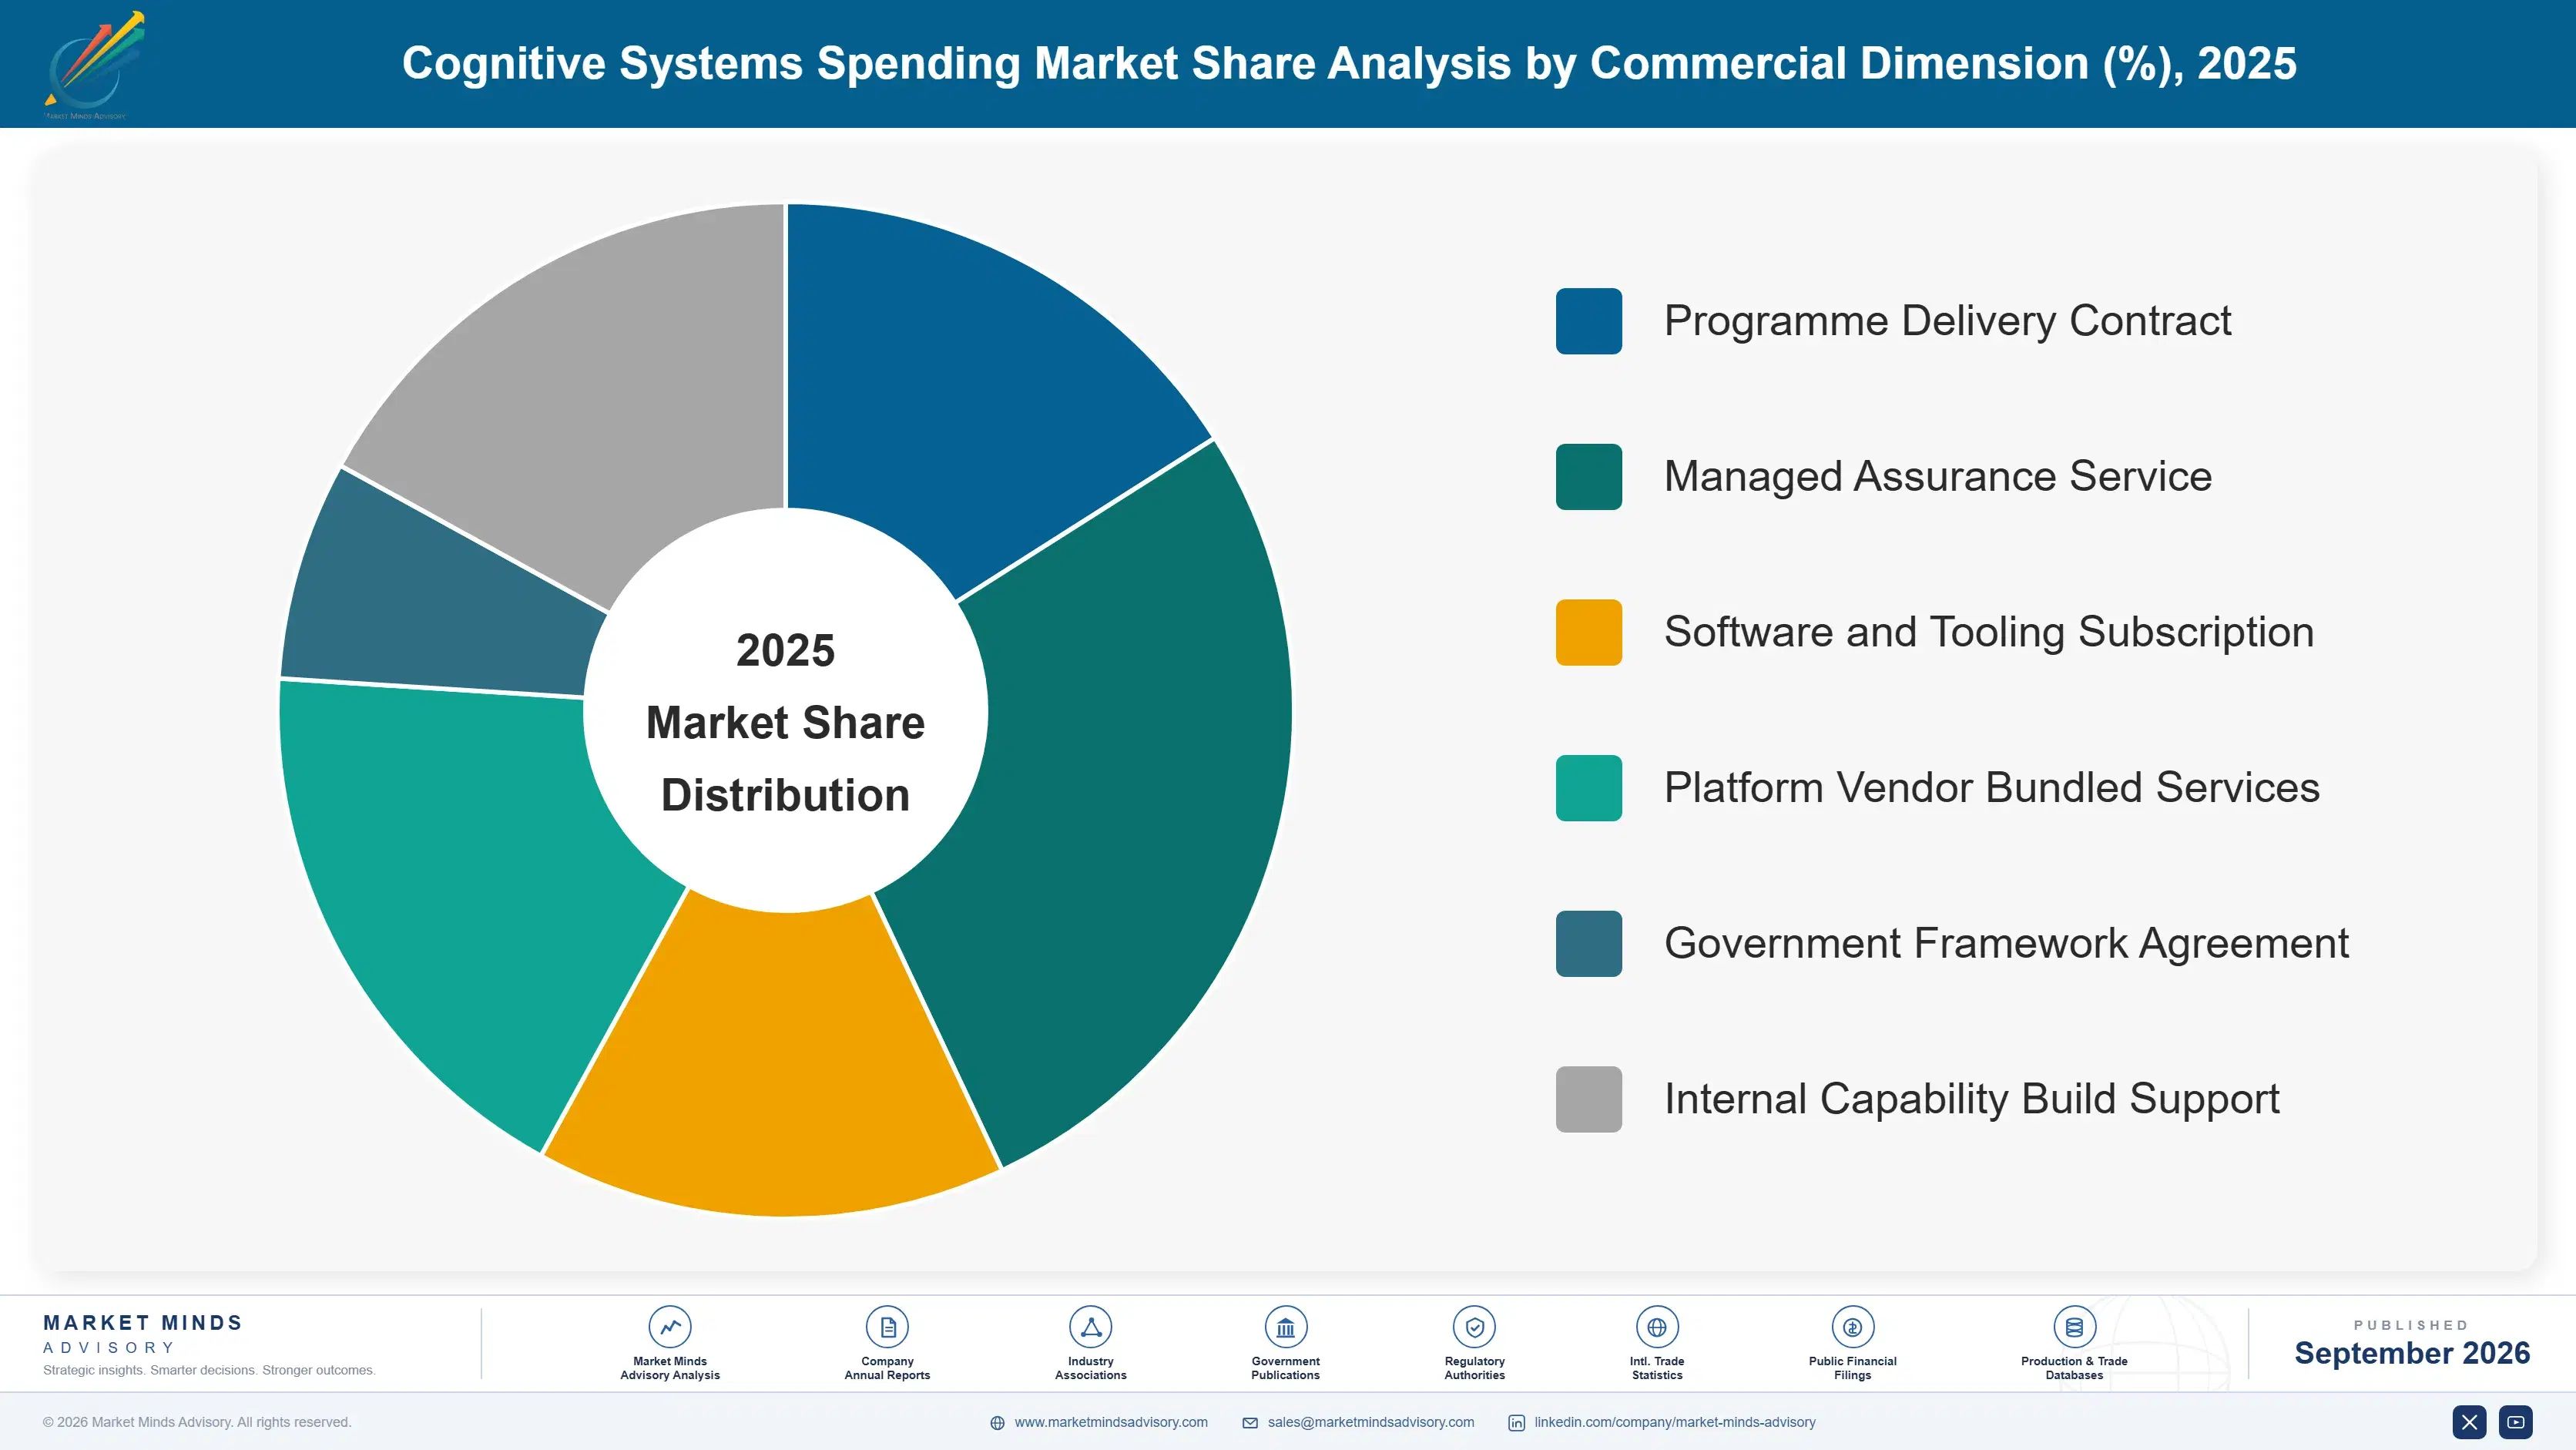
By Commercial Dimension

  • Programme Delivery Contract
  • Managed Assurance Service
  • Software and Tooling Subscription
  • Platform Vendor Bundled Services
  • Government Framework Agreement
  • Internal Capability Build Support

By Region

  • North America
  • East Asia
  • Western Europe
  • South Asia and Pacific
  • Latin America
  • Middle East and Africa
  • Eastern Europe

Scope, Methodology, and Coverage

Every figure in this report is reproducible from documented input assumptions. The scope below maps the historical period, the forecast horizon, the segmentation dimensions, and the countries covered, alongside the underlying primary and qualitative methodology.
Historical Period
2020 to 2025
Forecast Period
2026 to 2036
Base Year
2025 (USD billions; MMA Primary Research Dataset, September 2026)
Market Definition
This market covers organisational spending on deploying cognitive and artificial intelligence systems, including artificial intelligence application software, platform and development tooling, data preparation and governance services, model assurance and monitoring services, integration and implementation services, and change management and adoption services. It excludes accelerated compute infrastructure and cloud capacity measured separately, consumer subscriptions, semiconductor manufacture, and academic research funding.
Quantitative Units
USD billions, software and services spending
Segmentation Dimensions
Spending category, end-use industry, commercial dimension, region
Regions Covered
North America, East Asia, Western Europe, South Asia and Pacific, Latin America, Middle East and Africa, Eastern Europe
Countries Covered
United States, Canada, Mexico, China, Japan, South Korea, Taiwan, United Kingdom, Germany, France, Netherlands, Switzerland, Sweden, Spain, Italy, India, Australia, Singapore, Indonesia, Vietnam, Brazil, Mexico, Chile, Colombia, Saudi Arabia, United Arab Emirates, Nigeria, South Africa, Poland, Romania
Key Companies Profiled
Accenture, IBM, Microsoft, Deloitte, Infosys, Tata Consultancy Services, Cognizant, Capgemini, Wipro, HCLTech, EY, KPMG, PwC, Google, Amazon Web Services, Palantir, DXC Technology, NTT Data, Genpact, Fractal Analytics
Quantitative Methodology
Primary survey, n=3,800 respondents, Q4 2025, six countries; demand-side model with trade association cross-validation
Qualitative Methodology
47 expert interviews, Q4 2025; applied to validate demand model assumptions, identify emerging dynamics, and assess competitive positioning
Report Format
PDF and XLSX data workbook (Word format preview document)
Publisher
Market Minds Advisory
Report Code
MMA-2026-TEC-901
Published
September 2026
Contact
sales@marketmindsadvisory.com | www.marketmindsadvisory.com

Purchase the full Cognitive Systems Spending Market Report (2026 to 2036).

The full report sizes cognitive systems spending across six categories, seven regions, and thirty countries, with forecasts to 2036 under base, bull, and bear cases. It examines why roughly two thirds of initiatives never reach production, how data access and accountability rather than model capability block deployment, and what the shift from innovation to operating budgets means for suppliers. Competitive analysis covers twenty participants evaluated consistently on captured spending, with detailed treatment of delivery capacity and assurance capability. Cost structure, margin architecture, and regional adoption patterns are analysed throughout. Primary research includes 3,800 survey responses and 47 expert interviews.
Six spending categories sized and forecast separately
Twenty participants evaluated on captured spending consistently
Regional budget concentration and delivery capacity across seven geographies
Margin architecture by category and specialist scarcity
Production conversion and measurement coverage benchmarked across adopter portfolios
Data access delay analysed by region and organisational maturity

Built For The People Who Decide

From boardroom strategy to bench-side execution, this report is read cover-to-cover by leaders shaping the next decade of their industry, turning demand scenarios, market dynamics and valuation benchmarks into decisions.
CXOs/ Presidents/ VPs/ Managers
M&A and Corporate Development
Strategy Teams and R&D Heads
Procurement and Product Directors
Regulatory and Compliance Leaders
Investor Relations and Equity Analysts