Market Minds Advisory
Cognitive Network Market

Cognitive Network Market: Cognitive Network Market: Autonomy Functions, Energy Economics and Operator Trust Limits 2026 to 2036

Machine learning applied to four generations of equipment from six vendors, configured by people who all left years ago, produces confident predictions about a system that nobody can fully describe.

Lead Analyst

Published

September 2026

Make Smarter Decisions with Customized Research Insights

Request a free sample report and evaluate market opportunities, growth trends, and competitive dynamics relevant to your business needs.

2025 MARKET VALUE$3.4BMarket Size 2025
2036 FORECAST VALUE$16.8BBase Case , 2026 to 2036
CAGR 2026 TO 203615.6 %Bull 17.0% / Bear 14.3%
INCREMENTAL OPPORTUNITY$12.8BNet 10- year value creation
EXPANSION MULTIPLE4.26x2036 value over 2026 base
Strategic Levers
M&A Pipeline
Regional Outlook
Country Rankings
Competitive Intelligence
Segmental Deep-dive
Call-Us : 91 93563 13602

Executive Snapshot and Market Trajectory.

Operators have been promised autonomous networks for fifteen years and have not received them. The obstacle was never the algorithms. A mobile network is four equipment generations from six vendors, configured by people who left, and no model reasons well about a system nobody alive can fully describe.
The market reaches USD 3.93 billion in 2026 and USD 16.75 billion by 2036, a 4.26 times expansion at 15.6%. Energy optimisation and sleep scheduling grows at 23.4%, half again the market rate of 15.6%, because electricity is 22% of operator operating cost and the saving lands on next month's bill. East Asia holds 32% of platform revenue on network scale, and India grows fastest at 21.4%. Narrow problems pay; general autonomy does not.
Five vendors hold 61% of platform revenue, which is concentrated because the software travels with the equipment. Ericsson, Huawei and Nokia sell autonomy features alongside radio hardware operators have already bought. ZTE and Samsung compete on the same basis in their own strongholds. Independent software firms reach operators through systems integration rather than directly. Owning the radio is what decides most of this, and everybody involved knows it.
Market Definition
This report covers software and platforms applying machine learning to telecommunications network operation: autonomous fault prediction and self-healing, energy optimisation and sleep scheduling, intent-based network configuration, traffic steering and load prediction, security anomaly detection and response, and capacity planning with network digital twins. It excludes radio and transport hardware, spectrum, general network management systems without learning capability, business support systems, and enterprise networking equipment.
Base Year Value
$3.4B in 2025 (MMA Primary Research Dataset, September 2026)
Forecast Period
2026 to 2036, eleven discrete annual values
CAGR
15.6% base case. Bull 17.0%. Bear 14.3%.
Fastest Growth Segment
Energy Optimisation And Sleep Scheduling: 23.4% CAGR
Fastest Growth Country
India: 21.4% CAGR
Fastest Growth Region
South Asia and Pacific: 17.8% CAGR
Largest Region
East Asia: 32% of 2025 global value
Market Leaders
Ericsson, Huawei, Nokia, ZTE and Samsung Networks lead on cognitive network software and platform revenue. Source: MMA Analysis.
Primary Survey
n=3,800 procurement and R&D decision-makers, Q4 2025, six countries
Methodology
Demand-side build-up, cross-validated against public data, 47 expert interviews

Cognitive Network Market Forecast Scenarios

cognitive-network-market-size-forecast-scenario-1789988810343
Between 2020 and 2025 the category compounded at 14.2%, driven by narrow deployments rather than by the general autonomy the industry described. Energy optimisation worked because the objective was measurable and the risk was contained. Broad self-configuring network programmes largely did not, and several operators quietly wrote those programmes down without ever saying so publicly.
The base case holds 15.6% on three mechanisms. Electricity costs remain high enough that a saving of 18% at radio sites pays for the software within a year, which no other application in this category matches. Network densification for 5G has produced site counts that manual operations teams genuinely cannot manage at existing headcount. And open radio architectures create configuration complexity that makes learned optimisation necessary rather than merely attractive.
The bull case at 17.0% assumes operators move above autonomy level three and permit closed-loop configuration changes on live networks, which would open the largest applications. The bear case at 14.3% is a visible autonomous failure on a network carrying emergency traffic, which would set trust back by years and confine spending to advisory tools that only recommend rather than act.

Narrow Problems Pay, General Autonomy Does Not

The gap between what this category promised and what operators deployed comes down to one thing. A production mobile network runs four equipment generations from six vendors, carrying configuration decisions nobody documented and nobody now remembers. Machine learning trained on that produces confident output about a system no engineer can fully describe. Narrow applications with measurable objectives work reliably. General autonomy programmes have repeatedly not.
TOP FIVE CONCENTRATION61%Concentrated among equipment vendors selling software alongside their hardware
NETWORK ENERGY COST SHARE22%Electricity as a proportion of mobile operator operating cost
ACHIEVED AUTONOMY LEVELLevel 3Industry standard rating for typical production network deployments
RADIO SITE ENERGY SAVING18%Measured reduction from carrier sleep scheduling in production
FAULT PREDICTION LEAD TIME40 minutesWarning ahead of degradation on predicted equipment failures
EQUIPMENT GENERATIONS IN SERVICE4Distinct technology generations running simultaneously on a typical network
Energy is where the money actually is. Electricity accounts for around 22% of a mobile operator's operating cost, and the radio access network takes most of it. A base station at three in the morning runs at full power serving very few people. Sleep scheduling that shuts down carriers as traffic falls delivers around 18% site energy reduction, and it appears on the electricity bill the following month.
Trust is the binding constraint on everything else. An operator will readily let a system predict a fault 40 minutes ahead and raise a ticket. Letting that system change configuration on a live network carrying emergency calls is a wholly different decision, and the industry's own autonomy scale acknowledges that almost nobody operates above level three today.
"Every operator I speak to has an autonomous network programme and an energy optimisation project. The programme has a steering committee and a five year roadmap. The project has a number on the electricity bill. Only one of them survives a budget review."
Principal, Telecommunications Network Software and Automation Practice · MMA Technology Practice · September 2026

Market Trends

Energy Savings Fund Everything Else In This Category

Electricity runs around 22% of a mobile operator's operating cost and the radio network consumes most of that, which makes it the only line item large enough to justify autonomy software on its own arithmetic. Carrier sleep scheduling that powers down capacity as traffic falls delivers around 18% site energy reduction in production deployments. The result appears on next month's bill, verified against a meter rather than against a model. Operators fund broader cognitive programmes from savings this application produces, which is why it compounds at 23.4% while general autonomy does not.
Market Impact: Intent configuration compounds at 17.2%

Site Counts Outgrew What Operations Teams Can Manage

Densification for 5G multiplied cell sites at a rate that operations headcount never followed, and the gap keeps widening as millimetre wave and small cell deployments continue. An engineer who could reasonably supervise a few hundred macro sites cannot supervise several thousand mixed ones, and no operator is hiring proportionally. That makes learned fault prediction a staffing necessity rather than an efficiency improvement, with 40 minute warning ahead of degradation converting emergency response into scheduled maintenance. The arithmetic here forced adoption where enthusiasm alone never would have. Necessity rather than enthusiasm drove this adoption.
Market Impact: India compounds at 21.4% annually

Market Opportunities and Growth Drivers

Open Radio Architectures Made Optimisation Genuinely Necessary

Disaggregating radio hardware from software across multiple suppliers produces configuration surfaces far larger than any single vendor's integrated equipment presented, with parameters interacting in ways no specification document predicts. Operators pursuing open architectures for supplier diversity discovered they had also acquired an optimisation problem that manual tuning cannot address at scale. Intent-based configuration compounds at 17.2% on exactly this, letting an engineer specify a target outcome rather than several hundred individual parameters. The complexity was self-inflicted and the software addressing it is now unavoidable. Operators created this problem for themselves and now have to buy the answer.
Market Impact: Deployments capped at level 3

Emerging Market Operators Face The Sharpest Energy Arithmetic

An operator with average revenue per user around a tenth of European levels feels every unit of electricity far more acutely, and grid reliability in many of those markets forces diesel generation at a considerable multiple of grid cost. Indian and African operators run enormous site counts against the thinnest margins in the industry. Energy optimisation delivering 18% site reduction changes the economics of marginal rural sites entirely, which is why India compounds at 21.4%. The application arrived in wealthy markets first and matters far more in poorer ones. Vendor coverage in those markets remains remarkably thin.
Market Impact: Four generations run on 1 network

Market Restraints and Challenges

Operators Will Not Let Software Touch Live Configuration

Typical production deployments sit at autonomy level three, meaning the system recommends and a human approves, and very few operators have moved beyond that. The root cause is that a mobile network carries emergency calls and regulated service obligations, so an autonomous change that degrades coverage is a regulatory event rather than an outage. Commercially this caps the value of every closed-loop product in the category. Mitigation runs through staged trust building on low-risk parameters, extensive shadow-mode operation, and rollback guarantees that most vendors have been slow to engineer properly.
Market Impact: Sleep scheduling delivers 18% saving

Legacy Estate Defeats Models Trained On Clean Data

A production network runs around four equipment generations from six vendors, carrying configuration decisions taken over two decades by engineers who have since left the company. The root cause is that networks are never rebuilt, only extended, so every acquisition and technology transition leaves permanent sediment behind it. Commercially this means models perform far better in vendor demonstrations than in production, and operators have learned to discount the demonstration heavily. Mitigation runs through per-network retraining, longer proof of concept periods, and honest scoping toward problems where the data is actually reliable.
Market Impact: Prediction gives 40 minutes warning
3 additional market trends, 4 additional growth drivers, and 2 additional restraints and challenges are covered in the full report. Contact sales@marketmindsadvisory.com to access the complete intelligence.

Segment CAGR and Growth Architecture

Segmentation follows cognitive network function, since what a system is asked to do determines the data it needs, the risk an operator accepts and the budget funding it. Six functions cover the market: energy optimisation, autonomous fault prediction, intent-based configuration, security anomaly detection, capacity planning with digital twins, and traffic steering. Deployment model is a separate dimension.
cognitive-network-market-market-share-analysis-1789988810904

Energy Optimisation And Sleep Scheduling

Energy optimisation grows at 23.4%, half again the market rate of 15.6%, and it is the only application in this category that pays for itself on arithmetic nobody disputes. Electricity is around 22% of a mobile operator's operating cost and the radio network takes most of it, while a base station at three in the morning runs at full power serving almost nobody. Carrier sleep scheduling delivers around 18% site energy reduction, verified against a meter rather than a model, and it appears on the following month's bill. Operators routinely fund their broader cognitive network programmes from exactly this saving, which tells you something about the rest of the category.
CAGR 23.4%

Autonomous Fault Prediction And Self-Healing

Autonomous fault prediction compounds at 19.8% because site counts outgrew operations headcount and no operator is hiring proportionally. Densification for 5G multiplied cell sites while the engineers supervising them stayed roughly constant in number, which turns prediction into a staffing necessity rather than an efficiency gain. Systems now give around 40 minutes of warning ahead of degradation, converting an emergency call-out into scheduled maintenance during working hours. The self-healing half of the promise remains largely unrealised, since operators at autonomy level three will let software raise a ticket and will not yet let it change anything on a live network. That distinction between predicting and acting defines the whole category today.
CAGR 19.8%
Full segment breakdown across 6 segments available in the complete report.

Regional Architecture and Country Demand Map

East Asia leads at 32% of platform revenue, above the standard band, because Chinese operators run the largest networks on earth and have deployed autonomy at production scale rather than in trials. North America follows at 24% with deeper software capability and considerably more caution.

East Asia

East Asia holds 32% of platform revenue, above the 30% band ceiling, because scale forces the issue here before it forces it anywhere else. China Mobile, China Telecom and China Unicom operate networks with site counts no Western operator approaches, and manual operation at that scale stopped being possible some years ago. Huawei and ZTE sell autonomy features alongside the equipment already installed, which removes the procurement friction independent software faces everywhere. Korean and Japanese operators run dense urban networks where energy and interference optimisation both pay well. Growth at 16.8% sits above the global rate. Production deployment here runs ahead of trials elsewhere. Scale forced the question here long before it forced it elsewhere.
Share: 32% | CAGR: 16.8% (2026 to 2036)

North America

At 24% North America is the second largest market and the most cautious buyer in it. American operators hold deep software capability internally and frequently build rather than buy, which suppresses measured vendor revenue without suppressing actual adoption. Federal Communications Commission service obligations and public safety network requirements make autonomous configuration changes a regulatory question rather than an engineering one, so almost nobody operates above autonomy level three. Ericsson and Nokia hold the equipment positions and Samsung has taken meaningful share. Growth at 15.0% sits below the global rate because caution costs time rather than money here. Regulatory obligation rather than technical doubt explains the caution, and it is a rational position rather than a laggard one.
Share: 24% | CAGR: 15.0% (2026 to 2036)
Regional intelligence for 5 additional markets available in the complete report: Western Europe, South Asia and Pacific, Latin America, Middle East and Africa, Eastern Europe. Contact sales@marketmindsadvisory.com.
cognitive-network-market-country-cagr-analysis-1789988811434

What Operators Will Actually Buy

Operators have heard the autonomous network pitch for fifteen years and stopped believing it some time ago. What they will actually fund is a measurable saving, a staffing problem solved, or a regulatory obligation met. Each one of the four levers below attaches to one of those three. None of them requires the customer to believe a roadmap.

Lead With The Electricity Bill Itself

Electricity is around 22% of a mobile operator's operating cost and carrier sleep scheduling delivers roughly 18% site energy reduction, verified against a meter rather than against a model. That is the only proposition in this category a chief financial officer approves without an argument, because the saving appears on next month's invoice and can be checked. Vendors leading with autonomy roadmaps and maturity levels are selling to an audience that has heard the same pitch for fifteen years. Energy compounds at 23.4% for a reason nobody in this industry should find surprising.
Market Impact: An 18% energy cut funds everything else here

Solve The Headcount Problem Explicitly Instead

Densification multiplied cell sites while operations headcount stayed roughly flat, and no operator intends to hire proportionally. Fault prediction giving around 40 minutes of warning converts an emergency call-out into scheduled maintenance, which is a staffing argument rather than a technology one. Framing the sale around engineers per thousand sites reaches the operations director who owns that constraint, instead of the strategy function that owns the autonomy roadmap and controls considerably less budget. The segment compounds at 19.8% on this arithmetic, and most vendors are still pitching capability instead. The buyer is different and the budget is larger.
Market Impact: Prediction adds a full 40 minutes response time

Engineer Rollback Before Selling Closed Loop

Almost every production deployment sits at autonomy level 3 because operators will not let software change a live network carrying emergency calls without a guaranteed way back. That is a reasonable position and vendors keep treating it as an education problem. Building verified rollback, extensive shadow-mode operation and per-change blast radius limits addresses the actual objection, and it is unglamorous engineering rather than a demonstration feature. The vendor who makes level four defensible reaches applications worth several times the advisory products everybody currently sells. Level three deployments cap the addressable value at a fraction of what closed loop would reach.
Market Impact: Moving past level 3 reaches far larger applications

Sell Hardest Where Margins Are Thinnest

An operator with average revenue per user around a tenth of European levels feels an 18% energy saving far more sharply than a wealthy incumbent does, and grid unreliability across India and Africa forces diesel generation at a considerable multiple of grid cost. Those operators are usually approached last because their software budgets look small. The saving changes whether marginal rural sites are viable at all, which makes it a network planning decision rather than a software purchase. India compounds at 21.4% and the vendor coverage there remains remarkably thin.
Market Impact: India compounds at 21.4% on pure energy arithmetic

Who Controls the Margin Pool

Five vendors hold 61% of cognitive network platform revenue, concentrated because the software travels with the radio equipment rather than being bought separately. Ericsson, Huawei and Nokia sell autonomy features into estates operators already own, which removes procurement friction entirely. ZTE and Samsung Networks compete on the same basis inside their own regional strongholds, where equipment incumbency decides most contests before they begin. All participants are assessed on cognitive network software and platform revenue.
Competition runs on data access more than on modelling capability. A vendor whose equipment generates the telemetry has training data nobody else can obtain at the same fidelity, and operators are reluctant to expose radio-level data to a third party. Independent software firms compete through systems integrators and on multi-vendor estates, which is a genuine niche and a permanently smaller one.

Rankings shift if operators move above autonomy level three, because closed-loop applications favour whoever can guarantee rollback rather than whoever owns the radio. The second pressure comes from operators building internally: several large carriers now employ machine learning teams and treat vendor platforms as one option among several rather than as the obvious choice.
cognitive-network-market-company-positioning-matrix-1789988811964

Competitive Moat and Risk Dimensions

ERICSSON

Moat: Telemetry Access Through Equipment

Ericsson autonomy software reads radio-level telemetry from equipment it built, at a fidelity no third party obtains because operators will not expose that data externally. Training quality follows directly from data quality, so the advantage compounds with every deployment rather than staying fixed. Independent vendors work from aggregated measurements and produce visibly weaker results on the same networks.
ERICSSON

Risk: Multi-Vendor Estate Exposure

Operators pursuing open radio architectures deliberately mix suppliers, which erodes the single-vendor telemetry advantage the software depends on. A platform strongest on its own equipment is weakest exactly where the industry says it is heading. Improving support for competitor hardware helps the software business and undercuts the equipment business funding it.
HUAWEI

Moat: Scale Deployment Learning Base

Huawei autonomy features run across Chinese operator networks with site counts no Western deployment approaches, producing operational learning at a volume competitors cannot match. Problems appearing rarely on a small network appear constantly on a very large one, and the software improves accordingly. That deployment base was built over years and cannot be acquired at any price.
HUAWEI

Risk: Restricted Market Access

Equipment restrictions across North America, much of Western Europe and several allied markets close a substantial share of global spending to the company regardless of product quality. Software travelling with hardware means those restrictions transfer directly to this category. No commercial strategy addresses a decision taken entirely on security policy grounds elsewhere.

Players Tracked

Prominent Players

Ericsson
Huawei
Nokia
ZTE
Samsung Networks

Other Key Players

NEC
Ciena
Juniper Networks
Cisco Systems
Amdocs
Netcracker
Rakuten Symphony
Mavenir
Infovista
Viavi Solutions
EXFO
Nvidia
Intel
HCLTech
Tech Mahindra

Recent Developments

JANUARY 2025

Ericsson Extends Energy Optimisation Across Wider Radio Portfolio

Ericsson extended carrier sleep scheduling and energy optimisation features across additional radio product families, an organic software development rather than an acquisition or partnership. Electricity is around 22% of operator operating cost, and the resulting site energy reduction is measurable on a meter rather than argued from a model.
Signal: The only autonomy application that survives a budget review is the one showing on an invoice.
AUGUST 2024

Nokia Adds Rollback Guarantees To Closed Loop Configuration Tools

Nokia added verified rollback and blast radius limits to its closed-loop network configuration capability, an organic engineering development rather than any transaction. Operators sitting at autonomy level three object to autonomous change on live networks for reasons of regulated service obligation rather than any lack of technical understanding.
Signal: Addressing the objection that operators actually raise beats explaining why that particular objection should not exist.
MAY 2025

Rakuten Symphony Targets Multi-Vendor Estates With Optimisation Platform

Rakuten Symphony extended its network automation platform toward multi-vendor radio estates, an organic product development rather than a joint venture or merger. Open radio architectures create configuration surfaces larger than any single supplier's integrated equipment presented, which is a problem the equipment vendors are least motivated to solve well.
Signal: Independent software finds its opening exactly where operators have deliberately refused to standardise on one supplier.

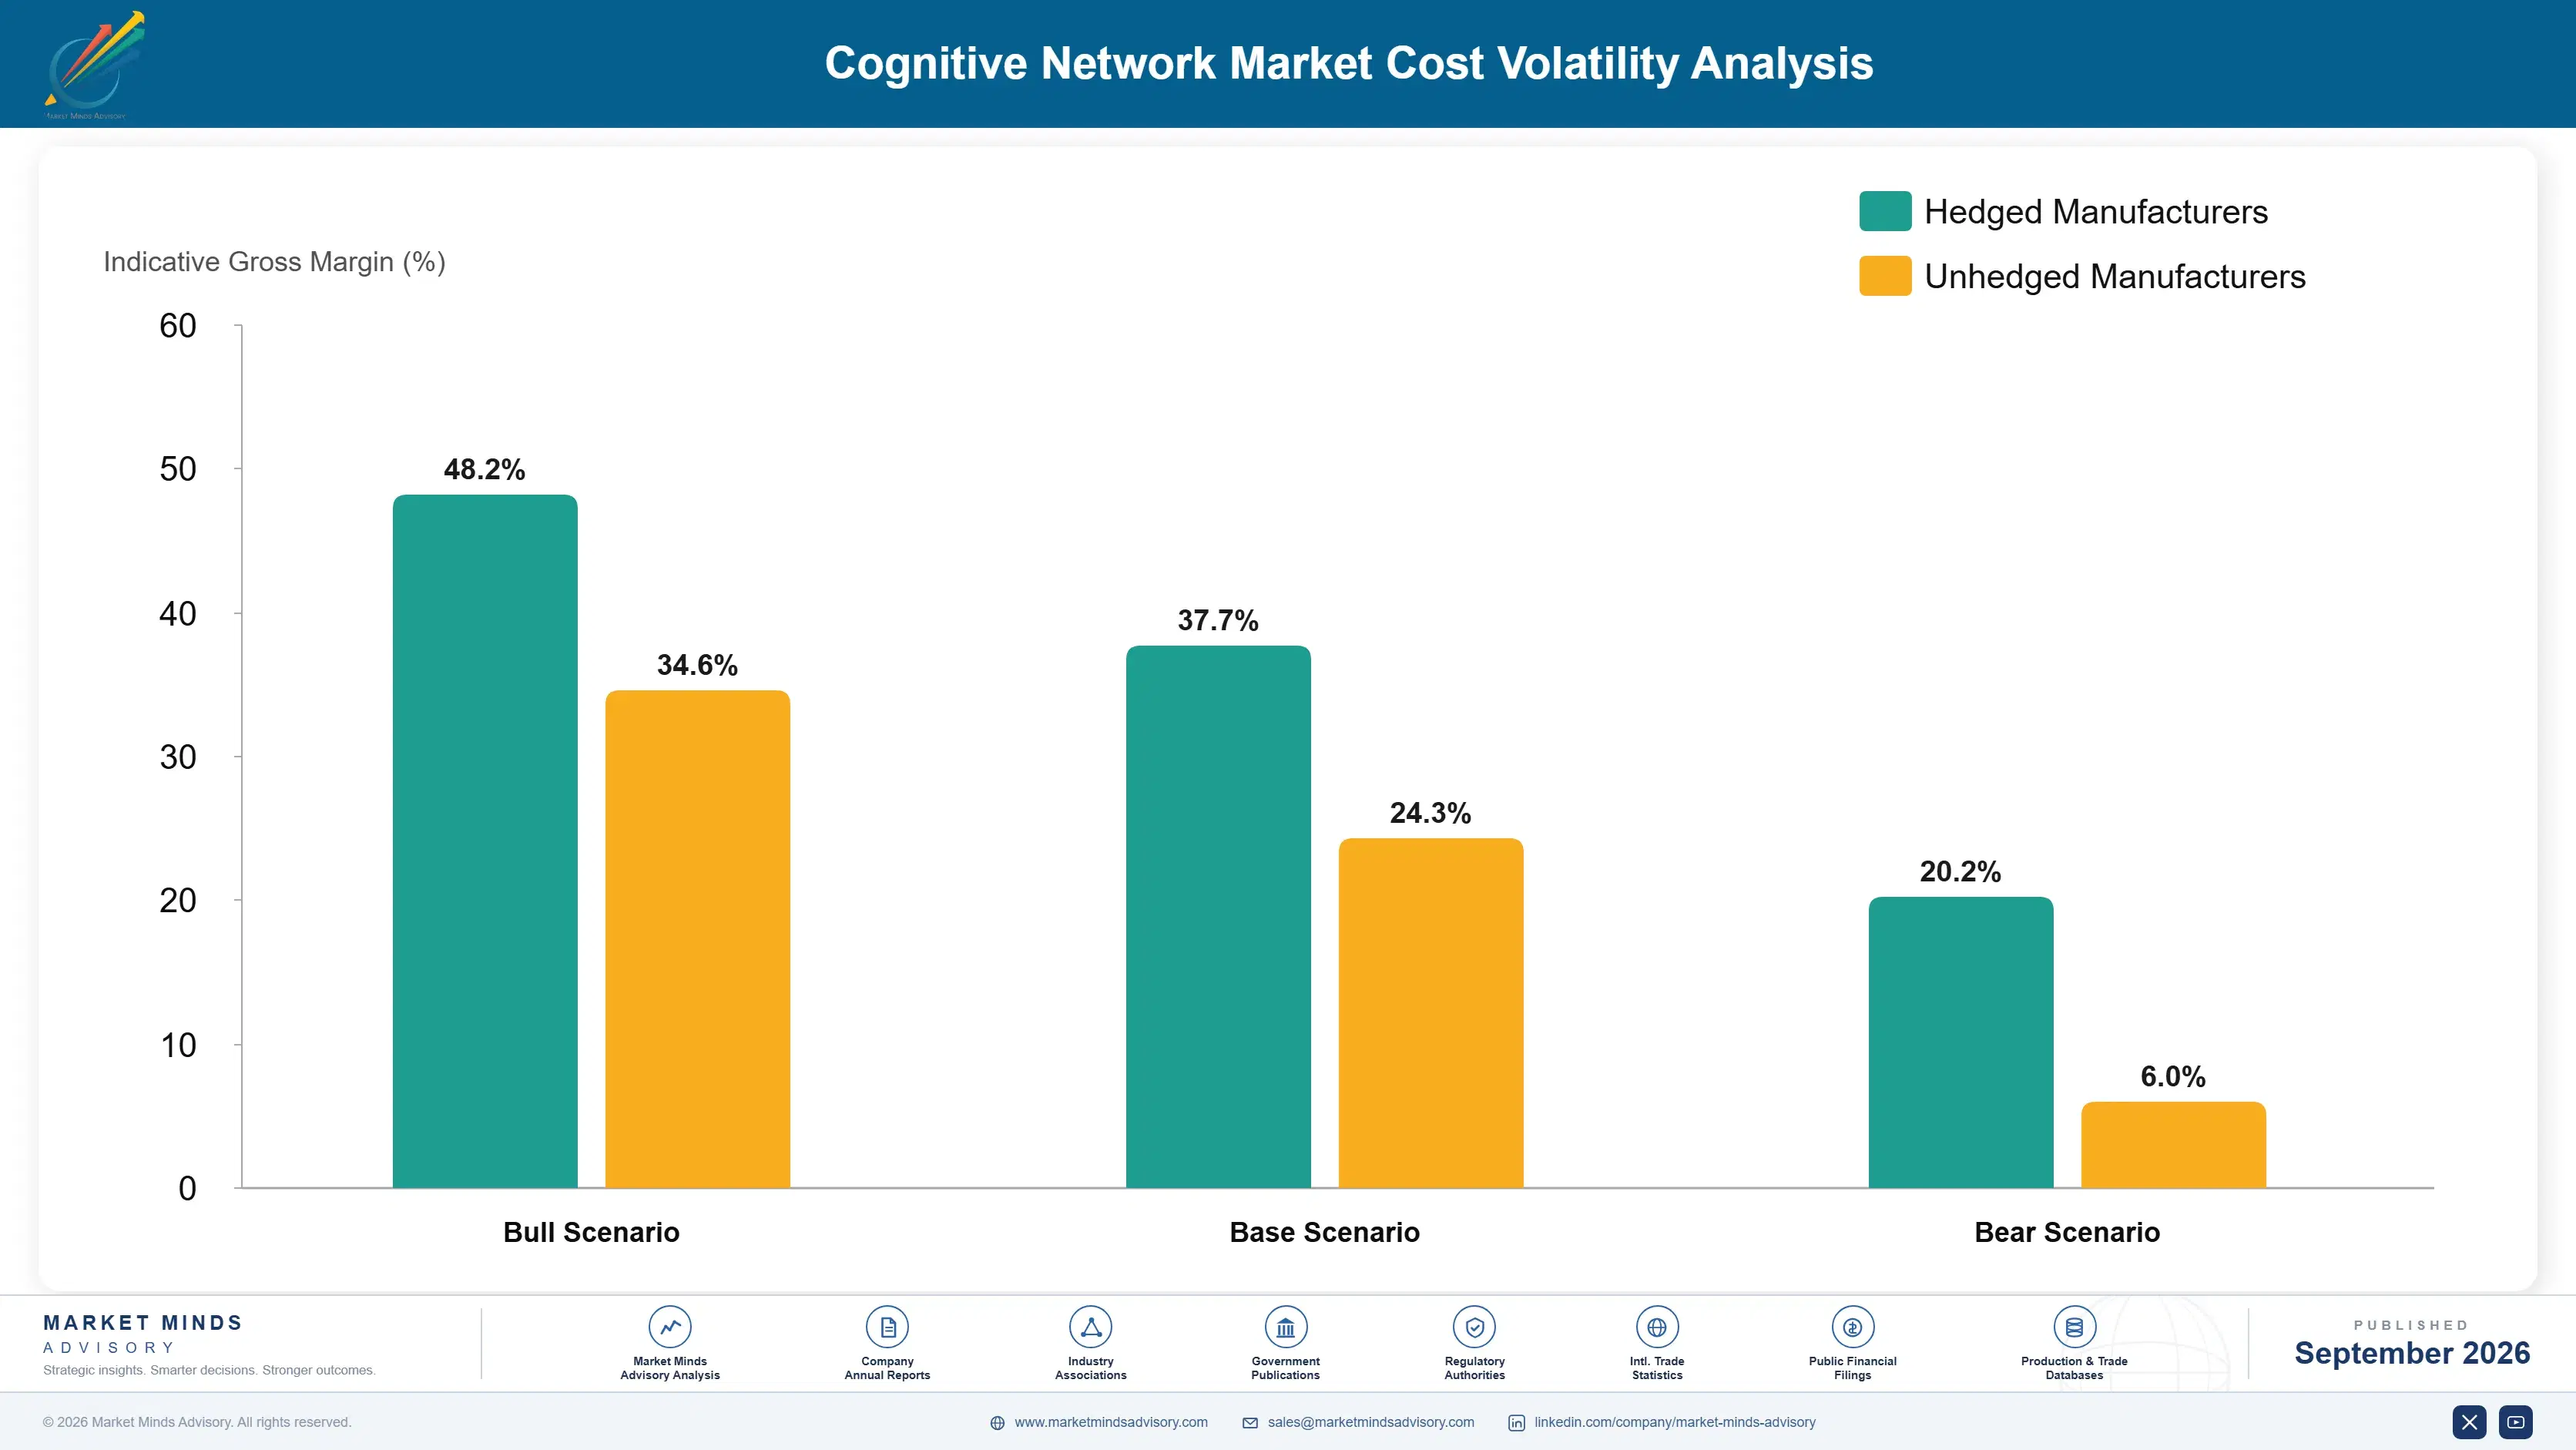
What This Software Costs To Deliver

Engineering salaries account for roughly 52% of platform cost, weighted toward people who understand radio networks and machine learning together, which is a scarce combination in every market. Per-network model training and tuning carries around 20%, because no model transfers cleanly between operators. Compute for training absorbs about 12%, and field trial support takes most of the balance.
Ericsson Annual Report 2024 and Nokia Annual Report 2024 both record research and development concentrated increasingly on software rather than on radio hardware, with talent availability named as a constraint. Compensation for engineers combining telecommunications and machine learning expertise rose sharply through 2023 and 2024 as technology employers competed for the same people. Vendors on multi-year operator contracts absorbed that directly, since a contract priced in 2022 does not reprice when salaries move.

The competitive disadvantage mechanism is per-network tuning cost rather than any development expense. Every operator estate carries different equipment generations, different configuration history and different data quality, so deployment is a project rather than an installation. A vendor with a hundred customers pays that cost a hundred times, which caps how far this category scales like software and explains why margins sit below what platform businesses normally earn.
cognitive-network-market-cost-volatility-analysis-1789988812162

Standardise Data Ingestion Before Standardising Models

Per-network tuning runs around 20% of platform cost and most of that effort goes into reconciling telemetry formats across equipment generations rather than into modelling. A standard ingestion layer that normalises input from four generations and six vendors converts a bespoke project into a configuration exercise. Vendors invest in model architecture while the actual cost sits one layer below.

Train Once On Pooled Data Across Operators

Training compute runs about 12% of platform cost, and vendors frequently repeat similar training for each customer because contracts prohibit pooling telemetry. Negotiating anonymised pooling rights at contract signature, with clear boundaries, allows a shared base model that per-network tuning then adapts. Most operators will agree to this and are simply never asked at the right moment.

Recruit Radio Engineers And Teach Them Modelling

Engineering salaries run about 52% of platform cost and the scarce profile combines radio network knowledge with machine learning skill. Recruiting experienced radio engineers and training them in modelling is considerably cheaper and faster than competing for data scientists against technology employers paying far more. The domain knowledge is the part that genuinely cannot be taught quickly.

Portfolio Architecture for Margin Defence

Margin architecture separates on how measurable the outcome is and how much risk the operator accepts. Traffic steering and capacity planning earn least, competing against internal engineering teams that could build comparable tools. Security anomaly detection and digital twins sit in the middle. Energy optimisation, fault prediction and intent-based configuration earn most, because each attaches to a budget line an operator can point at directly.
The volume versus premium tension is about who inside the operator signs. Energy optimisation is bought by finance against a measurable saving and prices well because the return is provable. General autonomy platforms are bought by strategy functions against a roadmap and get cut whenever budgets tighten, which they periodically do. Vendors building for the roadmap buyer keep discovering the finance buyer was the durable one.

High-value pools concentrate in energy optimisation and in genuinely trustworthy closed-loop configuration, and neither is reached by improving model accuracy. Energy requires deep integration with radio hardware behaviour that only equipment vendors currently have. Closed loop requires verified rollback and blast radius engineering that nobody has finished. Both are engineering commitments rather than analytical ones.

Volume / Commodity-Adjacent

Traffic steering, load prediction and capacity planning tools, competing against internal engineering teams at large operators who could build equivalents. The ten point spread separates vendors bundling with equipment from those selling software into multi-vendor estates independently.
Gross Margin: 40% to 50%

Premium / Certified

Security anomaly detection and network digital twins sold on capability operators cannot easily assemble internally. The twelve point spread tracks how much of a vendor's book sits inside multi-year managed arrangements rather than in annually renegotiated licences bought project by project.
Gross Margin: 56% to 68%

Sustainability / Regulatory / Next-Generation

Energy optimisation, fault prediction and intent-based configuration, each attached to a budget line an operator can point at and measure. The twelve point spread reflects depth of radio hardware integration, which equipment vendors hold and independents largely do not.
Gross Margin: 70% to 82%
cognitive-network-market-portfolio-architecture-1789988812663

High-value Sub-segments and Strategic Watch-out

Energy Optimisation And Sleep Scheduling

Grows at 23.4% because electricity is 22% of operator operating cost and sleep scheduling cuts site energy by around 18%. The twelve point spread reflects hardware integration depth. The saving appears on next month's bill, verified against a meter rather than a model. Nothing else here is that provable.
Gross Margin: 70% to 82%

Autonomous Fault Prediction And Self-Healing

Grows at 19.8% because densification multiplied cell sites while operations headcount stayed flat and nobody intends to hire proportionally. The twelve point spread reflects telemetry access. Prediction gives 40 minutes warning, though self-healing remains blocked at autonomy level three. Prediction sells; self-healing waits on trust.
Gross Margin: 70% to 82%

Intent-Based Network Configuration

Grows at 17.2% because open radio architectures created configuration surfaces manual tuning cannot address at any realistic scale. The twelve point spread reflects multi-vendor support depth. The complexity was self-inflicted and the software addressing it is now unavoidable. Equipment vendors are least motivated to solve it well across rival hardware.
Gross Margin: 70% to 82%

Traffic Steering And Load Prediction

Grows at 9.8%, slowest of the six functions, because large operators employ engineers who could build comparable tools and frequently do exactly that. The ten point spread separates bundled offerings from independent ones. Differentiation here is genuinely difficult to establish or defend. Large operators build this themselves.
Gross Margin: 40% to 50%

How These Deployments Persist

The annuity is the trained model rather than the licence. A model tuned against one operator's four equipment generations and two decades of configuration history performs there and nowhere else, so replacing the vendor means repeating the tuning project from the beginning. That is months of work and a spell of degraded performance nobody wants to schedule. The switching cost is technical, which makes it more durable than any contract term.
Depth varies by what the software is permitted to touch. An energy optimisation deployment controlling carrier power across thousands of sites is embedded in daily operation and effectively permanent. A fault prediction system feeding tickets into an existing workflow is nearly as sticky. An advisory dashboard that recommends configuration changes nobody implements is not embedded in anything, and operators drop those without noticing much.

The buyer moved from strategy to operations to finance across roughly five years, and vendor organisations followed slowly. Strategy funded autonomy roadmaps that periodic budget reviews eliminated. Operations funds tools that solve a headcount constraint. Finance funds an energy saving it can verify on a meter. Vendors still presenting maturity models address the buyer who lost that argument.
cognitive-network-market-end-use-penetration-index-1789988813154

What This Category Actually Sells

These are among the four positions where our research anticipates prominent divergence between winners and laggards over the coming forecast period. Each is grounded in the demand model, the regulatory perimeter, and the announced capacity pipeline.
01 / ENERGY PROPOSITION LEADERSHIP

Lead With The Meter, Not The Roadmap

Electricity accounts for around 22% of a mobile operator's operating cost and carrier sleep scheduling delivers roughly 18% site energy reduction, verified against a physical meter rather than argued from a model. That is the only proposition in this category a chief financial officer approves without extended argument, because the saving appears on next month's invoice and anybody can check it. Vendors leading with autonomy roadmaps and maturity levels are addressing an audience that has heard precisely the same pitch for fifteen years.
02 / OPERATIONS BUYER TARGETING

Sell Engineers Per Thousand Sites

Densification for 5G multiplied cell sites while operations headcount stayed roughly flat, and no operator anywhere intends to hire in proportion to the site estate it now runs. Fault prediction giving around 40 minutes of warning converts an emergency call-out into scheduled maintenance during working hours, which is fundamentally a staffing argument rather than a technology one. Framing the sale that way reaches the operations director who owns the constraint instead of reaching a strategy function that controls considerably less budget than that.
03 / ROLLBACK ENGINEERING PRIORITY

Earn Level Four Before Selling It

Almost every production deployment sits at autonomy level three, because operators will not permit software to change a live network carrying emergency calls without a guaranteed way back to the previous state. That position is entirely reasonable and vendors keep mistaking it for a customer education problem. Building verified rollback, extensive shadow-mode operation and per-change blast radius limits addresses the actual objection, and it is unglamorous engineering work rather than any demonstration feature, though the vendor making level four defensible reaches far larger applications than anybody currently sells.
04 / THIN MARGIN MARKET COVERAGE

Chase The Operators Everybody Approaches Last

An operator with average revenue per user near a tenth of European levels feels an 18% energy saving far more sharply than any wealthy incumbent does, and grid unreliability across India and Africa forces diesel generation at a considerable multiple of grid cost. Those operators get approached last because their software budgets look small on a territory plan. The saving decides whether marginal rural sites remain viable, and India compounds at 21.4% with vendor coverage there remaining remarkably thin indeed.

Engagement Snapshot From the Field

A live engagement with an industry participant carrying material or product regulatory and market exposure ahead of a defining policy shift, showing how our research translates into a defensible multi-year portfolio strategy.
MARKET MINDS ADVISORY · CLIENT ENGAGEMENT SUMMARY
Cognitive Network Producer Strategic Portfolio Review and Transition Roadmap 2026·Investment Scenario on Cognitive Network Exposure Evaluation 2025-26
CLIENT PROFILE
A mobile operator running roughly 62,000 cell sites across a large emerging market, with average revenue per user well below European levels and around a third of rural sites dependent on diesel generation. An autonomous network programme had been running for two years with a steering committee, a maturity roadmap and no measurable result anybody could point to. Board patience was visibly running out.
STRATEGIC CHALLENGE
The strategy function defended the autonomy programme on long-term positioning grounds and wanted continued funding. Operations wanted fault prediction because site counts had outgrown the engineering team years earlier. Finance wanted the whole thing stopped. Nobody had costed the energy application separately, and it had been buried inside the wider programme as one workstream among eleven.
MMA APPROACH
MMA separated the programme into individual applications and modelled each against a measurable operator outcome rather than against an autonomy maturity level. We priced energy optimisation against actual site electricity and diesel consumption, and fault prediction against engineers per thousand sites. The work drew on 47 expert interviews conducted in Q4 2025 with vendors, operators and network operations specialists across comparable markets.
KEY FINDINGS
  1. Energy optimisation alone would deliver roughly 18% site energy reduction and pay back inside 11 months, which no other workstream in the programme approached.
  2. Diesel dependent rural sites showed savings about 3 times the grid connected average, and the programme had not distinguished between them at all.
  3. Fault prediction addressed a genuine constraint, since the operator ran 1 engineer per 340 sites against a comparable market average near half that.
  4. Seven of the eleven workstreams still had no measurable outcome defined at all after two full years of funding (client-reported, unverified by MMA).
CLIENT PROFILE
A mobile operator running roughly 62,000 cell sites across a large emerging market, with average revenue per user well below European levels and around a third of rural sites dependent on diesel generation. An autonomous network programme had been running for two years with a steering committee, a maturity roadmap and no measurable result anybody could point to. Board patience was visibly running out.
STRATEGIC CHALLENGE
The strategy function defended the autonomy programme on long-term positioning grounds and wanted continued funding. Operations wanted fault prediction because site counts had outgrown the engineering team years earlier. Finance wanted the whole thing stopped. Nobody had costed the energy application separately, and it had been buried inside the wider programme as one workstream among eleven.
MMA APPROACH
MMA separated the programme into individual applications and modelled each against a measurable operator outcome rather than against an autonomy maturity level. We priced energy optimisation against actual site electricity and diesel consumption, and fault prediction against engineers per thousand sites. The work drew on 47 expert interviews conducted in Q4 2025 with vendors, operators and network operations specialists across comparable markets.
KEY FINDINGS
  1. Energy optimisation alone would deliver roughly 18% site energy reduction and pay back inside 11 months, which no other workstream in the programme approached.
  2. Diesel dependent rural sites showed savings about 3 times the grid connected average, and the programme had not distinguished between them at all.
  3. Fault prediction addressed a genuine constraint, since the operator ran 1 engineer per 340 sites against a comparable market average near half that.
  4. Seven of the eleven workstreams still had no measurable outcome defined at all after two full years of funding (client-reported, unverified by MMA).
RECOMMENDED STRATEGY
Phase 1: Phase one: fund energy optimisation as a standalone project measured on the electricity bill, and stop reporting it as a maturity level. Phase 2: Phase two: deploy fault prediction next, justified explicitly on engineers per thousand sites rather than on any autonomy positioning at all. Phase 3: Phase three: close the seven workstreams with no defined outcome and redirect the funding to the two applications that pay.
OUTCOME
The operator refocused the programme on two applications and closed the rest (client-reported, unverified by MMA). Energy savings tracked close to the modelled 18% and paid back within the year, with diesel sites performing considerably better. Automation investment is now approved against a measurable operator outcome rather than a maturity level, which is the change that outlasted the engagement.

Frequently Asked Questions

Foundational context covering the market sizes, CAGR, scope, country, region and competition that inform every finding below. This section is provided to cover basics and most often pre-purchase conversations, answered from the MMA Primary Research Dataset.

What is the current size of the Cognitive Network Market?

Global value reaches USD 3.93 billion in 2026, measured as cognitive network software and platform revenue across all six functions. The 2025 base is USD 3.4 billion.

How large will the Cognitive Network Market be by 2036?

Platform revenue reaches USD 16.75 billion by 2036, an increase of USD 12.82 billion over the forecast period. That represents 4.26 times expansion from the 2026 base.

What is the CAGR for the Cognitive Network Market 2026 to 2036?

The base case runs at 15.6% annually, with a bull case at 17.0% if operators permit closed-loop configuration changes and a bear case at 14.3% if a visible autonomous failure sets trust back.

Which segment is growing fastest?

Energy optimisation and sleep scheduling grows at 23.4%, half again the market rate of 15.6%. Electricity is around 22% of operator operating cost and sleep scheduling cuts site energy by about 18%.

Who are the major companies in the Cognitive Network Market?

Ericsson, Huawei, Nokia, ZTE and Samsung Networks lead on platform revenue, together holding 61%. NEC, Rakuten Symphony and Mavenir hold smaller positions in multi-vendor estates.

Which country is growing fastest?

India leads at 21.4%, because enormous site counts against the lowest average revenue per user make every unit of electricity matter more. Indonesia and Brazil follow on similar arithmetic.

Report Segmentation Architecture

The full report scope spans multiple orthogonal segmentation dimensions, with cross-tabulated demand data provided for each dimension pair. Coverage extends further to regional breakdowns, trend trajectories, and the competitive detail needed to support segment-level decision-making.

By Cognitive Network Function

  • Energy Optimisation And Sleep Scheduling
  • Autonomous Fault Prediction And Self-Healing
  • Intent-Based Network Configuration
  • Security Anomaly Detection And Response
  • Capacity Planning And Network Digital Twins
  • Traffic Steering And Load Prediction

By End-Use Industry

  • Mobile Network Operators
  • Fixed And Broadband Carriers
  • Cable And Converged Operators
  • Tower And Neutral Host Companies
  • Private Enterprise Networks
  • Satellite And Non-Terrestrial Operators

By Commercial Dimension

  • Equipment Vendor Bundled Supply
  • Direct Software Licensing
  • Systems Integrator Delivery
  • Managed Automation Services
  • Outcome Based Energy Contracts
  • Operator Internal Build Substitution

By Region

  • North America
  • Western Europe
  • East Asia
  • South Asia and Pacific
  • Latin America
  • Middle East and Africa
  • Eastern Europe

Scope, Methodology, and Coverage

Every figure in this report is reproducible from documented input assumptions. The scope below maps the historical period, the forecast horizon, the segmentation dimensions, and the countries covered, alongside the underlying primary and qualitative methodology.
Historical Period
2020 to 2025
Forecast Period
2026 to 2036
Base Year
2025 (USD billions; MMA Primary Research Dataset, September 2026)
Market Definition
This report covers software and platforms applying machine learning to telecommunications network operation: autonomous fault prediction and self-healing, energy optimisation and sleep scheduling, intent-based network configuration, traffic steering and load prediction, security anomaly detection and response, and capacity planning with network digital twins. It excludes radio and transport hardware, spectrum, general network management systems without learning capability, business support systems, and enterprise networking equipment.
Quantitative Units
USD millions, cognitive network software and platform revenue basis; managed cell sites; site energy reduction as a percentage; fault prediction lead time in minutes; autonomy level on the industry standard scale.
Segmentation Dimensions
Cognitive network function; operator type; commercial delivery model; geography across seven regions.
Regions Covered
North America, Western Europe, East Asia, South Asia and Pacific, Latin America, Middle East and Africa, Eastern Europe
Countries Covered
China, Japan, South Korea, India, Indonesia, Australia, United States, Canada, Mexico, Brazil, Germany, France, United Kingdom, Spain, Italy, Poland, Czechia, Saudi Arabia, United Arab Emirates, Nigeria.
Key Companies Profiled
Ericsson, Huawei, Nokia, ZTE, Samsung Networks, NEC, Ciena, Juniper Networks, Cisco Systems, Amdocs, Netcracker, Rakuten Symphony, Mavenir, Infovista, Viavi Solutions.
Quantitative Methodology
Primary survey, n=3,800 respondents, Q4 2025, six countries; demand-side model with trade association cross-validation
Qualitative Methodology
47 expert interviews, Q4 2025; applied to validate demand model assumptions, identify emerging dynamics, and assess competitive positioning
Report Format
PDF and XLSX data workbook (Word format preview document)
Publisher
Market Minds Advisory
Report Code
MMA-2026-TEC-481
Published
September 2026
Contact
sales@marketmindsadvisory.com | www.marketmindsadvisory.com

Purchase the full Cognitive Network Market Report (2026 to 2036).

This report sizes the global cognitive network market from 2026 to 2036 across six autonomy functions, six operator types and seven regions. It explains why energy optimisation is the only application that reliably survives a budget review, how autonomy level three caps the value of every closed-loop product, and why four equipment generations from six vendors defeat models that perform well in demonstrations. Cost composition is sourced to company annual reports, with per-network tuning analysed as the constraint on scaling. Regional analysis explains why East Asia leads at 32% while India grows at 21.4%. Competitive assessment covers 20 named vendors with four revenue lever analyses.
Six autonomy functions sized through to 2036
Energy economics modelled as the decisive purchase argument
Per-network tuning cost analysed from company filings
Twenty named vendors assessed on platform revenue
Four revenue levers with quantified commercial impact
Anonymised emerging market operator prioritisation engagement included

Built For The People Who Decide

From boardroom strategy to bench-side execution, this report is read cover-to-cover by leaders shaping the next decade of their industry, turning demand scenarios, market dynamics and valuation benchmarks into decisions.
CXOs/ Presidents/ VPs/ Managers
M&A and Corporate Development
Strategy Teams and R&D Heads
Procurement and Product Directors
Regulatory and Compliance Leaders
Investor Relations and Equity Analysts