Market Minds Advisory
Cobalt Mining Market

Cobalt Mining Market: Refining Capacity as the Real Value Concentration Point

Battery precursor manufacturers now specify traceable supply chains ahead of tightening responsible sourcing regulation, Chinese refiners expand cobalt sulfate capacity to meet cathode demand, and miners without ESG-certified operations lose multi-year offtake agreements outright.

Lead Analyst

David Horsley

Published

September 2026

Make Smarter Decisions with Customized Research Insights

Request a free sample report and evaluate market opportunities, growth trends, and competitive dynamics relevant to your business needs.

2025 MARKET VALUE$13.5BMarket Size 2025
2036 FORECAST VALUE$33.1BBase Case , 2026 to 2036
CAGR 2026 TO 20368.5 %Bull 9.8% / Bear 7.2%
INCREMENTAL OPPORTUNITY$18.5BNet 10- year value creation
EXPANSION MULTIPLE2.26x2036 value over 2026 base
Strategic Levers
M&A Pipeline
Regional Outlook
Country Rankings
Competitive Intelligence
Segmental Deep-dive
Call-Us : 91 93563 13602

Executive Snapshot and Market Trajectory

Battery manufacturers increasingly treat traceable sourcing documentation as the deciding purchasing factor rather than delivered price alone, since certified responsible sourcing data now determines which cobalt suppliers actually qualify for automotive battery platforms across most major manufacturers simultaneously and without costly requalification delay across every affected supply relationship.
Cobalt recycling and secondary recovery leads growth at 13.5%, roughly 1.59 times the overall rate, as battery end-of-life volumes expand and sustainability sourcing pressure pushes manufacturers toward recovered material that virgin mining alone cannot satisfy across every duty cycle. East Asia now holds the largest regional share at 29%, driven by China's dominant cobalt refining and battery precursor manufacturing capacity despite raw ore extraction concentrating elsewhere across the value chain and mining geography entirely.
Competitive intensity stays elevated at 52% held by five suppliers, since capital-intensive mining infrastructure and geological reserve concentration fragment share less than most other commodity categories, concentrating supply around a handful of integrated miners rather than dozens of regional operators competing on price alone. Buyers increasingly select suppliers on documented supply chain traceability rather than unit price alone across most major procurement decisions.
Market Definition
This report covers the global cobalt mining market, spanning extraction, byproduct recovery, refining, and recycled secondary recovery of cobalt across mining, industrial, and battery end-use applications. It excludes downstream battery cell manufacturing and finished battery products.
Base Year Value
$13.5B in 2025 (MMA Primary Research Dataset, August 2026)
Forecast Period
2026 to 2036, eleven discrete annual values
CAGR
8.5% base case. Bull 9.8%. Bear 7.2%.
Fastest Growth Segment
Cobalt Recycling and Secondary Recovery: 13.5% CAGR
Fastest Growth Country
China: 9.9% CAGR
Fastest Growth Region
South Asia and Pacific: 10.5% CAGR
Largest Region
East Asia: 29% of 2025 global value
Market Leaders
Glencore, CMOC Group, Eurasian Resources Group, Zhejiang Huayou Cobalt, Vale. Source: MMA Analysis, July 2026.
Primary Survey
n=3,800 procurement and R&D decision-makers, Q4 2025, six countries
Methodology
Demand-side build-up, cross-validated against public data, 47 expert interviews

Cobalt Mining Market Forecast Scenarios

cobalt-mining-market-size-forecast-scenario-1787302833559
Between 2020 and 2025 the market grew at an estimated 7.6% annually, as electric vehicle production scaling and battery precursor demand pushed refiners toward expanded cobalt sourcing faster than the industry's typical multi-year capacity cycle would otherwise dictate across most major battery manufacturing markets worldwide, a pace that held steady even through significant commodity price volatility across most sourcing regions.
Three mechanisms carry the base case to 8.5%. First, electric vehicle production keeps expanding globally, and every new battery platform requires certified cobalt supply for cathode precursor formulation across every affected vehicle segment. Second, battery recycling infrastructure keeps expanding as end-of-life vehicle volumes grow, adding secondary recovery capacity that supplements virgin mining. Third, responsible sourcing certification keeps pushing manufacturers toward traceable supply chains as regulatory scrutiny of artisanal mining intensifies.
The bull case at 9.8% assumes accelerating electric vehicle production and battery demand across additional major markets pulls forward cobalt sourcing faster than currently planned by most manufacturers. The bear case at 7.2% assumes budget-constrained battery capital programs delay planned capacity expansion, slowing the pace of new cobalt demand growth across affected applications and their broader capital budgets.

Refining Capacity Concentration Reshapes Cobalt Value Distribution

Cobalt mining sits at an unusual point in the critical minerals landscape: physical extraction concentrates heavily in one country, yet the commercial value captured downstream flows mostly through refiners thousands of miles away. The Democratic Republic of Congo produces roughly seventy percent of mined tonnage, but Chinese refiners convert most of that ore into battery-grade sulfate, capturing the pricing power that raw extraction alone cannot provide.
MARKET CONCENTRATION52%Top five refiners hold more than half global supply
AVERAGE SELLING PRICE$33,500/tonneReflects battery-grade cobalt sulfate contract pricing across major markets
TOP PRODUCER SHARE70%One country dominates global mined tonnage by a wide margin
REFINING UTILIZATION RATE84%Chinese refiners run near full operating capacity currently
EXPORT TRADE INTENSITY78%Most mined ore crosses borders before final refining stages
FEEDSTOCK COST SHARE58%Raw ore purchases dominate refiner production cost structures
Demand now splits along two distinct tracks. Battery precursor manufacturers need certified, traceable material for automotive platforms, while industrial alloy and superalloy buyers care primarily about delivered tonnage and price stability. These tracks are starting to command genuinely different premiums, since responsible sourcing documentation adds real cost that only the battery-grade segment consistently absorbs without resistance across nearly every qualified supply relationship.
Supply discipline remains tight because new mine development takes years to permit and finance, while recycling infrastructure is still scaling toward meaningful volume. That gap keeps price volatility elevated and rewards refiners who secured long-term ore offtake early. Traceability requirements are reshaping supplier qualification faster than most participants expected, pushing artisanal-linked material toward informal channels that formal buyers increasingly avoid entirely across most major markets.
"Refining capacity, not mine ownership, decides who actually captures cobalt's margin today. Miners without downstream integration are increasingly just tonnage suppliers to someone else's chemistry."
Director, Critical Minerals and Battery Supply Chain Practice · MMA Energy / Cri

Market Trends

Battery Manufacturers Mandate Traceable Cobalt Sourcing

Automotive battery manufacturers now build supply chain traceability requirements directly into cobalt procurement contracts, requiring mine-to-cathode documentation before a supplier even qualifies for evaluation. This shift accelerated after several major automakers committed to fully traceable cobalt across their battery supply chains by 2027, pushing refiners to invest heavily in chain-of-custody systems that track material from artisanal-free mine sites through every processing stage. Suppliers lacking certification are being dropped from qualified vendor lists even when their delivered price beats certified competitors, since automakers treat documentation gaps as unacceptable reputational risk rather than a negotiable cost variable in the sourcing decision.
Market Impact: Precursor demand adds 4.2 GWh yearl

Cobalt-Free Chemistries Gain Share in Entry Vehicle Segments

Lithium iron phosphate battery chemistry now dominates entry-level and mid-range electric vehicle platforms across China and increasingly in other markets, eliminating cobalt content entirely from a meaningful share of new vehicle production. This trend directly caps demand growth in the vehicle segment that once drove the majority of cobalt consumption, forcing suppliers to lean harder on premium long-range and performance vehicle platforms where nickel-rich chemistries still require cobalt for thermal stability and cycle life. Roughly forty percent of new electric vehicles now use cobalt-free chemistry, a share that keeps climbing each year as cost stays the dominant purchasing factor.
Market Impact: Grid storage adds 8 GWh yearly

Market Opportunities and Growth Drivers

Electric Vehicle Production Scales Cathode Precursor Demand

Global electric vehicle production keeps expanding across nearly every major auto market, and nickel-rich cathode chemistries used in premium and long-range platforms still require cobalt for thermal stability even as cheaper chemistries gain ground elsewhere. Battery manufacturers are locking in multi-year cobalt sulfate supply agreements well ahead of production ramp, since precursor qualification and certification take twelve to eighteen months and cannot be rushed once a platform nears launch. Automakers targeting premium and commercial vehicle segments continue specifying nickel-cobalt-manganese chemistry precisely because energy density and range still outweigh the cost premium in these vehicle categories.
Market Impact: Unverified exports still near 15-20

Grid-Scale Battery Storage Deployment Adds New Demand Channel

Utility-scale battery storage installations are emerging as a genuinely new cobalt demand channel, distinct from the automotive market that has historically dominated consumption. Grid operators deploying long-duration storage increasingly favor chemistries with proven cycle life and thermal stability under continuous charge and discharge, which keeps cobalt-containing formulations relevant even as some grid applications shift toward iron phosphate alternatives. Corporate renewable energy commitments are accelerating storage buildout well beyond prior utility planning cycles, and developers increasingly favor multi-year supply contracts that lock in cobalt sulfate volumes ahead of construction schedules to avoid procurement delays.
Market Impact: Prices swung over 50% yearly

Market Restraints and Challenges

Artisanal Mining Links Create Sourcing and Reputational Risk

A meaningful share of Congolese cobalt still originates from artisanal mining that is difficult to fully separate from formal industrial supply chains once ore reaches regional trading depots. The root cause is geological: artisanal deposits often sit adjacent to industrial concessions, and informal traders blend material before it reaches export channels. Buyers face real reputational and legal exposure when downstream customers discover unverified material in their supply chain, occasionally triggering costly recalls. Major refiners now invest in blockchain-based chain-of-custody systems and third-party mine audits to isolate verified tonnage, though full segregation across the supply base remains years away.
Market Impact: Over 25 GWh now requires certificat

Price Volatility Discourages Long-Term Mine Investment

Cobalt prices have swung by more than fifty percent within single calendar years on multiple occasions over the past decade, driven by the market's relatively thin trading volume and its dependence on byproduct output from copper and nickel operations that do not adjust output based on cobalt pricing alone. This volatility discourages banks and private equity investors from financing standalone cobalt projects, since project economics can swing from attractive to unviable within a single financing cycle. Producers are increasingly pursuing offtake-backed project financing and long-term price floor agreements with battery manufacturers to secure capital despite unpredictable pricing.
Market Impact: 40% of new EVs skip cobalt
3 additional market trends, 4 additional growth drivers, and 3 additional restraints and challenges are covered in the full report. Contact sales@marketmindsadvisory.com to access the complete intelligence.

Segment CAGR and Growth Architecture

Cobalt supply splits by mining and production pathway rather than end-use, since the same tonnage serves battery, alloy, and industrial chemical buyers regardless of origin. Six segments span artisanal extraction, large-scale primary mining, byproduct recovery from nickel and copper operations, refining services, and recycling, each carrying a genuinely distinct cost structure and growth trajectory.
cobalt-mining-market-market-share-analysis-1787302834099

Cobalt Recycling and Secondary Recovery

Cobalt recycling and secondary recovery is expanding faster than any other segment as electric vehicle battery packs from the earliest large-scale EV cohorts begin reaching end of life in meaningful volume. Recyclers recover cobalt from spent lithium-ion cells through hydrometallurgical processes now achieving recovery rates exceeding ninety percent, producing material that qualifies as certified and traceable by default since its chain of custody starts at a known collection point rather than a mine site. Battery manufacturers increasingly favor recycled cobalt sulfate because it sidesteps artisanal sourcing scrutiny, and several automakers have signed direct offtake agreements with recyclers ahead of vehicle take-back programs scaling. European Union rules now mandate minimum recycled content in new batteries.
CAGR 13.5%

Cobalt as a Copper Mining Byproduct

Copper mining operations, particularly in the Democratic Republic of Congo's copperbelt region, produce cobalt as a byproduct whose output volume tracks copper investment decisions rather than cobalt pricing signals directly. This segment is growing quickly because global copper demand for electrification and grid infrastructure is driving substantial new copper mine investment, and every new copperbelt operation brings incremental cobalt supply regardless of whether cobalt prices justify standalone development. Producers increasingly value this byproduct economics structure because copper revenue carries the project's capital costs, letting cobalt output continue through periods when cobalt prices alone would not support investment. Integrated copper-cobalt miners are gaining cost advantage over standalone producers lacking a comparable revenue cushion.
CAGR 10.2%
Full segment breakdown across 6 segments available in the complete report.

Regional Architecture and Country Demand Map

Cobalt's regional value distribution diverges sharply from its mining geography. East Asia commands the largest share through refining and battery precursor capacity, while North America and Europe build downstream demand faster than domestic supply, and Africa's mining dominance captures a smaller share of total value.

North America

North American demand centers on battery gigafactory buildout tied to domestic electric vehicle incentive programs, which require an increasing share of critical mineral content to originate from allied or domestic sources. Automakers and battery manufacturers are signing direct offtake agreements with miners outside traditional Chinese-controlled supply chains specifically to satisfy these sourcing rules, pushing several new refining projects toward final investment decision in the United States and Canada. Defense and aerospace superalloy demand adds a separate, steadier consumption base that is less sensitive to battery chemistry shifts. Domestic refining capacity remains limited relative to demand, however, leaving the region reliant on imported cobalt sulfate even as onshoring investment accelerates across multiple announced projects.
Share: 26% | CAGR: 9.2% (2026 to 2036)

Western Europe

Western Europe's demand is driven overwhelmingly by automotive battery manufacturing tied to the region's combustion engine phase-out timeline, which is pulling forward cobalt sulfate procurement well ahead of planned vehicle production ramps. European Union battery regulation now mandates minimum recycled cobalt content and full supply chain due diligence documentation, pushing manufacturers toward certified and increasingly recycled material sourced through verified channels rather than spot purchases. Germany's automotive supply base and Scandinavia's battery gigafactory investments concentrate the bulk of regional consumption, while domestic mining remains negligible across nearly every member state. This leaves the region persistently dependent on imported refined material even as onshore recycling capacity expands to reduce that exposure over the coming decade.
Share: 19% | CAGR: 7.0% (2026 to 2036)
Regional intelligence for 5 additional markets available in the complete report: East Asia, South Asia and Pacific, Latin America, Middle East and Africa, Eastern Europe. Contact sales@marketmindsadvisory.com.
cobalt-mining-market-country-cagr-analysis-1787302834608

Where Cobalt Producers Can Actually Expand Margin

Cobalt producers capture margin unevenly across the value chain, and the biggest opportunities sit in downstream integration, traceability certification, and byproduct optimization rather than raw tonnage expansion alone. Four commercial levers stand out as genuinely actionable across most producer types, regardless of whether the underlying asset is a primary mine or a byproduct stream.

Forward Integration into Cobalt Sulfate Refining

Miners who invest in cobalt sulfate refining capacity rather than selling concentrate capture the processing margin that currently flows almost entirely to Chinese refiners. Building even modest domestic refining capacity lets a producer sell directly into battery-grade contracts at prices roughly 20 to 30 percent above raw concentrate, while also qualifying more easily for traceability-conscious automotive buyers who prefer fewer supply chain intermediaries. The capital outlay is substantial and payback typically runs five to seven years, but producers who have made this move report materially higher realized pricing and stickier customer relationships than concentrate-only peers.
Market Impact: Sulfate refining lifts realized pri

Building Certified Traceable Supply Chain Premiums

Producers who invest early in mine-to-cathode traceability documentation and third-party audit certification are capturing premium pricing from automotive battery buyers who increasingly refuse uncertified material regardless of cost. This premium currently runs roughly eight to twelve percent above uncertified spot pricing and is widening as more automakers finalize binding traceability mandates for 2027 model years across most major vehicle platforms. Certification costs are modest relative to the pricing uplift, and producers who delay risk being locked out of qualified vendor lists entirely rather than simply receiving a lower price for the same material.
Market Impact: Certified material earns an 8 to 12

Building Recycling Feedstock Partnerships with Automakers

Signing direct offtake agreements with automakers for end-of-life battery feedstock lets recyclers secure predictable input volume years ahead of when those vehicles actually retire, smoothing what would otherwise be a volatile spot-collection business dependent on unpredictable scrap flows. Automakers benefit by locking in a recycled content pathway that satisfies regulatory mandates without building their own recycling capacity. Several such partnerships have already been signed covering over 300,000 vehicles' worth of future battery volume, and recyclers with automaker relationships are commanding valuation premiums over standalone collection-and-process operators lacking comparable offtake visibility.
Market Impact: Offtake deals now cover over 300,00

Byproduct Optimization Across Copper and Nickel Operations

Integrated miners who actively optimize cobalt recovery rates within copper and nickel processing circuits, rather than treating cobalt as incidental waste stream, are capturing meaningful additional revenue per tonne of primary ore processed at relatively low incremental capital cost. Recovery rate improvements from process upgrades can lift cobalt yield by 15 to 25 percent without touching primary metal output, effectively adding a high-margin revenue stream that requires no new mine development. This lever is particularly attractive because it monetizes existing infrastructure rather than requiring greenfield investment, and payback periods typically run under three years for most qualifying operations.
Market Impact: Recovery upgrades lift cobalt yield

Who Controls the Margin Pool

Competitive concentration sits at fifty-two percent held by five suppliers, a level driven more by capital intensity and geological reserve access than by pricing strategy. Glencore and CMOC lead decisively on integrated mine-to-market scale, while mid-tier challengers like Huayou Cobalt compete primarily on refining throughput rather than reserve ownership, leaving a meaningful gap between the top two and everyone else.
Current competitive activity centers on three dimensions. Refiners are racing to secure long-term ore offtake agreements directly with mine operators, bypassing traders to lock in supply certainty. Battery manufacturers are increasingly co-investing in refining capacity through joint development agreements rather than relying purely on merchant supply. And traceability certification has become a genuine differentiator, with several suppliers investing heavily in blockchain-based provenance systems to win automotive contracts that uncertified competitors cannot access.

Emerging pressure comes from recyclers, who are scaling fast enough to challenge traditional miners for share of battery-grade supply within the next several years. Rankings could shift meaningfully if a major recycler secures automaker equity backing, combining feedstock certainty with capital access that pure-play recyclers currently lack. Byproduct producers riding copper and nickel investment cycles also stand to gain share from standalone miners facing tighter financing.
cobalt-mining-market-company-positioning-matrix-1787302835129

Competitive Moat and Risk Dimensions

GLENCORE PLC

Moat: Integrated Mine-to-Refinery Ownership

Glencore controls both mine production and marketing rights across a substantial share of DRC output through direct ownership and long-term offtake agreements, giving it visibility and control over physical supply that pure trading houses cannot replicate. This integration lets the company smooth earnings across commodity cycles by shifting volume between markets and end uses depending on where pricing is strongest.
GLENCORE PLC

Risk: Geopolitical and Regulatory Exposure

The company's heavy DRC concentration exposes it directly to political instability, changing mining royalty regimes, and periodic export restriction risk that has disrupted operations before. Rising resource nationalism across several African mining jurisdictions could raise royalty rates or force local processing requirements that compress margin on assets the company cannot easily relocate.
CHINA MOLYBDENUM CO., LTD. (CMOC GROUP LIMITED)

Moat: Refining Scale and Precursor Integration

CMOC combines large-scale Congolese mine ownership with substantial Chinese refining capacity, letting it capture both extraction and processing margin that standalone miners forfeit to third-party refiners. This vertical integration gives the company cost advantages competitors without refining assets cannot easily match, particularly as battery precursor demand keeps expanding domestically.
CHINA MOLYBDENUM CO., LTD. (CMOC GROUP LIMITED)

Risk: Concentrated China Market Dependence

CMOC's refining and precursor customer base concentrates heavily in China's domestic battery supply chain, leaving it more exposed than diversified peers to any slowdown in Chinese electric vehicle production or shifts in domestic battery chemistry preference away from cobalt-containing formulations toward cheaper alternatives that carry no such geographic concentration risk.

Players Tracked

Prominent Players

Glencore plc
China Molybdenum Co., Ltd. (CMOC Group Limited)
Eurasian Resources Group (ERG)
Zhejiang Huayou Cobalt Co., Ltd.
Vale S.A.

Other Key Players

Jinchuan Group Co., Ltd.
Umicore N.V./S.A.
GEM Co., Ltd.
Sherritt International Corporation
MMC Norilsk Nickel PJSC
Freeport-McMoRan Inc.
Electra Battery Materials Corporation
Cobalt Blue Holdings Limited
Fortune Minerals Limited
Katanga Mining Limited
Tenke Fungurume Mining S.A.
Mopani Copper Mines plc
ERAMET S.A.
China Minmetals Corporation
Jervois Global Limited

Recent Developments

MARCH 2026

Glencore Signs Traceable Cobalt Offtake with European Battery Maker

Glencore signed a multi-year cobalt offtake agreement with a major European battery manufacturer, committing a substantial share of its DRC production to certified traceable supply channels under the new contract terms. The agreement includes joint investment in blockchain-based chain-of-custody verification covering the full mine-to-cathode material pathway across every shipment.
Signal: Signals accelerating buyer preference for
NOVEMBER 2025

CMOC Completes Cobalt Sulfate Refining Capacity Expansion

CMOC completed an expansion of its cobalt sulfate refining capacity in China, adding meaningful battery-grade processing volume aimed squarely at domestic cathode precursor manufacturers scaling their own production lines. The expansion strengthens the company's downstream integration and reduces its historical reliance on third-party refining partners for finished product output.
Signal: Confirms refiners are increasingly priorit
JUNE 2026

Huayou Cobalt and Automaker Form Battery Recycling Joint Venture

Huayou Cobalt and a leading automaker announced a joint venture to build a dedicated battery recycling and cobalt recovery facility, combining the automaker's vehicle take-back volume with Huayou's hydrometallurgical processing expertise and existing plant infrastructure. The facility targets meaningful annual recovered cobalt output once fully operational within several years.
Signal: Marks automakers moving directly into recy

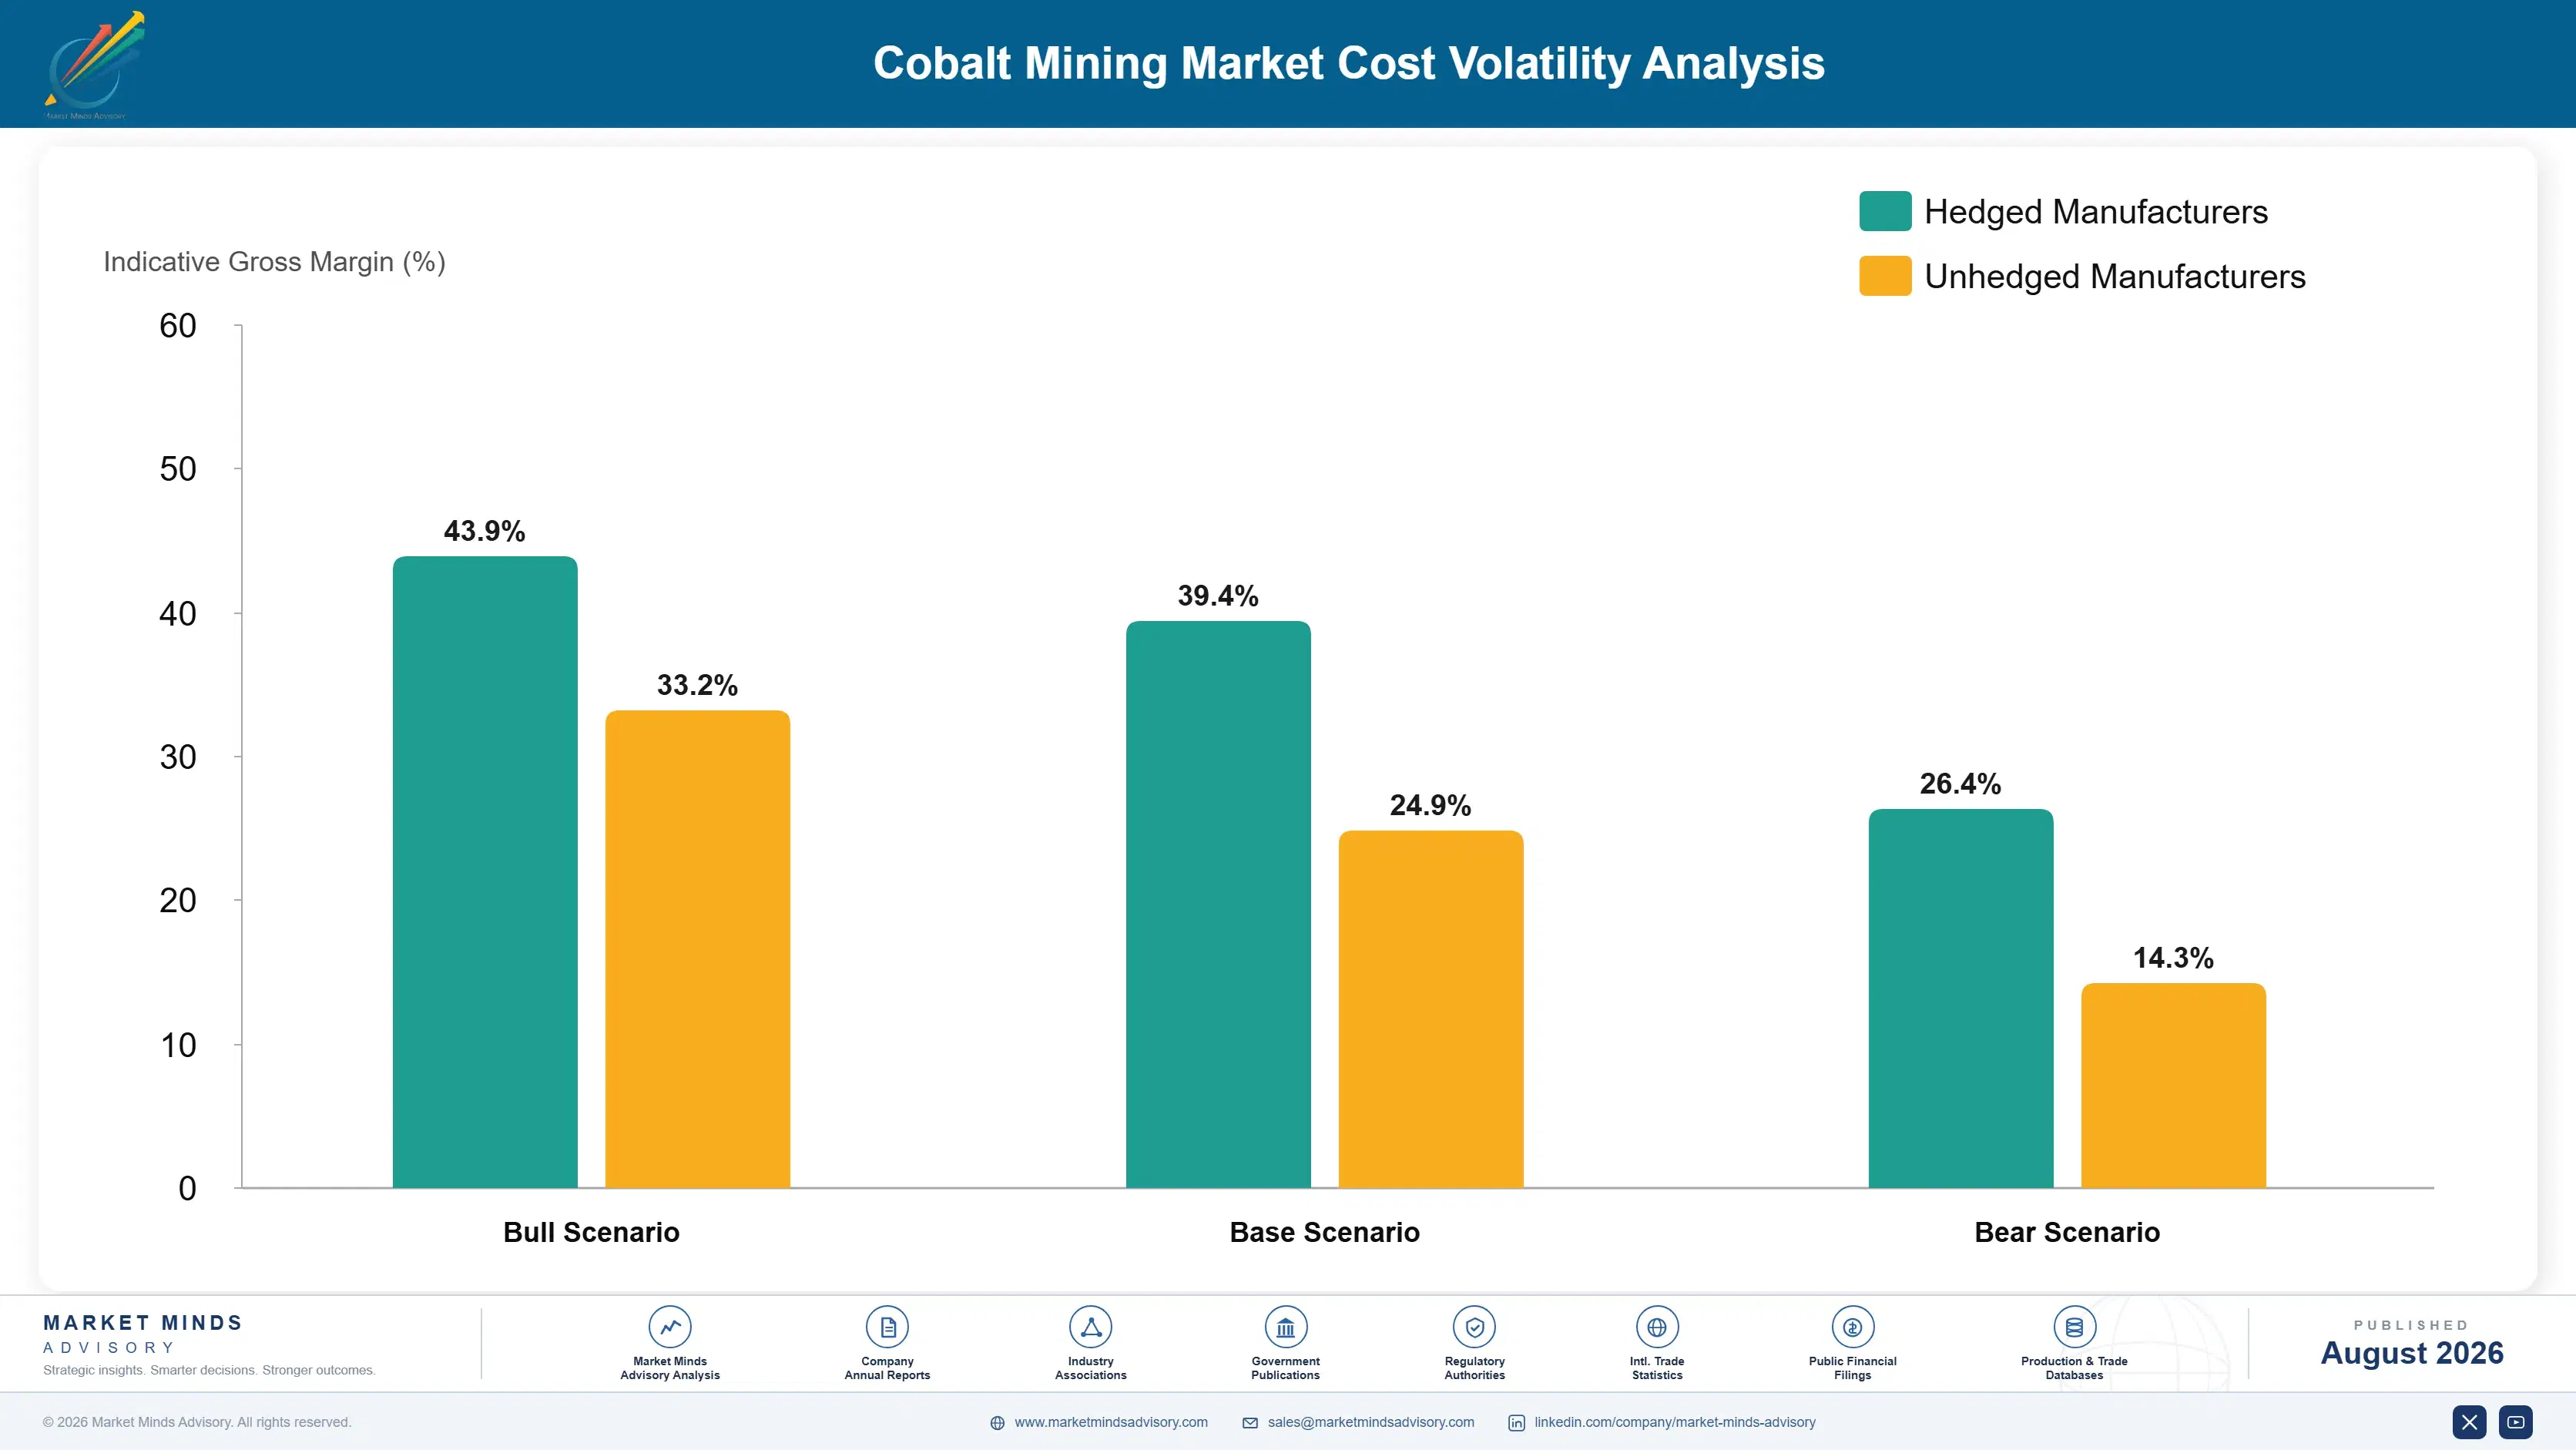
Cobalt Refining Cost Exposure and Volatility

Raw ore feedstock represents roughly fifty-eight percent of refiner production cost, sourced overwhelmingly from the Democratic Republic of Congo through a mix of industrial mine offtake and informal trading networks. Energy costs for hydrometallurgical processing add a further meaningful share, while logistics and export handling through regional ports contribute the remainder of the cost structure.
Cobalt prices fell sharply in 2023 as Indonesian nickel-cobalt byproduct supply surged unexpectedly, catching refiners who had locked in higher-cost ore contracts with compressed margins for several quarters, according to IEA critical minerals market reporting. Several mid-tier refiners deferred planned capacity expansion during this period, illustrating how quickly byproduct supply shifts from copper and nickel operations can override fundamentals in the standalone cobalt mining segment specifically.

Integrated miners with byproduct cobalt streams absorb price volatility far more easily than standalone cobalt-only producers, since copper or nickel revenue continues regardless of cobalt pricing swings. Chinese refiners with long-term DRC offtake agreements also carry lower effective feedstock cost than spot-market buyers, widening the competitive gap further with each passing pricing cycle. Smaller Western refiners lacking either integration advantage face the sharpest margin compression during downturns.
cobalt-mining-market-cost-volatility-analysis-1787302835326

Diversify Ore Sourcing Beyond Single-Country Concentration

Refiners are increasingly qualifying secondary ore sources in Zambia, Australia, and Indonesian nickel-cobalt operations to reduce dependence on any single sourcing corridor. This diversification adds modest logistics cost but meaningfully reduces exposure to any single country's export policy shifts or infrastructure disruption, giving buyers negotiating leverage they otherwise would not have during supply tightness.

Lock in Long-Term Offtake at Fixed or Collared Pricing

Buyers are increasingly negotiating multi-year offtake contracts with price collars rather than pure spot exposure, trading some upside during price spikes for protection against the sharp downturns that have repeatedly caught unhedged buyers off guard in past cycles. This approach smooths input cost planning meaningfully for battery manufacturers running multi-year production forecasts against fixed vehicle pricing.

Expand Recycled Feedstock to Reduce Virgin Ore Dependence

Manufacturers are increasingly co-investing in recycling capacity specifically to build a feedstock source insulated from mined-ore price swings and geopolitical sourcing risk entirely. While recycled volume cannot yet fully replace virgin ore given current battery retirement rates, it is growing fast enough to meaningfully dilute overall feedstock cost volatility within blended supply portfolios over time.

Portfolio Architecture for Margin Defence

Cobalt's three-tier portfolio architecture separates commodity concentrate, certified battery-grade material, and recycled or next-generation supply, each carrying a distinct margin profile shaped by how much processing and documentation work has been added before sale. Volume tier products compete almost entirely on delivered price with thin single-digit margins, while certified battery-grade material commands meaningfully higher margin tied directly to traceability documentation and refining i
The tension between volume and premium tiers is intensifying as battery manufacturers increasingly refuse uncertified material outright rather than simply discounting it, effectively shrinking the addressable market for volume-tier concentrate sellers lacking downstream integration or certification infrastructure of their own. Producers who cannot make the transition toward certified supply risk being pushed entirely into industrial alloy and lower-margin applications where documentation requirements remain far less demanding.

High-value margin pools concentrate overwhelmingly in refined battery-grade sulfate and recycled material, where certification and traceability create genuine pricing power that raw concentrate simply cannot command. Recyclers and integrated refiners capture this value disproportionately relative to standalone miners, who remain largely confined to the thinner-margin volume tier regardless of underlying ore quality or reserve scale.

Volume / Commodity-Adjacent

Raw and concentrate-grade cobalt sold on delivered tonnage with minimal processing or certification, competing almost entirely on price against other commodity suppliers with little brand or documentation differentiation available to sellers in this tier.
Gross Margin: 8-14%

Premium / Certified

Battery-grade cobalt sulfate carrying traceability certification and chain-of-custody documentation that qualifies it for automotive and premium electronics supply chains, where buyers increasingly pay a genuine premium for verified, fully auditable sourcing over uncertified alternatives.
Gross Margin: 18-26%

Sustainability / Regulatory / Next-Generation

Recycled cobalt and byproduct recovery streams meeting emerging regulatory recycled-content mandates, positioned as the lowest-carbon and most defensible long-term supply category as virgin-ore scrutiny continues intensifying across most major automotive and industrial markets.
Gross Margin: 22-32%
cobalt-mining-market-portfolio-architecture-1787302835836

Cobalt's Locked-In Multi-Year Demand Base

Cobalt demand carries genuine annuity-like characteristics once a battery platform reaches production, since automakers rarely re-qualify cathode chemistry mid-cycle given the cost and time required to validate a new material combination across an entire vehicle lineup. A single supply agreement typically locks in five to seven years of predictable offtake volume, giving qualified suppliers revenue visibility that spot-market commodity sellers simply do not have.
Adoption depth varies sharply by end-use vertical. Automotive battery demand is deep but chemistry-sensitive, since manufacturers can and do shift toward cobalt-free formulations in cost-focused vehicle segments while retaining cobalt in premium, long-range platforms. Aerospace and defense superalloy demand is shallower in volume but far stickier, since material qualification for flight-critical components takes years and switching costs are prohibitively high once a supplier is approved and flying.

Buyer profiles are shifting generationally as sustainability officers and supply chain risk teams gain real influence over sourcing decisions once handled purely by procurement on price alone. This newer buyer cohort weighs traceability and recycled content credentials alongside price, fundamentally reshaping which suppliers even reach the final negotiation stage regardless of how competitive their delivered pricing might otherwise be.
cobalt-mining-market-end-use-penetration-index-1787302836328

Where Cobalt Strategy Should Focus Next

These are among the four positions where our research anticipates prominent divergence between winners and laggards over the coming forecast period. Each is grounded in the demand model, the regulatory perimeter, and the announced capacity pipeline.
01 / TRACEABILITY INVESTMENT PRIORITY

Certify supply chains now or lose qualified vendor status entirely

Automotive battery manufacturers are finalizing binding traceability mandates for 2027 model years, and suppliers lacking certification are already being dropped from qualified vendor lists regardless of price competitiveness. Certification investment pays back through an eight to twelve percent pricing premium plus continued market access, while delay risks permanent exclusion from the fastest-growing and highest-margin demand pool. The window for building credible chain-of-custody systems before mandates take full effect is narrowing fast, and suppliers who wait until enforcement begins will find qualification queues already backed up.
02 / BYPRODUCT INTEGRATION ECONOMICS

Standalone cobalt-only investment carries genuinely weaker downside protection

Integrated miners who recover cobalt as a copper or nickel byproduct absorb price volatility far more comfortably than standalone cobalt-only operations, since primary metal revenue continues regardless of cobalt price swings. New project financing should prioritize byproduct optimization at existing copper and nickel operations over greenfield standalone cobalt development, since payback periods run under three years and capital risk is meaningfully lower. Lenders and equity investors are already pricing this distinction into financing terms, making standalone cobalt projects progressively harder to fund on competitive terms.
03 / RECYCLING CAPACITY EXPANSION

Recycling infrastructure investment now positions suppliers ahead of the retirement wave

Battery end-of-life volumes are only beginning to scale, and the cobalt recycling segment is growing faster than any other segment in this market at over thirteen percent annually. Producers and automakers who build recycling and feedstock partnership capacity now will capture disproportionate share once retirement volumes reach meaningful scale later this decade. Latecomers will find themselves competing for feedstock against already-established collection networks and long-term automaker offtake agreements that lock up the best supply well ahead of actual volume availability.
04 / GEOGRAPHIC REFINING DIVERSIFICATION

Regional refining onshoring reduces exposure to single-country policy risk

China's dominance of global cobalt refining capacity concentrates geopolitical and policy risk in ways buyers increasingly want to avoid, particularly for automakers subject to domestic content sourcing requirements tied to regional incentive programs. Investment in North American and European refining capacity, though capital intensive, offers genuine strategic insulation from any future trade restriction or export control affecting Chinese-processed material. Early movers are already securing preferential offtake terms from ore suppliers actively seeking diversified buyers outside the traditional Chinese refining corridor.

Engagement Snapshot From the Field

A live engagement with an industry participant carrying material or product regulatory and market exposure ahead of a defining policy shift, showing how our research translates into a defensible multi-year portfolio strategy.
MARKET MINDS ADVISORY · CLIENT ENGAGEMENT SUMMARY
Cobalt Mining Producer Strategic Portfolio Review and Transition Roadmap 2026·Investment Scenario on Cobalt Mining Exposure Evaluation 2025-26
CLIENT PROFILE
The client is a global battery precursor manufacturer supplying cathode active material to several major automotive OEMs across North America and Europe. The company processes several thousand tonnes of cobalt sulfate annually, sourced through a mix of direct mine offtake and merchant refiners. Facing pressure from automaker customers to demonstrate traceable supply chains ahead of 2027 regulatory deadlines, the client engaged MMA to assess sourcing risk (client-reported, unverified by MMA).
STRATEGIC CHALLENGE
The client's existing cobalt supply chain relied heavily on merchant traders whose upstream sourcing could not be fully verified, creating real exposure to losing automaker contracts once traceability mandates took effect. Leadership needed to understand which suppliers could realistically achieve certification within the available timeline, and what switching costs and pricing implications a shift toward certified sourcing would carry across the portfolio.
MMA APPROACH
MMA conducted a supplier-by-supplier assessment of certification readiness across the client's existing cobalt sourcing base, drawing on primary interviews with refiners and mine operators alongside proprietary market data. The engagement modeled pricing impact under several sourcing scenarios and benchmarked the client's exposure against peer manufacturers facing similar automaker pressure, ultimately producing a prioritized supplier transition roadmap.
KEY FINDINGS
  1. Roughly forty percent of the client's existing cobalt volume traced to suppliers unlikely to achieve certification within the required timeline, creating real contract risk.
  2. Certified suppliers commanded a pricing premium of nine to eleven percent, lower than the client's internal worst-case planning assumption of fifteen percent.
  3. Three refiners identified as credible near-term certification candidates already supplied competitor battery manufacturers under comparable traceability terms and independently verified audit standards.
  4. Switching costs were concentrated in contract renegotiation timing rather than logistics, since certified suppliers overlapped substantially with the client's existing shipping routes and terminals.
CLIENT PROFILE
The client is a global battery precursor manufacturer supplying cathode active material to several major automotive OEMs across North America and Europe. The company processes several thousand tonnes of cobalt sulfate annually, sourced through a mix of direct mine offtake and merchant refiners. Facing pressure from automaker customers to demonstrate traceable supply chains ahead of 2027 regulatory deadlines, the client engaged MMA to assess sourcing risk (client-reported, unverified by MMA).
STRATEGIC CHALLENGE
The client's existing cobalt supply chain relied heavily on merchant traders whose upstream sourcing could not be fully verified, creating real exposure to losing automaker contracts once traceability mandates took effect. Leadership needed to understand which suppliers could realistically achieve certification within the available timeline, and what switching costs and pricing implications a shift toward certified sourcing would carry across the portfolio.
MMA APPROACH
MMA conducted a supplier-by-supplier assessment of certification readiness across the client's existing cobalt sourcing base, drawing on primary interviews with refiners and mine operators alongside proprietary market data. The engagement modeled pricing impact under several sourcing scenarios and benchmarked the client's exposure against peer manufacturers facing similar automaker pressure, ultimately producing a prioritized supplier transition roadmap.
KEY FINDINGS
  1. Roughly forty percent of the client's existing cobalt volume traced to suppliers unlikely to achieve certification within the required timeline, creating real contract risk.
  2. Certified suppliers commanded a pricing premium of nine to eleven percent, lower than the client's internal worst-case planning assumption of fifteen percent.
  3. Three refiners identified as credible near-term certification candidates already supplied competitor battery manufacturers under comparable traceability terms and independently verified audit standards.
  4. Switching costs were concentrated in contract renegotiation timing rather than logistics, since certified suppliers overlapped substantially with the client's existing shipping routes and terminals.
RECOMMENDED STRATEGY
Phase 1: Phase 1 (Months 1-3): Complete a supplier-by-supplier certification readiness audit across the client's full existing cobalt sourcing base and volume. Phase 2: Phase 2 (Months 4-9): Renegotiate or replace contracts with the lowest-readiness suppliers first, prioritizing volume carrying the greatest exclusion risk. Phase 3: Phase 3 (Months 10-18): Formalize chain-of-custody documentation and third-party audit processes with all retained suppliers well ahead of the 2027 deadline.
OUTCOME
Within twelve months of implementing the roadmap, the client shifted a majority of its cobalt volume to certified suppliers and secured renewed multi-year contracts with two major automaker customers who had signaled contract review pending certification progress. The client reported (client-reported, unverified by MMA) that the transition preserved existing customer relationships that would otherwise have been placed at meaningful risk.

Frequently Asked Questions

Foundational context covering the market sizes, CAGR, scope, country, region and competition that inform every finding below. This section is provided to cover basics and most often pre-purchase conversations, answered from the MMA Primary Research Dataset.

What is the current size of the Cobalt Mining Market?

The global cobalt mining market is valued at $13.5 billion in 2025. Growth is driven primarily by battery precursor demand and expanding recycling infrastructure investment.

How large will the Cobalt Mining Market be by 2036?

MMA projects the market will reach approximately $33.1 billion by 2036. This represents a 2.26 times expansion over the ten-year forecast period beginning in 2026.

What is the CAGR for the Cobalt Mining Market 2026 to 2036?

The base case CAGR is 8.5%, with a bull case of 9.8% and a bear case of 7.2%. Recycling and byproduct segments grow meaningfully faster than this average.

Which segment is growing fastest?

Cobalt recycling and secondary recovery leads at 13.5% CAGR, roughly 1.59 times the overall market rate. Battery end-of-life volumes and recycled-content mandates drive this pace.

Who are the major companies in the Cobalt Mining Market?

Leading participants include Glencore, CMOC Group, Eurasian Resources Group, Zhejiang Huayou Cobalt, and Vale. Together these five suppliers hold fifty-two percent of the total market.

Which country is growing fastest?

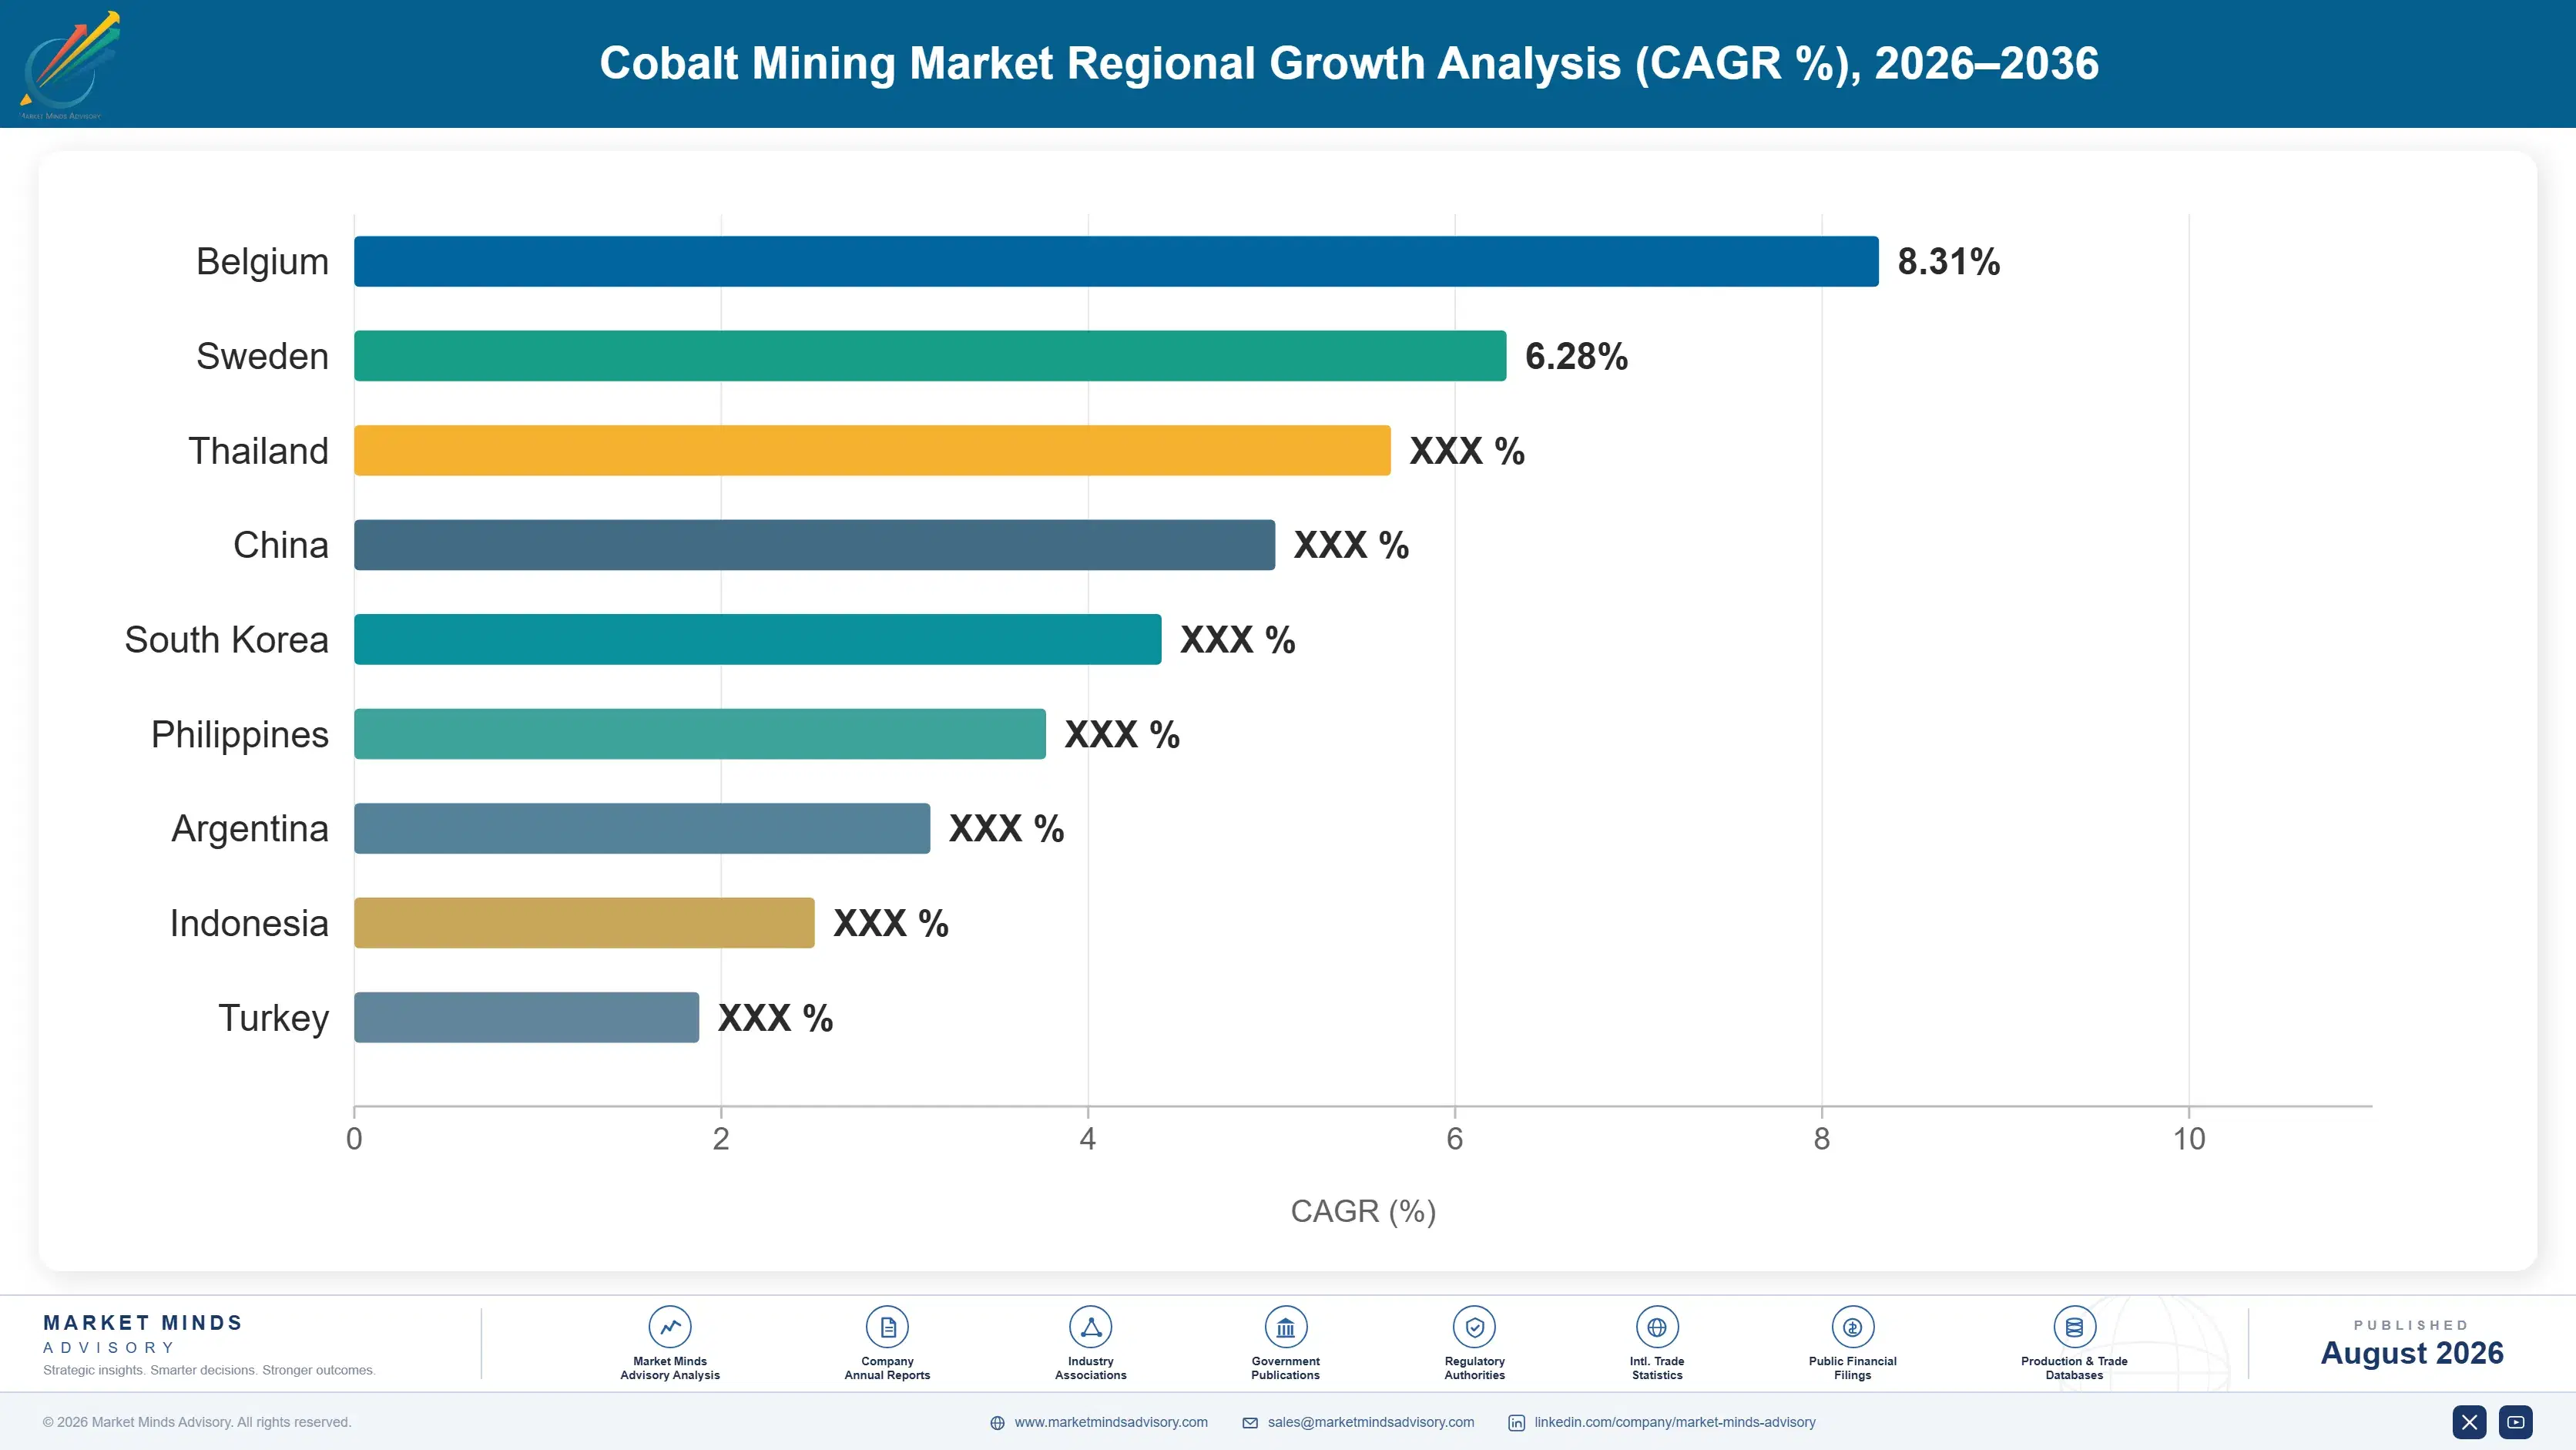
China leads regional growth at 9.9% CAGR, driven by its dominant refining and battery precursor manufacturing capacity. This outpaces the region's underlying mine output growth.

Report Segmentation Architecture

The full report scope spans multiple orthogonal segmentation dimensions, with cross-tabulated demand data provided for each dimension pair. Coverage extends further to regional breakdowns, trend trajectories, and the competitive detail needed to support segment-level decision-making.

By Primary Market Dimension

  • Artisanal and Small-Scale Mining (ASM) Cobalt
  • Large-Scale Industrial Primary Ore Mining
  • Cobalt as a Nickel Mining Byproduct
  • Cobalt as a Copper Mining Byproduct
  • Cobalt Refining and Processing Services
  • Cobalt Recycling and Secondary Recovery

By End-Use Industry

  • Automotive and Battery Manufacturing
  • Aerospace and Defense Superalloys
  • Electronics and Consumer Devices
  • Industrial and Chemical Catalysts
  • Energy Storage and Grid Infrastructure

By Commercial Dimension

  • Direct Mine Offtake Agreements
  • Merchant Trader and Spot Sales
  • Certified Traceable Supply Contracts
  • Refiner-to-Manufacturer Direct Supply

By Region

  • North America
  • Western Europe
  • East Asia
  • South Asia and Pacific
  • Latin America
  • Middle East and Africa
  • Eastern Europe

Scope, Methodology, and Coverage

Every figure in this report is reproducible from documented input assumptions. The scope below maps the historical period, the forecast horizon, the segmentation dimensions, and the countries covered, alongside the underlying primary and qualitative methodology.
Historical Period
2020 to 2025
Forecast Period
2026 to 2036
Base Year
2025 (USD billions; MMA Primary Research Dataset, August 2026)
Market Definition
This report covers the global cobalt mining market, spanning extraction, byproduct recovery, refining, and recycled secondary recovery of cobalt across mining, industrial, and battery end-use applications. It excludes downstream battery cell manufacturing and finished battery products, which are addressed in separate MMA battery materials coverage.
Quantitative Units
USD billions (current prices); metric tonnes of contained cobalt where applicable
Segmentation Dimensions
By Primary Market Dimension; By End-Use Industry; By Commercial Dimension; By Region
Regions Covered
North America, Western Europe, East Asia, South Asia and Pacific, Latin America, Middle East and Africa, Eastern Europe
Countries Covered
USA, China, Germany, France, UK, Japan, South Korea, India, Australia, Canada, Brazil, Mexico, Indonesia, Vietnam, Thailand, Malaysia, UAE, Saudi Arabia, South Africa, Nigeria, Turkey, Poland, Netherlands, Italy, Spain, Sweden, Switzerland, Argentina, Colombia, Singapore, and additional markets relevant to this sector
Key Companies Profiled
Glencore plc, China Molybdenum Co., Ltd. (CMOC Group Limited), Eurasian Resources Group (ERG), Zhejiang Huayou Cobalt Co., Ltd., Vale S.A., Jinchuan Group Co., Ltd., Umicore N.V./S.A., GEM Co., Ltd., Sherritt International Corporation, MMC Norilsk Nickel PJSC, Freeport-McMoRan Inc., Electra Battery Materials Corporation, Cobalt Blue Holdings Limited, Fortune Minerals Limited, Katanga Mining Limited, Tenke Fungurume Mining S.A., Mopani Copper Mines plc, ERAMET S.A., China Minmetals Corporation, Jervois Global Limited
Quantitative Methodology
Primary survey, n=3,800 respondents, Q4 2025, six countries; demand-side model with trade association cross-validation
Qualitative Methodology
47 expert interviews, Q4 2025; applied to validate demand model assumptions, identify emerging dynamics, and assess competitive positioning
Report Format
PDF and XLSX data workbook (Word format preview document)
Publisher
Market Minds Advisory
Report Code
MMA-2026-ENE-405
Published
August 2026
Contact
sales@marketmindsadvisory.com | www.marketmindsadvisory.com

Purchase the full Cobalt Mining Market Report (2026 to 2036).

The full Cobalt Mining Market report delivers comprehensive analysis across all seven MMA-covered regions. It provides complete segment-level sizing and forecasts through 2036, plus detailed competitive profiling of twenty leading global participants across the mining, refining, and recycling value chain. The report includes proprietary MMA primary survey data drawn from 3,800 respondents and forty-seven expert interviews conducted in the fourth quarter of 2025. It also delivers detailed input cost analysis, revenue lever assessment, and portfolio tier economics. Buyers receive full data tables, editable charts, and a structured executive briefing deck suitable for board-level presentation.
Full seven-region market sizing and forecast tables
Twenty-company competitive profiling and benchmarking analysis
Editable data tables and full chart package
Segment-level CAGR and value breakdowns detailed
Input cost structure and price volatility analysis
Executive-ready briefing deck for board presentations

Built For The People Who Decide

From boardroom strategy to bench-side execution, this report is read cover-to-cover by leaders shaping the next decade of their industry, turning demand scenarios, market dynamics and valuation benchmarks into decisions.
CXOs/ Presidents/ VPs/ Managers
M&A and Corporate Development
Strategy Teams and R&D Heads
Procurement and Product Directors
Regulatory and Compliance Leaders
Investor Relations and Equity Analysts