Market Minds Advisory
Cloud Service Assurance Market

Cloud Service Assurance Market: Cloud Service Assurance Market: Assurance Functions, Ingestion Pricing and Portable Instrumentation 2026 to 2036

Customers keep discovering that watching their cloud costs a meaningful fraction of running it. Nobody designed that outcome and everybody arrived at it, which is now the largest cause of switching.

Lead Analyst

Published

September 2026

Make Smarter Decisions with Customized Research Insights

Request a free sample report and evaluate market opportunities, growth trends, and competitive dynamics relevant to your business needs.

2025 MARKET VALUE$14.8BMarket Size 2025
2036 FORECAST VALUE$51.5BBase Case , 2026 to 2036
CAGR 2026 TO 203612.0 %Bull 13.4% / Bear 10.7%
INCREMENTAL OPPORTUNITY$34.9BNet 10- year value creation
EXPANSION MULTIPLE3.11x2036 value over 2026 base
Strategic Levers
M&A Pipeline
Regional Outlook
Country Rankings
Competitive Intelligence
Segmental Deep-dive
Call-Us : 91 93563 13602

Executive Snapshot and Market Trajectory.

This category has a billing problem that turned into a product problem. Observability is priced by data ingested, cloud systems generate around 38% more telemetry each year without anybody deciding to, and assurance spending now runs near 23% of the cloud bill. Nobody designed that and everybody arrived at it.
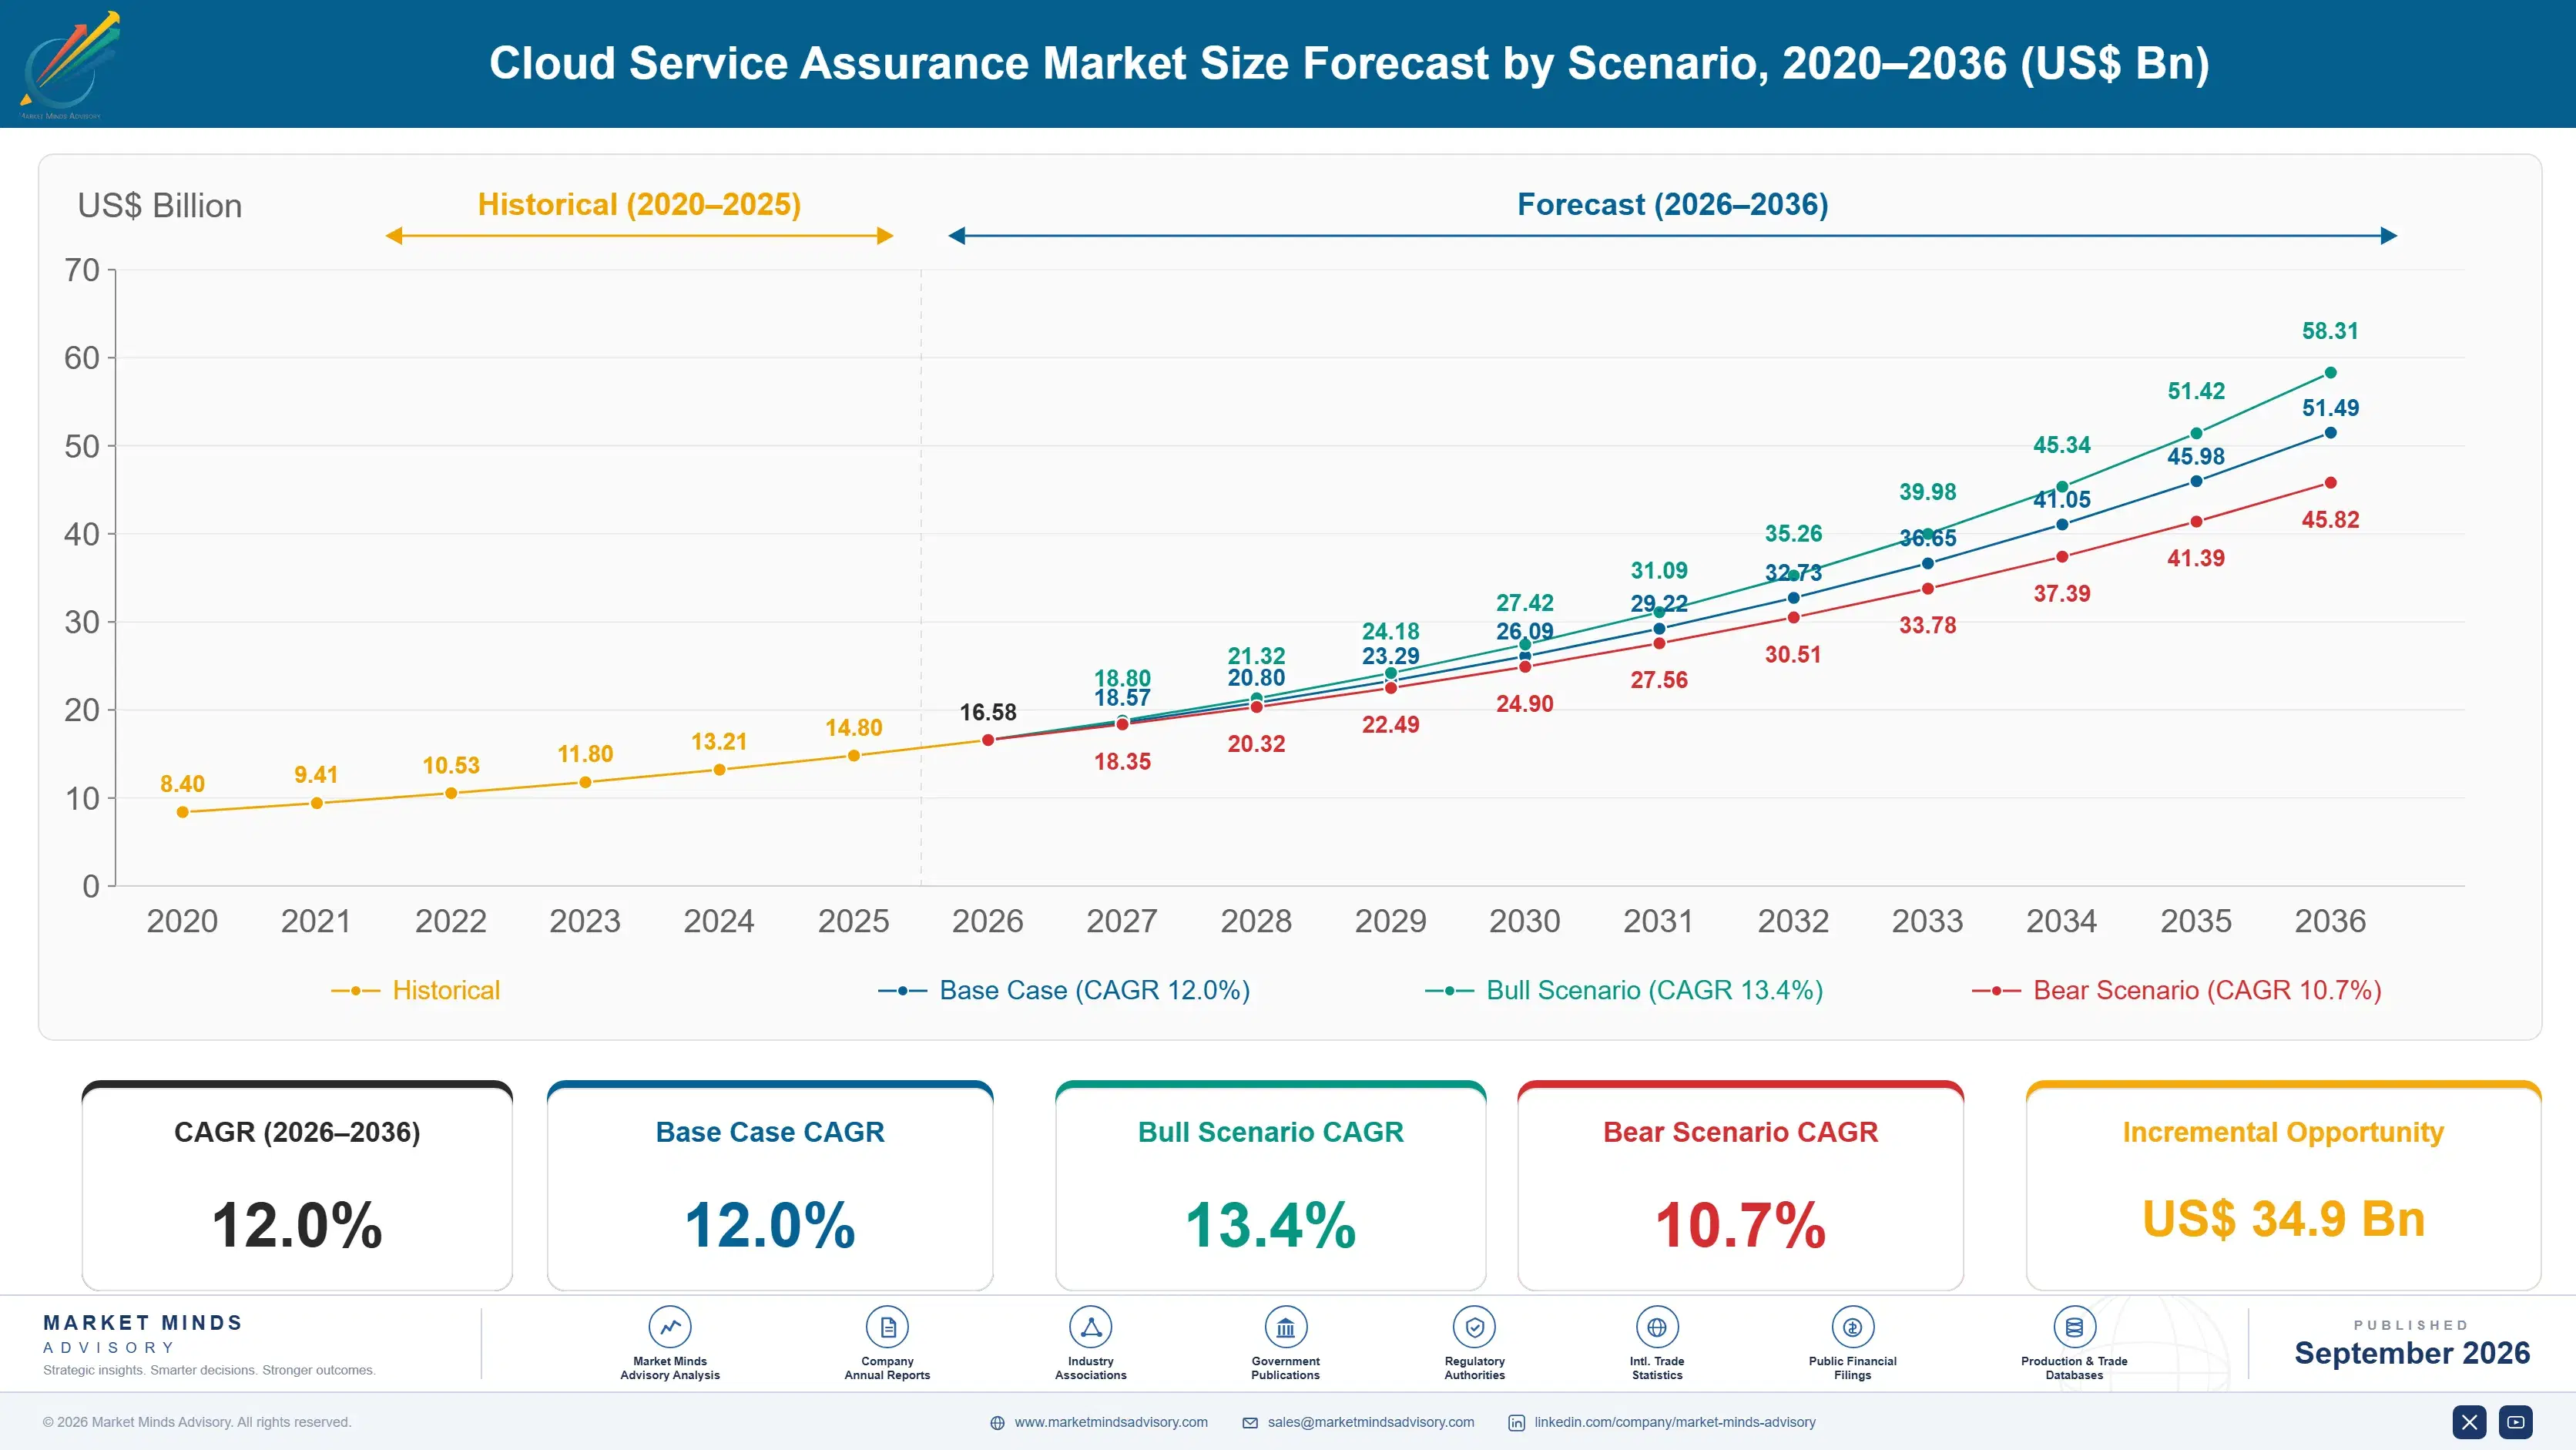
The market reaches USD 16.58 billion in 2026 and USD 51.49 billion by 2036, a 3.11 times expansion at 12.0%. Distributed tracing and application observability grow at 18.0%, half again the market rate of 12.0%, because microservice architectures made request paths impossible to follow any other way. North America holds 38% of software and service revenue on cloud footprint, and India compounds fastest at 17.6% on engineering concentration rather than on cloud spending.
Five vendors hold 44% of software and service revenue, and the competitive position underneath that changed more than the share suggests. Portable instrumentation now covers around 57% of deployments, which removed the technical lock-in that justified ingestion pricing. Datadog, Splunk, Dynatrace, New Relic and Elastic now compete on analysis rather than on collection, which is considerably harder ground to hold Renewals are contested now.
Market Definition
This report covers software and services that assure the performance, availability and quality of cloud delivered services: distributed tracing and application observability, synthetic and digital experience monitoring, service level and contract assurance, incident response and reliability engineering platforms, cloud network performance assurance, and infrastructure metrics and log management. It excludes security monitoring and threat detection, cloud cost optimisation tools without performance function, application development platforms, configuration management, and network hardware.
Base Year Value
$14.8B in 2025 (MMA Primary Research Dataset, September 2026)
Forecast Period
2026 to 2036, eleven discrete annual values
CAGR
12.0% base case. Bull 13.4%. Bear 10.7%.
Fastest Growth Segment
Distributed Tracing And Application Observability: 18.0% CAGR
Fastest Growth Country
India: 17.6% CAGR
Fastest Growth Region
South Asia and Pacific: 14.2% CAGR
Largest Region
North America: 38% of 2025 global value
Market Leaders
Datadog, Splunk, Dynatrace, New Relic and Elastic lead on cloud service assurance software and service revenue. Source: MMA Analysis.
Primary Survey
n=3,800 procurement and R&D decision-makers, Q4 2025, six countries
Methodology
Demand-side build-up, cross-validated against public data, 47 expert interviews

Cloud Service Assurance Market Forecast Scenarios

cloud-service-assurance-market-size-forecast-scenario-1789991931580
Between 2020 and 2025 the category compounded at 10.8%, and the growth came from data volume rather than from customer count for much of it. Cloud architectures fragmented into services that each emit telemetry, ingestion rose around 38% annually without deliberate change, and vendors priced against that volume. Customers noticed when the bills arrived, and renegotiation became a routine event rather than an exception.
The base case holds 12.0% on three mechanisms. Distributed architectures keep making request paths impossible to follow without tracing, which is a technical necessity rather than a preference. Reliability engineering practice keeps spreading from technology companies into ordinary enterprises with the tooling attached. And Indian and Southeast Asian engineering organisations operating platforms for customers elsewhere keep expanding, which adds seats and data volume at the same time regardless of where the workloads sit.
The bull case at 13.4% assumes vendors move pricing off ingestion volume onto something customers can predict, which would end the renegotiation cycle and restore expansion. The bear case at 10.7% is customers reducing telemetry deliberately: portable instrumentation makes selective collection straightforward, and an organisation that decides to ingest less can now do so without changing vendor or rewriting code.

Paying To Watch What You Run

The pricing model built this category and is now dismantling it. Observability is charged by data ingested, distributed architectures emit around 38% more telemetry each year without anybody choosing to, and assurance spending has reached around 23% of what the underlying cloud infrastructure costs. Customers renegotiate every 14 months on median, which is not a healthy commercial relationship by any measure anybody applies.
TOP FIVE CONCENTRATION44%Fragmented across observability platforms and specialist monitoring providers alike
OBSERVABILITY TO CLOUD RATIO23%Assurance spending measured against underlying cloud infrastructure cost
ACTIONED ALERT RATE6%Generated alerts producing any engineering response at all
TELEMETRY VOLUME GROWTH38%Annual increase in data ingested without deliberate instrumentation change
PORTABLE INSTRUMENTATION SHARE57%Deployments using open standards rather than vendor specific agents
CONTRACT RENEGOTIATION FREQUENCY14 monthsMedian interval between customer initiated pricing renegotiations at present
Portable instrumentation changed the switching cost and the vendors have not fully absorbed what that means. Adopting a platform once meant embedding a vendor specific agent in application code, and leaving meant re-instrumenting everything, which justified the pricing whatever customers thought of it. Open standards now cover around 57% of deployments, and moving a data stream to a different backend is configuration rather than engineering work.
Alert volume is the quiet failure nobody reports. Around 6% of generated alerts produce any engineering response, which means the other ninety four percent are noise a team has learned to ignore. That is not a tooling defect. It follows from instrumenting everything and defining thresholds on measurements nobody would ever wake a person for, and the organisations with genuinely good reliability run fewer alerts rather than more data.
"An engineering director showed me their observability invoice next to their cloud invoice and asked which one was supposed to be the smaller number. Nobody set out to build that. It is what ingestion pricing does to a system that generates more data every year on its own."
Principal, Cloud Operations and Reliability Engineering Practice · MMA Technology Practice · September 2026

Market Trends

Ingestion Pricing Turned Into A Renegotiation Treadmill

Distributed systems emit around 38% more telemetry each year without any deliberate instrumentation change, and observability priced by data ingested grows with that whether the customer gains anything or not. Assurance spending now runs near 23% of underlying cloud cost, and customers renegotiate every 14 months on median. That is a commercial relationship where the vendor's revenue growth is the customer's cost problem, and both parties know it. Vendors moving pricing toward hosts, seats or predictable tiers are addressing the single largest cause of switching in this category. Both parties know it perfectly well.
Market Impact: Tracing compounds at 18.0% annually

Open Instrumentation Removed The Technical Lock-In

Adopting an observability platform once meant embedding a vendor specific agent throughout application code, and leaving meant re-instrumenting everything, which is why customers tolerated pricing they disliked. Portable open instrumentation now covers around 57% of deployments and moving telemetry to a different backend is a configuration change rather than an engineering programme. Vendors consequently compete on analysis, correlation and workflow rather than on collection, which is considerably harder ground to hold and rewards very different capabilities from the ones that built these businesses. Collection was the moat for a decade and it has stopped being one.
Market Impact: Reliability platforms compound at 15.4%

Market Opportunities and Growth Drivers

Distributed Architecture Made Tracing Technically Unavoidable

A request crossing forty services leaves no single log anybody can read to understand what happened to it, and no amount of infrastructure metrics reconstructs the path afterwards. Distributed tracing is the only technique that follows a request end to end, which makes it a technical necessity rather than a tooling preference anybody debates. Application observability compounds at 18.0% against 12.0% for the market on that alone. Organisations that decomposed monoliths without adopting tracing discover the gap during their first genuinely confusing incident. Nobody debates whether tracing is necessary anymore.
Market Impact: Only 6% of alerts get actioned

Reliability Practice Spread Beyond Technology Companies

Service level objectives, error budgets and blameless incident review originated at a small number of very large technology firms and have spread steadily into banks, retailers, insurers and industrial companies running significant digital operations. Those practices arrive with tooling attached, since an error budget requires measurement and an incident review requires a timeline. Incident response and reliability platforms compound at 15.4% on adoption by organisations that had operations teams rather than reliability engineers five years ago and now have both. Those organisations had operations teams five years ago and now have reliability engineers as well.
Market Impact: Around 57% can filter freely

Market Restraints and Challenges

Alert Volume Has Made Most Monitoring Ignorable

Around 6% of generated alerts produce any engineering response, which means teams have learned to disregard the overwhelming majority of what their tooling tells them. The root cause is that instrumenting everything and setting thresholds on every measurement produces alerts for conditions nobody would ever page a person about. Commercially this undermines the value argument for additional coverage, since more data produces more noise. Mitigation runs through service level objective based alerting, deliberate threshold reduction and measuring alert action rate as a programme metric. More data produces more noise rather than more insight.
Market Impact: Telemetry grows about 38% annually

Customers Can Now Reduce Ingestion Without Switching

Portable instrumentation covering around 57% of deployments lets an organisation filter, sample and route telemetry before it reaches any vendor, which was impractical when a proprietary agent controlled collection. The root cause is that the open standard separated instrumentation from the backend deliberately. Commercially this means a customer can reduce a bill substantially without changing vendor, negotiating or telling anybody. Mitigation runs through pricing on outcomes rather than volume, since a model that rewards customers for sending less is not sustainable. A model rewarding customers for sending less is not sustainable.
Market Impact: Open standards cover 57% of deployments
3 additional market trends, 4 additional growth drivers, and 2 additional restraints and challenges are covered in the full report. Contact sales@marketmindsadvisory.com to access the complete intelligence.

Segment CAGR and Growth Architecture

Segmentation follows assurance function, since what a tool observes determines who operates it and how the data volume behaves. Six functions cover the market: distributed tracing and application observability, incident response and reliability platforms, synthetic and digital experience monitoring, cloud network performance assurance, service level assurance, and infrastructure metrics and log management. Buyer type is a separate dimension.
cloud-service-assurance-market-market-share-analysis-1789991932174

Distributed Tracing And Application Observability

Distributed tracing grows at 18.0%, half again the market rate of 12.0%, because architectures made it technically unavoidable rather than because anybody found it compelling. A request crossing forty services leaves no single log that explains what happened to it, and infrastructure metrics cannot reconstruct the path afterwards from any amount of data. Tracing is the only technique that follows a request end to end. The commercial difficulty is that trace data is voluminous and ingestion pricing consequently makes it the most expensive telemetry a customer produces, which pushes organisations toward sampling that then loses the rare cases they most needed to see. Sampling then loses the rare cases anybody needed.
CAGR 18.0%

Incident Response And Reliability Engineering Platforms

Incident response and reliability platforms compound at 15.4% as practices developed inside a handful of very large technology firms spread into banks, retailers, insurers and industrial companies running substantial digital operations. Service level objectives, error budgets and blameless incident review all arrive with tooling attached, because an error budget requires measurement and a review requires a reconstructed timeline. The commercially useful property is that these platforms are priced per responder rather than per gigabyte, which makes the cost predictable in a category where almost nothing else is and removes the renegotiation cycle entirely. Predictable cost in a category where almost nothing else is predictable turns out to be worth a great deal to buyers who renegotiate everything else annually.
CAGR 15.4%
Full segment breakdown across 6 segments available in the complete report.

Regional Architecture and Country Demand Map

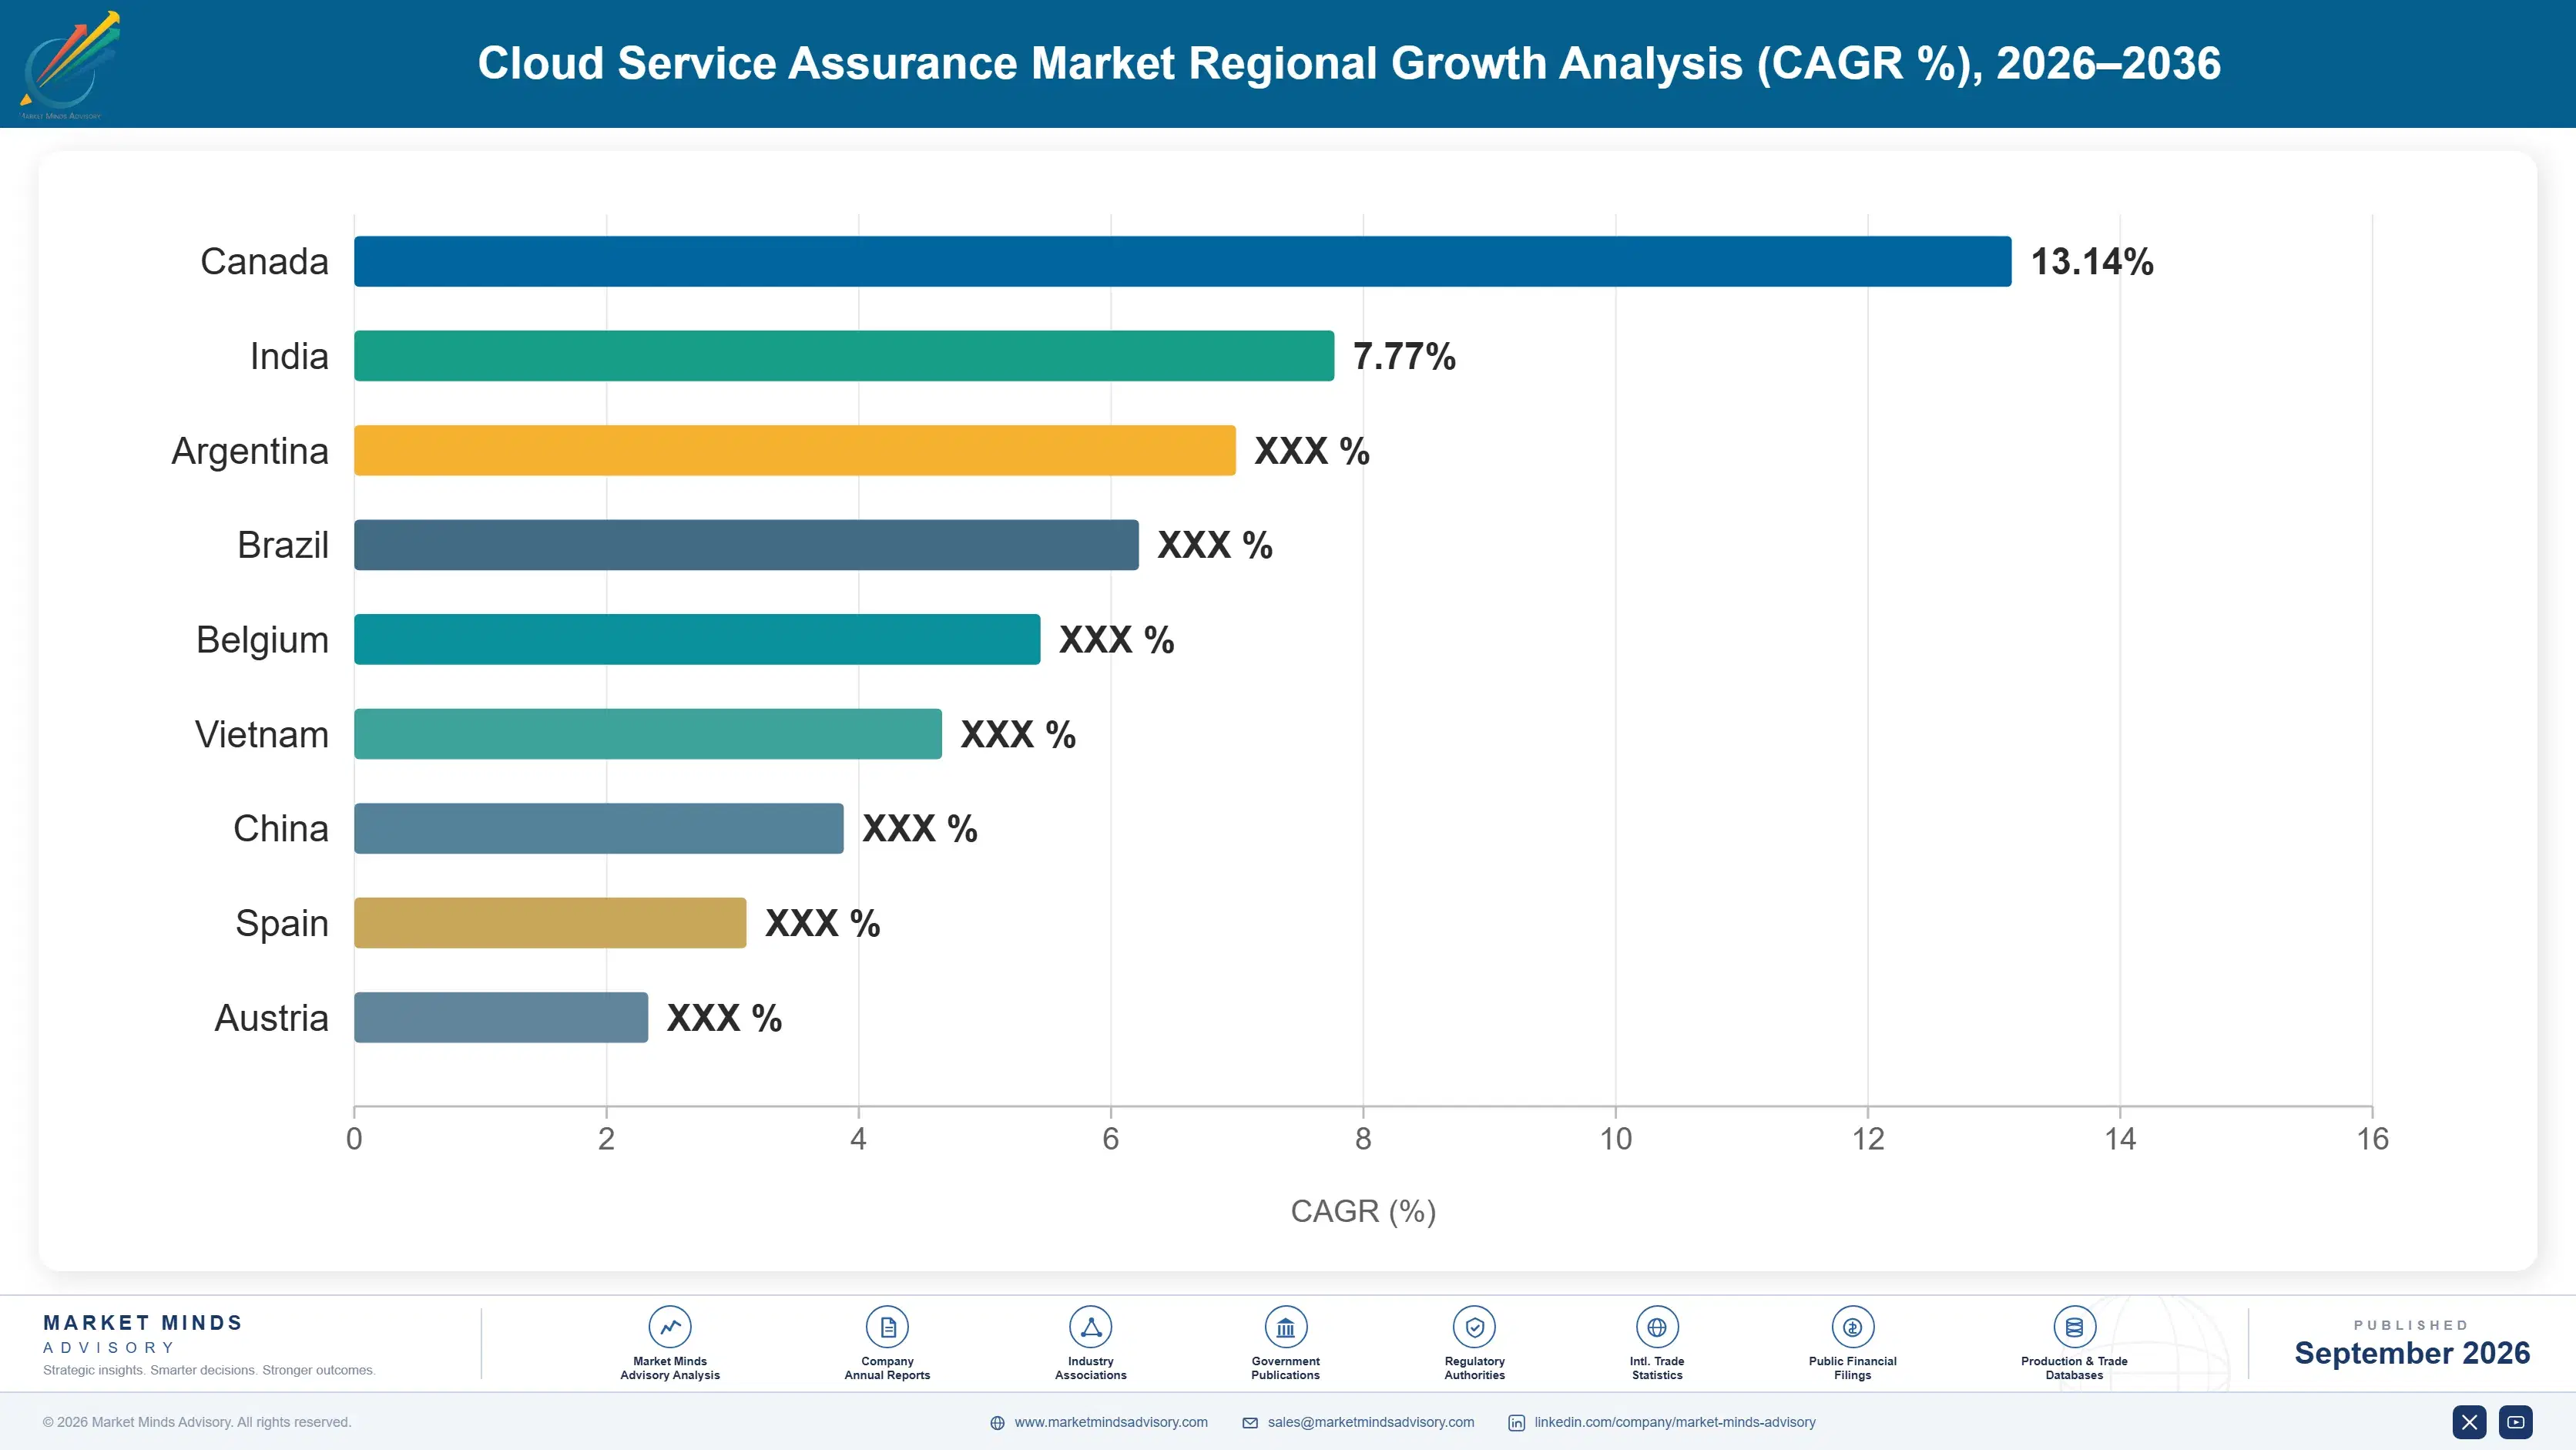
North America holds 38% of software and service revenue, above the standard band, because enterprise cloud spending and engineering compensation are both highest here and assurance pricing scales with both. South Asia and Pacific grows fastest at 14.2% on engineering concentration rather than on cloud footprint.

North America

North America holds 38% of software and service revenue, above the 32% band ceiling, because assurance spending scales with cloud footprint and enterprise cloud consumption is deepest here by a considerable margin. Datadog, Splunk, New Relic, Elastic and most of the specialist monitoring vendors operate from here, and the reliability engineering practices this category sells originated at American technology firms. Assurance spending near 23% of cloud cost consequently applies to the largest cloud bills anywhere. Growth at 11.2% sits below the global rate because renegotiation pressure falls hardest on the largest accounts. Renegotiation pressure falls hardest on the largest accounts, which is why growth sits below the global rate despite the concentration.
Share: 38% | CAGR: 11.2% (2026 to 2036)

Western Europe

Twenty-two percent of software and service revenue reaches Western Europe, where data residency requirements shape deployment more than anywhere else. Telemetry frequently contains personal data incidentally, which obliges European customers to control where it is processed and stored, and several vendors built regional processing specifically for that reason. Dynatrace operates from Austria and holds a genuine position across European enterprises. Cost scrutiny runs harder here than in North America, which suppresses ingestion growth. Growth at 10.6% is the slowest of any region on that combination of constraint and discipline. Cost scrutiny runs harder here than in North America, which suppresses ingestion growth considerably across the region. Data residency shapes deployment here more than anywhere.
Share: 22% | CAGR: 10.6% (2026 to 2036)
Regional intelligence for 5 additional markets available in the complete report: East Asia, South Asia and Pacific, Latin America, Middle East and Africa, Eastern Europe. Contact sales@marketmindsadvisory.com.
cloud-service-assurance-market-country-cagr-analysis-1789991932685

How Vendors Hold Their Position

Data volume grows every year without anybody actually choosing it, the technical lock-in that once justified ingestion pricing has effectively gone, and most alerts these tools produce are ignored by the people receiving them. Each of the four levers below responds to one of those facts rather than to any argument about analytical capability.

Price On Something Customers Can Predict

Telemetry volume grows around 38% annually without deliberate change, assurance spending has reached near 23% of underlying cloud cost, and customers renegotiate every 14 months on median. That is a relationship where vendor growth is customer pain, and portable instrumentation now lets an organisation cut ingestion without changing anything else. Pricing on hosts, responders or predictable tiers removes the single largest cause of switching in this category. Vendors defending ingestion pricing are defending the mechanism that generates their own churn. Predictability rather than unit price is the concern customers actually raise.
Market Impact: Renegotiation now runs every 14 months on median

Compete On Analysis, Not On Collection

Portable instrumentation covers around 57% of deployments, which means the data a customer collects is no longer tied to whoever stores it and moving a stream to a different backend is configuration rather than engineering. Collection was the moat and it has gone. What remains defensible is correlation across signals, incident context and workflow integration that actually shortens resolution. Vendors whose product advantage rested on proprietary agents are discovering that the analytical layer requires entirely different capabilities from the ones that built the business. Renewals are genuinely contested for the first time.
Market Impact: Portable standards now reach fully 57% of deployments

Sell Fewer Alerts Rather Than More Coverage

Around 6% of generated alerts produce any engineering response, so the coverage argument that sold these platforms now produces noise teams have learned to ignore entirely. Selling additional instrumentation into that situation makes the problem worse and the customer knows it. Service level objective based alerting, deliberate threshold reduction and reporting alert action rate as a programme metric address what the customer actually experiences. Very few vendors will make an argument that implies collecting less, and the ones who do are winning renewals. Arguing for less collection is uncomfortable and it wins renewals.
Market Impact: Only 6% of alerts get any engineering action

Reach Engineering Concentrations, Not Cloud Footprints

Seat and responder priced products follow the people who operate systems rather than the systems themselves, and India compounds at 17.6% because technology services organisations there run platforms for customers everywhere else. That demand does not appear in any model built from regional cloud consumption. Vendors targeting territories by cloud spending are missing a growing population of operators whose employers sit elsewhere, and reaching them requires local presence rather than following a customer's headquarters. Reaching them requires local presence rather than following a customer headquarters, and vendors targeting territories by cloud spending miss that population entirely.
Market Impact: India compounds at 17.6% on engineering density alone

Who Controls the Margin Pool

Five vendors hold 44% of cloud service assurance software and service revenue, and the position underneath that changed more than the share suggests. Datadog, Splunk, Dynatrace, New Relic and Elastic built businesses on proprietary instrumentation that is now portable in around 57% of deployments. Specialist providers including Grafana Labs, Honeycomb and Chronosphere compete specifically on pricing model. All participants are assessed on software and service revenue.
Competition has moved from collection to analysis and the incumbents find that ground less comfortable. When instrumentation was proprietary, having the agent installed was most of the battle and renewal followed almost automatically. Correlation quality, incident context and workflow integration are harder to demonstrate in an evaluation and easier for a customer to compare directly, which has made renewals genuinely contested for the first time.

Rankings shift on pricing model rather than on capability, since customers renegotiating every 14 months are motivated to move and can now do so cheaply. The second pressure is the hyperscale providers, whose bundled monitoring is adequate for many workloads and included in a bill the customer is already paying without any separate approval.
cloud-service-assurance-market-company-positioning-matrix-1789991933213

Competitive Moat and Risk Dimensions

DATADOG

Moat: Correlated Signal Breadth

Datadog correlates metrics, traces, logs and user experience data in one platform, so an engineer investigating an incident moves between signals without reconciling separate tools during the moments when reconciliation is hardest. That breadth took years of product development across several distinct problem domains. Assembling equivalent coverage from specialist products means integration work customers must perform and maintain themselves.
DATADOG

Risk: Ingestion Pricing Exposure

Revenue scales with telemetry volume growing around 38% annually without customer intent, which produces bills that trigger renegotiation every 14 months on median. Portable instrumentation now lets customers reduce ingestion without switching vendor or rewriting anything. The pricing model that drove the growth is now the mechanism generating the churn.
DYNATRACE

Moat: Automated Dependency Discovery

Dynatrace maps application and infrastructure dependencies automatically rather than requiring engineers to configure relationships manually, which matters enormously in estates too large and too dynamic for anybody to describe accurately. That automation is difficult to build and difficult to match, and enterprises with sprawling legacy alongside cloud value it more than newer organisations do.
DYNATRACE

Risk: Proprietary Agent Dependency

The automation depends on a vendor specific agent while around 57% of deployments have moved to portable instrumentation that deliberately separates collection from the backend. Customers standardising on open collection find the automated discovery harder to obtain. Defending a proprietary agent against an open standard is a position with a limited horizon regardless of technical merit.

Players Tracked

Prominent Players

Datadog
Splunk
Dynatrace
New Relic
Elastic

Other Key Players

Grafana Labs
Sumo Logic
ServiceNow
PagerDuty
Honeycomb
Chronosphere
Broadcom
IBM
Microsoft
Amazon Web Services
Google Cloud
Catchpoint
ThousandEyes
LogicMonitor
Coralogix

Recent Developments

FEBRUARY 2025

Chronosphere Extends Telemetry Control Ahead Of Backend Ingestion

Chronosphere extended capability for filtering and shaping telemetry before it reaches any storage backend, an organic product development rather than an acquisition or joint venture. Data volume grows around 38% annually without deliberate change, and ingestion priced observability turns that growth directly into a cost problem for every customer.
Signal: Selling customers a way to send less data is a genuinely uncomfortable position to build a business on.
SEPTEMBER 2024

Grafana Labs Expands Support For Portable Instrumentation Standards

Grafana Labs expanded support for open instrumentation standards across its observability products, an organic development rather than any transaction. Portable instrumentation now covers around 57% of deployments, which separates data collection from the storage and analysis backend and removes the technical lock-in that justified ingestion pricing.
Signal: Collection was the moat for a decade and it has stopped being one almost entirely now.
JUNE 2025

Datadog Adds Predictable Pricing Tiers Alongside Volume Based Plans

Datadog introduced pricing arrangements less directly tied to ingested data volume alongside its existing plans, a commercial change rather than a merger or acquisition. Customers renegotiate observability contracts every 14 months on median, and predictability rather than unit price is the concern raised most consistently by them.
Signal: Vendors are finally addressing the pricing mechanism that generates most of their own customer churn today.

What Assurance Delivery Costs

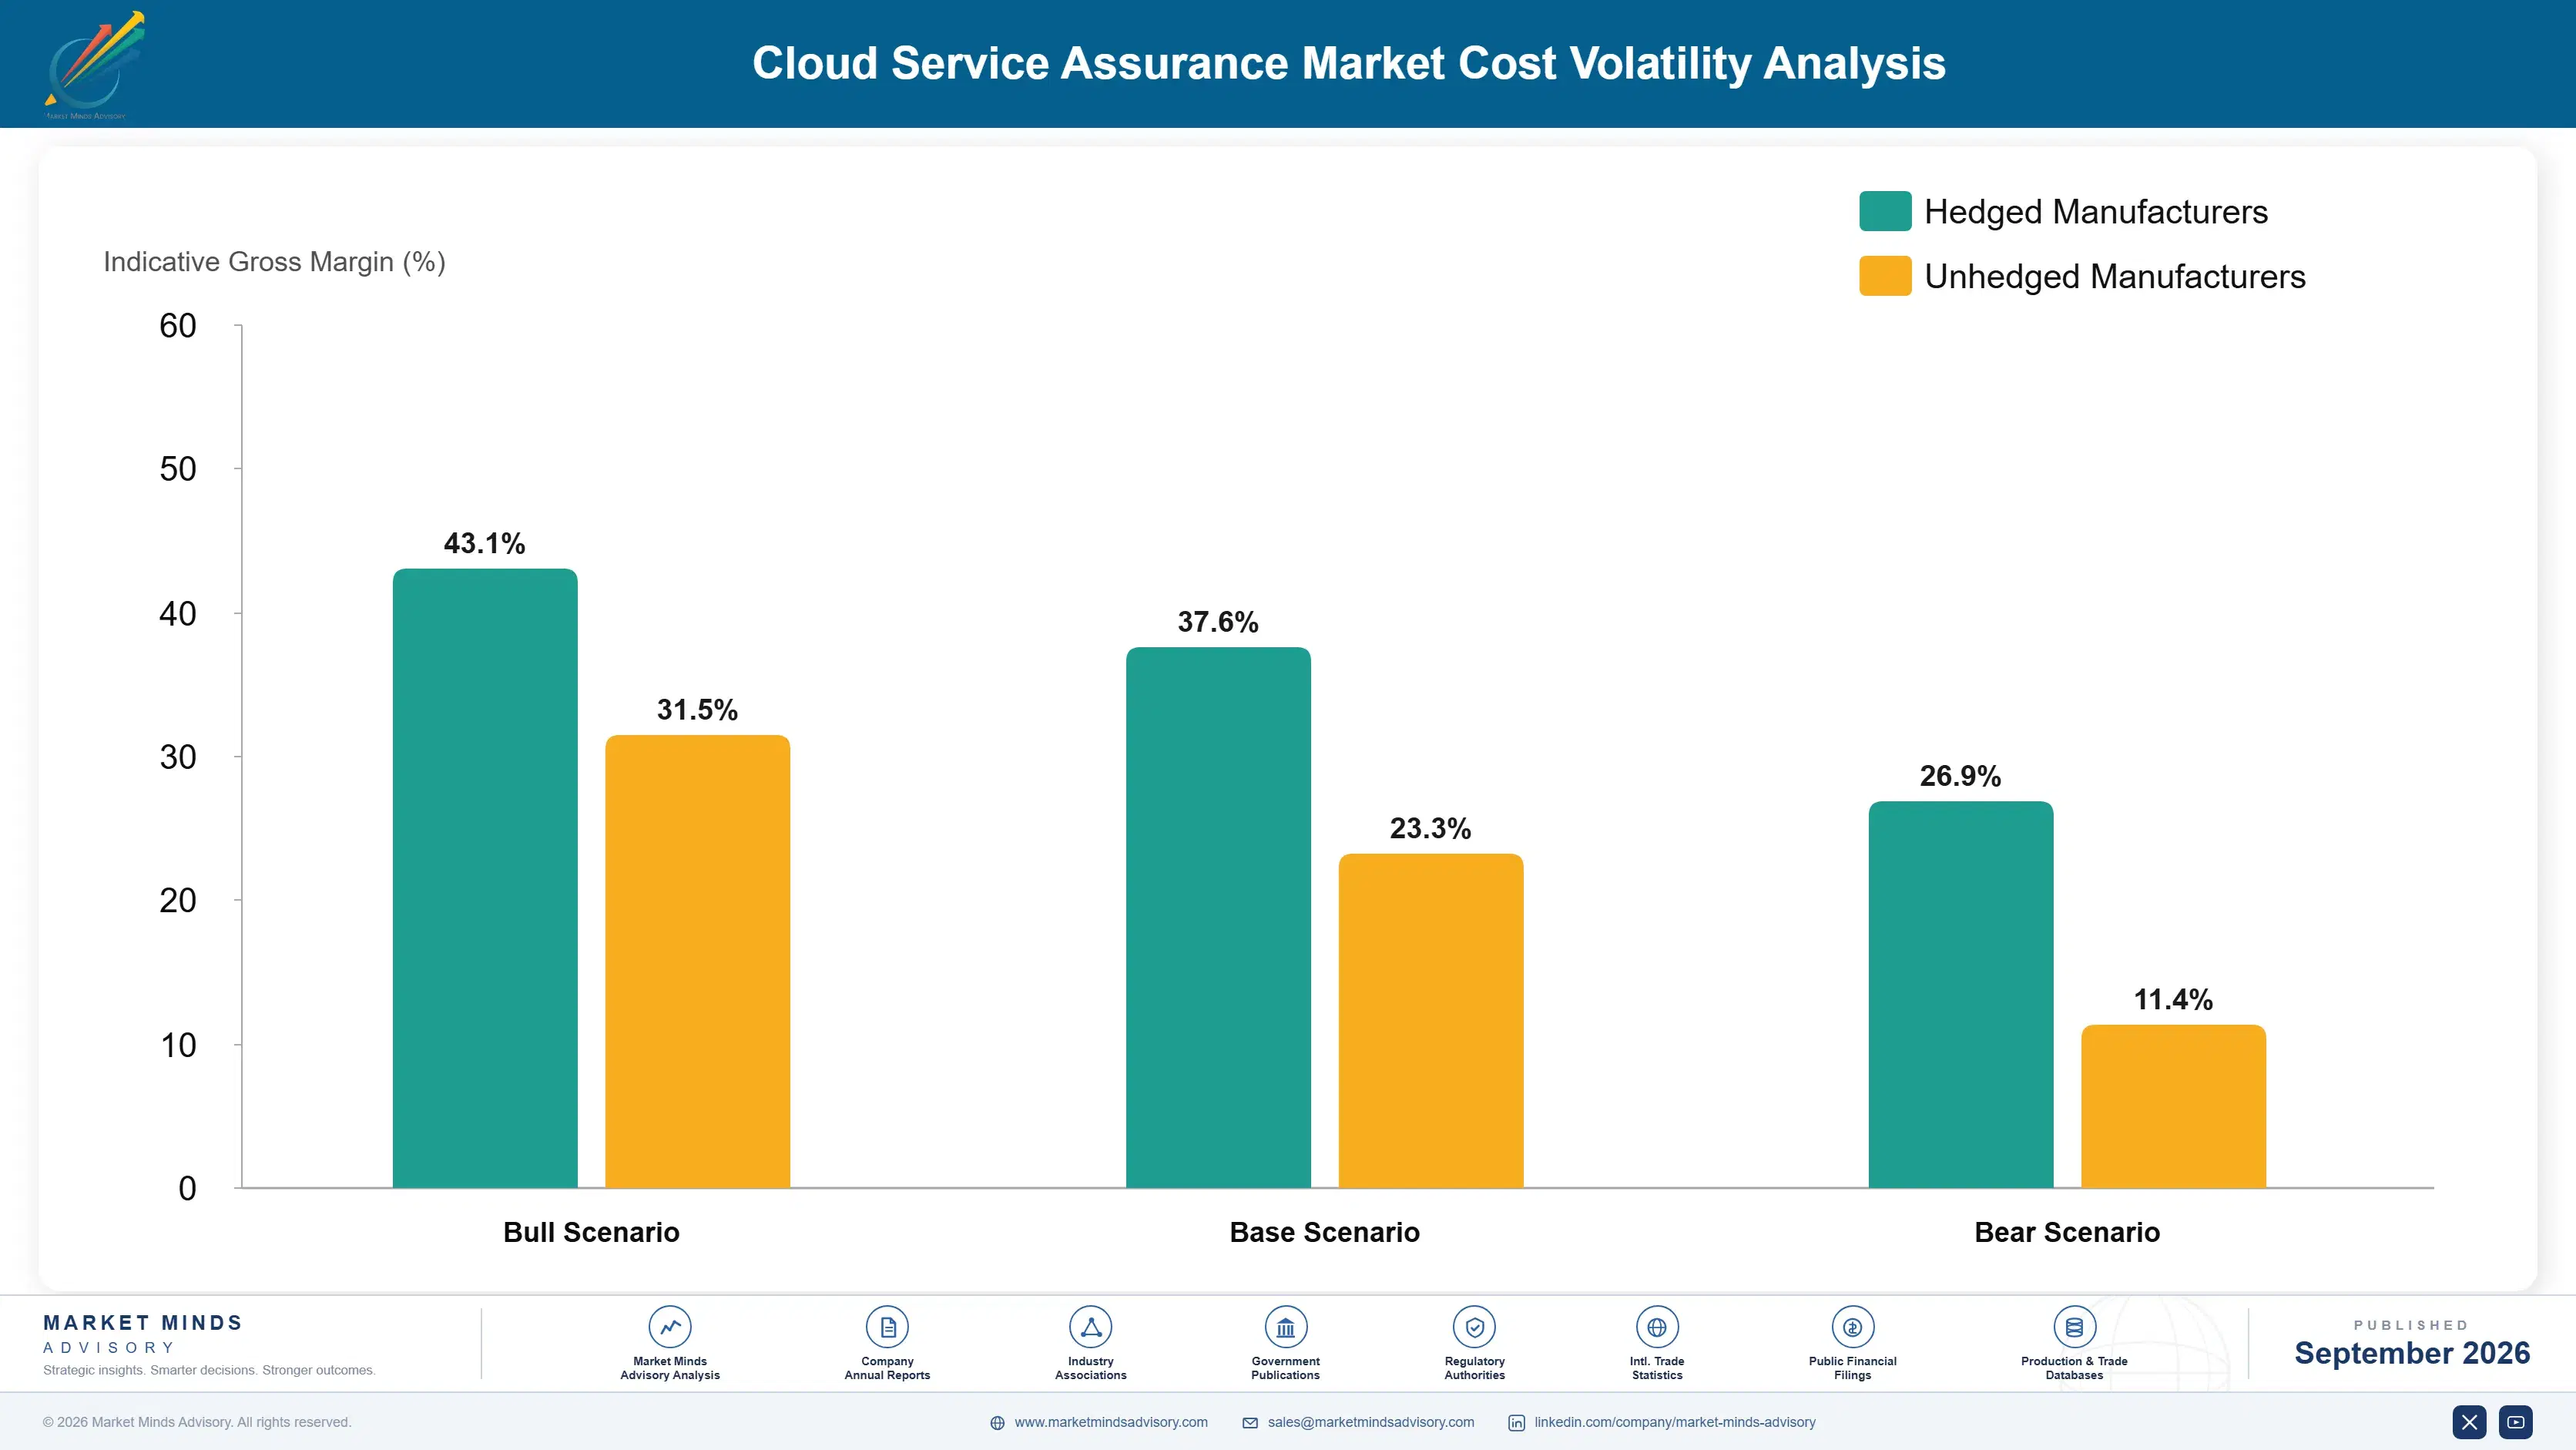
Cloud infrastructure accounts for roughly 39% of platform cost, dominated by the storage and query capacity that ingested telemetry requires and rising directly with customer data volume. Engineering salaries carry around 33%, weighted toward distributed systems specialists who are expensive in every market. Customer support and solutions engineering absorb about 14%, and sales plus marketing take the remaining balance of a heavily contested category.
Cloud storage and compute pricing rose across major providers through 2023 and 2024, which affects this category more than most because ingestion volume is the cost driver and it grows around 38% annually regardless of what customers pay. Datadog Annual Report 2024 and Elastic Annual Report 2024 both record infrastructure cost as a principal operating variable. Vendors on committed pricing absorbed volume growth directly, since a contract does not reprice when telemetry doubles.

The competitive disadvantage mechanism is storage architecture rather than any commercial term. A vendor storing all telemetry at full fidelity carries infrastructure cost scaling with ingestion, while one storing aggregates with selective full retention carries far less for substantially the same analytical value. Exposure concentrates among vendors whose architecture assumed cheap storage and unlimited retention.
cloud-service-assurance-market-cost-volatility-analysis-1789991933410

Store Aggregates And Retain Detail Selectively

Cloud infrastructure runs around 39% of platform cost and scales with ingestion volume growing 38% annually. Most analytical questions are answered from aggregates rather than from every individual record, and full fidelity retention matters only for recent data and for traces containing errors. Architecting around that rather than storing everything cuts infrastructure cost substantially with almost no loss anybody notices.

Push Filtering To The Customer Edge Deliberately

Ingestion volume drives both vendor cost and customer bills, which aligns interests in a way ingestion pricing obscures completely. Offering customers effective filtering and sampling before data leaves their environment reduces vendor infrastructure cost alongside the customer's bill. Vendors resist because it reduces revenue under volume pricing, which is precisely why the pricing model needs changing before the architecture can.

Consolidate Query Engines Across Signal Types

Engineering runs about 33% of platform cost and vendors frequently maintain separate storage and query engines for metrics, logs and traces because those products were built at different times by different teams. The underlying access patterns overlap far more than the internal organisation suggests. Consolidating removes duplicated engineering across the most expensive talent pool this category competes for.

Portfolio Architecture for Margin Defence

Margin architecture separates on whether the revenue scales with data or with people. Infrastructure metrics and log management earn least, since both carry the highest storage cost per unit of revenue and face the strongest bundled alternatives from cloud providers. Network and service level assurance sit in the middle. Tracing, incident response and digital experience monitoring earn most, though for entirely different reasons in each case.
The volume versus premium tension is really a pricing model choice with architectural consequences. Volume pricing produced enormous growth and produced the renegotiation cycle alongside it, and it obliges an architecture that stores everything. Seat and responder pricing grows slower, remains predictable and lets a vendor store far less. Vendors built entirely on the first model cannot move to the second without rebuilding both the product and the revenue expectation.

High-value pools concentrate in incident response tooling and in correlated analysis, and neither depends on collecting more data. Incident response is priced per responder rather than per gigabyte, which removes the renegotiation problem completely. Correlated analysis is what remains defensible once instrumentation became portable. Both reward capabilities different from the ones that built these businesses, which is the uncomfortable position the category now occupies.

Volume / Commodity-Adjacent

Infrastructure metrics and log management, carrying the highest storage cost per unit of revenue against bundled alternatives cloud providers include at no separate charge. The ten point spread separates vendors with aggregate based storage architecture from those retaining everything at full fidelity indefinitely.
Gross Margin: 56% to 66%

Premium / Certified

Cloud network performance assurance and service level contract assurance, sold on measurement credibility rather than on data breadth. The ten point spread tracks how much of a vendor's revenue arrives on predictable terms rather than on ingestion volume that customers renegotiate every fourteen months.
Gross Margin: 70% to 80%

Sustainability / Regulatory / Next-Generation

Distributed tracing, incident response platforms and digital experience monitoring, where analysis quality rather than collection breadth determines value. The eight point spread reflects pricing model, since responder based products avoid the renegotiation cycle that ingestion based products cannot escape at all.
Gross Margin: 82% to 90%
cloud-service-assurance-market-portfolio-architecture-1789991933912

High-value Sub-segments and Strategic Watch-out

Distributed Tracing And Application Observability

Grows at 18.0% because a request crossing forty services leaves no single log anybody can read afterwards to explain it. The eight point spread reflects storage architecture. Trace data is voluminous, which makes it the most expensive telemetry any customer produces. Sampling loses the rare cases.
Gross Margin: 82% to 90%

Incident Response And Reliability Platforms

Grows at 15.4% as reliability practice spreads from technology firms into banks, retailers, insurers and industrial operations everywhere. The eight point spread reflects workflow depth. Pricing per responder rather than per gigabyte removes the renegotiation cycle entirely from the relationship. Predictable cost is unusual here.
Gross Margin: 82% to 90%

Synthetic And Digital Experience Monitoring

Grows at 13.2% on measuring what users actually experience rather than what internal infrastructure metrics happen to report about it. The eight point spread reflects measurement network reach. This is the only signal that reflects the customer rather than the system serving them. Everything else measures the system.
Gross Margin: 82% to 90%

Infrastructure Metrics And Log Management

Grows at 6.2%, slowest of the six functions, against bundled monitoring cloud providers include in bills customers already pay without separate approval. The ten point spread reflects storage efficiency. Highest storage cost per unit of revenue in the whole category. Cloud providers bundle an adequate alternative.
Gross Margin: 56% to 66%

What Actually Holds A Customer

The annuity used to be instrumentation and now it is workflow. Embedding a vendor agent throughout application code made switching an engineering programme, which held customers through pricing they disliked for years. Portable instrumentation removed that, and what holds a customer now is dashboards built over time, alert definitions tuned by people who have left, and incident procedures written around a particular tool. That is real switching cost and considerably weaker than code level lock-in was.
Depth varies with how far the tool reaches into operational practice. A platform carrying on-call rotation, incident command and post-incident review is embedded in how an organisation responds to failure and moves only during a deliberate change programme. A metrics store behind a dashboard is genuinely substitutable and moves whenever the bill becomes annoying enough, which portable collection has made straightforward.

The buyer moved from a central operations function to individual engineering teams and then partly back again. Teams adopted tools directly and expensed them, cost grew to around 23% of cloud spending, and central functions reasserted control to consolidate the resulting sprawl. Vendors who won through team adoption now face procurement organisations comparing platforms formally.
cloud-service-assurance-market-end-use-penetration-index-1789991934405

What Decides Renewals Now

These are among the four positions where our research anticipates prominent divergence between winners and laggards over the coming forecast period. Each is grounded in the demand model, the regulatory perimeter, and the announced capacity pipeline.
01 / PRICING MODEL REFORM

Charge For Something Customers Can Forecast

Telemetry volume grows around 38% annually without any deliberate change, assurance spending has reached near 23% of underlying cloud cost, and customers now renegotiate every 14 months on median across the category. That is a commercial relationship in which vendor revenue growth is directly the customer's cost problem, and portable instrumentation lets an organisation cut ingestion without changing anything else at all. Vendors defending volume pricing are defending the precise mechanism that generates most of their own customer churn every year.
02 / ANALYSIS LAYER DIFFERENTIATION

Win Where The Agent No Longer Does

Portable instrumentation covers around 57% of deployments, which means collected data is no longer tied to whoever stores it and moving a telemetry stream to a different backend is a configuration change rather than an engineering programme. Collection was the moat for a decade and it has effectively gone. What remains defensible is correlation across signals, incident context and workflow integration that genuinely shortens resolution, and all of those reward entirely different capabilities from the ones that originally built these businesses.
03 / ALERT QUALITY ARGUMENT

Sell Silence Rather Than More Coverage

Around 6% of generated alerts produce any engineering response at all, which means teams have learned to disregard the overwhelming majority of what their monitoring tells them every single day. The coverage argument that sold these platforms now actively produces the noise problem, and selling additional instrumentation into that situation makes it worse in ways customers understand perfectly well. Service level objective based alerting and reported action rates address what the customer actually experiences every day, and very few vendors will make that argument.
04 / OPERATOR GEOGRAPHY COVERAGE

Follow The Engineers, Not The Workloads

Seat and responder priced products follow the people who operate systems rather than the systems themselves, and India compounds at 17.6% because technology services organisations there run platforms for customers located everywhere else in the world. That demand appears nowhere in any model built from regional cloud consumption figures. Vendors targeting territories by cloud spending are missing a large and growing population of operators whose employers and contracts happen to sit somewhere else entirely, which no cloud spending model captures.

Engagement Snapshot From the Field

A live engagement with an industry participant carrying material or product regulatory and market exposure ahead of a defining policy shift, showing how our research translates into a defensible multi-year portfolio strategy.
MARKET MINDS ADVISORY · CLIENT ENGAGEMENT SUMMARY
Cloud Service Assurance Producer Strategic Portfolio Review and Transition Roadmap 2026·Investment Scenario on Cloud Service Assurance Exposure Evaluation 2025-26
CLIENT PROFILE
A European financial services group running around 900 services across three cloud providers, with observability spending that had grown for four consecutive years and had reached an uncomfortable fraction of the cloud bill. Four business units had adopted different platforms independently. Central technology had been asked to consolidate and had no basis for choosing between them.
STRATEGIC CHALLENGE
Each business unit defended its own platform on capability grounds that were genuinely difficult to compare. Finance wanted the total reduced and did not care which tool survived. Nobody had measured what proportion of collected telemetry was ever queried, or how many alerts across all four platforms produced any engineering action at all.
MMA APPROACH
MMA measured query rates against ingested data by signal type, and alert action rates across all four platforms over twelve months. We assessed how much telemetry could be filtered before ingestion without affecting any query anybody actually ran, and modelled consolidation against migration effort under portable instrumentation. The work drew on 47 expert interviews conducted in Q4 2025 with vendors, enterprises and reliability engineering specialists.
KEY FINDINGS
  1. Around 8 in 10 ingested log records were never queried once across the full twelve month period, and retention had been set to a default nobody revisited.
  2. Alert action rates ran between 3% and 9% across the four platforms, and the platform generating most alerts had the lowest action rate of all.
  3. Filtering before ingestion could have reduced volume by roughly 60% without affecting any query the group had actually run (client-reported, unverified by MMA).
  4. Portable instrumentation already covered 2 of the 4 estates, which made consolidating those two considerably cheaper than the business units had assumed.
CLIENT PROFILE
A European financial services group running around 900 services across three cloud providers, with observability spending that had grown for four consecutive years and had reached an uncomfortable fraction of the cloud bill. Four business units had adopted different platforms independently. Central technology had been asked to consolidate and had no basis for choosing between them.
STRATEGIC CHALLENGE
Each business unit defended its own platform on capability grounds that were genuinely difficult to compare. Finance wanted the total reduced and did not care which tool survived. Nobody had measured what proportion of collected telemetry was ever queried, or how many alerts across all four platforms produced any engineering action at all.
MMA APPROACH
MMA measured query rates against ingested data by signal type, and alert action rates across all four platforms over twelve months. We assessed how much telemetry could be filtered before ingestion without affecting any query anybody actually ran, and modelled consolidation against migration effort under portable instrumentation. The work drew on 47 expert interviews conducted in Q4 2025 with vendors, enterprises and reliability engineering specialists.
KEY FINDINGS
  1. Around 8 in 10 ingested log records were never queried once across the full twelve month period, and retention had been set to a default nobody revisited.
  2. Alert action rates ran between 3% and 9% across the four platforms, and the platform generating most alerts had the lowest action rate of all.
  3. Filtering before ingestion could have reduced volume by roughly 60% without affecting any query the group had actually run (client-reported, unverified by MMA).
  4. Portable instrumentation already covered 2 of the 4 estates, which made consolidating those two considerably cheaper than the business units had assumed.
RECOMMENDED STRATEGY
Phase 1: Phase one: filter and sample telemetry before ingestion across all four platforms, which reduces cost immediately without any consolidation decision. Phase 2: Phase two: consolidate the two estates already using portable instrumentation, since migration there is configuration work rather than any engineering. Phase 3: Phase three: report alert action rate by platform monthly, and remove alert definitions that have produced no action in six months.
OUTCOME
The group filtered telemetry before consolidating and reduced ingestion substantially in the first quarter (client-reported, unverified by MMA). Two estates consolidated afterwards at a fraction of the estimated effort, and alert action rates improved as unused definitions were removed. Alert action rate is now reported alongside cost, which is the change that outlasted the engagement itself.

Frequently Asked Questions

Foundational context covering the market sizes, CAGR, scope, country, region and competition that inform every finding below. This section is provided to cover basics and most often pre-purchase conversations, answered from the MMA Primary Research Dataset.

What is the current size of the Cloud Service Assurance Market?

Global value reaches USD 16.58 billion in 2026, measured as cloud service assurance software and service revenue across six functions. The 2025 base is USD 14.8 billion.

How large will the Cloud Service Assurance Market be by 2036?

Software and service revenue reaches USD 51.49 billion by 2036, an increase of USD 34.91 billion over the forecast period. That represents 3.11 times expansion from the 2026 base.

What is the CAGR for the Cloud Service Assurance Market 2026 to 2036?

The base case runs at 12.0% annually, with a bull case at 13.4% if vendors move pricing off ingestion volume and a bear case at 10.7% if customers deliberately reduce telemetry collected.

Which segment is growing fastest?

Distributed tracing and application observability grow at 18.0%, half again the market rate of 12.0%. A request crossing forty services leaves no single log that explains what happened to it.

Who are the major companies in the Cloud Service Assurance Market?

Datadog, Splunk, Dynatrace, New Relic and Elastic lead on software and service revenue, together holding 44%. Grafana Labs, Honeycomb and Chronosphere compete specifically on pricing model instead.

Which country is growing fastest?

India leads at 17.6%, because technology services organisations there operate platforms for customers worldwide, which concentrates the engineers using these tools. Indonesia and Brazil follow.

Report Segmentation Architecture

The full report scope spans multiple orthogonal segmentation dimensions, with cross-tabulated demand data provided for each dimension pair. Coverage extends further to regional breakdowns, trend trajectories, and the competitive detail needed to support segment-level decision-making.

By Assurance Function

  • Distributed Tracing And Application Observability
  • Incident Response And Reliability Engineering Platforms
  • Synthetic And Digital Experience Monitoring
  • Cloud Network Performance Assurance
  • Service Level And Contract Assurance
  • Infrastructure Metrics And Log Management

By End-Use Industry

  • Financial Services And Banking
  • Retail And Digital Commerce
  • Media And Streaming Platforms
  • Technology And Software Companies
  • Telecommunications Operators
  • Government And Public Services

By Commercial Dimension

  • Direct Enterprise Subscription
  • Usage And Ingestion Based Pricing
  • Cloud Marketplace Distribution
  • Managed Service Provider Delivery
  • Open Source Commercial Support
  • Team Level Self Service Adoption

By Region

  • North America
  • Western Europe
  • East Asia
  • South Asia and Pacific
  • Latin America
  • Middle East and Africa
  • Eastern Europe

Scope, Methodology, and Coverage

Every figure in this report is reproducible from documented input assumptions. The scope below maps the historical period, the forecast horizon, the segmentation dimensions, and the countries covered, alongside the underlying primary and qualitative methodology.
Historical Period
2020 to 2025
Forecast Period
2026 to 2036
Base Year
2025 (USD billions; MMA Primary Research Dataset, September 2026)
Market Definition
This report covers software and services that assure the performance, availability and quality of cloud delivered services: distributed tracing and application observability, synthetic and digital experience monitoring, service level and contract assurance, incident response and reliability engineering platforms, cloud network performance assurance, and infrastructure metrics and log management. It excludes security monitoring and threat detection, cloud cost optimisation tools without performance function, application development platforms, configuration management, and network hardware.
Quantitative Units
USD millions, software and service revenue basis; monitored hosts and services; telemetry ingested in gigabytes; alert action rate as a percentage; contract renegotiation intervals in months.
Segmentation Dimensions
Assurance function; customer industry; commercial pricing and distribution model; geography across seven regions.
Regions Covered
North America, Western Europe, East Asia, South Asia and Pacific, Latin America, Middle East and Africa, Eastern Europe
Countries Covered
United States, Canada, Mexico, Brazil, Chile, United Kingdom, Germany, France, Netherlands, Austria, Sweden, Poland, Romania, Japan, South Korea, China, India, Indonesia, Australia, United Arab Emirates.
Key Companies Profiled
Datadog, Splunk, Dynatrace, New Relic, Elastic, Grafana Labs, Sumo Logic, ServiceNow, PagerDuty, Honeycomb, Chronosphere, IBM, Catchpoint, ThousandEyes, Coralogix.
Quantitative Methodology
Primary survey, n=3,800 respondents, Q4 2025, six countries; demand-side model with trade association cross-validation
Qualitative Methodology
47 expert interviews, Q4 2025; applied to validate demand model assumptions, identify emerging dynamics, and assess competitive positioning
Report Format
PDF and XLSX data workbook (Word format preview document)
Publisher
Market Minds Advisory
Report Code
MMA-2026-TEC-611
Published
September 2026
Contact
sales@marketmindsadvisory.com | www.marketmindsadvisory.com

Purchase the full Cloud Service Assurance Market Report (2026 to 2036).

This report sizes the global cloud service assurance market from 2026 to 2036 across six assurance functions, six customer industries and seven regions. It explains why telemetry growing 38% annually pushed assurance spending to around 23% of cloud cost, how portable instrumentation covering 57% of deployments removed the lock-in that justified ingestion pricing, and why only 6% of generated alerts produce any engineering response. Cost composition is sourced to company annual reports, with storage architecture analysed as the margin determinant. Regional analysis explains why India compounds at 17.6% on engineering concentration.
Six assurance functions sized through to 2036
Ingestion pricing economics modelled against customer switching
Storage cost composition drawn from company annual filings
Twenty named vendors assessed on service revenue
Four revenue levers with quantified commercial impact
Anonymised financial services observability engagement included in full

Built For The People Who Decide

From boardroom strategy to bench-side execution, this report is read cover-to-cover by leaders shaping the next decade of their industry, turning demand scenarios, market dynamics and valuation benchmarks into decisions.
CXOs/ Presidents/ VPs/ Managers
M&A and Corporate Development
Strategy Teams and R&D Heads
Procurement and Product Directors
Regulatory and Compliance Leaders
Investor Relations and Equity Analysts