Market Minds Advisory
Cloud Infrastructure-As-A-Service Market

Cloud Infrastructure-As-A-Service Market: Cloud Infrastructure-As-A-Service Market: Accelerated Compute, Power Constraints and Exit Economics, 2026 to 2036

Accelerated compute turned a software-margin business into a capital-intensive one. Utilisation and depreciation now decide the returns here, and a new grid connection takes roughly 41 months to arrive today.

Lead Analyst

Published

September 2026

Make Smarter Decisions with Customized Research Insights

Request a free sample report and evaluate market opportunities, growth trends, and competitive dynamics relevant to your business needs.

2025 MARKET VALUE$168.0BMarket Size 2025
2036 FORECAST VALUE$584.5BBase Case , 2026 to 2036
CAGR 2026 TO 203612.0 %Bull 13.2% / Bear 10.8%
INCREMENTAL OPPORTUNITY$396.3BNet 10- year value creation
EXPANSION MULTIPLE3.11x2036 value over 2026 base
Strategic Levers
M&A Pipeline
Regional Outlook
Country Rankings
Competitive Intelligence
Segmental Deep-dive
Call-Us : 91 93563 13602

Executive Snapshot and Market Trajectory.

This stopped being a software business the moment the accelerator fleet became the balance sheet. Accelerated compute already supplies 31% of revenue and grows at 18.0%, and renting it resembles leasing aircraft more than selling storage: utilisation, depreciation schedule, and power access decide the return. Utilisation currently averages 63%.
General purpose primitives tell the opposite story. Compute instances grow at 8.4% and storage at 9.2% under continuous price deflation, which is why the blended rate of 12.0% sits well below the figures the accelerated segment alone would suggest. Dedicated and sovereign infrastructure grows at 14.8% as residency requirements harden. North America holds 44% of service revenue, far above the standard band.
Power rather than silicon is the binding constraint. A new site waits about 41 months for its grid connection, which now decides where capacity is built and increasingly places it where electricity is available rather than where customers are. Five providers hold 76% of service revenue between them. Removing exit data transfer charges, long the industry's most effective retention mechanism, changed migration volumes only marginally, because the genuine switching cost was always operational attachment.
Market Definition
This market covers on-demand infrastructure primitives sold as a service, including general purpose compute instances, object and block storage services, accelerated and artificial intelligence compute services, networking and content delivery services, managed container and orchestration infrastructure, and dedicated and sovereign infrastructure services. It excludes platform and software application services, colocation and data centre real estate leasing, managed service provider labour, enterprise software licences running on the infrastructure, and customer premises hardware.
Base Year Value
$168.0B in 2025 (MMA Primary Research Dataset, September 2026)
Forecast Period
2026 to 2036, eleven discrete annual values
CAGR
12.0% base case. Bull 13.2%. Bear 10.8%.
Fastest Growth Segment
Accelerated And AI Compute Services: 18.0% CAGR
Fastest Growth Country
India: 19.4% CAGR
Fastest Growth Region
South Asia and Pacific: 14.2% CAGR
Largest Region
North America: 44% of 2025 global value
Market Leaders
Amazon Web Services, Microsoft, Google, Alibaba Cloud, and Oracle lead the field. Source: MMA Primary Research Dataset, July 2026.
Primary Survey
n=3,800 procurement and R&D decision-makers, Q4 2025, six countries
Methodology
Demand-side build-up, cross-validated against public data, 47 expert interviews

Cloud Infrastructure-As-A-Service Market Forecast Scenarios

cloud-infrastructure-as-a-service-market-size-forecast-scenario-1790011021916
Between 2020 and 2025 the composition of this market changed more than its size. General purpose compute and storage matured into price-deflating commodities where each renewal delivered more capacity for less money. Accelerated compute arrived and absorbed capital at a scale nobody had planned for. Historical growth of 11.0% blends a maturing commodity business with an emerging capital-intensive one, and describes neither on its own.
The base case at 12.0% rests on three mechanisms. Accelerated compute continues expanding at 18.0% as model training and inference workloads scale, though concentrated among a limited number of customers. Sovereign and dedicated infrastructure grows at 14.8% as residency requirements harden across several jurisdictions. And general purpose primitives keep deflating in price, which caps the blended rate well below the accelerated segment alone. The blend sits well below accelerated headline figures.
The bull case at 13.2% depends on inference demand broadening beyond the handful of customers currently funding most accelerated capacity, which would spread utilisation risk considerably. The bear case at 10.8% is a utilisation shortfall: capacity is committed years ahead against demand concentrated in few hands, and if those customers slow, the fleet still depreciates on schedule and the power contracts still run.

Capital Intensity Arrives Late

The economics of this business inverted quietly. For fifteen years it was a software-margin proposition built on commodity hardware amortised across many tenants. Accelerated compute changed that: the fleet is expensive, it depreciates fast, and utilisation decides whether the investment returns anything at all. Utilisation currently averages 63%, which is a number aircraft lessors would recognise immediately.
TOP FIVE CONCENTRATION76%Share of service revenue held by the leading providers
ACCELERATED REVENUE SHARE31%Revenue arising from accelerated rather than general purpose compute
COMMITTED SPEND COVERAGE68%Revenue under multi-year commitment rather than on demand
AVERAGE UTILISATION RATE63%Share of provisioned capacity actually consumed by customers
WORKLOAD REPATRIATION SHARE8%Enterprise workloads moved back to owned infrastructure annually
GRID CONNECTION WAIT41 monthsTypical delay before new capacity receives its power connection
Exit pricing produced the most interesting non-event of recent years. Data transfer charges were the industry's most effective retention mechanism for a decade and a half, and regulatory pressure removed them for customers leaving. Almost nothing happened. The real switching cost was never the transfer fee; it is the managed services, identity architecture, and operational practice built around one provider's particular way of doing things.
Power has replaced silicon as the constraint that decides outcomes. A new site waits around 41 months for a grid connection in most developed markets, which increasingly puts capacity where electricity is available rather than where customers are. That is a genuine change in how this industry plans, and it advantages providers who secured generation or connection rights early over those with better technology.
"The moment somebody described their accelerator fleet as a depreciating asset with a utilisation target, this became a different industry. That is aircraft leasing with better margins and worse residual values. The people who understand it best in five years will be the ones who came from infrastructure finance rather than from software."
Practice Director, Cloud Infrastructure and Digital Platforms · MMA Technology Practice · September 2026

Market Trends

Accelerated Compute Rewrites The Underlying Economics

General purpose infrastructure was amortised across many tenants at software-like margins, and accelerated compute is not. The fleet is expensive, depreciates on a short schedule, and returns nothing while idle, which makes utilisation the governing variable rather than gross margin on a primitive. Accelerated services already supply 31% of revenue and grow at 18.0%, and they concentrate demand among a limited number of customers whose capacity decisions now move a provider's whole return. Broadening into inference across many smaller buyers is the obvious remedy, and it is progressing slowly. Very few organisations can fund training at frontier scale.
Market Impact: Segment grows at 14.8%
Removing Egress Fees Changed Almost Nothing

Data transfer charges were the most effective retention mechanism this industry ever built, and regulatory pressure obliged providers to waive them for departing customers. Migration volumes barely moved. The genuine switching cost is the managed services, identity architecture, and operational practice built around a provider's particular approach, none of which travels. Around 8% of enterprise workloads move back to owned infrastructure annually, and those are overwhelmingly steady predictable workloads rather than variable ones. Those are steady predictable workloads with known capacity requirements, and variable or accelerated workloads do not follow them back.
Market Impact: Connection takes 41 months

Market Opportunities and Growth Drivers

Residency Requirements Create Sovereign Capacity Demand

Governments and regulated industries increasingly require infrastructure operated within national borders under local legal control, and no amount of encryption satisfies a requirement written about jurisdiction rather than security. Dedicated and sovereign services grow at 14.8% accordingly. Indian growth of 19.4% leads every country covered, combining data localisation rules with enterprise adoption expanding quickly from a comparatively low base. The buyer is a compliance function rather than an engineering one. Margins are better than general purpose primitives, because a legal requirement removes price comparison entirely from the conversation. Operational overhead on isolated capacity is genuinely higher.
Market Impact: Covers 68% of revenue

Power Availability Now Decides Where Capacity Lands

A new site waits about 41 months for a grid connection across most developed markets, and generation capacity rather than land or construction cost determines what is feasible. Providers holding connection rights or generation agreements can build where competitors cannot, regardless of technical capability. That has begun placing capacity where electricity is abundant rather than where customers sit, which changes latency planning and regional revenue distribution together. Providers who secured generation rights years ago hold an advantage no balance sheet replicates quickly, and it compounds with every year that queues lengthen further. Latency planning changes with it.
Market Impact: Compute grows at 8.4%

Market Restraints and Challenges

Utilisation Risk Sits With A Few Customers

Accelerated capacity is committed years ahead against demand concentrated among a small number of buyers, and the root cause is that model training at frontier scale is affordable to very few organisations. Commercially this means a provider's fleet depreciates on schedule and its power contracts run regardless of whether those customers continue. Providers respond by broadening into inference workloads, by seeking multi-year commitments that already cover 68% of revenue, and by staging capacity additions. Revenue per customer falls sharply as they broaden, and the aggregate becomes considerably more durable. Staging capacity additions reduces the exposure without removing it.
Market Impact: Supplies 31% of revenue

Price Deflation Erodes The Commodity Primitives

General purpose compute grows at 8.4% and storage at 9.2% while delivering more capacity per unit of spending each year, and the root cause is that competition on undifferentiated primitives has nowhere to go except price. Commercially this caps the blended growth rate well below what accelerated services alone would produce. Providers respond by attaching managed services above the primitives, by committing customers to multi-year terms, and by shifting investment toward accelerated capacity. Managed service attachment is the only defence anybody has found against undifferentiated capacity pricing. Each renewal delivers more capacity for less money.
Market Impact: Moves 8% of workloads
4 additional market trends, 3 additional growth drivers, and 2 additional restraints and challenges are covered in the full report. Contact sales@marketmindsadvisory.com to access the complete intelligence.

Segment CAGR and Growth Architecture

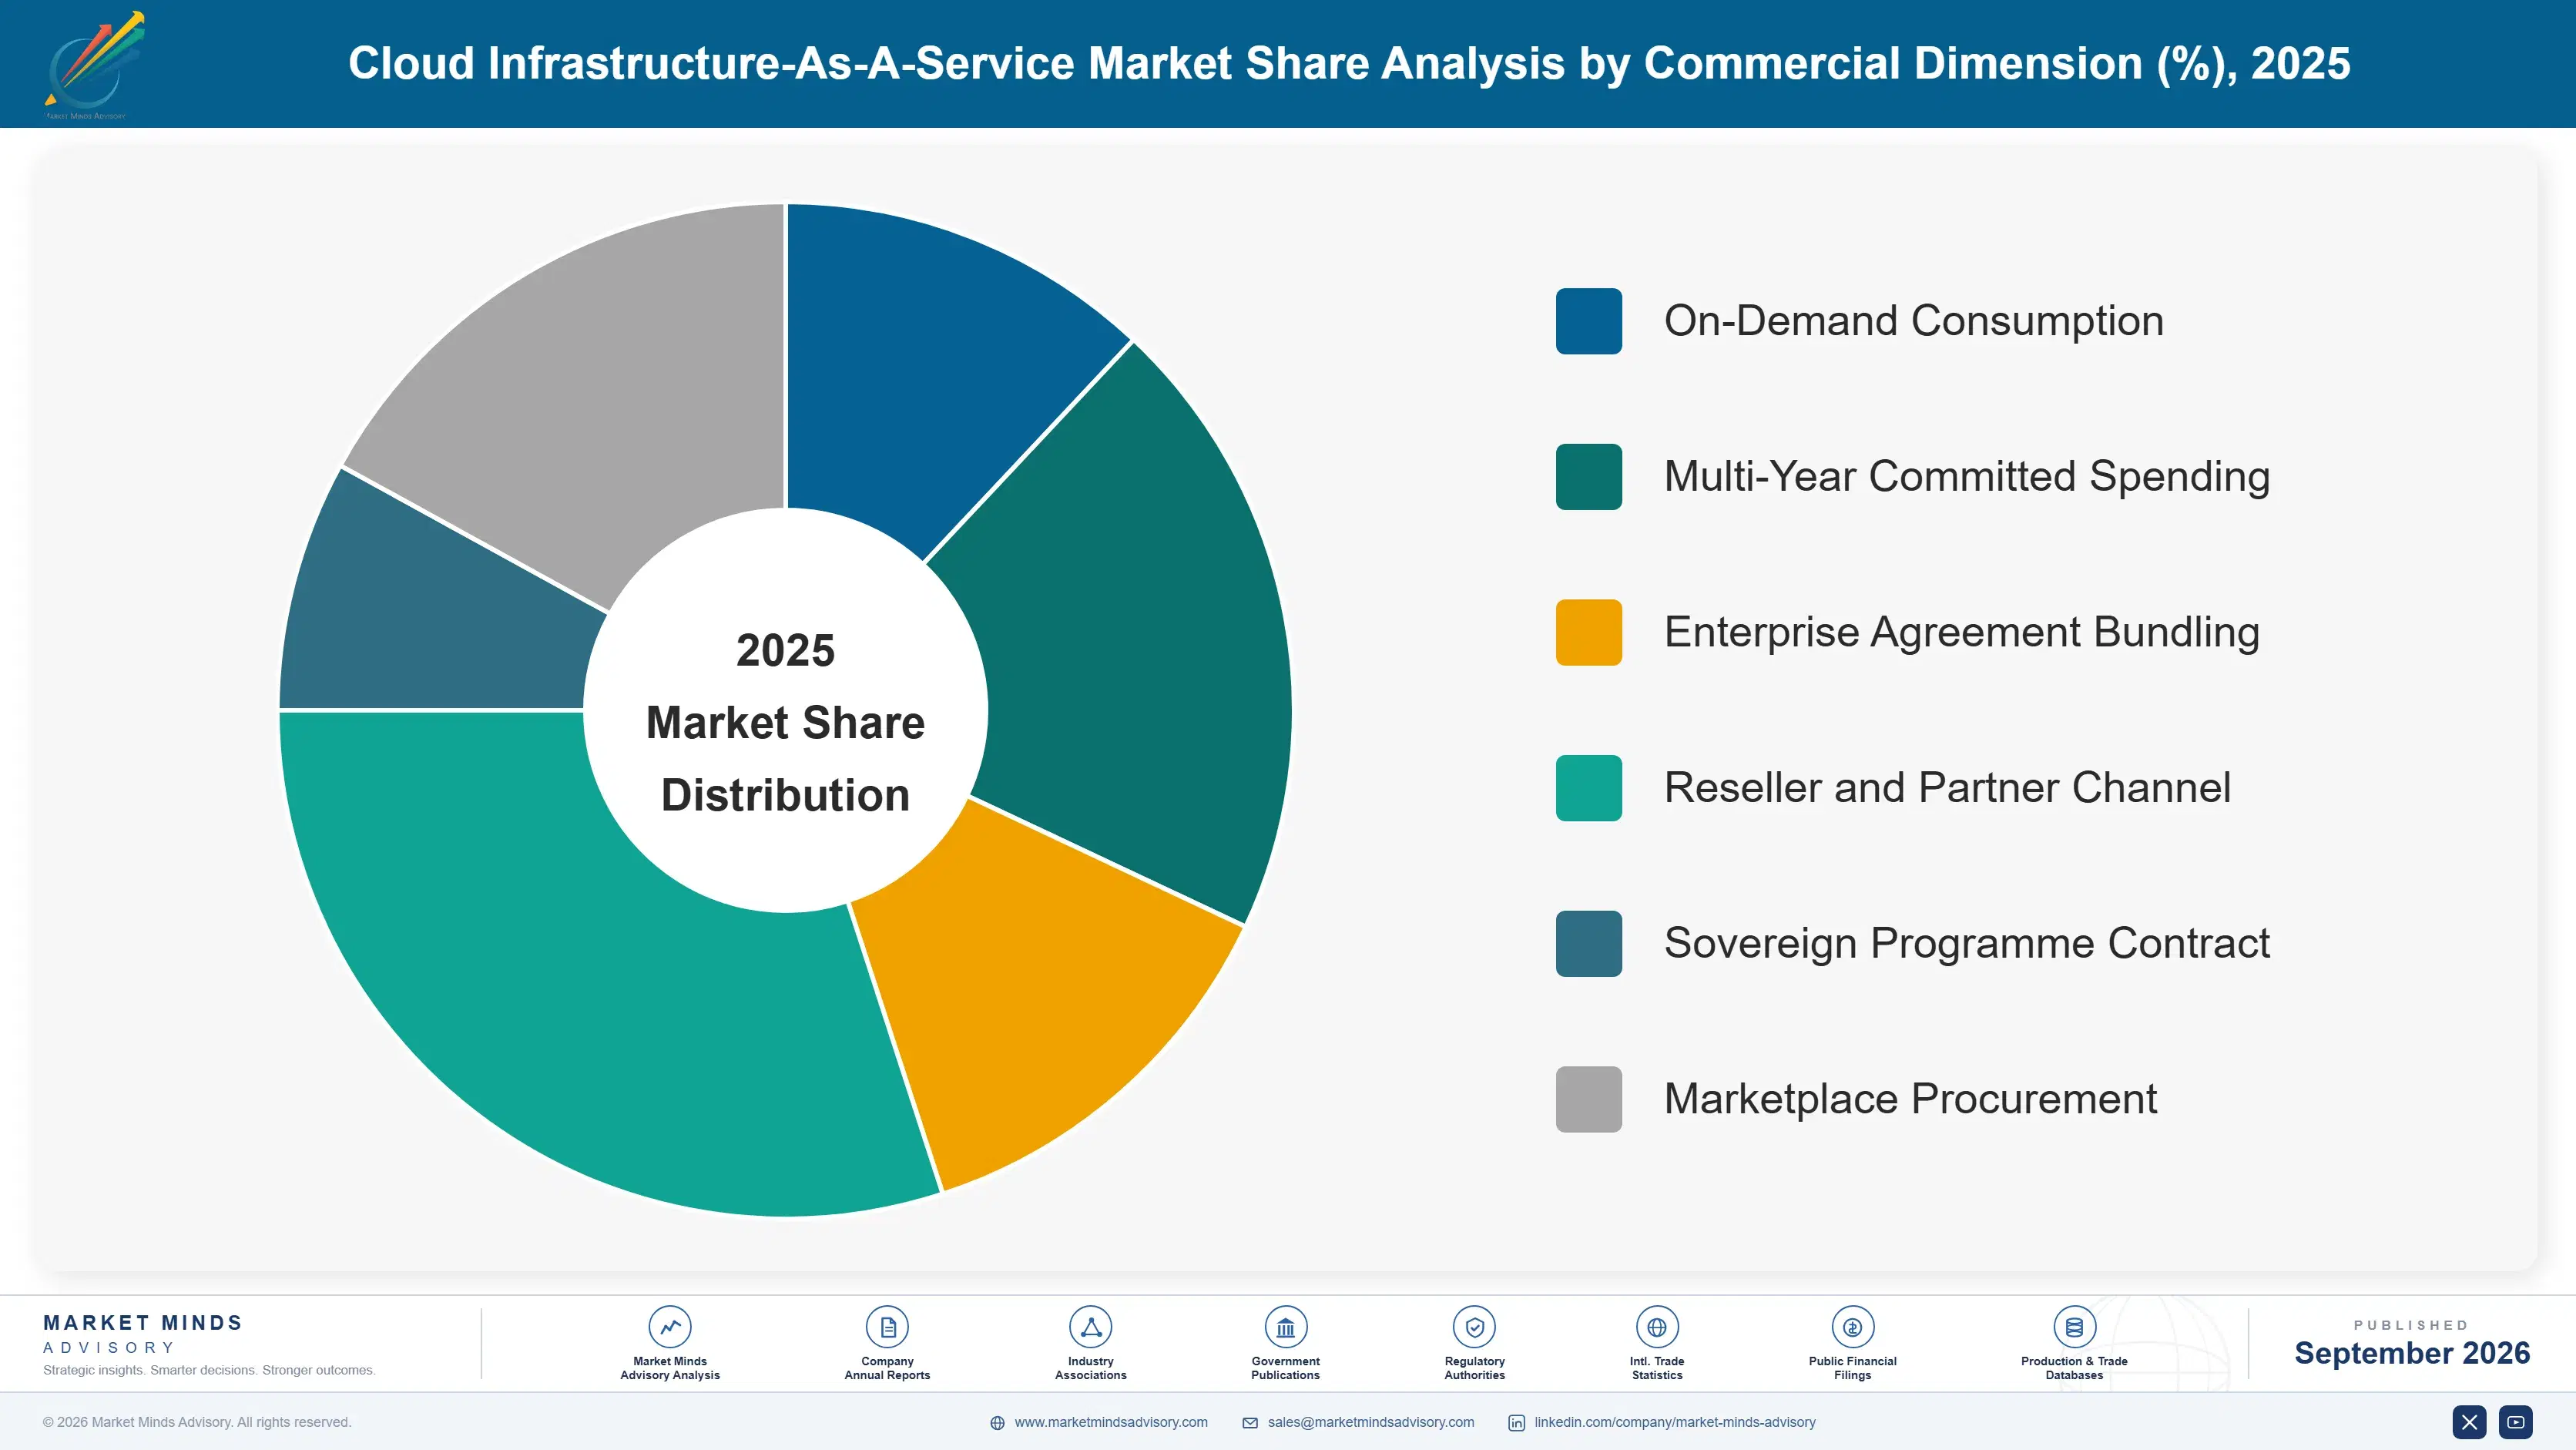
Segmentation follows infrastructure service type. Six categories cover the market: general purpose compute instances, object and block storage services, accelerated and artificial intelligence compute services, networking and content delivery services, managed container and orchestration infrastructure, and dedicated and sovereign infrastructure services. Support and committed use discounts are counted within the service they apply to.
cloud-infrastructure-as-a-service-market-market-share-analysis-1790011022467

Accelerated And AI Compute Services

Accelerated compute grows at 18.0%, half again the market rate of 12.0%, and it has changed what kind of business this is. The fleet is expensive, depreciates on a short schedule, and earns nothing while idle, which makes utilisation the governing variable rather than margin on a primitive. It already supplies 31% of revenue. Demand concentrates among a limited number of organisations able to fund frontier scale training, so a single customer's capacity decision now moves a provider's return materially. Broadening into inference is the obvious remedy and it is progressing slowly. Utilisation currently averages 63%, a figure aircraft lessors would recognise immediately. Depreciation schedules carried over from general purpose fleets understate the cost of every idle hour badly.
CAGR 18.0%

Dedicated And Sovereign Infrastructure Services

Sovereign and dedicated services grow at 14.8% because residency requirements are written about jurisdiction and legal control rather than about security, and no encryption arrangement satisfies them. Governments, healthcare systems, financial regulators, and defence functions all now specify infrastructure operated within national borders under domestic law. The buyer is a compliance function evaluating legal exposure rather than an engineering team comparing performance. Margins are better than general purpose primitives because the requirement removes price comparison, and the operational overhead of running isolated capacity is genuinely higher. Providers with capability already operating win regulated workloads that competitors promising future compliance simply cannot reach at any price. Building it takes years. Compliance functions decide these purchases.
CAGR 14.8%
Full segment breakdown across 6 segments available in the complete report.

Regional Architecture and Country Demand Map

Regional shares in this market are extraordinarily concentrated, and stating that plainly matters more than smoothing it. Five regions sit outside the standard bands, and the reasons are named in each paragraph and summarised for operator review. Power availability increasingly overrides customer proximity too. Concentration here is genuinely extreme.

North America

At 44% this region sits far above the standard band, and there is no honest way to present it otherwise: the largest providers are headquartered here, the largest enterprise technology budgets are here, and almost all frontier accelerated compute demand originates here. Power availability has become the practical constraint on further capacity, with connection queues running years in several states. Growth of 11.6% is close to the world rate. Repatriation of steady predictable workloads is more visible here than anywhere, though it remains modest against total spending. Accelerated capacity commitments here also carry the largest utilisation exposure anywhere, since the customers funding them are concentrated among very few organisations. Repatriation of steady workloads is most visible here.
Share: 44% | CAGR: 11.6% (2026 to 2036)

Western Europe

Sovereign and dedicated infrastructure demand is stronger here than in any other region, driven by residency requirements across public sector, healthcare, and financial services that are written about legal jurisdiction rather than technical security. Regulation also removed exit data transfer charges, which changed headlines more than behaviour. Growth of 10.5% is the slowest of the seven regions. Power constraints and grid connection delays are acute in several markets, pushing new capacity toward the Nordics where generation is available and cooling is cheaper. Enterprise buyers here scrutinise committed spending more closely than elsewhere, and unused commitment written off in prior years has made procurement noticeably more cautious. New capacity moves toward the Nordics for power and cooling.
Share: 21% | CAGR: 10.5% (2026 to 2036)
Regional intelligence for 5 additional markets available in the complete report: East Asia, South Asia and Pacific, Latin America, Middle East and Africa, Eastern Europe. Contact sales@marketmindsadvisory.com.
cloud-infrastructure-as-a-service-market-country-cagr-analysis-1790011023000

Where Providers Protect Their Returns

Four commercial moves separate providers earning a return on capital from those buying accelerators against demand they do not control. Each accepts that this is now an asset-intensive business where utilisation, power access, and commitment coverage decide outcomes far more than product features. Product capability decides considerably less than it did five years ago.

Secure Power And Connection Rights Ahead Of Demand

A grid connection takes around 41 months in most developed markets, which makes generation access rather than capital the binding constraint on building capacity at all. Providers holding connection rights or generation agreements deploy 2.6 times more capacity per year than competitors waiting in queues, regardless of balance sheet strength. It requires committing to power years before the demand it serves is contracted, which is uncomfortable and considerably less risky than being unable to build. Competitors who committed earlier simply absorb the demand instead. Balance sheet strength does not substitute for a connection.
Market Impact: Deploys 2.6 times more new capacity every year

Broaden Accelerated Demand Beyond Frontier Training

Accelerated capacity is committed years ahead against demand concentrated among very few organisations, and the fleet depreciates regardless of whether those customers continue. Providers who built inference and fine-tuning demand across many mid-sized customers report utilisation 14 to 22 points above those serving a handful of large buyers. The revenue per customer is far smaller and the aggregate is considerably more durable, which is a trade infrastructure businesses have always had to make. Depreciation and power contracts run whatever those customers decide next. Infrastructure businesses have always faced this trade.
Market Impact: Lifts fleet utilisation by 14 to 22 points

Build Sovereign Capability Before The Requirement Lands

Residency requirements are written about jurisdiction and legal control, so encryption arguments fail and only genuinely local operation qualifies. Sovereign services grow at 14.8% and providers with capability already in place win 3.4 times more regulated workloads than those promising future compliance. Building isolated capacity carries real operational overhead, and the requirement removes price comparison entirely, which more than compensates for it in the accounts. Building isolated capacity takes years, so the requirement arrives long before most providers can answer it. Compliance functions decide these awards rather than architects. Nobody compresses that timeline.
Market Impact: Wins 3.4 times more awards for regulated workloads

Attach Managed Services Above The Primitives

General purpose compute grows at 8.4% and storage at 9.2% under continuous price deflation, because competition on undifferentiated primitives has nowhere to go but downward. Managed services above them carry better margins and produce the operational attachment that egress fee removal exposed as the actual switching cost. Providers with deep managed service attachment report customer retention 2.9 times that of those selling primitives alone, and commitment coverage rises with it. Commitment coverage rises alongside it, which matters when the underlying fleet depreciates on a fixed schedule. That schedule does not pause for anybody.
Market Impact: Raises customer retention by 2.9 times over rivals

Who Controls the Margin Pool

Concentration is extreme. Five providers hold 76% of service revenue, measured consistently on that basis across all participants, and the scale required to fund accelerated capacity has widened rather than narrowed that gap. Specialist accelerated compute providers have carved a real position by focusing narrowly, while regional operators serve sovereign requirements the largest providers cannot always satisfy.
Competition currently turns on three things: power and grid connection access, which decides who can build at all; accelerated capacity availability, which decides who serves the fastest growing demand; and sovereign capability in jurisdictions writing residency rules. Price competition persists on general purpose primitives, where it has nowhere else to go. Managed service depth decides retention, which the removal of exit data transfer charges demonstrated more clearly than any analysis had managed to before it happened.

Pressure comes from two directions. Specialist accelerated providers compete without legacy commitments and price aggressively for utilisation. Meanwhile regional and sovereign operators take regulated workloads on legal rather than technical grounds. Rankings will shift with power access and accelerated utilisation, since both determine returns in a business that is now genuinely capital intensive. Providers without power access face the hardest constraint.
cloud-infrastructure-as-a-service-market-company-positioning-matrix-1790011023531

Competitive Moat and Risk Dimensions

AMAZON WEB SERVICES

Moat: Service Breadth And Attachment

A very wide catalogue of managed services above the infrastructure primitives creates the operational attachment that removing data transfer charges exposed as the genuine switching cost. Customers whose identity architecture, operational tooling, and application services all sit inside one provider do not leave because a fee disappeared, and they rarely try.
AMAZON WEB SERVICES

Risk: Accelerated Capacity Utilisation Exposure

Committing capital to accelerator fleets years ahead of contracted demand transfers considerable risk onto a customer base concentrated among few organisations able to fund frontier training. Depreciation and power contracts continue regardless of whether those customers maintain their current trajectory, which is a new exposure for this business.
MICROSOFT

Moat: Enterprise Agreement Integration

Infrastructure sold inside enterprise agreements that already cover productivity, identity, and application software reaches buyers through a commercial relationship competitors must displace rather than merely undercut. Committed spending arrangements bundled that way now cover a substantial majority of revenue and renew alongside software the customer cannot easily replace.
MICROSOFT

Risk: Concentrated Accelerated Customer Dependence

A substantial share of accelerated capacity serves a small number of customers whose own funding and strategy shifts are outside the company's control entirely. Utilisation on a depreciating fleet is unforgiving, and diversifying toward broader inference demand requires attracting many smaller buyers at considerably lower revenue each.

Players Tracked

Prominent Players

Amazon Web Services
Microsoft
Google
Alibaba Cloud
Oracle

Other Key Players

IBM
Tencent Cloud
Huawei Cloud
CoreWeave
DigitalOcean
OVHcloud
Nebius
Lambda
Scaleway
T-Systems
NTT Data
Naver Cloud
Yotta
Vultr
Akamai

Recent Developments

FEBRUARY 2026

Oracle Sites Accelerated Capacity Against Secured Generation Agreements

Oracle announced accelerated compute capacity at locations selected primarily for secured power generation rather than customer proximity, an organic expansion funded internally with no partner or acquisition involved in the arrangement. Latency matters far less for training workloads than for interactive ones, which made the siting decision commercially straightforward.
Signal: Capacity siting now follows electricity availability rather than latency to customers, which reverses two decades of practice.
SEPTEMBER 2025

Providers Remove Exit Data Transfer Charges Across European Customers

Major providers withdrew data transfer charges for customers migrating away, a pricing and policy change responding to regulatory obligation rather than any acquisition or partnership, and migration volumes moved only marginally afterwards. Managed service rebuilding rather than data movement dominates any realistic migration estimate, which the outcome demonstrated clearly.
Signal: The genuine switching cost was always operational attachment rather than the transfer fee itself. Nobody moved afterwards.
JUNE 2025

CoreWeave Signs Multi-Year Accelerated Capacity Supply Agreement

CoreWeave entered a multi-year supply agreement providing accelerated compute capacity under committed terms, giving both parties utilisation visibility that on-demand consumption cannot offer on a fleet depreciating this quickly. Neither party wanted exposure to on-demand consumption against a fleet losing relative value this quickly. Committed terms resolved that directly.
Signal: Commitment coverage matters more than headline pricing when the underlying asset depreciates on schedule. Utilisation visibility matters most.

What Serving Capacity Costs

Three input groups dominate cost of revenue. Server and accelerator depreciation runs 38% to 46%, and the schedule matters as much as the purchase price given how quickly accelerated hardware loses relative value. Power and cooling take 22% to 30%, rising sharply where accelerated density is high. Network capacity, facility costs, and operations add 18% to 26%, with the range reflecting owned against leased facility arrangements.
Electricity demand from data centres rose steeply through 2024 and 2025, and International Energy Agency analysis documented the load growth and its regional concentration across both years. Several providers described power procurement and grid connection delays directly in their annual reports. SEMI equipment data showed accelerator fabrication capacity expanding behind demand, which sustained pricing well above what a normal component cycle would have produced. Pricing stayed above a normal component cycle throughout.

The competitive disadvantage mechanism runs through power access rather than capital availability. A provider without secured generation or a grid connection cannot build capacity at any price and waits roughly 41 months in the queue, while competitors who committed earlier deploy immediately. Exposure varies by provider type, and early generation rights compound every year. Early committers deploy while others wait.
cloud-infrastructure-as-a-service-market-cost-volatility-analysis-1790011023728

Contract Generation And Connection Years In Advance

Grid connection queues run to several years in most developed markets, so power commitments must be made well before the demand they serve is contracted. That is uncomfortable capital allocation and considerably less damaging than being unable to build when demand arrives, which competitors who committed earlier will simply absorb instead. Queues lengthen every year besides.

Match Depreciation Schedules To Actual Residual Value

Accelerated hardware loses relative value faster than general purpose servers, and depreciation assumptions carried over from an earlier fleet understate the cost of every idle hour. Aligning schedules with observed residual values produces uncomfortable numbers and prices capacity honestly, which matters when utilisation rather than margin decides the return. Idle hours cost more than most schedules admit.

Site Accelerated Density Where Cooling Is Cheapest

Power and cooling costs scale directly with accelerated density and vary enormously by climate and electricity market between candidate locations. Siting the densest capacity where ambient conditions and generation costs are favourable reduces the largest variable cost permanently, and latency matters far less for training workloads than for interactive ones. Training workloads tolerate distance comfortably.

Portfolio Architecture for Margin Defence

Margin follows differentiation and price deflation together. General purpose compute and storage are commodities under continuous deflation, delivering more capacity per unit of spending each year with nowhere for competition to go but price. Managed container and networking services earn better. Sovereign infrastructure and managed service attachment earn most, because a legal requirement or an operational dependency removes price comparison. Price deflation rather than technical merit decides this entire hierarchy.
The tension between volume and premium runs through who is buying and why. An engineering team purchasing compute compares price per unit across providers and moves when the arithmetic favours it. A compliance function buying sovereign capacity compares legal exposure and does not negotiate. Accelerated compute sits awkwardly between the two: enormous revenue, concentrated demand, and returns that depend on utilisation rather than pricing.

High-value pools concentrate where a legal requirement or an operational dependency prevents comparison: sovereign and regulated workloads, managed services layered above the primitives, and capacity in locations where power access is genuinely scarce. Where the customer is buying undifferentiated compute or storage, price falls every year and no provider has found a defence against that. No defence has been found for it.

Volume / Commodity-Adjacent

General purpose compute and storage under continuous price deflation, where competition on undifferentiated primitives has nowhere to go except downward. The twelve-point range reflects facility ownership, power contracts, and hardware purchasing scale rather than any product difference.
Gross Margin: 36% to 48%

Premium / Certified

Managed container, networking, and content delivery services carrying operational attachment above the primitives beneath them. The twelve-point range separates providers with deep managed service catalogues from those competing largely on infrastructure specification and unit price.
Gross Margin: 50% to 62%

Sustainability / Regulatory / Next-Generation

Sovereign and dedicated infrastructure where legal requirements remove price comparison, alongside managed services with deep operational attachment. The fourteen-point range reflects how much isolation each arrangement requires and the operational overhead that isolation carries.
Gross Margin: 58% to 72%
cloud-infrastructure-as-a-service-market-portfolio-architecture-1790011024232

High-value Sub-segments and Strategic Watch-out

Sovereign And Dedicated Infrastructure

Highest value in the category, growing at 14.8% because residency rules are written about jurisdiction rather than security and no encryption satisfies them. The fourteen-point range reflects isolation depth and the operational overhead each sovereign arrangement genuinely requires to run. Compliance functions rather than architects decide these.
Gross Margin: 60% to 74%

Managed Service Attachment

High value creating the operational dependency that removing exit fees exposed as the real switching cost. The twelve-point range reflects catalogue depth, and providers with strong attachment report retention far above those selling primitives alone. Removing exit fees demonstrated exactly how much it matters. Almost nobody moved.
Gross Margin: 56% to 68%

Accelerated Compute Capacity

Fastest growth at 18.0% and the largest capital exposure, where utilisation rather than pricing decides the return on a rapidly depreciating fleet. The sixteen-point range reflects utilisation differences, which vary far more than pricing does between providers. Demand concentration remains the largest single exposure here.
Gross Margin: 42% to 58%

Undifferentiated Compute And Storage

The strategic watch-out. Price deflates every year, customers compare units directly across providers, and nobody has found a defence beyond attaching something above it. The twelve-point range reflects power contracts and purchasing scale alone. Attaching something above it is the only response available. Deflation continues every year regardless.
Gross Margin: 32% to 44%

How This Revenue Recurs

Consumption revenue recurs continuously and varies with what customers actually run, which made this business attractive when the underlying assets were cheap and shared. Committed spending arrangements now cover 68% of revenue and exist precisely because a depreciating accelerated fleet cannot be funded against variable consumption. That shift moves the business closer to contracted infrastructure and further from the elastic proposition it was originally sold as.
Attachment depth follows operational dependency rather than data location. Removing exit data transfer charges demonstrated this conclusively: customers whose identity architecture, managed services, and operational practice sit inside one provider did not leave when the fee disappeared. A customer running plain compute and storage has almost no attachment and moves whenever the arithmetic changes, which describes the 8% repatriating annually.

The buyer has shifted from engineering toward finance and compliance. Infrastructure was once chosen by architects comparing capability and developer experience. Committed spending arrangements are now negotiated by procurement and finance functions modelling multi-year exposure, and sovereign capacity is specified by compliance officers assessing legal jurisdiction. Providers presenting developer experience are addressing a participant who influences rather than decides.
cloud-infrastructure-as-a-service-market-end-use-penetration-index-1790011024729

Where This Market Rewards

These are among the four positions where our research anticipates prominent divergence between winners and laggards over the coming forecast period. Each is grounded in the demand model, the regulatory perimeter, and the announced capacity pipeline.
01 / POWER ACCESS PRIORITY

Electricity decides who can build anything

A grid connection takes roughly 41 months in most developed markets, which makes generation access rather than capital the binding constraint on adding capacity at all. Providers holding connection rights or generation agreements deploy 2.6 times more capacity annually than competitors waiting in queues regardless of balance sheet strength. Committing to power years ahead of contracted demand is uncomfortable and considerably less damaging than being unable to build, and connection queues lengthen with every year that passes, and balance sheet strength substitutes for none of it.
02 / UTILISATION RISK SPREADING

A depreciating fleet forgives nothing at all

Accelerated capacity is committed years ahead against demand concentrated among very few organisations, while depreciation and power contracts continue whatever those customers decide next. Providers who built inference demand across many mid-sized customers report utilisation 14 to 22 points above those serving a handful of large buyers. Revenue per customer falls sharply and the aggregate becomes far more durable, which is the trade infrastructure businesses have always faced, and it has never been more consequential than it is now, and it has rarely mattered more than it does now.
03 / SOVEREIGN CAPABILITY TIMING

Jurisdiction beats encryption every single time

Residency requirements are written about legal control rather than technical security, so encryption arguments fail entirely and only genuinely local operation under domestic law qualifies for the workload. Sovereign services grow at 14.8%, and providers with capability already operating win 3.4 times more regulated workloads than those promising future compliance. Isolation carries real operational overhead, and removing price comparison more than compensates for it, and building the capability takes years nobody can compress, and compliance functions rather than architects decide these awards.
04 / ATTACHMENT OVER PRIMITIVES

Exit fees left and nobody actually moved

Data transfer charges were the industry's most effective retention mechanism and their removal changed migration volumes only marginally, because the genuine switching cost was always operational. Providers with deep managed service attachment report retention 2.9 times that of those selling primitives alone, while compute deflates at 8.4% growth and storage at 9.2%. Nobody has found a defence for undifferentiated capacity beyond attaching something above it, and the deflation continues regardless of what anybody builds, and the deflation continues whatever any provider builds next.

Engagement Snapshot From the Field

A live engagement with an industry participant carrying material or product regulatory and market exposure ahead of a defining policy shift, showing how our research translates into a defensible multi-year portfolio strategy.
MARKET MINDS ADVISORY · CLIENT ENGAGEMENT SUMMARY
Cloud Infrastructure-As-A-Service Producer Strategic Portfolio Review and Transition Roadmap 2026·Investment Scenario on Cloud Infrastructure-As-A-Service Exposure Evaluation 2025-26
CLIENT PROFILE
A financial services group operating across eleven countries, spending roughly USD 240 million annually across three infrastructure providers, with about 71% under multi-year committed arrangements. Regulatory residency requirements applied in four of those jurisdictions, and the group had assumed encryption satisfied them (client-reported, unverified by MMA). Unused commitment had been written off in each of the previous two years without review.
STRATEGIC CHALLENGE
A supervisory review had questioned whether workloads in two jurisdictions met residency obligations, and the group discovered that encryption did not address a requirement written about legal control. Meanwhile committed spending was approaching renewal with no analysis of whether the commitments matched actual consumption anywhere. Renewal was six months away.
MMA APPROACH
MMA mapped every workload against the residency requirement in its jurisdiction, separated genuinely regulated data from workloads that merely sat alongside it, and reconciled committed spending against measured consumption by provider, service type, and country over eighteen months. Migration cost was decomposed between data movement and managed service rebuilding for every regulated workload.
KEY FINDINGS
  1. Only 23% of workloads in the two questioned jurisdictions actually held regulated data; the remainder had been placed there by architectural convenience rather than any obligation.
  2. Committed spending exceeded actual consumption by 19% across the three providers, and unused commitment had been quietly written off in each of the previous two years.
  3. Migrating the genuinely regulated workloads to sovereign capacity cost roughly 2.4 times equivalent general purpose infrastructure, which the group had never modelled.
  4. Removal of exit data transfer charges made almost no difference to migration cost, since managed service rebuilding accounted for 84% of the estimate.
CLIENT PROFILE
A financial services group operating across eleven countries, spending roughly USD 240 million annually across three infrastructure providers, with about 71% under multi-year committed arrangements. Regulatory residency requirements applied in four of those jurisdictions, and the group had assumed encryption satisfied them (client-reported, unverified by MMA). Unused commitment had been written off in each of the previous two years without review.
STRATEGIC CHALLENGE
A supervisory review had questioned whether workloads in two jurisdictions met residency obligations, and the group discovered that encryption did not address a requirement written about legal control. Meanwhile committed spending was approaching renewal with no analysis of whether the commitments matched actual consumption anywhere. Renewal was six months away.
MMA APPROACH
MMA mapped every workload against the residency requirement in its jurisdiction, separated genuinely regulated data from workloads that merely sat alongside it, and reconciled committed spending against measured consumption by provider, service type, and country over eighteen months. Migration cost was decomposed between data movement and managed service rebuilding for every regulated workload.
KEY FINDINGS
  1. Only 23% of workloads in the two questioned jurisdictions actually held regulated data; the remainder had been placed there by architectural convenience rather than any obligation.
  2. Committed spending exceeded actual consumption by 19% across the three providers, and unused commitment had been quietly written off in each of the previous two years.
  3. Migrating the genuinely regulated workloads to sovereign capacity cost roughly 2.4 times equivalent general purpose infrastructure, which the group had never modelled.
  4. Removal of exit data transfer charges made almost no difference to migration cost, since managed service rebuilding accounted for 84% of the estimate.
RECOMMENDED STRATEGY
Phase 1: Phase one: separate genuinely regulated workloads from those merely colocated with them, so sovereign capacity is bought only where an obligation exists. Phase 2: Phase two: renegotiate committed spending against measured consumption rather than against the previous commitment, which had never been tested. Prior commitments had never been tested. Phase 3: Phase three: reduce managed service dependency in the regulated estate specifically, since it dominates any future migration cost far more than data transfer does.
OUTCOME
The residency finding was closed with sovereign capacity covering 23% of the estate rather than all of it (client-reported, unverified by MMA). Committed spending fell 14% at renewal against measured consumption. Total infrastructure cost rose 6% despite the sovereign premium, which the board accepted readily.

Frequently Asked Questions

Foundational context covering the market sizes, CAGR, scope, country, region and competition that inform every finding below. This section is provided to cover basics and most often pre-purchase conversations, answered from the MMA Primary Research Dataset.

What is the current size of the Cloud Infrastructure-As-A-Service Market?

The market was worth USD 168.0 billion in 2025 and reaches USD 188.2 billion in 2026. Value covers infrastructure primitives sold as a service, excluding platform and application layers.

How large will the Cloud Infrastructure-As-A-Service Market be by 2036?

MMA forecasts USD 584.5 billion by 2036, an increase of USD 396.3 billion across the forecast period. That represents 3.11 times the 2026 base of USD 188.2 billion.

What is the CAGR for the Cloud Infrastructure-As-A-Service Market 2026 to 2036?

The base case compound annual growth rate is 12.0%, with a bull case at 13.2% and a bear case at 10.8%. Historical growth from 2020 to 2025 ran at 11.0%.

Which segment is growing fastest?

Accelerated and artificial intelligence compute grows at 18.0%, half again the market rate of 12.0%. It already supplies 31% of revenue and has changed the underlying economics.

Who are the major companies in the Cloud Infrastructure-As-A-Service Market?

Amazon Web Services, Microsoft, Google, Alibaba Cloud, and Oracle lead, together holding 76% of service revenue. Accelerated capital requirements have widened rather than narrowed that gap.

Which country is growing fastest?

India grows at 19.4%, combining data localisation requirements with enterprise adoption expanding quickly from a comparatively low base alongside an unusually large domestic developer population.

Report Segmentation Architecture

The full report scope spans multiple orthogonal segmentation dimensions, with cross-tabulated demand data provided for each dimension pair. Coverage extends further to regional breakdowns, trend trajectories, and the competitive detail needed to support segment-level decision-making.

By Infrastructure Service Type

  • General Purpose Compute Instances
  • Object and Block Storage Services
  • Accelerated and AI Compute Services
  • Networking and Content Delivery Services
  • Managed Container and Orchestration Infrastructure
  • Dedicated and Sovereign Infrastructure Services

By End-Use Industry

  • Technology and Digital Native Businesses
  • Financial Services and Insurance
  • Public Sector and Defence
  • Healthcare and Life Sciences
  • Retail, Media and Consumer Services
  • Manufacturing and Industrial

By Commercial Dimension

  • On-Demand Consumption
  • Multi-Year Committed Spending
  • Enterprise Agreement Bundling
  • Reseller and Partner Channel
  • Sovereign Programme Contract
  • Marketplace Procurement

By Region

  • North America
  • Western Europe
  • East Asia
  • South Asia and Pacific
  • Latin America
  • Middle East and Africa
  • Eastern Europe

Scope, Methodology, and Coverage

Every figure in this report is reproducible from documented input assumptions. The scope below maps the historical period, the forecast horizon, the segmentation dimensions, and the countries covered, alongside the underlying primary and qualitative methodology.
Historical Period
2020 to 2025
Forecast Period
2026 to 2036
Base Year
2025 (USD billions; MMA Primary Research Dataset, September 2026)
Market Definition
This market covers on-demand infrastructure primitives sold as a service, including general purpose compute instances, object and block storage services, accelerated and artificial intelligence compute services, networking and content delivery services, managed container and orchestration infrastructure, and dedicated and sovereign infrastructure services. It excludes platform and software application services, colocation and data centre real estate, managed service provider labour, software licences, and customer premises hardware.
Quantitative Units
USD billions, infrastructure service consumption revenue
Segmentation Dimensions
Infrastructure service type, end-use industry, commercial dimension, region
Regions Covered
North America, Western Europe, East Asia, South Asia and Pacific, Latin America, Middle East and Africa, Eastern Europe
Countries Covered
United States, Canada, Mexico, United Kingdom, Germany, France, Netherlands, Ireland, Sweden, Norway, Switzerland, Spain, China, Japan, South Korea, Taiwan, India, Singapore, Australia, Indonesia, Brazil, Mexico, Chile, Colombia, Saudi Arabia, United Arab Emirates, Nigeria, South Africa, Poland, Czechia
Key Companies Profiled
Amazon Web Services, Microsoft, Google, Alibaba Cloud, Oracle, IBM, Tencent Cloud, Huawei Cloud, CoreWeave, DigitalOcean, OVHcloud, Nebius, Lambda, Scaleway, T-Systems, NTT Data, Naver Cloud, Yotta, Vultr, Akamai
Quantitative Methodology
Primary survey, n=3,800 respondents, Q4 2025, six countries; demand-side model with trade association cross-validation
Qualitative Methodology
47 expert interviews, Q4 2025; applied to validate demand model assumptions, identify emerging dynamics, and assess competitive positioning
Report Format
PDF and XLSX data workbook (Word format preview document)
Publisher
Market Minds Advisory
Report Code
MMA-2026-TEC-821
Published
September 2026
Contact
sales@marketmindsadvisory.com | www.marketmindsadvisory.com

Purchase the full Cloud Infrastructure-As-A-Service Market Report (2026 to 2036).

The full report sizes the cloud infrastructure services market across six service types, seven regions, and thirty countries, with forecasts to 2036 under base, bull, and bear cases. It examines how accelerated compute turned a software-margin business into a capital-intensive one, why removing exit data transfer charges changed almost nothing, and how grid connection delays now decide where capacity is built. Competitive analysis covers twenty participants evaluated consistently on service revenue, with detailed treatment of power access and utilisation exposure. Cost structure, margin architecture, and regional concentration are analysed throughout. Primary research includes 3,800 survey responses and 47 expert interviews.
Six infrastructure service types sized and forecast separately
Twenty participants evaluated on infrastructure service revenue
Regional concentration and residency requirements across seven geographies
Margin architecture by service type and price deflation exposure
Utilisation and commitment coverage benchmarking across provider fleets
Power access and grid connection delay analysis by capacity location

Built For The People Who Decide

From boardroom strategy to bench-side execution, this report is read cover-to-cover by leaders shaping the next decade of their industry, turning demand scenarios, market dynamics and valuation benchmarks into decisions.
CXOs/ Presidents/ VPs/ Managers
M&A and Corporate Development
Strategy Teams and R&D Heads
Procurement and Product Directors
Regulatory and Compliance Leaders
Investor Relations and Equity Analysts