Market Minds Advisory
Cloud Communication Platform Market

Cloud Communication Platform Market: Cloud Communication Platform Market: Termination Economics, Network Verification and Channel Migration, 2026 to 2036

About 63 cents of every dollar collected here goes straight to a mobile operator. This is a distribution business that has spent a decade presenting itself as a software one.

Lead Analyst

Published

September 2026

Make Smarter Decisions with Customized Research Insights

Request a free sample report and evaluate market opportunities, growth trends, and competitive dynamics relevant to your business needs.

2025 MARKET VALUE$18.6BMarket Size 2025
2036 FORECAST VALUE$62.3BBase Case , 2026 to 2036
CAGR 2026 TO 203611.6 %Bull 12.8% / Bear 10.4%
INCREMENTAL OPPORTUNITY$41.5BNet 10- year value creation
EXPANSION MULTIPLE3.00x2036 value over 2026 base
Strategic Levers
M&A Pipeline
Regional Outlook
Country Rankings
Competitive Intelligence
Segmental Deep-dive
Call-Us : 91 93563 13602

Executive Snapshot and Market Trajectory.

Headline revenue in this market flatters what the businesses actually keep. Around 63% of what providers collect is paid onward to mobile operators as termination cost, so gross revenue growth and gross profit growth tell substantially different stories about the same year. That gap widens every year.
Verification and network authentication grows at 17.4%, half again the market rate of 11.6%, and it is the healthiest business here: the buyer is protecting account security rather than comparing price per message, and network signals cost less than sending anything. Rich and over-the-top messaging follows at 15.2%. Plain messaging grows at 6.8% under operator price increases. Operators set those rates unilaterally and have raised them steadily across most large markets.
Fraud has become a permanent cost rather than an incident. Around 8.4% of messaging volume is attributable to artificially inflated traffic that somebody pays for and nobody wanted, and it has accelerated the move toward network verification more effectively than any product argument did. North America holds 30% of platform revenue. Procurement replaced developer-led adoption and now asks which part of a price is termination and which is margin. Plain messaging manages just 6.8% yearly.
Market Definition
This market covers programmable communications delivered as cloud application programming interfaces, including short message and application-to-person messaging, voice and programmable telephony, rich and over-the-top business messaging, verification and network authentication, email delivery interfaces, and video and embedded communications. It excludes unified communications and collaboration suites, contact centre applications, carrier wholesale interconnect sold between operators, and marketing automation platforms.
Base Year Value
$18.6B in 2025 (MMA Primary Research Dataset, September 2026)
Forecast Period
2026 to 2036, eleven discrete annual values
CAGR
11.6% base case. Bull 12.8%. Bear 10.4%.
Fastest Growth Segment
Verification And Network Authentication: 17.4% CAGR
Fastest Growth Country
India: 16.8% CAGR
Fastest Growth Region
South Asia and Pacific: 13.6% CAGR
Largest Region
North America: 30% of 2025 global value
Market Leaders
Twilio, Sinch, Infobip, Vonage, and Bandwidth lead the field. Source: MMA Primary Research Dataset, July 2026.
Primary Survey
n=3,800 procurement and R&D decision-makers, Q4 2025, six countries
Methodology
Demand-side build-up, cross-validated against public data, 47 expert interviews

Cloud Communication Platform Market Forecast Scenarios

cloud-communication-platforms-market-size-forecast-scenario-1790012001172
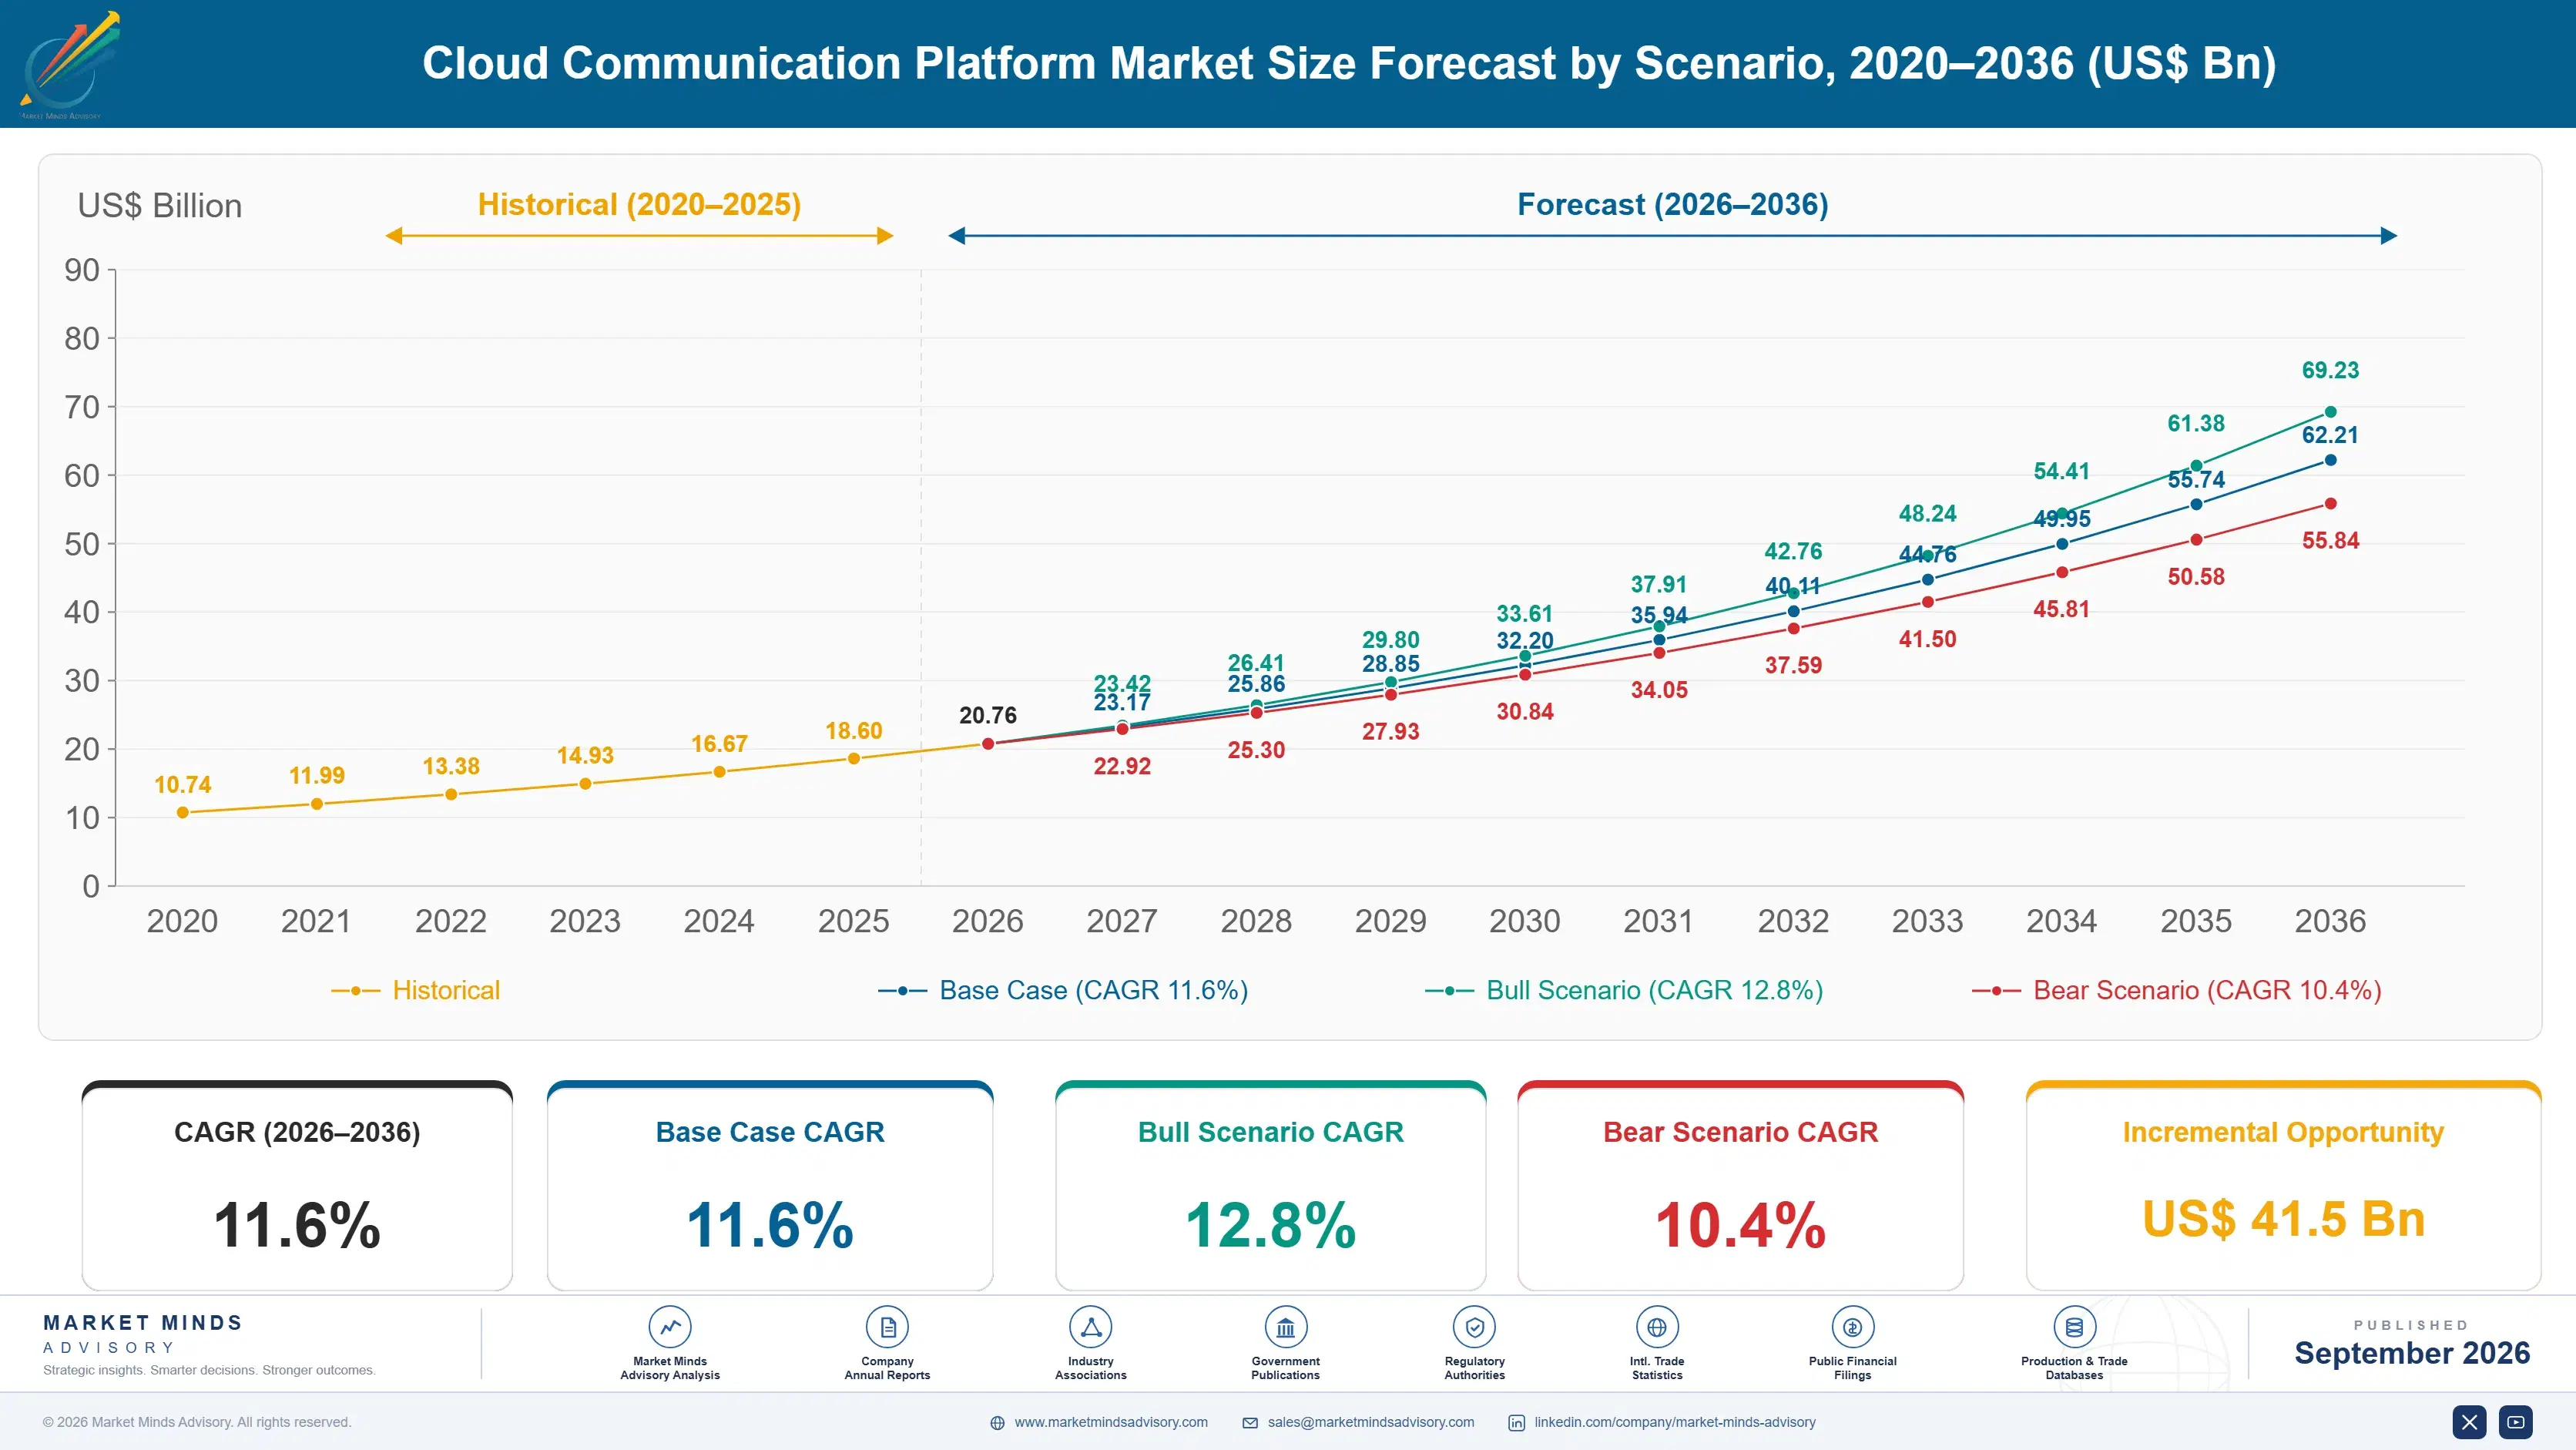
Between 2020 and 2025 volume grew steadily while economics deteriorated. Mobile operators raised application-to-person termination rates across most large markets, and providers passed those increases through with limited ability to resist them. Historical growth of 10.2% describes gross revenue rather than value created, and the gap between the two widened every year as termination took a larger share of each transaction.
The base case at 11.6% rests on three mechanisms. Verification moves toward network signals that cost a fraction of sending a message and resist interception, which raises retained margin while lowering customer cost. Rich messaging channels carry richer interactions at prices operators do not control. And enterprises consolidate spending onto fewer providers as procurement takes over from developer-led adoption. None of the three depends on operators moderating their pricing behaviour.
The bull case at 12.8% depends on network authentication interfaces reaching broad operator coverage quickly, since the capability is only useful where the subscriber's operator supports it. The bear case at 10.4% is continued termination inflation: if operators keep raising rates faster than providers can shift traffic to alternative channels, gross revenue grows while gross profit does not, which several participants have already experienced.

Distribution Wearing Software Clothing

The most useful thing to understand about this market is where the money goes. Around 63% of collected revenue is handed to mobile operators, which makes gross revenue a poor measure of anything. Average gross margin across the category sits near 37%, and a provider growing revenue 20% while termination rises faster has grown its business in only the narrowest sense.
TOP FIVE CONCENTRATION46%Share of platform revenue held by the leading providers
TERMINATION COST SHARE63%Revenue paid onward to carriers rather than being retained
FRAUDULENT TRAFFIC SHARE8.4%Messaging volume attributable to artificially inflated traffic schemes
AVERAGE GROSS MARGIN37%Retained margin across messaging, voice and verification combined
NETWORK VERIFICATION ADOPTION29%Authentication flows using network signals rather than messages
AVERAGE ANNUAL CONTRACTUSD 264,000Platform spending averaged across all enterprise customer accounts
Fraud has moved from nuisance to line item. Artificially inflated traffic, where volume is generated to earn termination revenue rather than to reach anybody, accounts for roughly 8.4% of messaging. Enterprises pay for it, providers absorb disputes about it, and it has pushed buyers toward verification methods that cannot be gamed the same way. That has done more for network authentication than any vendor pitch.
Verification is quietly the best business in this market. Network-based authentication uses signals the operator already holds rather than sending anything, which costs a fraction of a message and resists interception. Adoption sits at 29% and the constraint is operator coverage rather than customer appetite. The buyer is protecting accounts rather than comparing unit prices, which is a different negotiation entirely.
"Somebody should say plainly that most of this revenue belongs to mobile operators and passes through on its way to them. It does not make the businesses uninteresting. It does mean that comparing them to software companies on revenue multiples has misled a great many people for a long time."
Practice Director, Communications Platforms and Digital Infrastructure · MMA Technology Practice · September 2026

Market Trends

Network Signals Replace Messages For Verification

Confirming that a person holds a particular device can be done from signals the mobile operator already has, without sending anything at all, which costs a fraction of a message and cannot be intercepted the way a code can. Verification grows at 17.4% and adoption stands at 29%, limited by operator coverage rather than by demand. It also raises retained margin while lowering what the customer pays, which is an unusual combination anywhere in this market. Assembling operator access market by market is the work that decides who captures this rather than watches it.
Market Impact: Segment grows at 15.2%
Fraudulent Traffic Became A Permanent Cost

Artificially inflated traffic generates messaging volume purely to earn termination revenue, and it accounts for roughly 8.4% of messages. Enterprises pay for messages nobody wanted, providers absorb the disputes, and detection is imperfect because the traffic resembles legitimate registration flows. The practical response has been to move authentication onto channels where the economics do not reward generating volume, which is why the fraud problem accelerated network verification faster than any product argument managed. Blocking suspect traffic before billing protects relationships that retrospective credits never repair adequately. Detection is imperfect because the volume resembles genuine registration flows.
Market Impact: Contracts average USD 264,000

Market Opportunities and Growth Drivers

Rich Channels Carry Interactions Messages Cannot

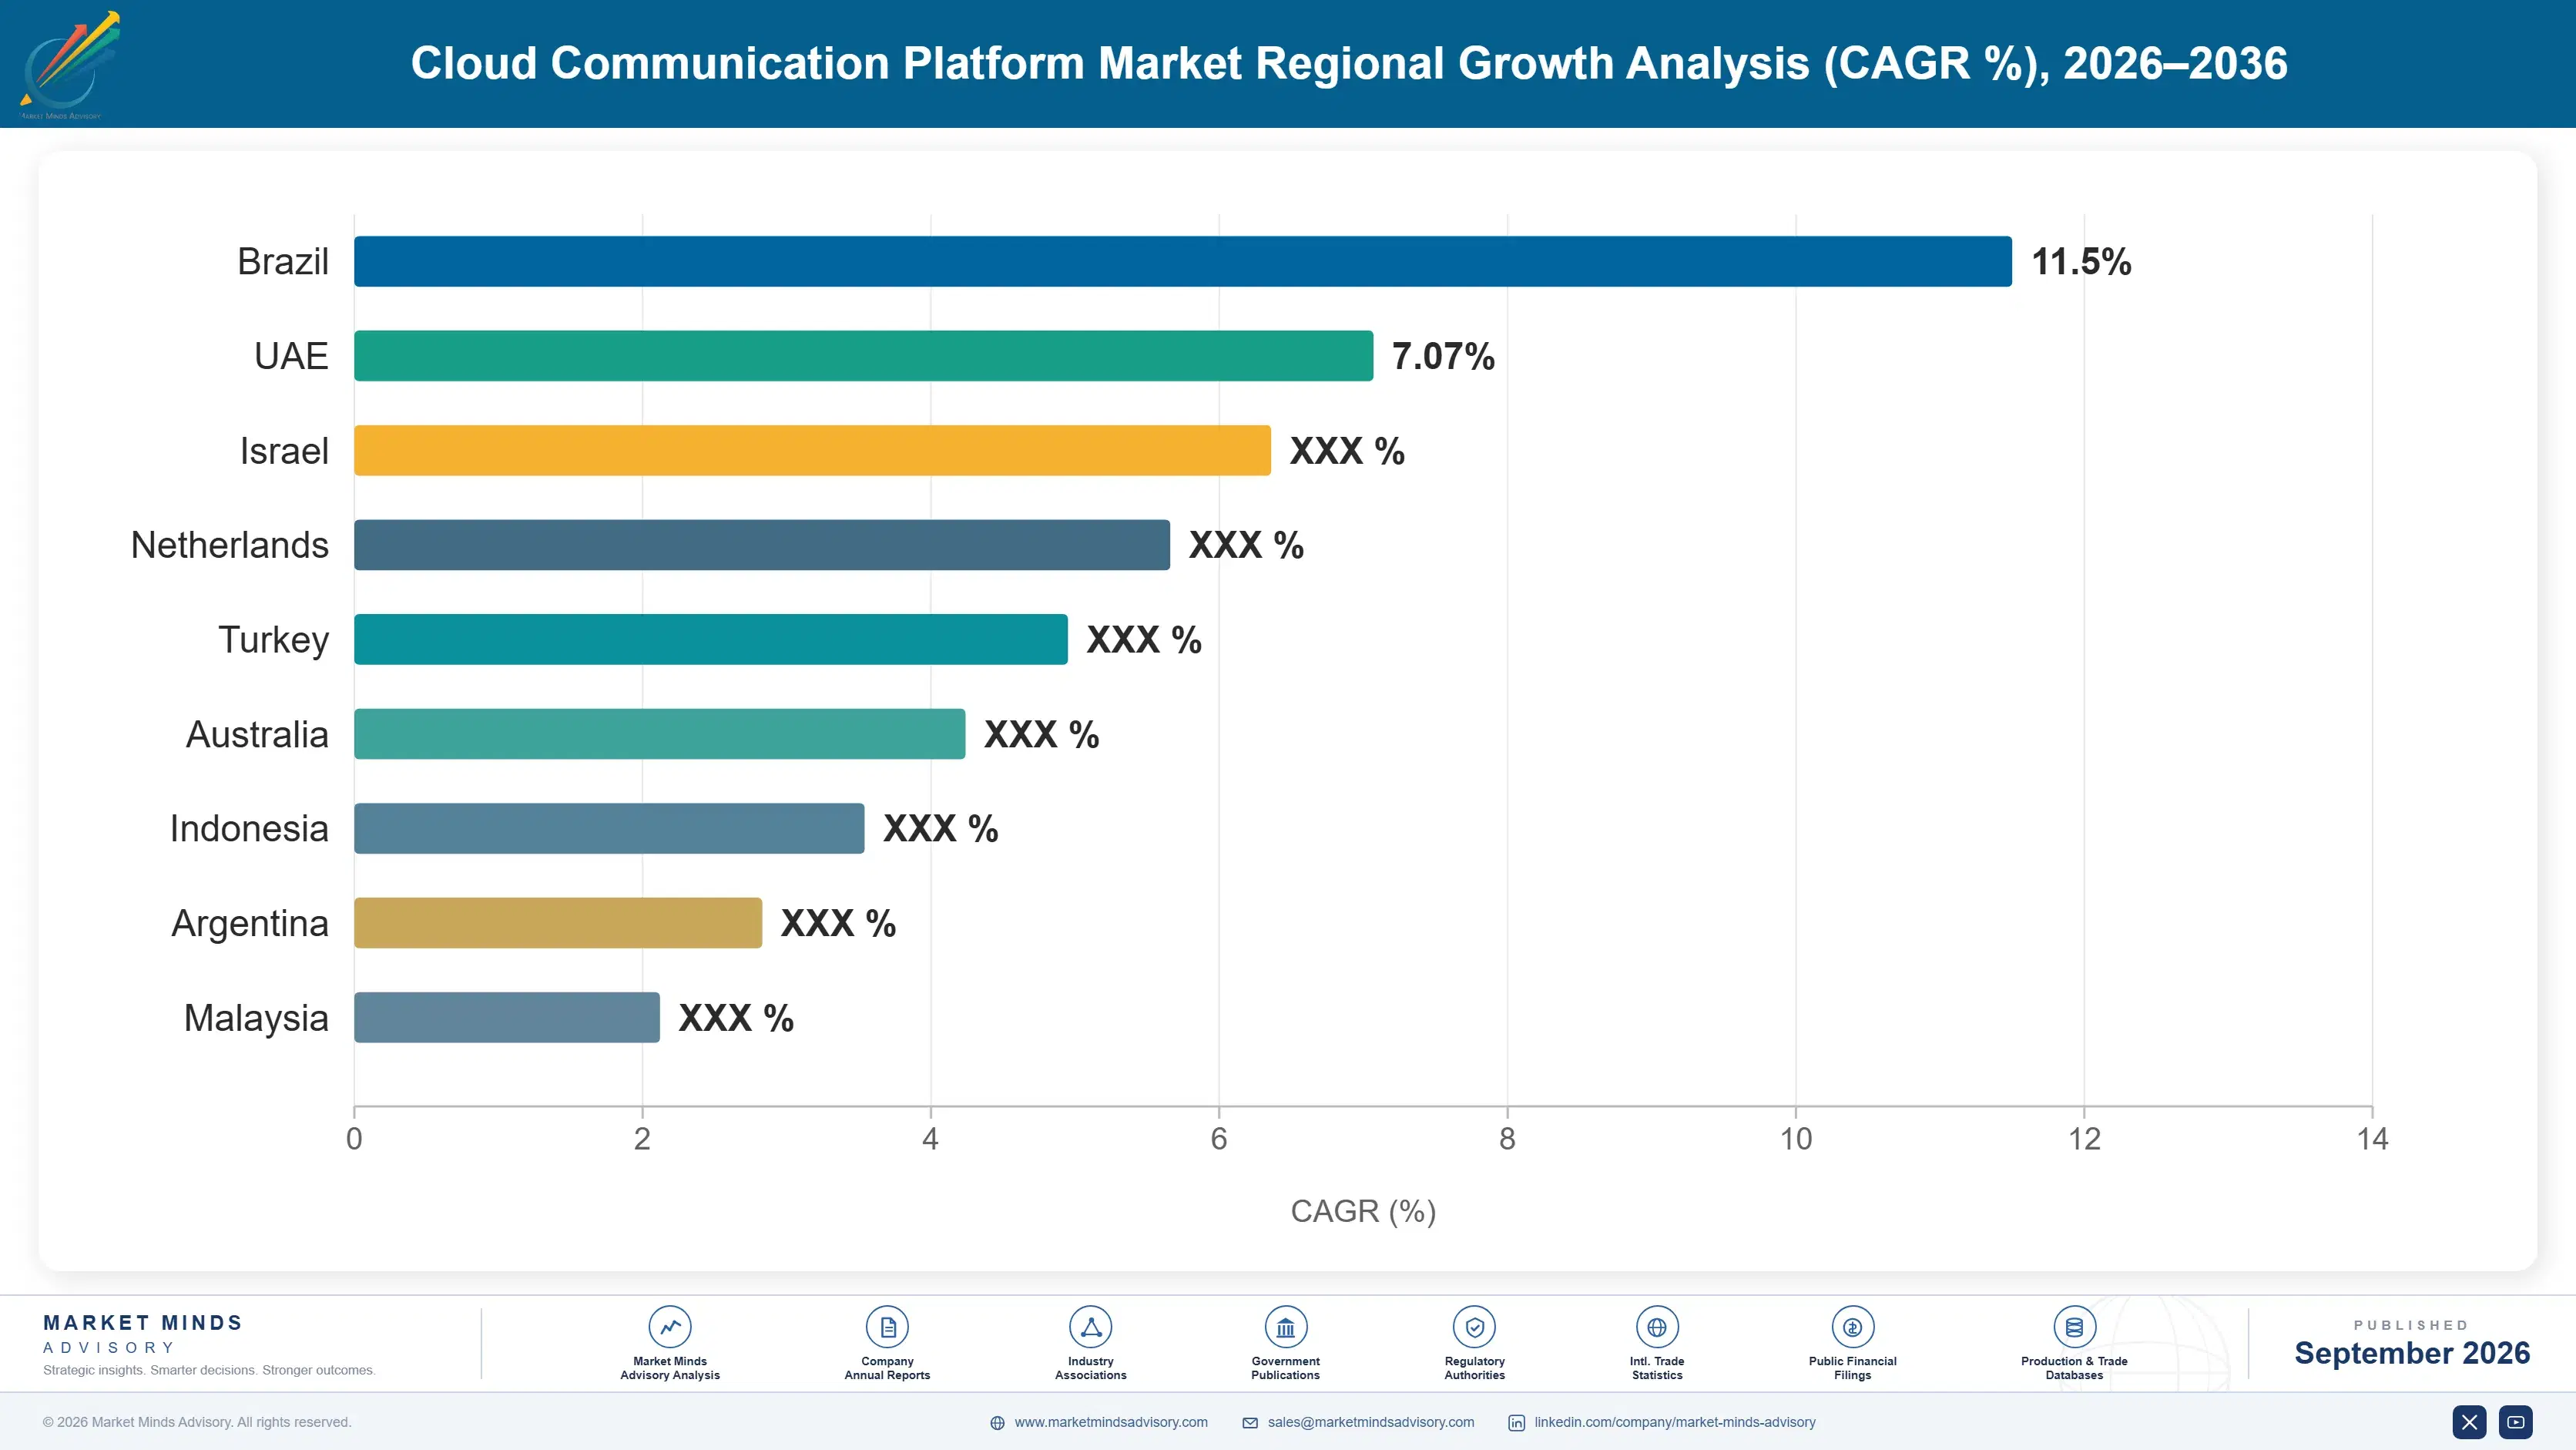
Over-the-top and rich messaging support images, structured replies, payments, and threaded conversation that plain text never could, and the pricing sits outside operator termination control. Rich messaging grows at 15.2%. Indian growth of 16.8% leads every country covered, driven by the largest application-to-person volume anywhere alongside business messaging adoption on consumer platforms that reaches most of the adult population daily. Brazilian and Indonesian adoption follows the same pattern, with businesses reaching customers on consumer platforms rather than through text. The platform rather than the operator sets the rate. Text carries none of it.
Market Impact: Termination takes 63% of revenue

Procurement Replaces Developers As The Buyer

Adoption in this market was developer-led for a decade, with teams signing up individually and spending accumulating invisibly across an organisation. Enterprises now consolidate that spending, negotiate termination rates directly, and require transparency about which portion of a price is carrier cost. Average contract values near USD 264,000 reflect that consolidation. Providers accustomed to self-service adoption find the resulting negotiations considerably less comfortable than the ones they replaced. Self-service adoption produced spending nobody had aggregated, and consolidating it is now standard practice at any organisation of size. Providers built on self-service find these negotiations uncomfortable.
Market Impact: Caps adoption near 29%

Market Restraints and Challenges

Operator Termination Inflation Compresses Retained Margin

Around 63% of revenue passes through to mobile operators, and the root cause is that operators control termination into their own subscribers and have raised application-to-person rates steadily across most large markets. Commercially this means gross revenue can grow while gross profit does not, which several participants have already experienced. Providers respond by shifting traffic to channels operators do not price, by aggregating volume for negotiation, and by moving toward verification methods that send nothing. Gross revenue growth and gross profit growth have diverged every year for several years now. Several participants have already reported exactly that pattern.
Market Impact: Adoption reaches 29% today

Network Verification Depends On Operator Coverage

Authentication from network signals works only where the subscriber's operator exposes the capability, and the root cause is that it requires coordinated interfaces across operators who compete with one another. Commercially this caps adoption at 29% regardless of enterprise demand, and a service must fall back to messaging wherever coverage is missing. Providers respond by aggregating operator access, by building fallback logic that is invisible to the customer, and by pressing industry bodies for wider participation. Fallback to messaging wherever coverage is missing undermines the cost advantage the capability was adopted to deliver.
Market Impact: Covers 8.4% of volume
4 additional market trends, 3 additional growth drivers, and 2 additional restraints and challenges are covered in the full report. Contact sales@marketmindsadvisory.com to access the complete intelligence.

Segment CAGR and Growth Architecture

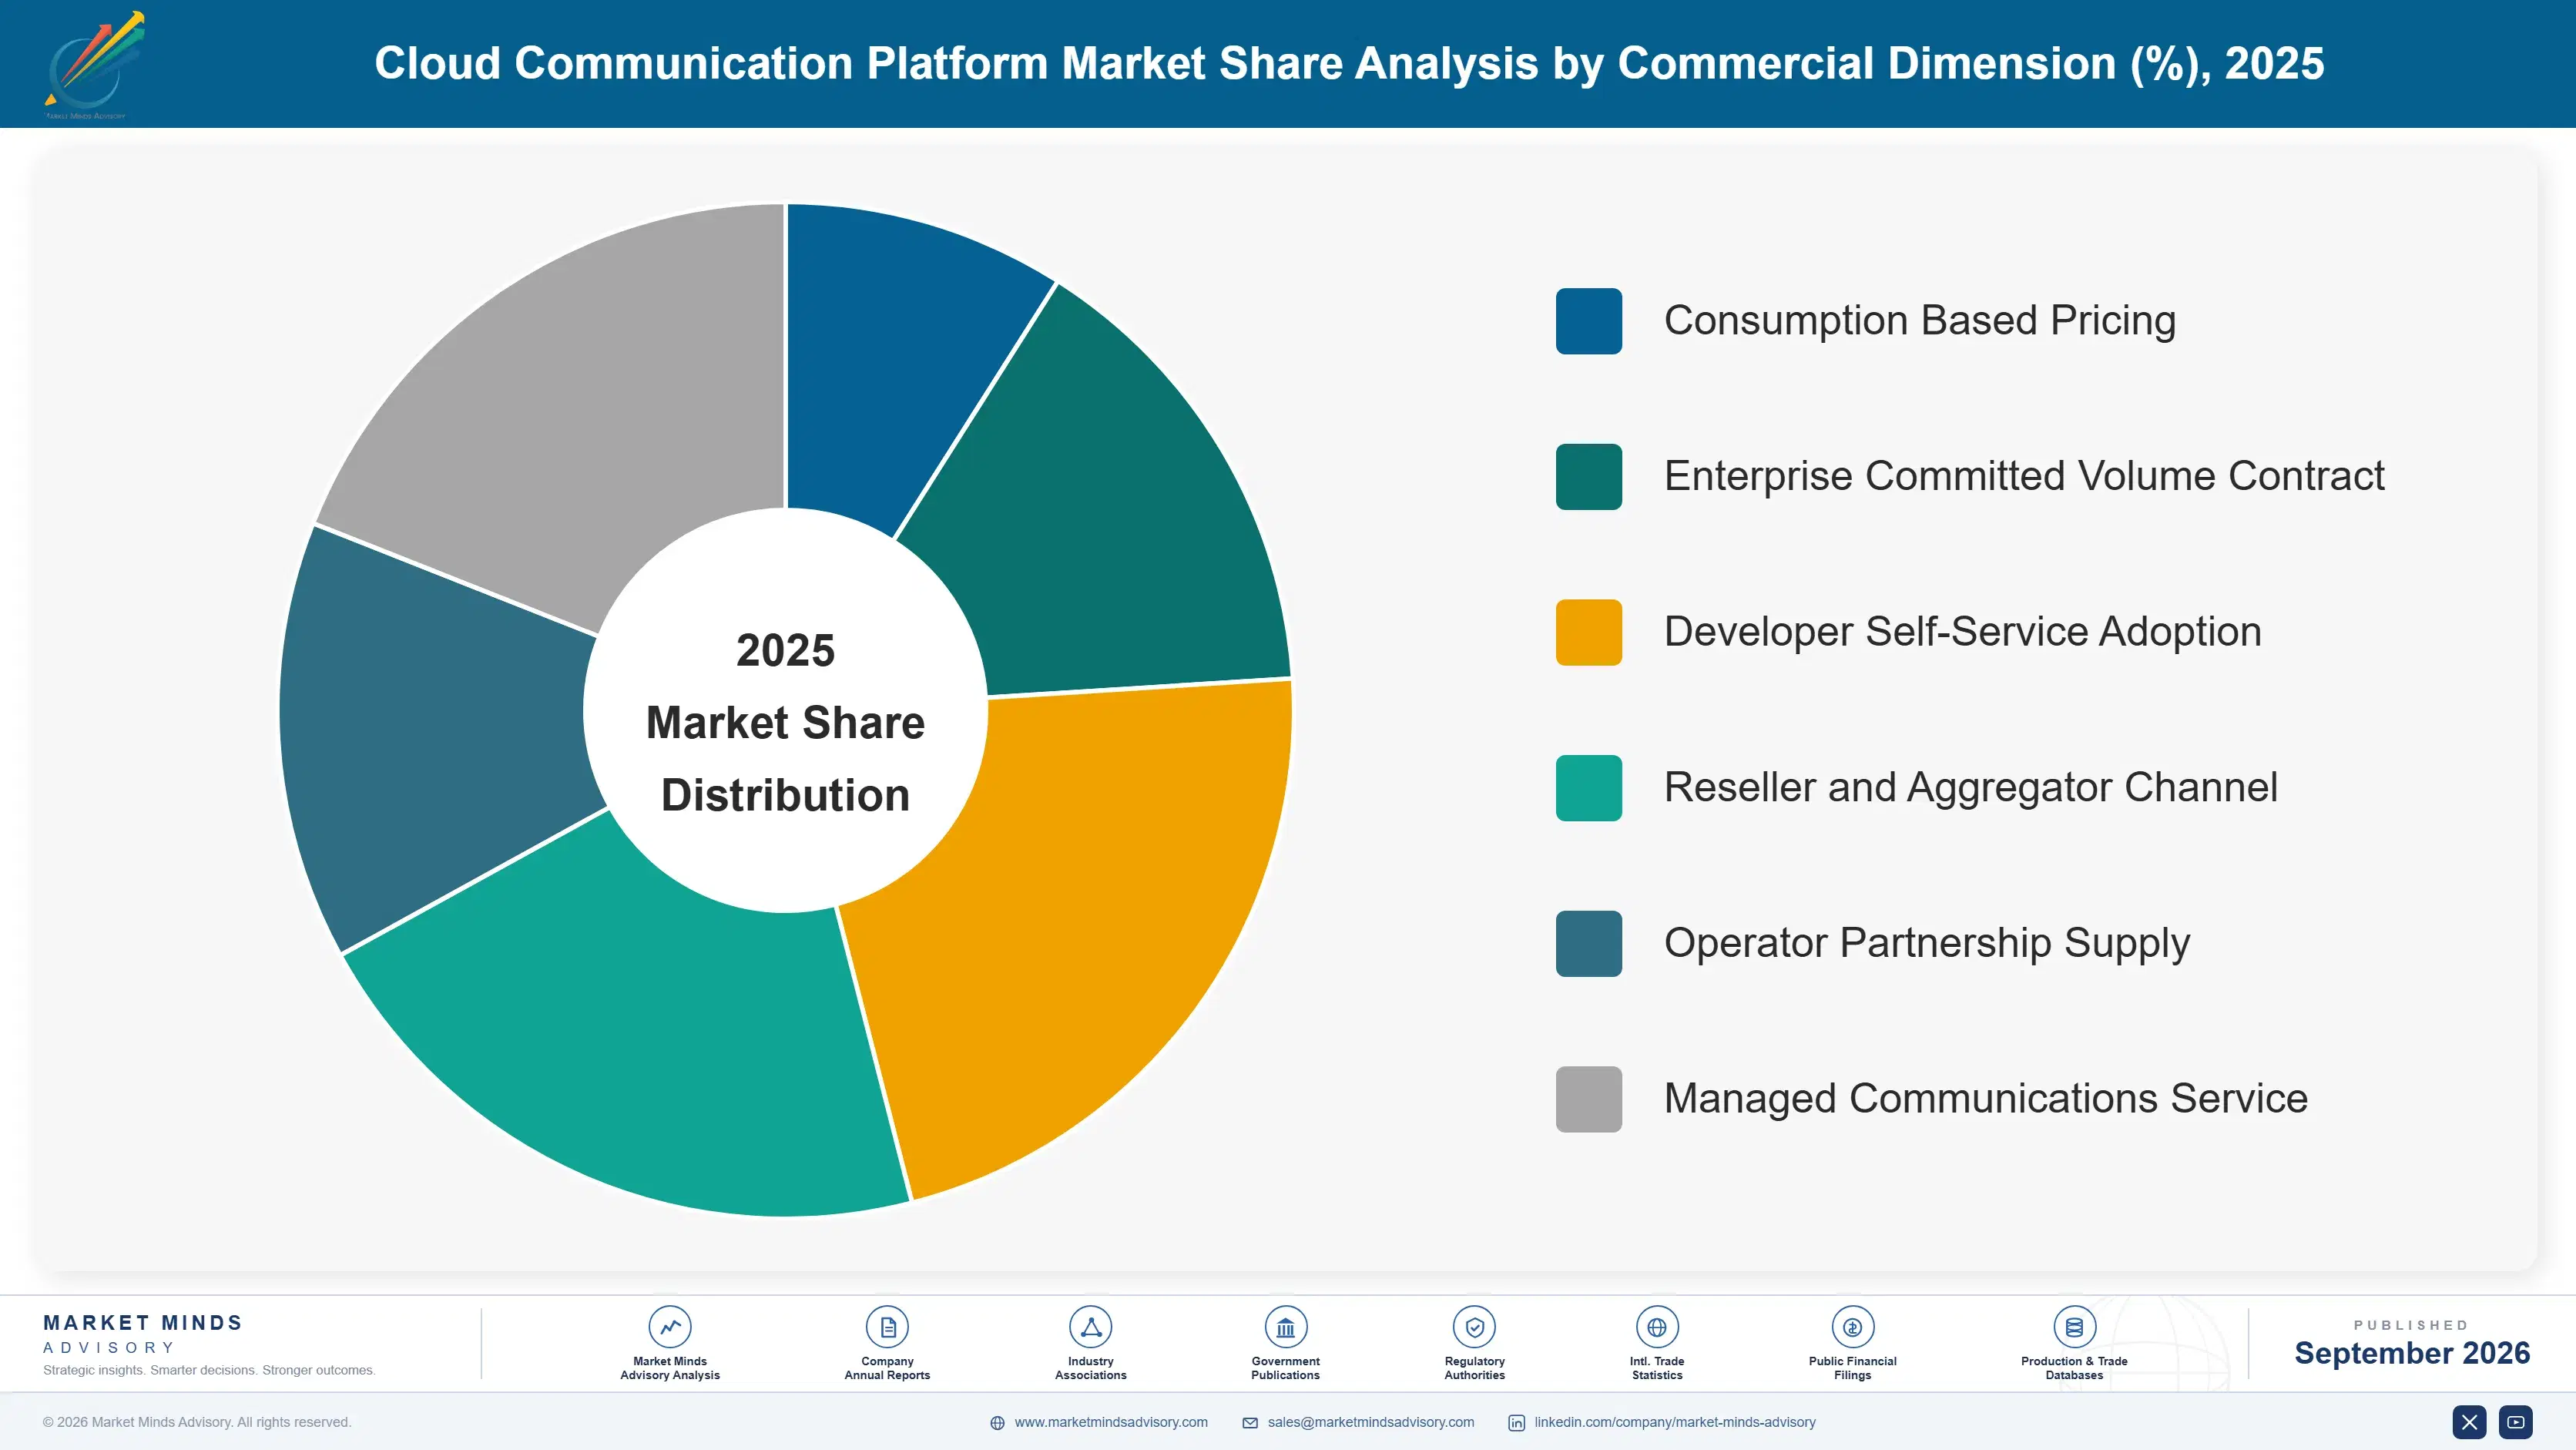
Segmentation follows communication channel and interface type. Six categories cover the market: short message and application-to-person messaging, voice and programmable telephony, rich and over-the-top business messaging, verification and network authentication, email delivery interfaces, and video and embedded communications. Termination costs are counted within the channel that incurs them rather than separately. Fraud prevention sits within the channel it protects.
cloud-communication-platforms-market-market-share-analysis-1790012001760

Verification And Network Authentication

Verification grows at 17.4%, half again the market rate of 11.6%, and it has the healthiest economics anywhere in this market. Confirming device possession from operator network signals sends nothing, costs a fraction of a message, and resists the interception that undermines codes delivered by text. Adoption sits at 29% and is limited by operator coverage rather than by enterprise appetite. The buyer is protecting account security rather than negotiating unit prices, which produces a very different conversation from the one messaging providers are used to having. Security functions increasingly specify the method directly, since interception of delivered codes has become a documented attack path they answer for. Operator coverage rather than enterprise appetite is the constraint everywhere.
CAGR 17.4%

Rich And Over-The-Top Business Messaging

Rich messaging grows at 15.2% by carrying interactions that plain text cannot support and by pricing outside operator termination control, which addresses both of this market's underlying problems at once. Images, structured replies, payment flows, and threaded conversation all become possible, and the platform rather than the mobile operator sets the rate. Adoption is deepest in India, Brazil, and Indonesia, where consumer messaging platforms reach most of the adult population daily and businesses reach customers there rather than through text. Commercial terms differ considerably by market, so channel relationships have to be built country by country rather than negotiated once globally. Regional providers compete well on that. Local carrier expertise matters.
CAGR 15.2%
Full segment breakdown across 6 segments available in the complete report.

Regional Architecture and Country Demand Map

Regional shares reflect enterprise spending rather than message volume, and the two diverge sharply because price per message varies enormously between markets. One region sits outside the standard bands, for the reason named in its paragraph below. Volume and value diverge more here than in most markets.

North America

Enterprise spending per interaction is the highest anywhere, concentrated in voice, verification, and high-value notification traffic rather than in bulk messaging volume. Procurement consolidation is furthest advanced here, with large enterprises aggregating spending that had accumulated across dozens of individual developer accounts. Growth of 10.7% is close to the world rate. Network verification coverage is comparatively good, since a small number of operators cover most subscribers and coordinating among them is simpler than in fragmented markets. Verification and high-value notification traffic dominate rather than bulk messaging, which is why revenue share exceeds message share considerably in this region. Procurement consolidation is furthest advanced here, aggregating spending that had accumulated across dozens of separate developer accounts.
Share: 30% | CAGR: 10.7% (2026 to 2036)

East Asia

Chinese business messaging runs almost entirely through domestic consumer platforms rather than through international providers, so enormous interaction volume generates comparatively little addressable revenue. Japanese and Korean enterprises spend at levels closer to Western markets on verification and notification. Growth of 12.6% exceeds the world rate. Regional providers hold most of the local volume, and international platforms compete mainly for multinational customers who need consistent interfaces across several countries at once. International platforms compete mainly for multinational customers needing consistent interfaces across several countries rather than for domestic volume they cannot reach. Chinese business messaging runs almost entirely through domestic consumer platforms, so enormous interaction volume generates comparatively little addressable revenue for anybody.
Share: 24% | CAGR: 12.6% (2026 to 2036)
Regional intelligence for 5 additional markets available in the complete report: Western Europe, South Asia and Pacific, Latin America, Middle East and Africa, Eastern Europe. Contact sales@marketmindsadvisory.com.
cloud-communication-platforms-market-country-cagr-analysis-1790012002286

Where Providers Keep The Margin

Four commercial moves separate providers building retained margin from those growing revenue that belongs to mobile operators. Each addresses either where the money goes or the fraud and pricing pressure that have made plain messaging a progressively worse business to be in. Growing revenue that belongs to somebody else achieves very little. Retained margin is the only figure worth watching.

Move Authentication Off Messaging Channels Entirely

Network-based verification sends nothing, costs a fraction of a message, and resists interception, which raises retained margin while reducing what the customer pays. Providers with broad operator coverage report gross margins 21 to 29 points above their messaging business on the same accounts. Adoption sits at 29% and coverage rather than demand is the constraint, so aggregating operator access is the work that decides who captures this shift rather than watches it. Security functions increasingly specify it directly, since intercepted codes are a documented attack path. Coverage is the whole constraint.
Market Impact: Lifts gross margins 21 to 29 points higher

Shift Traffic To Channels Operators Do Not Price

Around 63% of revenue passes through to operators who set termination rates unilaterally and have raised them steadily, which caps what any provider can retain from messaging. Rich and over-the-top channels price outside that control and grow at 15.2%. Providers actively migrating enterprise traffic report retained margin improving 14 to 22 points on migrated volume. Enterprises accept it readily, since the richer interaction is better for them independently of the economics involved. The richer interaction serves the enterprise better regardless of what it does to provider economics. Operators do not price it.
Market Impact: Improves retained margin by 14 to 22 points

Price Transparently Against Underlying Termination Cost

Procurement now consolidates spending, negotiates carrier rates, and asks which portion of a price is termination and which is provider margin. Those disclosing the split and pricing their own margin explicitly retain 2.6 times more contract value through consolidation reviews than providers defending a bundled rate. It looks like a concession and it converts an argument about total price into a narrower argument about the part the provider actually controls. It appears to be a concession and converts a total price argument into a much narrower one. Bundled rates lose that argument.
Market Impact: Retains 2.6 times more value through consolidation reviews

Detect Inflated Traffic Before Customers Pay

Artificially inflated traffic accounts for roughly 8.4% of messaging volume, and enterprises pay for messages nobody wanted while providers absorb the disputes afterwards. Providers detecting and blocking such traffic before billing report churn 31 to 44% below those settling disputes retrospectively. Detection is imperfect because the traffic resembles genuine registration flows, but attempting it visibly is worth considerably more in trust than the fraction it fails to catch costs. Enterprises remember being billed for traffic nobody wanted far longer than they remember any credit. Blocking beforehand protects the relationship instead.
Market Impact: Cuts customer churn by 31 to 44% lower

Who Controls the Margin Pool

Concentration is moderate. Five providers hold 46% of platform revenue, measured consistently on that basis across all participants, and the field includes global platforms, regional specialists with strong carrier relationships, and operator-affiliated businesses selling into their own markets. Scale matters most in termination negotiation, which is a distribution advantage rather than a technology one.
Competition currently turns on three things: operator coverage for network verification, which caps what any provider can deliver; carrier rate negotiation, where volume aggregation is the only real lever; and channel breadth across rich messaging platforms whose commercial terms differ by market. Interface quality decides considerably less than it did during the developer-led decade. Price decides bulk messaging where every provider buys from the same operators, and decides considerably less in verification, where coverage rather than rate determines whether a provider can serve the account at all.

Pressure comes from two directions. Operators sell verification and messaging capability directly through industry gateways, disintermediating providers on their own subscribers. Meanwhile consumer messaging platforms set their own business terms without any provider involvement. Rankings will shift toward participants holding verification coverage and rich channel access, since both sit outside operator termination pricing. Messaging-only providers hold the weakest position.
cloud-communication-platforms-market-company-positioning-matrix-1790012002818

Competitive Moat and Risk Dimensions

TWILIO

Moat: Developer Adoption And Breadth

Interfaces adopted across an enormous population of developers created default status that survives procurement consolidation, since replacing embedded communication code across many applications costs more than most enterprises will approve. Breadth across channels also means a single relationship covers requirements that would otherwise involve several providers.
TWILIO

Risk: Messaging Margin Under Pressure

A large messaging business carries the termination economics that limit retained margin regardless of scale, and operators continue raising application-to-person rates. Shifting that volume toward verification and rich channels means competing against providers whose businesses were built around those channels from the start. Those competitors started there.
INFOBIP

Moat: Carrier Relationships And Coverage

Direct connections and commercial relationships across a very wide operator base improve termination rates and, more importantly now, determine which subscribers can be verified from network signals. That coverage is assembled market by market over years and cannot be purchased as a product by anybody arriving later.
INFOBIP

Risk: Operator Direct Disintermediation Risk

The same operators supplying coverage are building industry gateways to sell verification and messaging capability directly to enterprises, using the relationship the provider helped establish. Partnership and competition run through the same connections, which makes the position strong today and difficult to defend indefinitely. The tension is permanent.

Players Tracked

Prominent Players

Twilio
Sinch
Infobip
Vonage
Bandwidth

Other Key Players

Bird
Kaleyra
Route Mobile
Gupshup
Plivo
Telnyx
LINK Mobility
CM.com
Syniverse
Tanla Platforms
Vodafone
Deutsche Telekom
Amazon Web Services
Microsoft
Zenvia

Recent Developments

FEBRUARY 2026

Sinch Releases Network Verification Replacing Message Based Authentication Codes

Sinch released authentication drawing on operator network signals rather than delivered codes, removing the interception risk of text messages while cutting cost per verification to a fraction of what sending a message requires. Coverage remains the limiting factor everywhere. Fallback continues where operators expose no interface.
Signal: Verification that sends nothing improves margin and customer cost together, which is rare here. Coverage decides everything.
SEPTEMBER 2025

Infobip Acquires Verification Technology Developer For Network Signal Depth

Infobip completed an acquisition of a verification technology developer, adding network signal capability across operator interfaces that the company had previously delivered through message-based fallback in most of its markets. Assembling operator interfaces market by market takes years, which is why acquiring the capability outpaced developing it internally.
Signal: Coverage is assembled market by market, which is why buying capability outpaces building it. Years of work otherwise.
MAY 2025

Vodafone Signs Network Interface Supply Agreement With Communication Providers

Vodafone entered supply agreements exposing network verification interfaces to communication platform providers across several markets, with no acquisition or joint venture involved, extending coverage that had previously been fragmented. The same operators supplying this coverage sell verification directly to enterprises through industry gateways of their own.
Signal: Operators supplying coverage also sell directly, so partnership and competition share the same connection. Both at once, indefinitely.

Where The Money Actually Goes

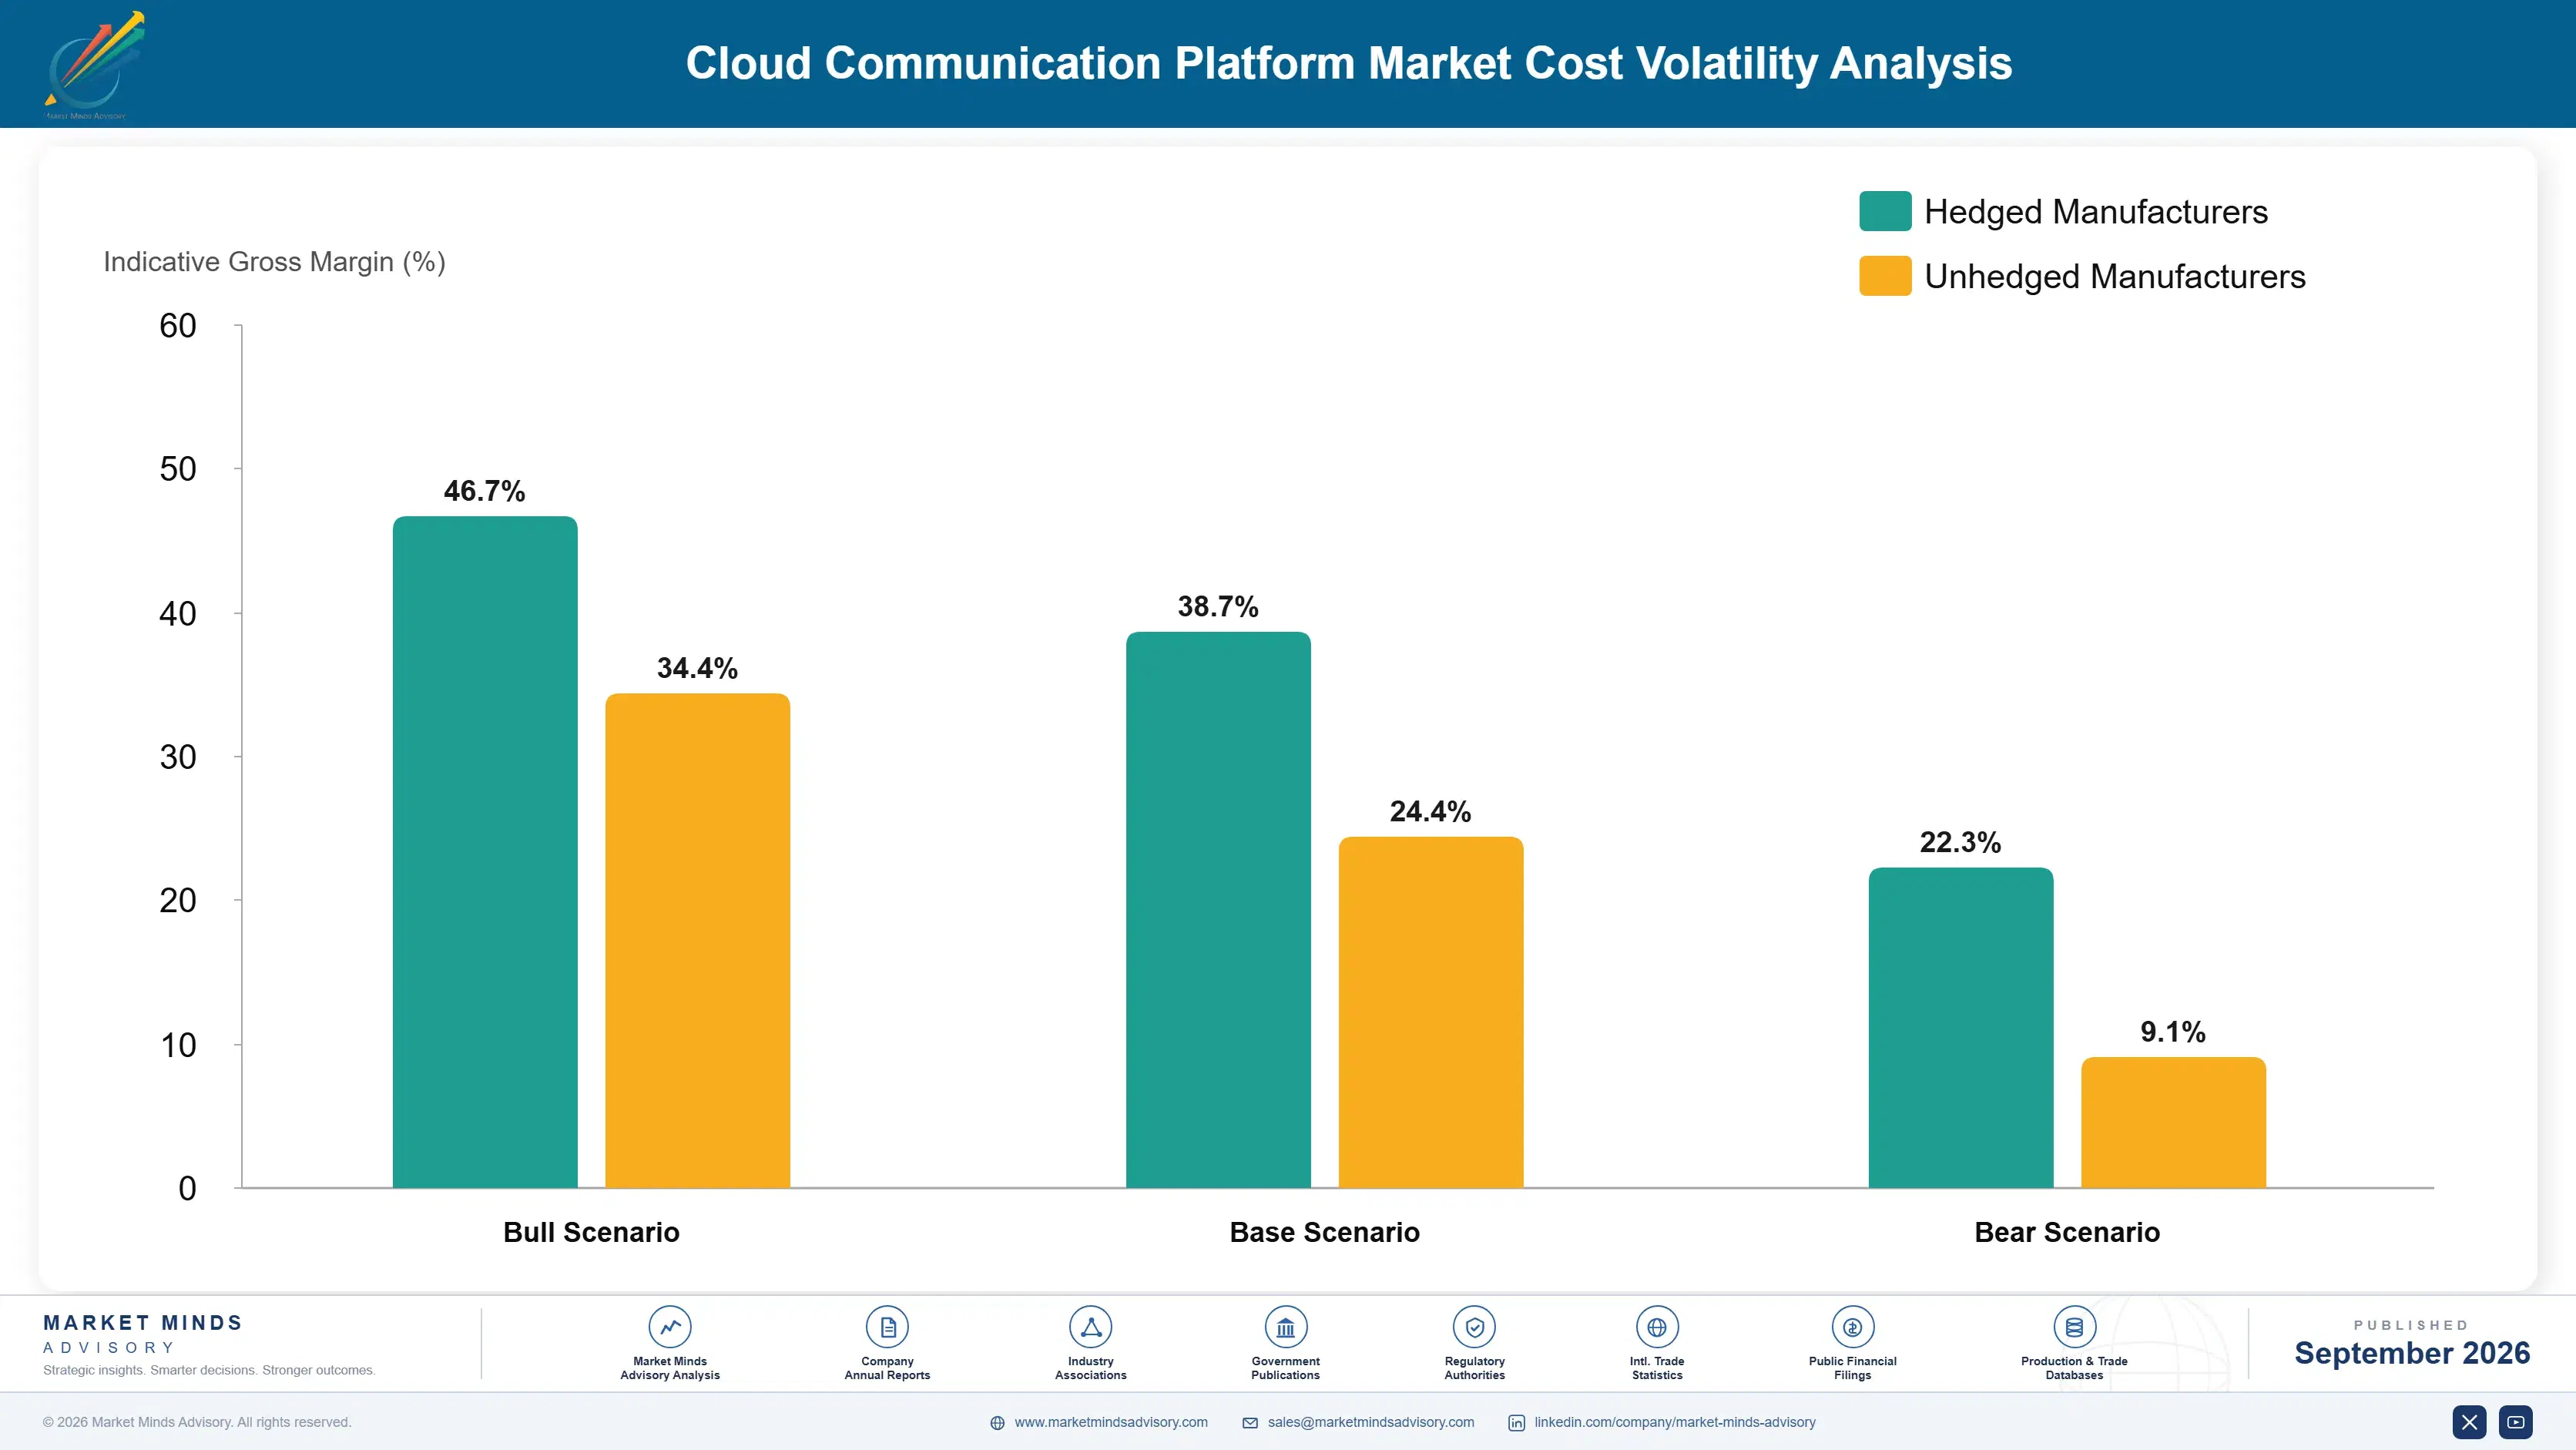
One input dominates everything else. Carrier termination and interconnect run 58% to 68% of cost of revenue, paid to mobile operators who set those rates for access to their own subscribers and have raised them steadily. Platform infrastructure takes 14% to 20%, which is modest for what presents itself as a software business. Fraud prevention, compliance, and support add 12% to 18%, rising as inflated traffic schemes grow more sophisticated.
Application-to-person termination rates rose across most large markets through 2024 and 2025 as operators recognised messaging as a revenue line rather than a network by-product, and several providers described the resulting margin compression in their annual reports for those years. GSMA analysis documented the pricing shift and the parallel growth in artificially inflated traffic, which together made plain messaging a progressively worse business to hold.

The competitive disadvantage mechanism runs through carrier relationships rather than technology. A provider without direct operator connections buys termination through aggregators at worse rates and cannot offer network verification where it lacks access at all. Exposure varies sharply by provider type: those with wide direct coverage negotiate and verify, while smaller participants resell capacity on terms somebody else negotiated for them.
cloud-communication-platforms-market-cost-volatility-analysis-1790012003014

Aggregate Volume Before Negotiating Termination Rates

Operators set application-to-person rates and have raised them steadily, and the only meaningful counterweight is committed volume across many enterprise customers presented as one negotiation. Providers who aggregate secure rates that smaller participants cannot access, which compounds into a cost advantage on every message they subsequently carry anywhere. Smaller participants cannot reach those rates at all.

Build Direct Operator Connections Market By Market

Buying termination through aggregators costs more and provides no path to network verification, which is the fastest growing and highest margin capability in this market. Direct connections take years to assemble across enough operators to matter, and they determine both cost position and which subscribers a provider can verify at all. Coverage decides which subscribers can be verified.

Block Inflated Traffic Before It Reaches Billing

Artificially inflated traffic accounts for roughly 8.4% of messaging volume, and settling disputes after enterprises have been billed damages trust far beyond the amounts refunded. Detection before billing is imperfect and visibly attempting it protects relationships that retrospective credits never repair adequately. Enterprises remember the invoice far longer than the credit note that followed it.

Portfolio Architecture for Margin Defence

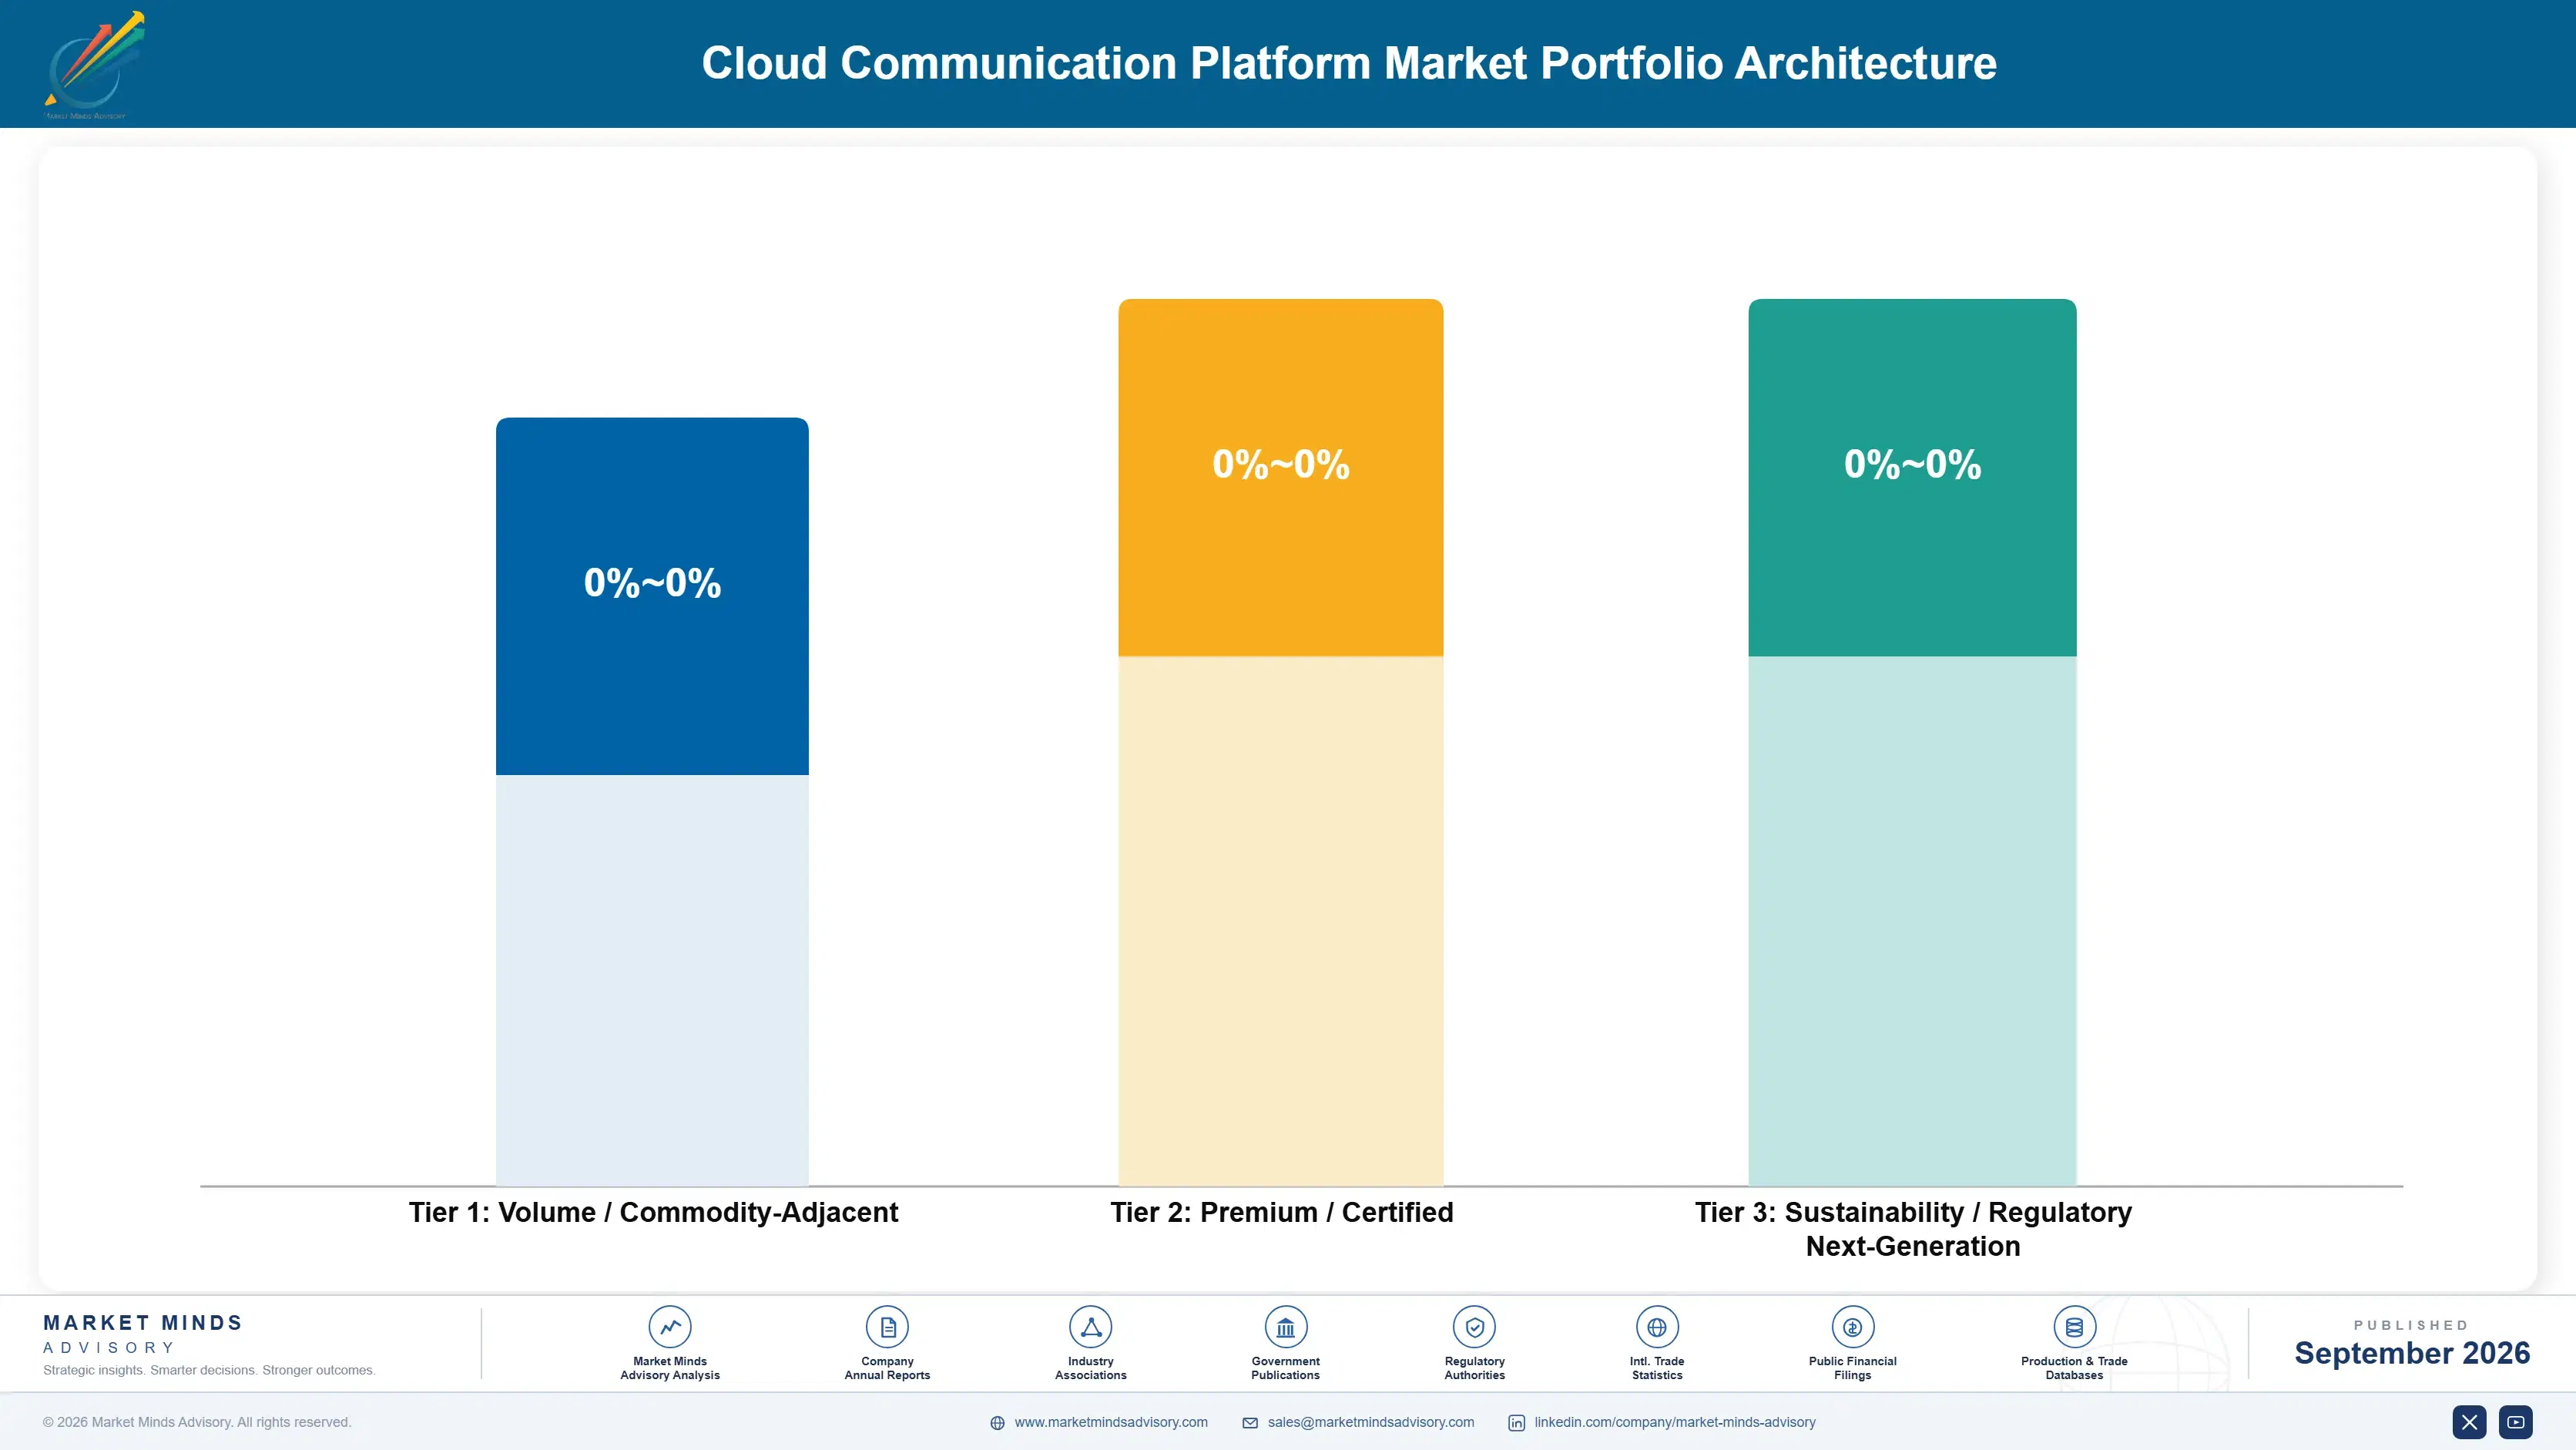
Margin follows whether an operator prices the channel. Plain messaging is close to a pass-through, with termination taking most of the revenue and providers retaining a thin layer on top. Voice earns somewhat better. Rich channels earn more because platforms rather than operators set the rate, and network verification earns most because it sends nothing and the buyer is not comparing unit prices. Whether an operator prices the channel decides this entire hierarchy.
The tension between volume and premium runs through what the customer is buying. An enterprise sending bulk notifications compares cost per message across providers who all buy from the same operators, which is a commodity negotiation. An enterprise protecting account security buys reliability and coverage, and does not treat verification as a per-unit purchase at all.

High-value pools concentrate where failure has consequence: financial services authentication, healthcare notification, and any flow where a missed or intercepted message causes real harm. None of those buyers leads on price. Where the traffic is promotional bulk messaging, termination sets the floor, providers compete on the remainder, and the remainder keeps shrinking. The remainder keeps shrinking each year.

Volume / Commodity-Adjacent

Bulk application-to-person messaging where termination takes most of the revenue and providers all buy from the same operators. The ten-point range reflects termination rates achieved through volume aggregation rather than any difference in platform capability.
Gross Margin: 14% to 24%

Premium / Certified

Voice, email, and rich messaging channels where platforms rather than mobile operators set the underlying rate. The fourteen-point range separates providers with direct channel relationships from those reselling access somebody else negotiated on their behalf.
Gross Margin: 34% to 48%

Sustainability / Regulatory / Next-Generation

Network verification and embedded communications where nothing is sent, operator coverage gates participation, and the buyer is purchasing security rather than units. The sixteen-point range reflects how much operator coverage each provider has assembled.
Gross Margin: 52% to 68%
cloud-communication-platforms-market-portfolio-architecture-1790012003577

High-value Sub-segments and Strategic Watch-out

Network Based Verification

Highest value and fastest growth at 17.4%, sending nothing while resisting the interception that undermines codes delivered by text message. The sixteen-point range reflects operator coverage, which gates delivery entirely and takes years to assemble. Security teams specify the method directly now. Buyers stopped comparing unit prices here.
Gross Margin: 54% to 70%

Rich And Over-The-Top Channels

High value growing at 15.2%, priced by platforms rather than by operators, which addresses this market's central margin problem directly. The fourteen-point range reflects channel relationships and commercial terms that differ considerably by market. Relationships are built country by country here. Platforms rather than operators set the rate.
Gross Margin: 38% to 52%

Voice And Programmable Telephony

Volume core with better economics than messaging, since interconnect pricing has risen more slowly than application-to-person termination has. The twelve-point range reflects direct carrier connection depth and how much traffic terminates on partner networks. Interconnect pricing has risen more slowly than messaging. Direct connections decide the cost position.
Gross Margin: 30% to 42%

Bulk Application-To-Person Messaging

The strategic watch-out. Termination takes 63% of revenue, operators keep raising rates, and inflated traffic adds cost nobody wanted. The ten-point range reflects negotiated termination and nothing a provider genuinely controls. Providers all buy from the same operators. Inflated traffic adds cost nobody wanted at all.
Gross Margin: 12% to 22%

How This Revenue Recurs

Revenue is consumption-based and recurs with whatever the customer sends, which aligns provider income with customer activity and makes it grow without renegotiation. That was the model's great advantage during the developer-led decade. It also means revenue falls immediately when a customer optimises its messaging, which they increasingly do once procurement examines the invoice properly. Consumption pricing cuts in both directions.
Attachment depth follows embedded code and operator coverage rather than commercial relationship. An enterprise with communication interfaces written into many applications faces replacement work it will not approve for a modest rate improvement. An enterprise buying bulk messaging through a single integration switches on price without much difficulty, which describes most of the volume in this market. Embedded code rather than satisfaction holds the account in place.

The buyer has moved from developers toward procurement and security functions. Communication interfaces were once adopted by engineering teams solving an immediate problem, with spending accumulating invisibly across an organisation. Procurement now consolidates and negotiates, while security teams increasingly specify verification method because interception of message-delivered codes has become a documented attack path they are accountable for. Two functions now hold what one used to.
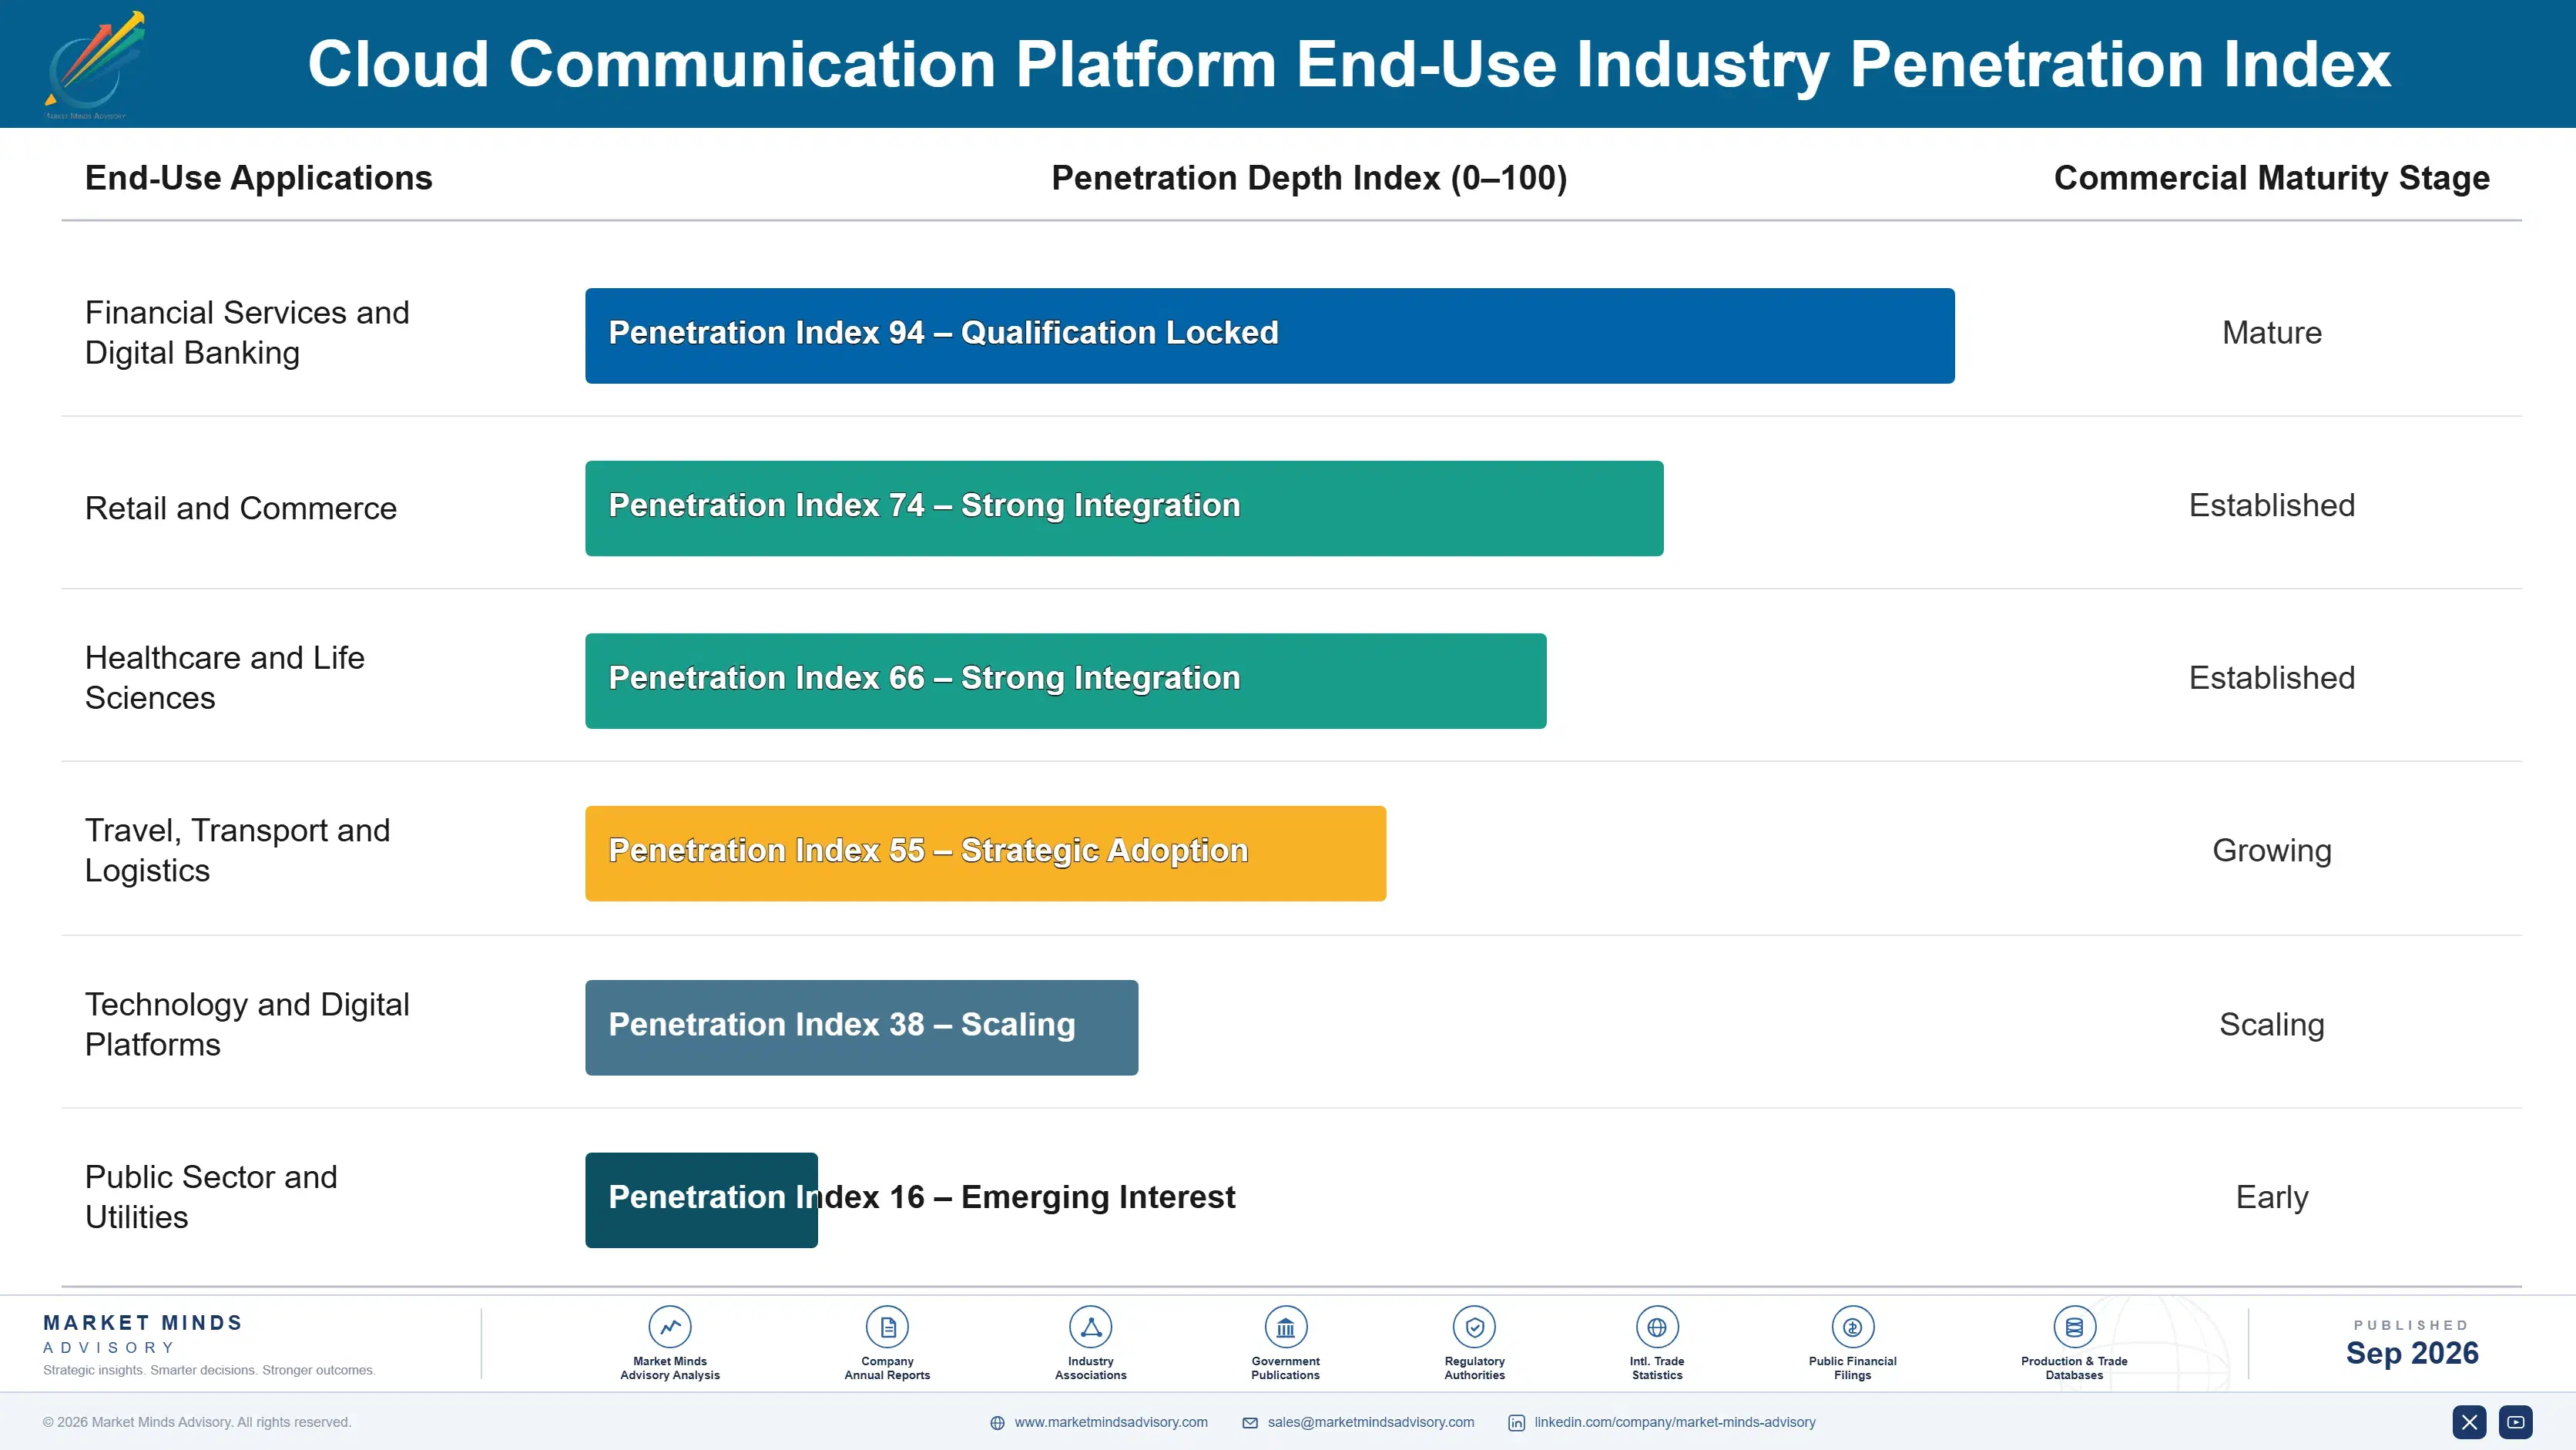
cloud-communication-platforms-market-end-use-penetration-index-1790012004076

Where This Market Rewards

These are among the four positions where our research anticipates prominent divergence between winners and laggards over the coming forecast period. Each is grounded in the demand model, the regulatory perimeter, and the announced capacity pipeline.
01 / VERIFICATION MARGIN CAPTURE

The best product sends nothing at all

Network-based verification confirms device possession from signals the operator already holds, costing a fraction of a message while resisting the interception that undermines delivered codes entirely. Providers with broad operator coverage report gross margins 21 to 29 points above their messaging business on identical accounts. Adoption sits at 29% and coverage rather than demand is the constraint, so assembling operator access decides who captures the shift, and security teams now specify the method rather than procurement alone, and intercepted codes are now a documented attack path.
02 / CHANNEL MIGRATION URGENCY

Move traffic beyond operator pricing control

Around 63% of revenue passes to operators who set termination rates unilaterally and have raised them steadily across most large markets in recent years. Rich and over-the-top channels price outside that control and grow at 15.2%, and providers migrating enterprise traffic report retained margin improving 14 to 22 points. Enterprises accept the change readily, since richer interaction serves them better regardless of what it does to provider economics, which makes the migration easier to propose than most cost changes, and operators have no pricing control over those channels.
03 / PRICING TRANSPARENCY ADVANTAGE

Disclose the split before procurement demands it

Procurement now consolidates spending, negotiates carrier rates directly, and asks which part of a quoted price is termination and which is provider margin. Those disclosing the split retain 2.6 times more contract value through consolidation reviews than providers defending a bundled rate they cannot justify. It appears to be a concession and converts a total price argument into a narrower one about the portion the provider controls, which is a far better argument for the provider to be having, since only that portion is genuinely within a provider's control.
04 / FRAUD DETECTION TRUST

Nobody forgets being billed for fraud

Artificially inflated traffic accounts for roughly 8.4% of messaging volume, and enterprises pay for messages nobody wanted while providers settle the disputes afterwards. Those detecting and blocking such traffic before billing report churn 31 to 44% below providers issuing retrospective credits instead. Detection is imperfect because the volume resembles genuine registration flows, and visibly attempting it protects relationships that refunds never repair adequately, and enterprises remember the invoice longer than the credit note, and refunds never repair the relationship the invoice damaged.

Engagement Snapshot From the Field

A live engagement with an industry participant carrying material or product regulatory and market exposure ahead of a defining policy shift, showing how our research translates into a defensible multi-year portfolio strategy.
MARKET MINDS ADVISORY · CLIENT ENGAGEMENT SUMMARY
Cloud Communication Platform Producer Strategic Portfolio Review and Transition Roadmap 2026·Investment Scenario on Cloud Communication Platform Exposure Evaluation 2025-26
CLIENT PROFILE
A digital bank serving roughly 11 million customers across four markets, spending approximately USD 18 million annually on messaging, voice, and verification across three communication platform providers (client-reported, unverified by MMA). Verification codes accounted for the substantial majority of message volume. None of the three providers had disclosed how much of the invoice was carrier termination cost.
STRATEGIC CHALLENGE
Communication spending had grown 61% in two years while customer numbers grew 22%, and nobody could explain the gap. Separately, the security function had raised concerns about authentication codes being intercepted, and the two conversations were happening entirely independently of one another. Neither function had spoken to the other about it.
MMA APPROACH
MMA reconciled message volumes against genuine customer activity, tested registration traffic patterns for signs of artificially inflated volume, and modelled network-based verification against message-delivered codes across all four markets on both cost and interception exposure. Provider invoices were decomposed into termination and retained margin wherever the data permitted it. Coverage was mapped per market.
KEY FINDINGS
  1. Around 9.6% of verification message volume showed patterns consistent with artificially inflated traffic, concentrated in two markets and in registration flows that never completed.
  2. Termination cost accounted for 68% of the messaging invoice, and none of the three providers had disclosed that split until the bank asked each of them directly.
  3. Network verification was available for 71% of customers across the four markets, at roughly a fifth of the cost of a delivered message and without interception exposure.
  4. The security and procurement functions had never discussed authentication method, so the cost case and the risk case for the same change were being built separately.
CLIENT PROFILE
A digital bank serving roughly 11 million customers across four markets, spending approximately USD 18 million annually on messaging, voice, and verification across three communication platform providers (client-reported, unverified by MMA). Verification codes accounted for the substantial majority of message volume. None of the three providers had disclosed how much of the invoice was carrier termination cost.
STRATEGIC CHALLENGE
Communication spending had grown 61% in two years while customer numbers grew 22%, and nobody could explain the gap. Separately, the security function had raised concerns about authentication codes being intercepted, and the two conversations were happening entirely independently of one another. Neither function had spoken to the other about it.
MMA APPROACH
MMA reconciled message volumes against genuine customer activity, tested registration traffic patterns for signs of artificially inflated volume, and modelled network-based verification against message-delivered codes across all four markets on both cost and interception exposure. Provider invoices were decomposed into termination and retained margin wherever the data permitted it. Coverage was mapped per market.
KEY FINDINGS
  1. Around 9.6% of verification message volume showed patterns consistent with artificially inflated traffic, concentrated in two markets and in registration flows that never completed.
  2. Termination cost accounted for 68% of the messaging invoice, and none of the three providers had disclosed that split until the bank asked each of them directly.
  3. Network verification was available for 71% of customers across the four markets, at roughly a fifth of the cost of a delivered message and without interception exposure.
  4. The security and procurement functions had never discussed authentication method, so the cost case and the risk case for the same change were being built separately.
RECOMMENDED STRATEGY
Phase 1: Phase one: implement network verification wherever operator coverage exists, retaining message fallback only for the subscribers it genuinely cannot reach. Phase 2: Phase two: require termination cost disclosure from all providers at renewal and negotiate provider margin separately from the carrier component. Phase 3: Phase three: block incomplete registration flows showing inflated traffic patterns before messages are sent rather than disputing them afterwards. Disputes recover little.
OUTCOME
Verification cost fell 54% within two quarters while coverage improved (client-reported, unverified by MMA). Suspected inflated traffic dropped by roughly four fifths after registration flow changes. Two providers disclosed termination splits and one declined, losing the renewal. Security and procurement now review authentication together each year.

Frequently Asked Questions

Foundational context covering the market sizes, CAGR, scope, country, region and competition that inform every finding below. This section is provided to cover basics and most often pre-purchase conversations, answered from the MMA Primary Research Dataset.

What is the current size of the Cloud Communication Platform Market?

The market was worth USD 18.6 billion in 2025 and reaches USD 20.8 billion in 2026. Value covers gross platform revenue including carrier termination passed through.

How large will the Cloud Communication Platform Market be by 2036?

MMA forecasts USD 62.3 billion by 2036, an increase of USD 41.5 billion across the forecast period. That represents 3.00 times the 2026 base of USD 20.8 billion.

What is the CAGR for the Cloud Communication Platform Market 2026 to 2036?

The base case compound annual growth rate is 11.6%, with a bull case at 12.8% and a bear case at 10.4%. Historical growth from 2020 to 2025 ran at 10.2%.

Which segment is growing fastest?

Verification and network authentication grows at 17.4%, half again the market rate of 11.6%. It sends nothing, costs a fraction of a message, and resists interception.

Who are the major companies in the Cloud Communication Platform Market?

Twilio, Sinch, Infobip, Vonage, and Bandwidth lead, together holding 46% of platform revenue. Scale matters most in termination negotiation rather than in any technology advantage.

Which country is growing fastest?

India grows at 16.8%, driven by the largest application-to-person messaging volume found anywhere alongside business messaging on consumer platforms that reaches most adults every day.

Report Segmentation Architecture

The full report scope spans multiple orthogonal segmentation dimensions, with cross-tabulated demand data provided for each dimension pair. Coverage extends further to regional breakdowns, trend trajectories, and the competitive detail needed to support segment-level decision-making.

By Communication Channel

  • SMS and Application-To-Person Messaging
  • Voice and Programmable Telephony
  • Rich and Over-The-Top Business Messaging
  • Verification and Network Authentication
  • Email Delivery Interfaces
  • Video and Embedded Communications

By End-Use Industry

  • Financial Services and Digital Banking
  • Retail and Commerce
  • Healthcare and Life Sciences
  • Travel, Transport and Logistics
  • Technology and Digital Platforms
  • Public Sector and Utilities

By Commercial Dimension

  • Consumption Based Pricing
  • Enterprise Committed Volume Contract
  • Developer Self-Service Adoption
  • Reseller and Aggregator Channel
  • Operator Partnership Supply
  • Managed Communications Service

By Region

  • North America
  • East Asia
  • Western Europe
  • South Asia and Pacific
  • Latin America
  • Middle East and Africa
  • Eastern Europe

Scope, Methodology, and Coverage

Every figure in this report is reproducible from documented input assumptions. The scope below maps the historical period, the forecast horizon, the segmentation dimensions, and the countries covered, alongside the underlying primary and qualitative methodology.
Historical Period
2020 to 2025
Forecast Period
2026 to 2036
Base Year
2025 (USD billions; MMA Primary Research Dataset, September 2026)
Market Definition
This market covers programmable communications delivered as cloud application programming interfaces, including short message and application-to-person messaging, voice and programmable telephony, rich and over-the-top business messaging, verification and network authentication, email delivery interfaces, and video and embedded communications. It excludes unified communications suites, contact centre applications, carrier wholesale interconnect between operators, and marketing automation platforms.
Quantitative Units
USD billions, gross platform revenue including termination
Segmentation Dimensions
Communication channel, end-use industry, commercial dimension, region
Regions Covered
North America, East Asia, Western Europe, South Asia and Pacific, Latin America, Middle East and Africa, Eastern Europe
Countries Covered
United States, Canada, Mexico, China, Japan, South Korea, Taiwan, United Kingdom, Germany, France, Netherlands, Sweden, Spain, Italy, Switzerland, India, Indonesia, Philippines, Vietnam, Australia, Brazil, Mexico, Colombia, Argentina, Saudi Arabia, United Arab Emirates, Nigeria, Kenya, South Africa, Poland
Key Companies Profiled
Twilio, Sinch, Infobip, Vonage, Bandwidth, Bird, Kaleyra, Route Mobile, Gupshup, Plivo, Telnyx, LINK Mobility, CM.com, Syniverse, Tanla Platforms, Vodafone, Deutsche Telekom, Amazon Web Services, Microsoft, Zenvia
Quantitative Methodology
Primary survey, n=3,800 respondents, Q4 2025, six countries; demand-side model with trade association cross-validation
Qualitative Methodology
47 expert interviews, Q4 2025; applied to validate demand model assumptions, identify emerging dynamics, and assess competitive positioning
Report Format
PDF and XLSX data workbook (Word format preview document)
Publisher
Market Minds Advisory
Report Code
MMA-2026-TEC-891
Published
September 2026
Contact
sales@marketmindsadvisory.com | www.marketmindsadvisory.com

Purchase the full Cloud Communication Platform Market Report (2026 to 2036).

The full report sizes the cloud communication platform market across six channels, seven regions, and thirty countries, with forecasts to 2036 under base, bull, and bear cases. It examines why gross revenue overstates value created when most of it passes to mobile operators, how network verification changes the margin structure of this business, and what artificially inflated traffic costs the industry each year. Competitive analysis covers twenty participants evaluated consistently on platform revenue, with detailed treatment of carrier coverage and termination negotiation. Cost structure, margin architecture, and regional pricing patterns are analysed throughout. Primary research includes 3,800 survey responses and 47 expert interviews.
Six communication channels sized and forecast separately
Twenty participants evaluated on gross platform revenue
Regional pricing and volume patterns across seven distinct geographies
Margin architecture by channel and termination exposure
Termination cost share analysed across channels and regional operator markets
Network verification coverage measured against enterprise authentication demand

Built For The People Who Decide

From boardroom strategy to bench-side execution, this report is read cover-to-cover by leaders shaping the next decade of their industry, turning demand scenarios, market dynamics and valuation benchmarks into decisions.
CXOs/ Presidents/ VPs/ Managers
M&A and Corporate Development
Strategy Teams and R&D Heads
Procurement and Product Directors
Regulatory and Compliance Leaders
Investor Relations and Equity Analysts