

Market Minds Advisory
Clean Steam Separator Market

Clean Steam Separator Market: A Small Component Holding Up A Whole Batch Record

Wet steam does not sterilise. A separator costing a few thousand dollars decides whether a load is sterile, and most installations have never had their steam quality measured after commissioning.

Lead Analyst

David Horsley

Published

September 2026

Make Smarter Decisions with Customized Research Insights

Request a free sample report and evaluate market opportunities, growth trends, and competitive dynamics relevant to your business needs.

2025 MARKET VALUE$0.3BMarket Size 2025
2036 FORECAST VALUE$0.6BBase Case , 2026 to 2036
CAGR 2026 TO 20366.4 %Bull 7.6% / Bear 5.2%
INCREMENTAL OPPORTUNITY$0.3BNet 10- year value creation
EXPANSION MULTIPLE1.86x2036 value over 2026 base
Strategic Levers
M&A Pipeline
Regional Outlook
Country Rankings
Competitive Intelligence
Segmental Deep-dive
Call-Us : 91 93563 13602

Executive Snapshot and Market Trajectory

Wet steam does not sterilise. Condensate carried into an autoclave or a sterilise-in-place cycle produces a load that looks fully processed and is not, and the component preventing that costs only a few thousand dollars. The market reaches USD 0.31 billion in 2025 and grows steadily at 6.4%.
Integrated separator-filter assemblies grow fastest at 9.6%, exactly 1.50 times the market rate, because buyers increasingly want one qualified assembly with one documentation package rather than components they must validate themselves. South Asia and Pacific holds 24% of value, well above the band this framework applies, because Indian pharmaceutical capacity build now exceeds any other region by a wide margin. East Asia follows at 20% of value.
Concentration reaches 52% across the top five, high for a component this mechanically simple, and it rests entirely on documentation rather than on any engineering advantage the leaders hold. Competition turns on the qualification package offered, on material traceability, and on surface finish certification. Roughly 19% of installations ever have their steam quality verified in the field after commissioning, which is a considerably larger problem than anybody in this industry admits.
Market Definition
The clean steam separator market covers devices removing entrained condensate and non-condensable gases from clean and pure steam supplied to sterilisation, sterilise-in-place, and direct product contact applications, spanning cyclonic, baffle, coalescing, integrated separator-filter, and point-of-use compact configurations. Clean steam generators, plant steam separators and traps, sterilisers and autoclaves, filtration cartridges sold independently, water for injection systems, and steam quality test instrumentation are excluded.
Base Year Value
$0.3B in 2025 (MMA Primary Research Dataset, August 2026)
Forecast Period
2026 to 2036, eleven discrete annual values
CAGR
6.4% base case. Bull 7.6%. Bear 5.2%.
Fastest Growth Segment
Integrated Separator-Filter Assemblies: 9.6% CAGR
Fastest Growth Country
India: 9.8% CAGR
Fastest Growth Region
South Asia and Pacific: 8.4% CAGR
Largest Region
South Asia and Pacific: 24% of 2025 global value
Market Leaders
Spirax Sarco, Armstrong International, TLV, Valsteam ADCA, Forbes Marshall. Source: MMA Primary Research Dataset, July 2026.
Primary Survey
n=3,800 procurement and R&D decision-makers, Q4 2025, six countries
Methodology
Demand-side build-up, cross-validated against public data, 47 expert interviews

Clean Steam Separator Market Forecast Scenarios

clean-steam-separator-market-size-forecast-scenario-1787333700299
Between 2020 and 2025 demand followed pharmaceutical capital spending, which was unusually eventful. Vaccine and biologics capacity expanded rapidly through 2021 and 2022 on pandemic funding, then corrected sharply as that programme money ran out. Indian and Chinese capacity build continued regardless of the Western cycle. A 5.3% historical CAGR averages a surge and a correction that neither the components nor their suppliers had much influence over.
Three mechanisms carry the 6.4% base case. Biologics and sterile injectable capacity is the largest, since those facilities carry far more sterilise-in-place points per square metre than oral solid dose plants ever did. Regulatory attention to steam quality is the second, with inspectors increasingly asking for measurement data rather than accepting a design specification. And Indian and Chinese capacity build adds new installations at a rate the mature markets cannot match.
The 7.6% bull case rests on steam quality testing becoming a routine inspection expectation rather than an occasional one, which would expose a large installed base of unverified systems. The 5.2% bear case is pharmaceutical capital discipline after the biologics build-out, since a component this far down the bill of materials moves entirely with facility construction it cannot influence.

The Component Nobody Specifies Carefully Enough

Steam sterilisation works because condensing steam transfers a very large amount of energy to whatever it touches. Carry liquid water into that steam and the transfer changes, the load surface wets rather than heats, and the cycle produces something that passed a timer but not a sterility argument. The standards recognise this and set a dryness fraction requirement, commonly 0.95, at the point of use.
TOP FIVE CONCENTRATION52%Documentation capability rather than engineering keeps the field narrow
DRYNESS FRACTION REQUIREMENT0.95Minimum steam quality demanded at the point of sterilisation
AVERAGE UNIT PRICEUSD 2,800Typical sanitary separator including certification and traceability documentation
QUALIFICATION DOCUMENT SHARE34%Portion of delivered value carried by validation and traceability packages
INSTALLED SERVICE LIFE15 yearsOperating years before element replacement or unit renewal becomes necessary
FIELD VERIFICATION RATE19%Installations where steam quality gets measured after commissioning is complete
Meeting it is a plumbing problem far more than an engineering one. Clean steam generated dry picks up condensate along every metre of pipe, at every dead leg, and through every pressure reduction, so the separator has to sit close to the point of use rather than back at the generator. Plenty of installations put it in the wrong place and nobody notices for years.
That is the uncomfortable part of it. Roughly 19% of installations have steam quality actually measured in the field after commissioning, and the rest rely entirely on a design calculation and a certificate. Inspectors have begun asking for measurement, which is steadily exposing systems that have been running for years on an assumption nobody ever tested.
"You can buy a perfectly good separator and install it thirty metres from the steriliser, and the certificate will still say the steam was dry when it left the device. What matters is the dryness at the load, and hardly anybody measures that."
Principal, Pharmaceutical Utilities Practice · MMA Healthcare Practice &mi

Market Trends

Inspectors Ask For Measured Steam Quality Data

Regulatory attention has shifted from reviewing steam system design documents toward asking for actual measurement at the point of use, covering dryness fraction, non-condensable gas content, and superheat. Facilities that cannot produce that data are being asked to generate it, which frequently reveals separators sized correctly and located badly. The result is a retrofit and relocation market that did not previously exist, alongside growing demand for permanent monitoring points. Roughly 19% of installations currently have field verification data, and every inspection cycle pushes that number upward. Nobody wants to discover this during an inspection.
Market Impact: Injectable plants carry 40 sterilis
Buyers Want One Qualified Assembly, Not Components

Pharmaceutical engineering teams are consolidating separator, filter, trap, and sample point into a single skid-mounted assembly delivered with one qualification package. That shifts validation effort from the client to the supplier and removes the interface risk that arises when three vendors each certify their own piece. Assemblies price well above the sum of the components because the documentation is the expensive part. It also locks the supplier in, since requalifying a replacement assembly costs more than the hardware ever did. Engineering teams have stopped wanting to assemble these themselves at all.
Market Impact: India holds 3,000 approved plants

Market Opportunities and Growth Drivers

Sterile Injectable Capacity Multiplies Steam Contact Points

Biologics, vaccines, and sterile injectable facilities carry far more sterilise-in-place points per square metre than oral solid dose plants, because every product contact surface in an aseptic line has to be sterilised in place between batches. Each of those points needs assured steam quality at its own location rather than at a central header. Global sterile injectable capacity has expanded substantially since 2020 and continues under contract manufacturing investment. That translates directly into separator count per facility rather than into larger units. Unit count rather than unit size is what grows here.
Market Impact: Value engineering removes 20%

Indian And Chinese Capacity Build Adds New Installations

India operates the largest number of regulator-approved pharmaceutical plants outside the United States, and production linked incentive funding is adding formulation, injectable, and active ingredient capacity at a pace no mature market approaches. Chinese biologics and contract manufacturing investment runs on a similar trajectory. New facilities specify clean steam systems from the outset and increasingly to Western regulatory standards, since export approval depends on it. This is greenfield installation demand rather than the replacement business that dominates Europe and North America. Mature markets have nothing comparable under construction. Very little of it is replacement work.
Market Impact: Regional units price 60% lower

Market Restraints and Challenges

Nobody Owns Steam Quality Inside The Plant

Clean steam sits between the utilities engineer who generates it and the production team who uses it, and responsibility for quality at the point of use frequently belongs to neither in any documented way. The root cause is organisational rather than technical: the standards specify a requirement at the load, while the equipment is purchased and maintained by whoever owns the header. Commercially this means separators get value-engineered out of projects and rarely get monitored afterwards. Suppliers are mitigating by selling to quality assurance functions directly and by bundling measurement into the delivered scope.
Market Impact: Only 19% have verification data

Component Price Invites Substitution By Cheaper Equivalents

A separator is a simple pressure vessel with an internal element, and regional fabricators offer visually equivalent units at a fraction of branded pricing. The root cause is that the value sits in material traceability, surface finish certification, and qualification documentation, none of which is visible on a purchase requisition line. Commercially this erodes pricing wherever procurement rather than engineering makes the decision. Mitigation runs toward supplying documentation as a distinct deliverable, publishing measured performance data, and offering the qualification support that a low-cost fabricator cannot produce. Purchase requisitions do not show any of it.
Market Impact: Assemblies price 40% above componen
2 additional market trends, 4 additional growth drivers, and 3 additional restraints and challenges are covered in the full report. Contact sales@marketmindsadvisory.com to access the complete intelligence.

Segment CAGR and Growth Architecture

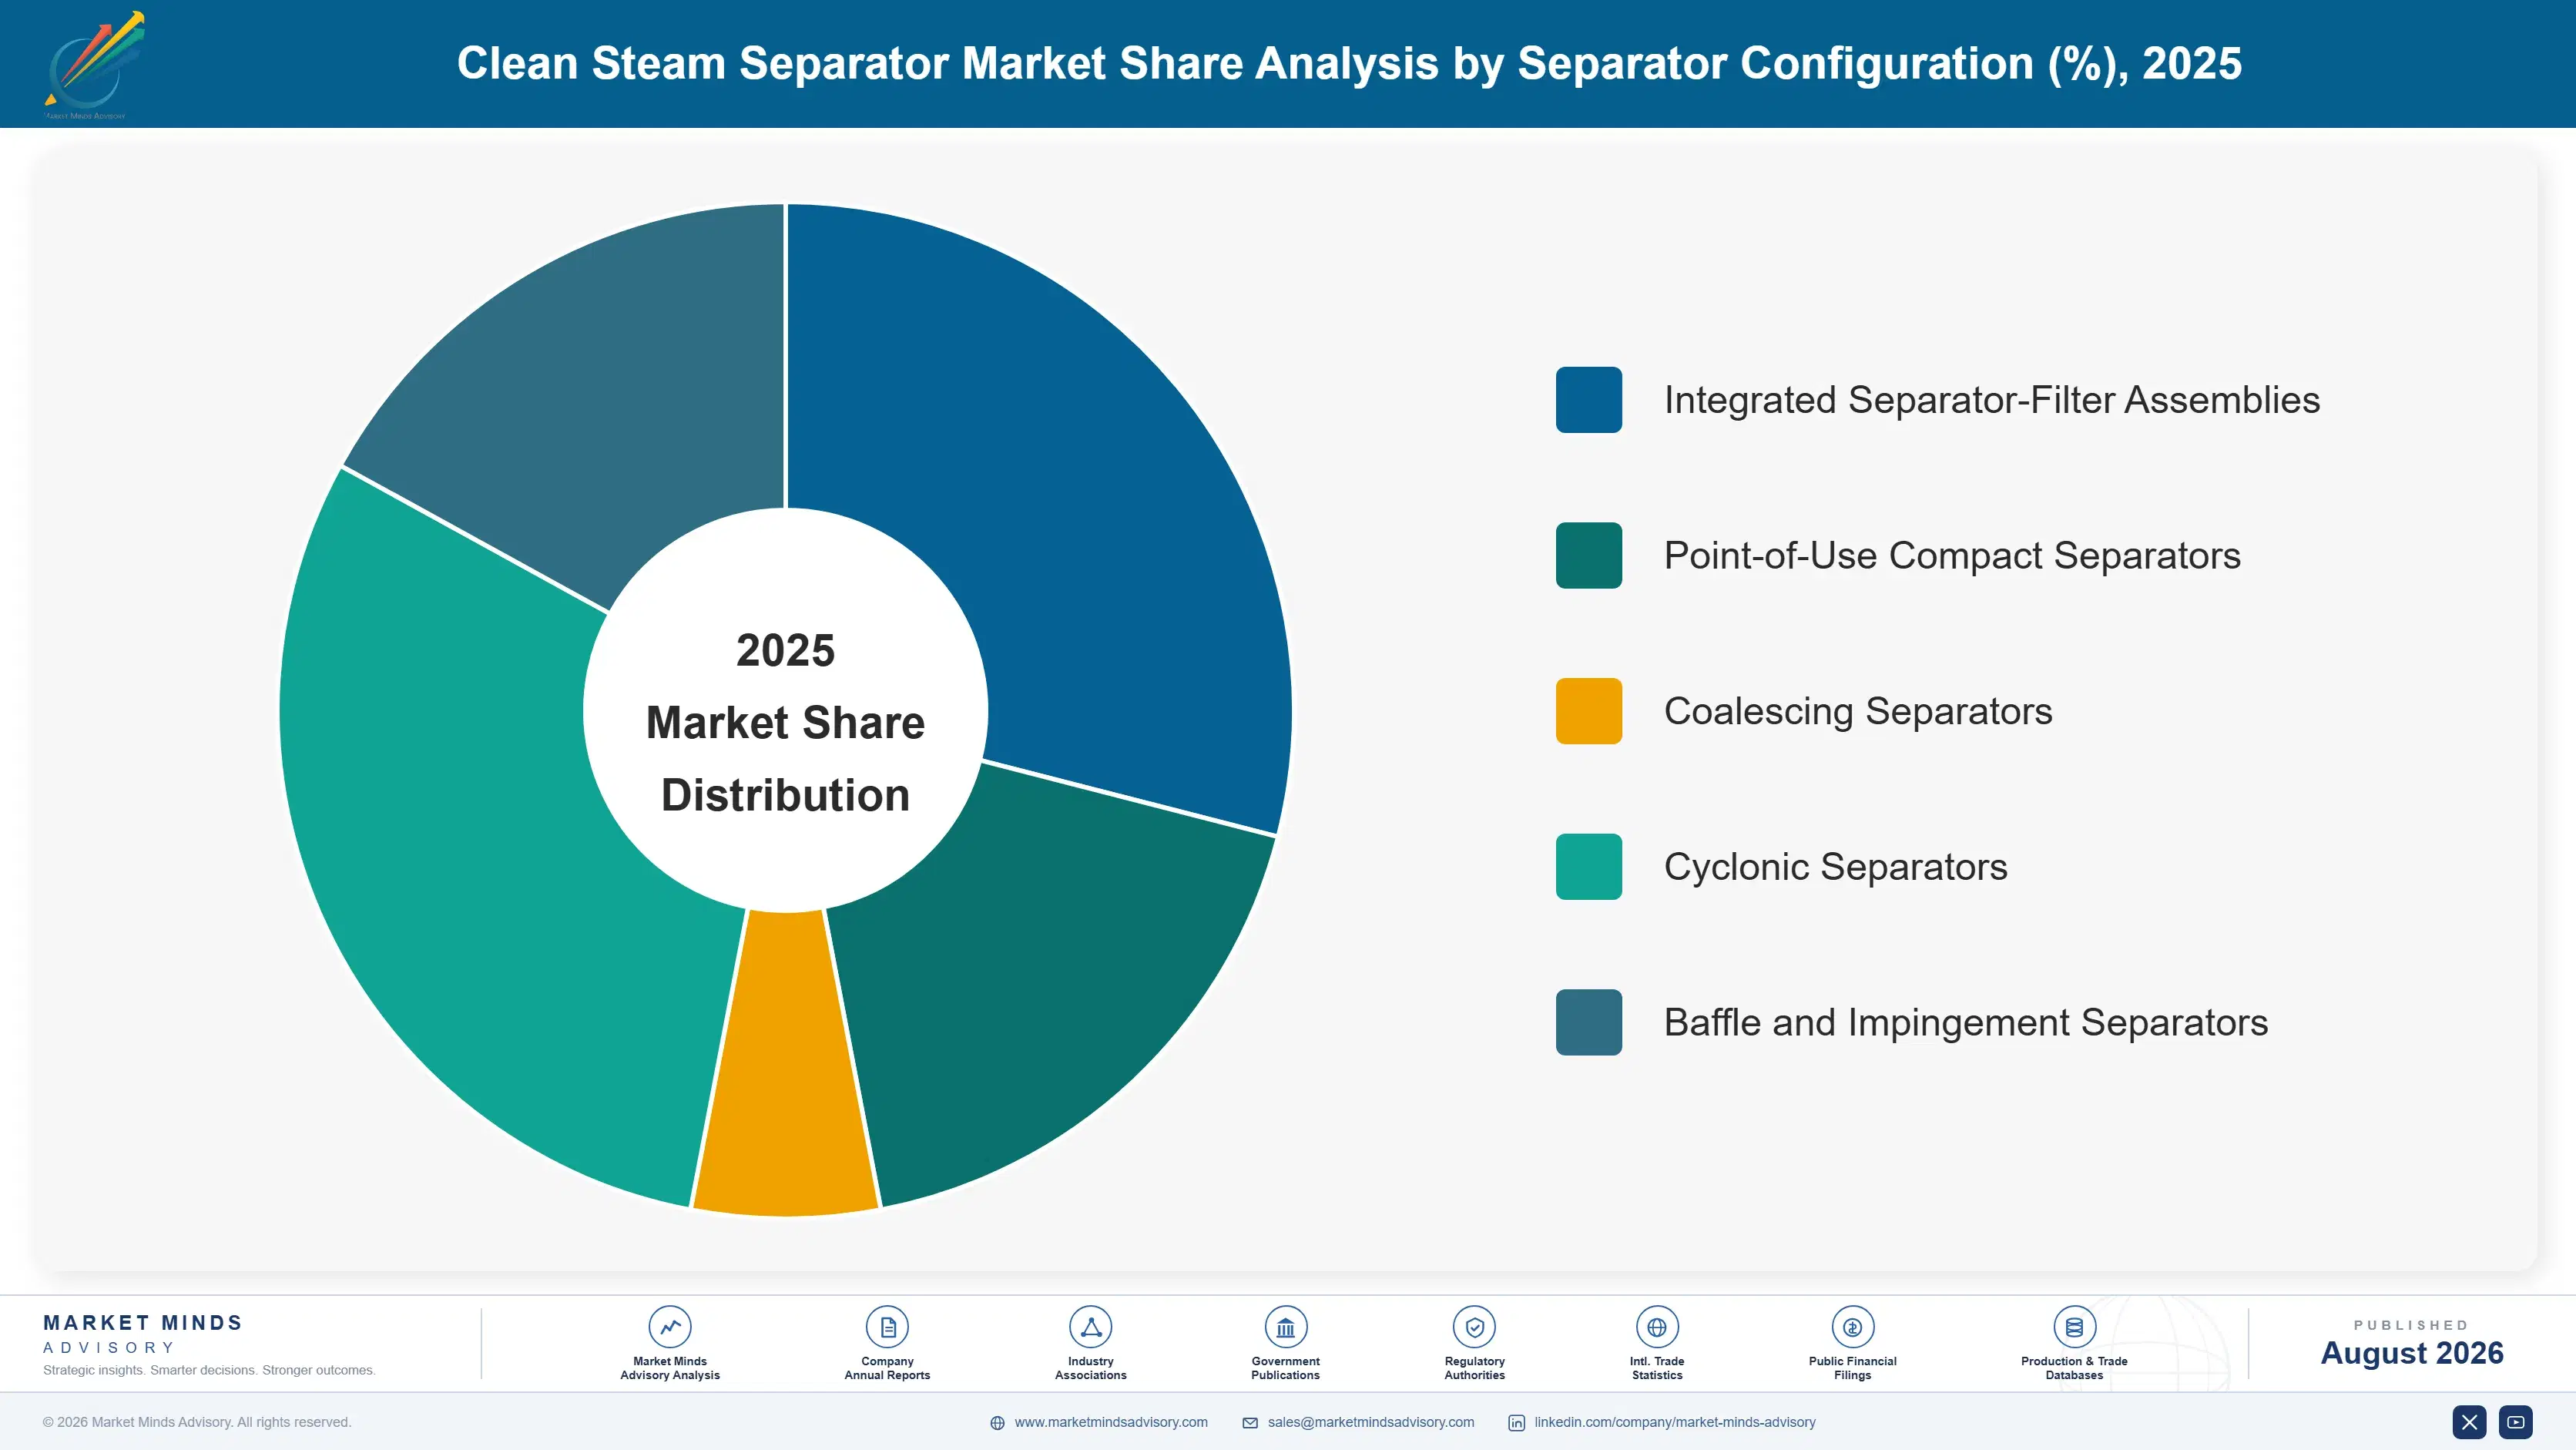
Segmentation follows separator configuration, because how the device removes entrained condensate determines its pressure drop, its physical footprint, how close to the point of use it can actually sit, and what documentation the supplier has to produce. Material grade, connection type, and end-use are handled in the framework and commentary rather than as segments.
clean-steam-separator-market-market-share-analysis-1787333700834

Integrated Separator-Filter Assemblies

Integrated assemblies grow fastest at 9.6%, exactly 1.50 times the market rate, and documentation rather than hardware explains the premium they command. Combining separator, sterilising filter, steam trap, and sample point into one skid delivered with a single qualification package moves validation effort from the client to the supplier and removes the interface risk of three vendors certifying separate pieces. Pharmaceutical engineering teams increasingly refuse to assemble these themselves. Pricing runs roughly 40% above the component sum, and the position is sticky because requalifying a replacement assembly costs considerably more than the hardware itself ever did. Few clients will reopen a qualification file without a genuine performance reason to do it.
CAGR 9.6%

Point-of-Use Compact Separators

Point-of-use compact separators grow at 8.1%, driven by the recognition that steam dry at the generator is rarely dry at the load. Condensate forms along every metre of distribution pipe, at every dead leg, and through every pressure reduction, so a separator sitting near the header solves a problem the standard does not actually ask about. Compact units mounted within a metre or two of the steriliser or vessel connection address the requirement where it is written. Retrofit demand is substantial, since a great many existing installations put the separator in exactly the wrong place. Measurement at the load is what exposes those installations, and it is becoming routine. Nothing about the hardware changes.
CAGR 8.1%
Full segment breakdown across 7 segments available in the complete report.

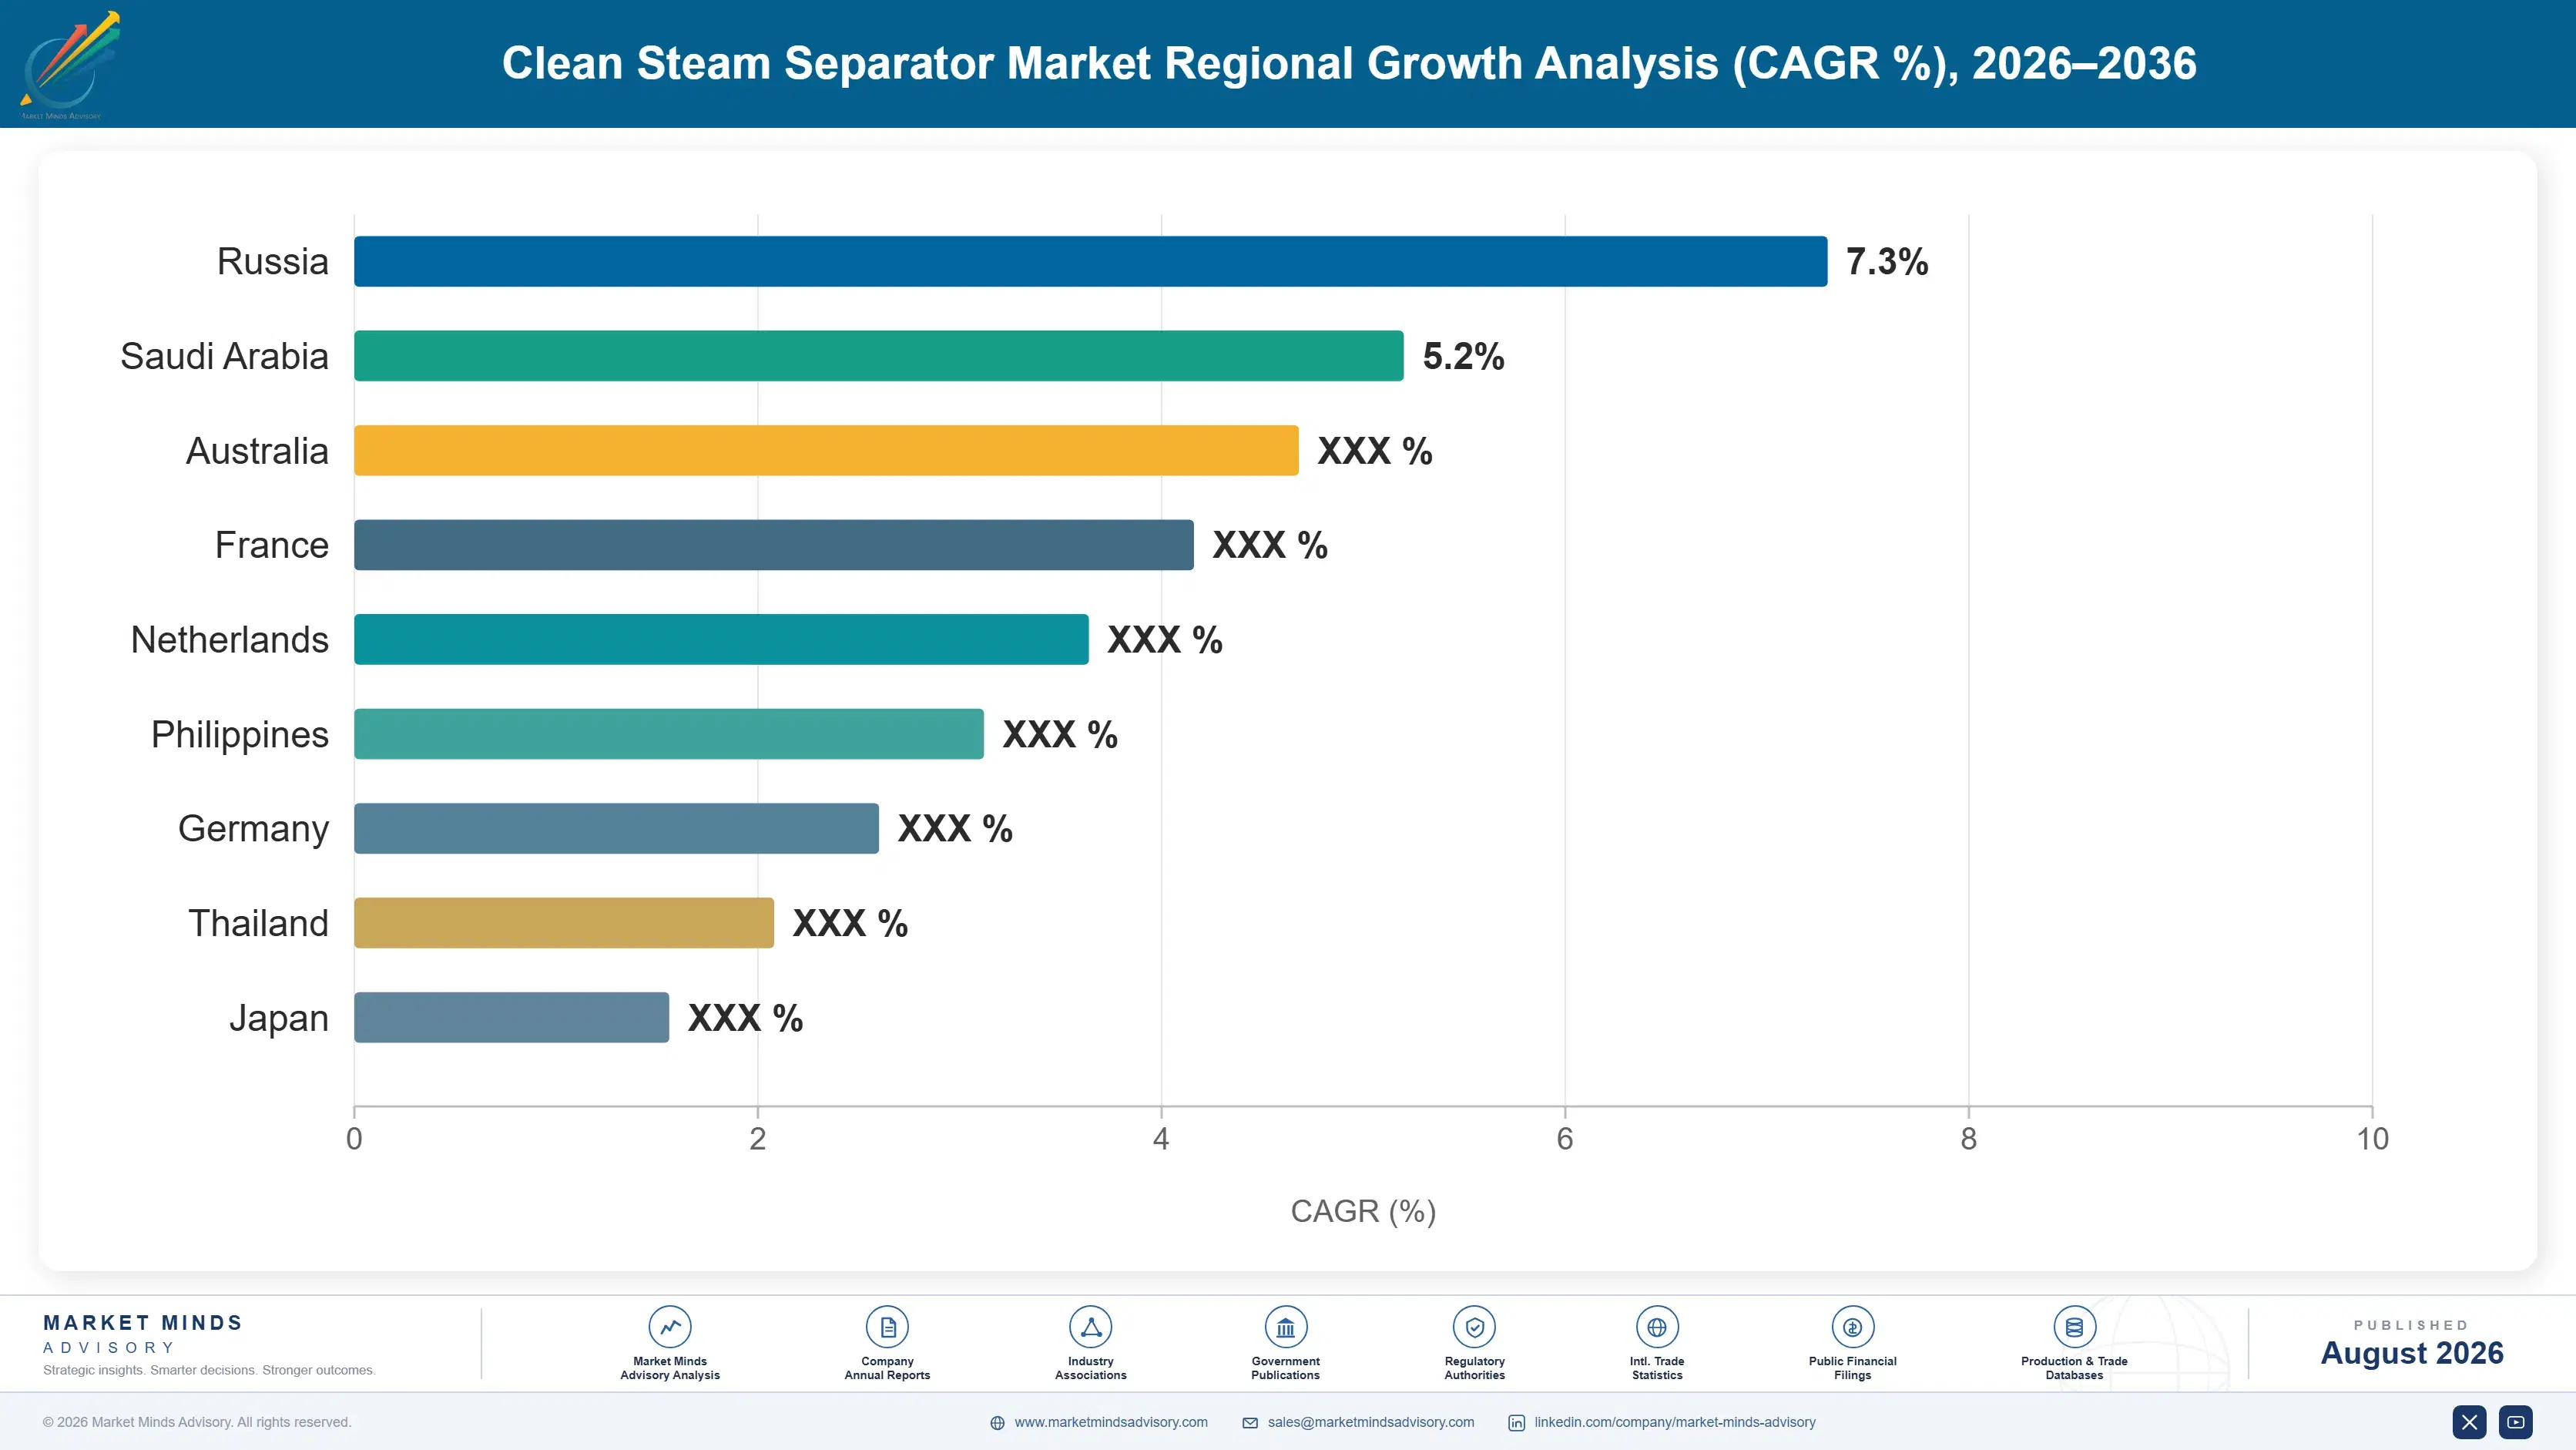
Regional Architecture and Country Demand Map

Regional shares here follow pharmaceutical manufacturing capacity rather than drug consumption anywhere, because a separator only ever gets bought when a plant is built, extended, or requalified. New capacity and a mature installed base pull in opposite directions across the seven regions in this table.

South Asia and Pacific

South Asia and Pacific takes 24% of value against a 12% ceiling in this framework, and Indian pharmaceutical manufacturing scale explains the whole breach. India operates the largest number of regulator-approved plants outside the United States and is adding formulation, injectable, and active ingredient capacity under production linked incentive funding faster than any mature market. Those new facilities specify clean steam systems to Western regulatory standards because export approval depends on it. Australian and Southeast Asian capacity is smaller and mostly contract manufacturing. Growth at 8.4% is the highest of any region, and almost all of it is greenfield installation rather than replacement. Documentation expectations rise with every export approval sought.
Share: 24% | CAGR: 8.4% (2026 to 2036)

East Asia

East Asia records 20% of value against a 22% floor, narrowly outside the band, and the shortfall reflects how much Chinese capacity is served by domestic fabricators rather than by the international suppliers this market measures. Chinese biologics and contract manufacturing investment is substantial and rising, with export-oriented facilities specifying to international standards while domestic-market plants frequently do not. Japanese and Korean plants are mature, highly documented, and buy premium equipment on a replacement cycle. Growth at 7.2% exceeds the global rate on Chinese capacity additions and on the steady upgrading of export-facing facilities toward Western documentation expectations. The split between export-facing and domestic plants runs through everything here. Domestic fabricators serve much of it.
Share: 20% | CAGR: 7.2% (2026 to 2036)
Regional intelligence for 5 additional markets available in the complete report: Western Europe, North America, Latin America, Middle East and Africa, Eastern Europe. Contact sales@marketmindsadvisory.com.
clean-steam-separator-market-country-cagr-analysis-1787333701407

Where Separator Margin Actually Comes From

Nobody makes money selling a stainless pressure vessel with a baffle inside it, and regional fabricators will always undercut on exactly that basis alone. The margin sits in the documentation nobody else can produce, in the measurement that proves the installation works, and in bundling the whole steam quality point into one qualified deliverable.

Sell The Qualification Package As A Deliverable

Material traceability, surface finish certification, weld records, and installation qualification documentation already carry around 34% of delivered value, yet most suppliers bundle them invisibly into a hardware price that procurement then compares against an uncertified fabricator. Pricing documentation as a separate line makes the comparison honest and defends 25% to 40% of contract value that would otherwise be competed away. It also positions the supplier with quality assurance rather than purchasing, which is where the decision genuinely belongs in a regulated facility. Very few suppliers currently present it that way.
Market Impact: Documentation defends 25 to 40 perc

Bundle Measurement Into Every Single Installation

Only about 19% of installations ever have steam quality verified in the field, and inspectors are increasingly asking for exactly that data. Supplying commissioning measurement of dryness fraction, superheat, and non-condensable gas as standard adds USD 1,500 to USD 4,000 per point and converts a component sale into a compliance service. It also uncovers the badly located separators that generate retrofit work. Suppliers doing this reach the quality function directly and become the party the client calls before an inspection rather than after one. That timing difference is worth more than the fee.
Market Impact: Measurement adds 1,500 to 4,000 dol

Deliver Complete Qualified Steam Quality Assemblies

Combining separator, sterilising filter, trap, and sample point into one skid with a single qualification package removes the interface risk of three vendors certifying separate items, which pharmaceutical engineering teams increasingly refuse to manage themselves. Assemblies price roughly 40% above the sum of the components because validation effort transfers to the supplier. The position is also durable, since requalifying a replacement assembly costs far more than the hardware, and few clients will do it without a genuine performance reason. It also removes three separate supplier relationships from the client's project schedule.
Market Impact: Assemblies price 40 percent above t

Who Controls the Margin Pool

Concentration reaches 52% across the top five measured on clean steam separator revenue, which is high for a component this mechanically simple and reflects documentation capability rather than manufacturing difficulty. Spirax Sarco leads on installed base and global service reach, with Armstrong International holding a strong position in North American pharmaceutical accounts. TLV, Valsteam ADCA, and Forbes Marshall follow. The gap to regional fabricators is certification and validation support
Competition currently turns on whether a supplier can produce the qualification package a regulated facility needs, on surface finish and traceability certification, and on having application engineers who understand where the separator actually belongs. Price matters wherever procurement makes the call and hardly at all where quality assurance does. That split runs straight through the middle of this market.

Pressure comes from two directions at once. Regional fabricators in India and China are improving documentation fast enough to reach export-facing plants, while filtration and sanitary equipment groups are bundling separators into wider assemblies and taking the customer relationship. Rankings will shift toward whoever owns the whole steam quality point rather than the individual device sitting inside it.
clean-steam-separator-market-company-positioning-matrix-1787333702139

Competitive Moat and Risk Dimensions

SPIRAX SARCO

Moat: Application engineering and global reach

Spirax Sarco fields steam application engineers in almost every pharmaceutical manufacturing market and has done so for decades, which matters because most separator failures are installation and location problems rather than product defects. That advisory presence gets the company specified during design, long before a purchase requisition exists for a competitor to bid against.
SPIRAX SARCO

Risk: Broad portfolio dilutes focus

Clean steam separators are a small line within a very large steam systems business weighted toward industrial plant steam, which shapes how development attention and specialist headcount get allocated. Competitors concentrating entirely on sanitary and pharmaceutical applications can invest more deeply in validation support for this specific niche without needing anything like the same overall scale.
ARMSTRONG INTERNATIONAL

Moat: North American pharmaceutical account depth

Armstrong holds long-standing relationships across North American pharmaceutical and biotechnology manufacturers, built through steam systems work that extends well beyond separators into trap management and utility auditing. Those relationships put the company in front of facility engineers during design, and its documentation practice matches what United States regulatory inspection expects to see.
ARMSTRONG INTERNATIONAL

Risk: Limited Asian manufacturing presence

Most new installation demand is now in India and China, and Armstrong's presence there is thinner than its North American position, which leaves the fastest-growing greenfield capacity underserved. Building local application engineering and documentation support in those markets takes years, and regional competitors are improving their own certification capability during exactly that window.

Players Tracked

Prominent Players

Spirax Sarco
Armstrong International
TLV
Valsteam ADCA
Forbes Marshall

Other Key Players

Gestra
Watson McDaniel
Mueller Steam Specialty
Pentair Sudmo
Alfa Laval
Donaldson
Sartorius Stedim Biotech
BWT Pharma and Biotech
Stilmas
Bram-Cor
MECO
Veolia Water Technologies
Steriflow Valve
ARI-Armaturen
Nicholson Steam Trap

Recent Developments

MARCH 2025

Supplier launched skid-mounted steam quality assembly for injectables

A steam systems supplier launched a skid-mounted assembly combining separator, sterilising filter, steam trap, and sample point, delivered together with a single qualification package. The product targets sterile injectable facilities where engineering teams no longer want to validate interfaces between three separately certified components themselves.
Signal: Suppliers are absorbing validation effort
SEPTEMBER 2024

Regulator queried unverified steam quality at inspected facility

A pharmaceutical manufacturer was asked during inspection to produce measured steam quality data at the point of use rather than the system design documentation it had prepared. The facility could not, and subsequent measurement identified separators correctly sized but installed too far from the sterilisation points.
Signal: Measurement expectations are exposing inst
DECEMBER 2024

Indian manufacturer achieved international certification for sanitary separators

An Indian sanitary equipment manufacturer secured material traceability and surface finish certification meeting international pharmaceutical expectations, opening up export-facing domestic plants that had previously specified only imported units. Domestic capacity build gives that supplier a very substantial home market in which to establish its references.
Signal: Documentation capability is the barrier th

Stainless Steel, Finishing, And Certification

Austenitic stainless steel, principally 316L bar and tube with controlled sulphur content for weldability, carries roughly 34% to 42% of cost of goods and comes from a narrow group of European, Japanese, and Indian mills able to supply certified material. Electropolishing and mechanical finishing add 14% to 20%. Welding, inspection, and documentation account for most of the balance, and certification labour alone is a substantial line.
Nickel prices moved violently in March 2022 when the London Metal Exchange suspended and then cancelled trades, reaching around USD 100,000 per tonne intraday, and 316L surcharges followed with a short lag behind. Alleima and Outokumpu both recorded significant alloy surcharge effects across that period. Sanitary equipment makers holding annual price lists absorbed most of the increase, because a validated component cannot be repriced mid-project.

Exposure divides by whether a supplier holds certified material stock. Those buying 316L to order at spot pricing carry the full movement between quote and delivery. Suppliers with stock qualified to specific heat numbers can quote against inventory and smooth it out. Small fabricators sit worst, since they buy in quantities too small for forward contracts and cannot afford to hold certified inventory across the grade range clients specify.
clean-steam-separator-market-cost-volatility-analysis-1787333702337

Hold certified stock across the specified grade range

Pharmaceutical clients specify material by heat number and traceability, so buying to order exposes the supplier to spot pricing on every project. Holding qualified inventory across the common grades allows quoting against known cost and smooths alloy movement across quarters. Working capital is the constraint, and it is one that larger suppliers can carry while small fabricators genuinely cannot.

Apply alloy surcharge clauses in framework pricing

Annual price lists agreed with pharmaceutical clients leave suppliers absorbing nickel movement entirely, which the 2022 episode showed to be unsustainable. Surcharge clauses tied to published stainless benchmarks are standard practice throughout the wider stainless supply chain and translate directly here, provided they are agreed before qualification rather than introduced afterwards. Retrofitting them later is considerably harder.

Grow documentation and service revenue share

Qualification packages, commissioning measurement, and validation support carry no steel content and considerably better margins than the hardware they accompany. Raising that share lowers overall metal exposure without changing anything about manufacturing. It also shifts the customer conversation toward capability that regional fabricators cannot easily match, which protects pricing on the hardware itself. It is the most durable defence available.

Portfolio Architecture for Margin Defence

Margin here tracks certification burden rather than product complexity. A separator sold into a food or general sanitary application competes on price against regional fabricators making a visually identical vessel, and pricing shows it. The same device sold into a regulated pharmaceutical facility carries traceability, surface finish certification, and a qualification package, and it prices against the cost of a compliance failure instead.
The volume tension runs between the two customer types. Food, beverage, and general sanitary work is higher volume and funds factory utilisation, and giving it up means running welding capacity below what it can absorb. Pharmaceutical work is lower volume, considerably slower to win, and far more profitable, but it demands documentation infrastructure and application engineering that most fabricators never get around to building.

High-value pools sit in three places. Integrated assemblies delivered with one qualification package, commissioning measurement and verification services, and retrofit work on installations where separators sit in the wrong place. All three are protected by validation cost rather than by any technical barrier, which is a considerably more durable defence because switching costs the client time as well as money.

Volume / Commodity-Adjacent Tier

Standard sanitary separators for food, beverage, and general hygienic applications sold on specification and price. Regional fabricators compete directly here, and the range reflects how differently certified and uncertified cost bases carry the same vessel.
Gross Margin: 18-26%

Premium / Certified Tier

Pharmaceutical grade separators supplied with material traceability, surface finish certification, and installation qualification documentation. Certification capability rather than manufacturing difficulty supports the margin, since procurement cannot substitute an uncertified equivalent.
Gross Margin: 32-42%

Sustainability / Regulatory / Next-Generation Tier

Integrated qualified assemblies, commissioning measurement services, and permanent steam quality monitoring points. The wide range reflects genuinely different economics between skid hardware, one-off verification work, and recurring monitoring arrangements sold across a facility network.
Gross Margin: 38-52%
clean-steam-separator-market-portfolio-architecture-1787333702837

High-value Sub-segments and Strategic Watch-out

Integrated Qualified Assemblies

Growing at 9.6% and the strongest margin position available in this market, because validation effort transfers from the client to the supplier and the client will pay handsomely to be rid of it. Requalifying a replacement assembly costs far more than the hardware ever did.
Gross Margin: 40-52%

Steam Quality Measurement Services

Growing quickly as inspectors ask for measured data rather than design documentation from the facilities that they visit. It carries almost no material cost at all, reaches the quality assurance function directly, and reliably uncovers the badly located separators that go on to generate retrofit work afterwards.
Gross Margin: 44-58%

Standard Sanitary Separators

The volume base of the market and the part regional fabricators contest most effectively on price. It funds factory utilisation and welding capacity, and it remains the entry point into accounts that later need fully documented pharmaceutical specification work. Nobody wins pharmaceutical scope without first winning this.
Gross Margin: 18-26%

Retrofit And Relocation Work

Growing on measurement exposing separators correctly sized but installed too far from the load to matter. The watch-out is that the opportunity depends entirely on inspection practice tightening, which has moved slowly and unevenly between regulators. Progress has been slow and uneven so far. Regulators move at their own pace.
Gross Margin: 34-46%

What Follows The First Installation

A separator generates less recurring revenue than most process components, and suppliers who understand that build the position differently. The vessel lasts fifteen years and the internal element rarely needs attention, so there is no meaningful parts annuity. What does recur is validation: every requalification cycle, facility change, and inspection round creates documentation and measurement work on equipment already installed and already paid for.
Stickiness varies enormously by customer type. Regulated pharmaceutical facilities are locked in almost completely, because changing a validated component means reopening a qualification file that nobody wants to touch without a genuine performance reason. Food and beverage users switch freely on price. Contract manufacturers sit between the two, standardising across sites for validation efficiency but retendering when a client contract changes the economics.

Buyer profiles have moved toward quality assurance and away from procurement. The decision used to sit with a utilities engineer comparing pressure drop and price, which is a comparison certified suppliers frequently lose. It increasingly sits with whoever signs the validation file, and that person is buying documentation and measurement rather than a stainless vessel with a baffle inside it.
clean-steam-separator-market-end-use-penetration-index-1787333703336

Where To Compete Here

These are among the four positions where our research anticipates prominent divergence between winners and laggards over the coming forecast period. Each is grounded in the demand model, the regulatory perimeter, and the announced capacity pipeline.
01 / DOCUMENTATION AS PRODUCT

Price the paperwork separately and defend it

Traceability, surface finish certification, and qualification documentation already carry around 34% of delivered value, yet most suppliers bundle all of it invisibly into a hardware price that procurement then compares directly against an uncertified fabricator's quote. Pricing it as a distinct and separate deliverable makes that comparison honest and defends a quarter to two-fifths of contract value which would otherwise be competed away entirely. It also puts the conversation in front of quality assurance rather than in front of purchasing.
02 / MEASUREMENT SERVICE BUILDING

Verify what you install, every time

Only about a fifth of installations ever have their steam quality measured out in the field, and inspectors have now started asking for precisely that data during their facility visits. Bundling commissioning measurement into every single installation adds a few thousand dollars per point and converts a simple component sale into a compliance service that the client genuinely needs. It also reliably uncovers the badly located separators, which are the single largest source of retrofit work available in this market.
03 / ASSEMBLY SCOPE CAPTURE

Own the whole steam quality point

Pharmaceutical engineering teams no longer want to validate the interfaces between separately certified separators, filters, and traps supplied by three different vendors on the same capital project. Delivering one skid with a single qualification package prices roughly two-fifths above the component sum and moves the validation burden onto whoever is able to carry it most cheaply. Suppliers who are still selling individual devices are competing for the least defensible part of a scope that somebody else is now busy consolidating.
04 / ASIAN CAPACITY POSITIONING

Follow the plants being built, not consumed

Almost all greenfield installation demand now sits in India and China, while Europe and North America run largely on replacement and requalification work proceeding at a considerably slower pace. Regional fabricators in those markets are closing the documentation gap that has protected international suppliers for years, and they have a very large home market in which to build up their references. Suppliers without local application engineering in those markets are ceding all of the growth while defending a mature installed base.

Engagement Snapshot From the Field

A live engagement with an industry participant carrying material or product regulatory and market exposure ahead of a defining policy shift, showing how our research translates into a defensible multi-year portfolio strategy.
MARKET MINDS ADVISORY · CLIENT ENGAGEMENT SUMMARY
Clean Steam Separator Producer Strategic Portfolio Review and Transition Roadmap 2026·Investment Scenario on Clean Steam Separator Exposure Evaluation 2025-26
CLIENT PROFILE
A contract manufacturing organisation operating sterile injectable and biologics facilities across four sites in two regions, with annual revenue near USD 780 million (client-reported, unverified by MMA). Clean steam systems had been installed progressively over fifteen years by different contractors, and no consistent engineering standard governed where separators were placed relative to the sterilisation points they served.
STRATEGIC CHALLENGE
A regulatory inspection at one site had asked for measured steam quality data at the point of use, which the client could not produce. Management needed to know whether the finding was site-specific or systemic across the network, and what remediation would cost, before a client audit scheduled four months later reached the same question.
MMA APPROACH
MMA arranged steam quality measurement at a representative sample of sterilisation points across all four sites, covering dryness fraction, superheat, and non-condensable gas content. Results were mapped against separator location, pipe run length, and pressure reduction points. Remediation options were then costed against the validation effort each would require given the existing qualification files.
KEY FINDINGS
  1. Dryness fraction failed the required threshold at 31% of the sampled sterilisation points (client-reported, unverified by MMA), despite compliant readings at every distribution header tested.
  2. Every failing point sat more than fifteen metres of pipe run from its nearest separator, and pipe length predicted failure more reliably than any equipment specification did.
  3. Relocating existing separators closer to the load resolved most of the failures without new hardware, though each relocation still triggered installation qualification work.
  4. Two of the four sites had no permanent sample points at all, making routine verification impossible without disruptive temporary installation on every single occasion.
CLIENT PROFILE
A contract manufacturing organisation operating sterile injectable and biologics facilities across four sites in two regions, with annual revenue near USD 780 million (client-reported, unverified by MMA). Clean steam systems had been installed progressively over fifteen years by different contractors, and no consistent engineering standard governed where separators were placed relative to the sterilisation points they served.
STRATEGIC CHALLENGE
A regulatory inspection at one site had asked for measured steam quality data at the point of use, which the client could not produce. Management needed to know whether the finding was site-specific or systemic across the network, and what remediation would cost, before a client audit scheduled four months later reached the same question.
MMA APPROACH
MMA arranged steam quality measurement at a representative sample of sterilisation points across all four sites, covering dryness fraction, superheat, and non-condensable gas content. Results were mapped against separator location, pipe run length, and pressure reduction points. Remediation options were then costed against the validation effort each would require given the existing qualification files.
KEY FINDINGS
  1. Dryness fraction failed the required threshold at 31% of the sampled sterilisation points (client-reported, unverified by MMA), despite compliant readings at every distribution header tested.
  2. Every failing point sat more than fifteen metres of pipe run from its nearest separator, and pipe length predicted failure more reliably than any equipment specification did.
  3. Relocating existing separators closer to the load resolved most of the failures without new hardware, though each relocation still triggered installation qualification work.
  4. Two of the four sites had no permanent sample points at all, making routine verification impossible without disruptive temporary installation on every single occasion.
RECOMMENDED STRATEGY
Phase 1: Phase one: relocate separators at the failing points and install permanent sample connections, prioritising the site facing the imminent client audit. Phase 2: Phase two: adopt a network engineering standard capping pipe run length between any separator and the sterilisation point it serves. Phase 3: Phase three: schedule recurring measurement into the requalification cycle so verification data exists ahead of inspection rather than after it.
OUTCOME
The client remediated the failing points ahead of the client audit and reported passing measured verification at every sampled location afterwards (client-reported, unverified by MMA). The network engineering standard was adopted across all four sites, and recurring measurement is now scheduled into each requalification cycle rather than arranged reactively.

Frequently Asked Questions

Foundational context covering the market sizes, CAGR, scope, country, region and competition that inform every finding below. This section is provided to cover basics and most often pre-purchase conversations, answered from the MMA Primary Research Dataset.

What is the current size of the Clean Steam Separator Market?

The market reached USD 0.31 billion in 2025 and is forecast at USD 0.33 billion for 2026. Demand follows pharmaceutical facility construction and requalification rather than drug consumption.

How large will the Clean Steam Separator Market be by 2036?

MMA forecasts USD 0.61 billion by 2036, an increase of USD 0.28 billion over 2026. That represents an expansion multiple of 1.86 times across the forecast period.

What is the CAGR for the Clean Steam Separator Market 2026 to 2036?

The base case CAGR is 6.4%, with a bull case at 7.6% and a bear case at 5.2%. The bull case depends on steam quality measurement becoming a routine inspection expectation.

Which segment is growing fastest?

Integrated separator-filter assemblies grow fastest at 9.6%, exactly 1.50 times the market rate. Buyers want one qualified assembly with one documentation package rather than components they must validate themselves.

Who are the major companies in the Clean Steam Separator Market?

Spirax Sarco, Armstrong International, TLV, Valsteam ADCA, and Forbes Marshall lead the market. The top five hold roughly 52% of clean steam separator revenue, sustained by documentation capability rather than by any manufacturing barrier.

Which country is growing fastest?

India grows fastest at 9.8%, driven by formulation, injectable, and active ingredient capacity built under production linked incentive funding. Those plants specify clean steam systems to Western standards because export approval depends on it.

Report Segmentation Architecture

The full report scope spans multiple orthogonal segmentation dimensions, with cross-tabulated demand data provided for each dimension pair. Coverage extends further to regional breakdowns, trend trajectories, and the competitive detail needed to support segment-level decision-making.

By Separator Configuration

  • Integrated Separator-Filter Assemblies
  • Point-of-Use Compact Separators
  • Coalescing Separators
  • Cyclonic Separators
  • Baffle and Impingement Separators

By End-Use Industry

  • Pharmaceutical and Biologics Manufacturing
  • Contract Manufacturing Organisations
  • Hospital and Healthcare Sterilisation
  • Food and Beverage Processing
  • Cosmetics and Personal Care

By Commercial Dimension

  • Direct Project Supply
  • Engineering Contractor Procurement
  • Distributor and Stockist Channel
  • Original Equipment Manufacturer Supply
  • Validation and Measurement Services

By Region

  • South Asia and Pacific
  • East Asia
  • Western Europe
  • North America
  • Latin America
  • Middle East and Africa
  • Eastern Europe

Scope, Methodology, and Coverage

Every figure in this report is reproducible from documented input assumptions. The scope below maps the historical period, the forecast horizon, the segmentation dimensions, and the countries covered, alongside the underlying primary and qualitative methodology.
Historical Period
2020 to 2025
Forecast Period
2026 to 2036
Base Year
2025 (USD billions; MMA Primary Research Dataset, August 2026)
Market Definition
The clean steam separator market comprises devices that remove entrained condensate and non-condensable gases from clean, pure, and culinary steam before it reaches sterilisation, sterilise-in-place, humidification, or direct product contact applications, valued at manufacturer selling prices to pharmaceutical manufacturers, contract manufacturing organisations, engineering contractors, equipment builders, and distributors. It spans cyclonic, baffle and impingement, coalescing, integrated separator-filter, and point-of-use compact configurations in austenitic stainless construction, together with the material traceability, surface finish certification, qualification documentation, and commissioning measurement services supplied with them. Clean and pure steam generators, plant steam separators and steam traps sold independently, sterilisers and autoclaves, filtration cartridges and housings sold separately, water for injection and purified water systems, and steam quality test instrumentation are excluded.
Quantitative Units
USD billions (current prices); volume in units shipped
Segmentation Dimensions
By Separator Configuration; By End-Use Industry; By Commercial Dimension; By Region
Regions Covered
South Asia and Pacific, East Asia, Western Europe, North America, Latin America, Middle East and Africa, Eastern Europe
Countries Covered
India, China, Japan, South Korea, Singapore, Taiwan, Australia, Indonesia, Thailand, Vietnam, Ireland, Switzerland, Germany, Italy, France, UK, Netherlands, Belgium, Denmark, Spain, Sweden, USA, Canada, Mexico, Brazil, Argentina, Colombia, Chile, Saudi Arabia, United Arab Emirates, Egypt, Jordan, South Africa, Poland, Hungary, Slovenia, Croatia, Czechia, and additional markets relevant to this sector
Key Companies Profiled
Spirax Sarco, Armstrong International, TLV, Valsteam ADCA, Forbes Marshall, Gestra, Watson McDaniel, Mueller Steam Specialty, Pentair Sudmo, Alfa Laval, Donaldson, Sartorius Stedim Biotech, BWT Pharma and Biotech, Stilmas, Bram-Cor, MECO, Veolia Water Technologies, Steriflow Valve, ARI-Armaturen, Nicholson Steam Trap
Quantitative Methodology
Primary survey, n=3,800 respondents, Q4 2025, six countries; demand-side model with trade association cross-validation
Qualitative Methodology
47 expert interviews, Q4 2025; applied to validate demand model assumptions, identify emerging dynamics, and assess competitive positioning
Report Format
PDF and XLSX data workbook (Word format preview document)
Publisher
Market Minds Advisory
Report Code
MMA-2026-HLT-603
Published
August 2026
Contact
sales@marketmindsadvisory.com | www.marketmindsadvisory.com

Purchase the full Clean Steam Separator Market Report (2026 to 2036).

The full report examines clean steam separator demand across seven regions and five configurations, with particular attention to why installation location rather than device selection determines whether steam quality actually meets the standard at the load. It quantifies the verification gap across the installed base and sizes the retrofit market that tightening inspection practice is opening. Competitive analysis covers twenty participants assessed on clean steam separator revenue, including how quickly regional fabricators are closing the documentation gap. Regional chapters map pharmaceutical capacity build against installed base and specification expectations.
Seven-region pharmaceutical capacity and installation demand analysis
Five configuration segmentation with growth rates
Twenty participant competitive assessment and certification positioning
Steam quality verification gap and retrofit market sizing
Qualification documentation value share benchmarking by region
Integrated assembly pricing against component supply comparison

Built For The People Who Decide

From boardroom strategy to bench-side execution, this report is read cover-to-cover by leaders shaping the next decade of their industry, turning demand scenarios, market dynamics and valuation benchmarks into decisions.
CXOs/ Presidents/ VPs/ Managers
M&A and Corporate Development
Strategy Teams and R&D Heads
Procurement and Product Directors
Regulatory and Compliance Leaders
Investor Relations and Equity Analysts