Market Minds Advisory
Chronic Pain Market

Chronic Pain Market: Non-Opioid Pathways Redraw Treatment Standards

The first new non-opioid analgesic mechanism approved in decades is pushing prescribers and payers toward neurostimulation and non-opioid pharmacology simultaneously, reshaping reimbursement priorities across major chronic pain treatment pathways worldwide.

Lead Analyst

Alice Ballenger

Published

September 2026

Make Smarter Decisions with Customized Research Insights

Request a free sample report and evaluate market opportunities, growth trends, and competitive dynamics relevant to your business needs.

2025 MARKET VALUE$88.5BMarket Size 2025
2036 FORECAST VALUE$214.9BBase Case , 2026 to 2036
CAGR 2026 TO 20368.4 %Bull 9.6% / Bear 7.2%
INCREMENTAL OPPORTUNITY$119.0BNet 10- year value creation
EXPANSION MULTIPLE2.24x2036 value over 2026 base
Strategic Levers
M&A Pipeline
Regional Outlook
Country Rankings
Competitive Intelligence
Segmental Deep-dive
Call-Us : 91 93563 13602

Executive Snapshot and Market Trajectory

Prescribers and payers are redirecting chronic pain treatment budgets toward neurostimulation devices and non-opioid pharmacology faster than at any point in the past decade, chasing durable pain relief that opioid-based regimens cannot deliver without dependency risk, a shift reshaping formulary priorities faster than most manufacturers ever expected.
Neurostimulation devices are pulling ahead of every other category as physicians and payers chase durable, non-addictive pain relief that pharmaceutical regimens cannot match on long-term dependency risk. North America concentrates the largest share of global demand given the region's dominant device manufacturer base and reimbursement infrastructure built in direct response to the opioid crisis, while China itself is growing fastest as expanding chronic pain diagnosis rates and modernising hospital infrastructure pull neurostimulation adoption higher.
Competitive character splits between large diversified medical device manufacturers defending broad multinational neurostimulation franchises and specialty pharmaceutical companies competing hard on novel non-opioid mechanisms across prescriber accounts. Tightening opioid prescribing regulation, combined with rising payer demand for abuse-deterrent and non-addictive alternatives, are pushing treatment protocols toward companies that smaller regional competitors increasingly cannot match without meaningful clinical development investment of their own capital base.
Market Definition
The chronic pain market covers pharmaceutical therapeutics, neurostimulation devices, radiofrequency ablation and interventional devices, regenerative and biologic therapies, and physical rehabilitation and digital therapeutics services used to manage chronic pain conditions. It excludes acute post-surgical pain management confined to hospital settings and general anaesthesia products.
Base Year Value
$88.5B in 2025 (MMA Primary Research Dataset, August 2026)
Forecast Period
2026 to 2036, eleven discrete annual values
CAGR
8.4% base case. Bull 9.6%. Bear 7.2%.
Fastest Growth Segment
Neurostimulation Devices: 12.6% CAGR
Fastest Growth Country
China: 10.2% CAGR
Fastest Growth Region
South Asia and Pacific: 10.4% CAGR
Largest Region
North America: 32% of 2025 global value
Market Leaders
Medtronic plc, Abbott Laboratories, Boston Scientific Corporation, Nevro Corp., Vertex Pharmaceuticals Incorporated. Source: MMA Analysis based on company annual reports and investor filings.
Primary Survey
n=3,800 procurement and R&D decision-makers, Q4 2025, six countries
Methodology
Demand-side build-up, cross-validated against public data, 47 expert interviews

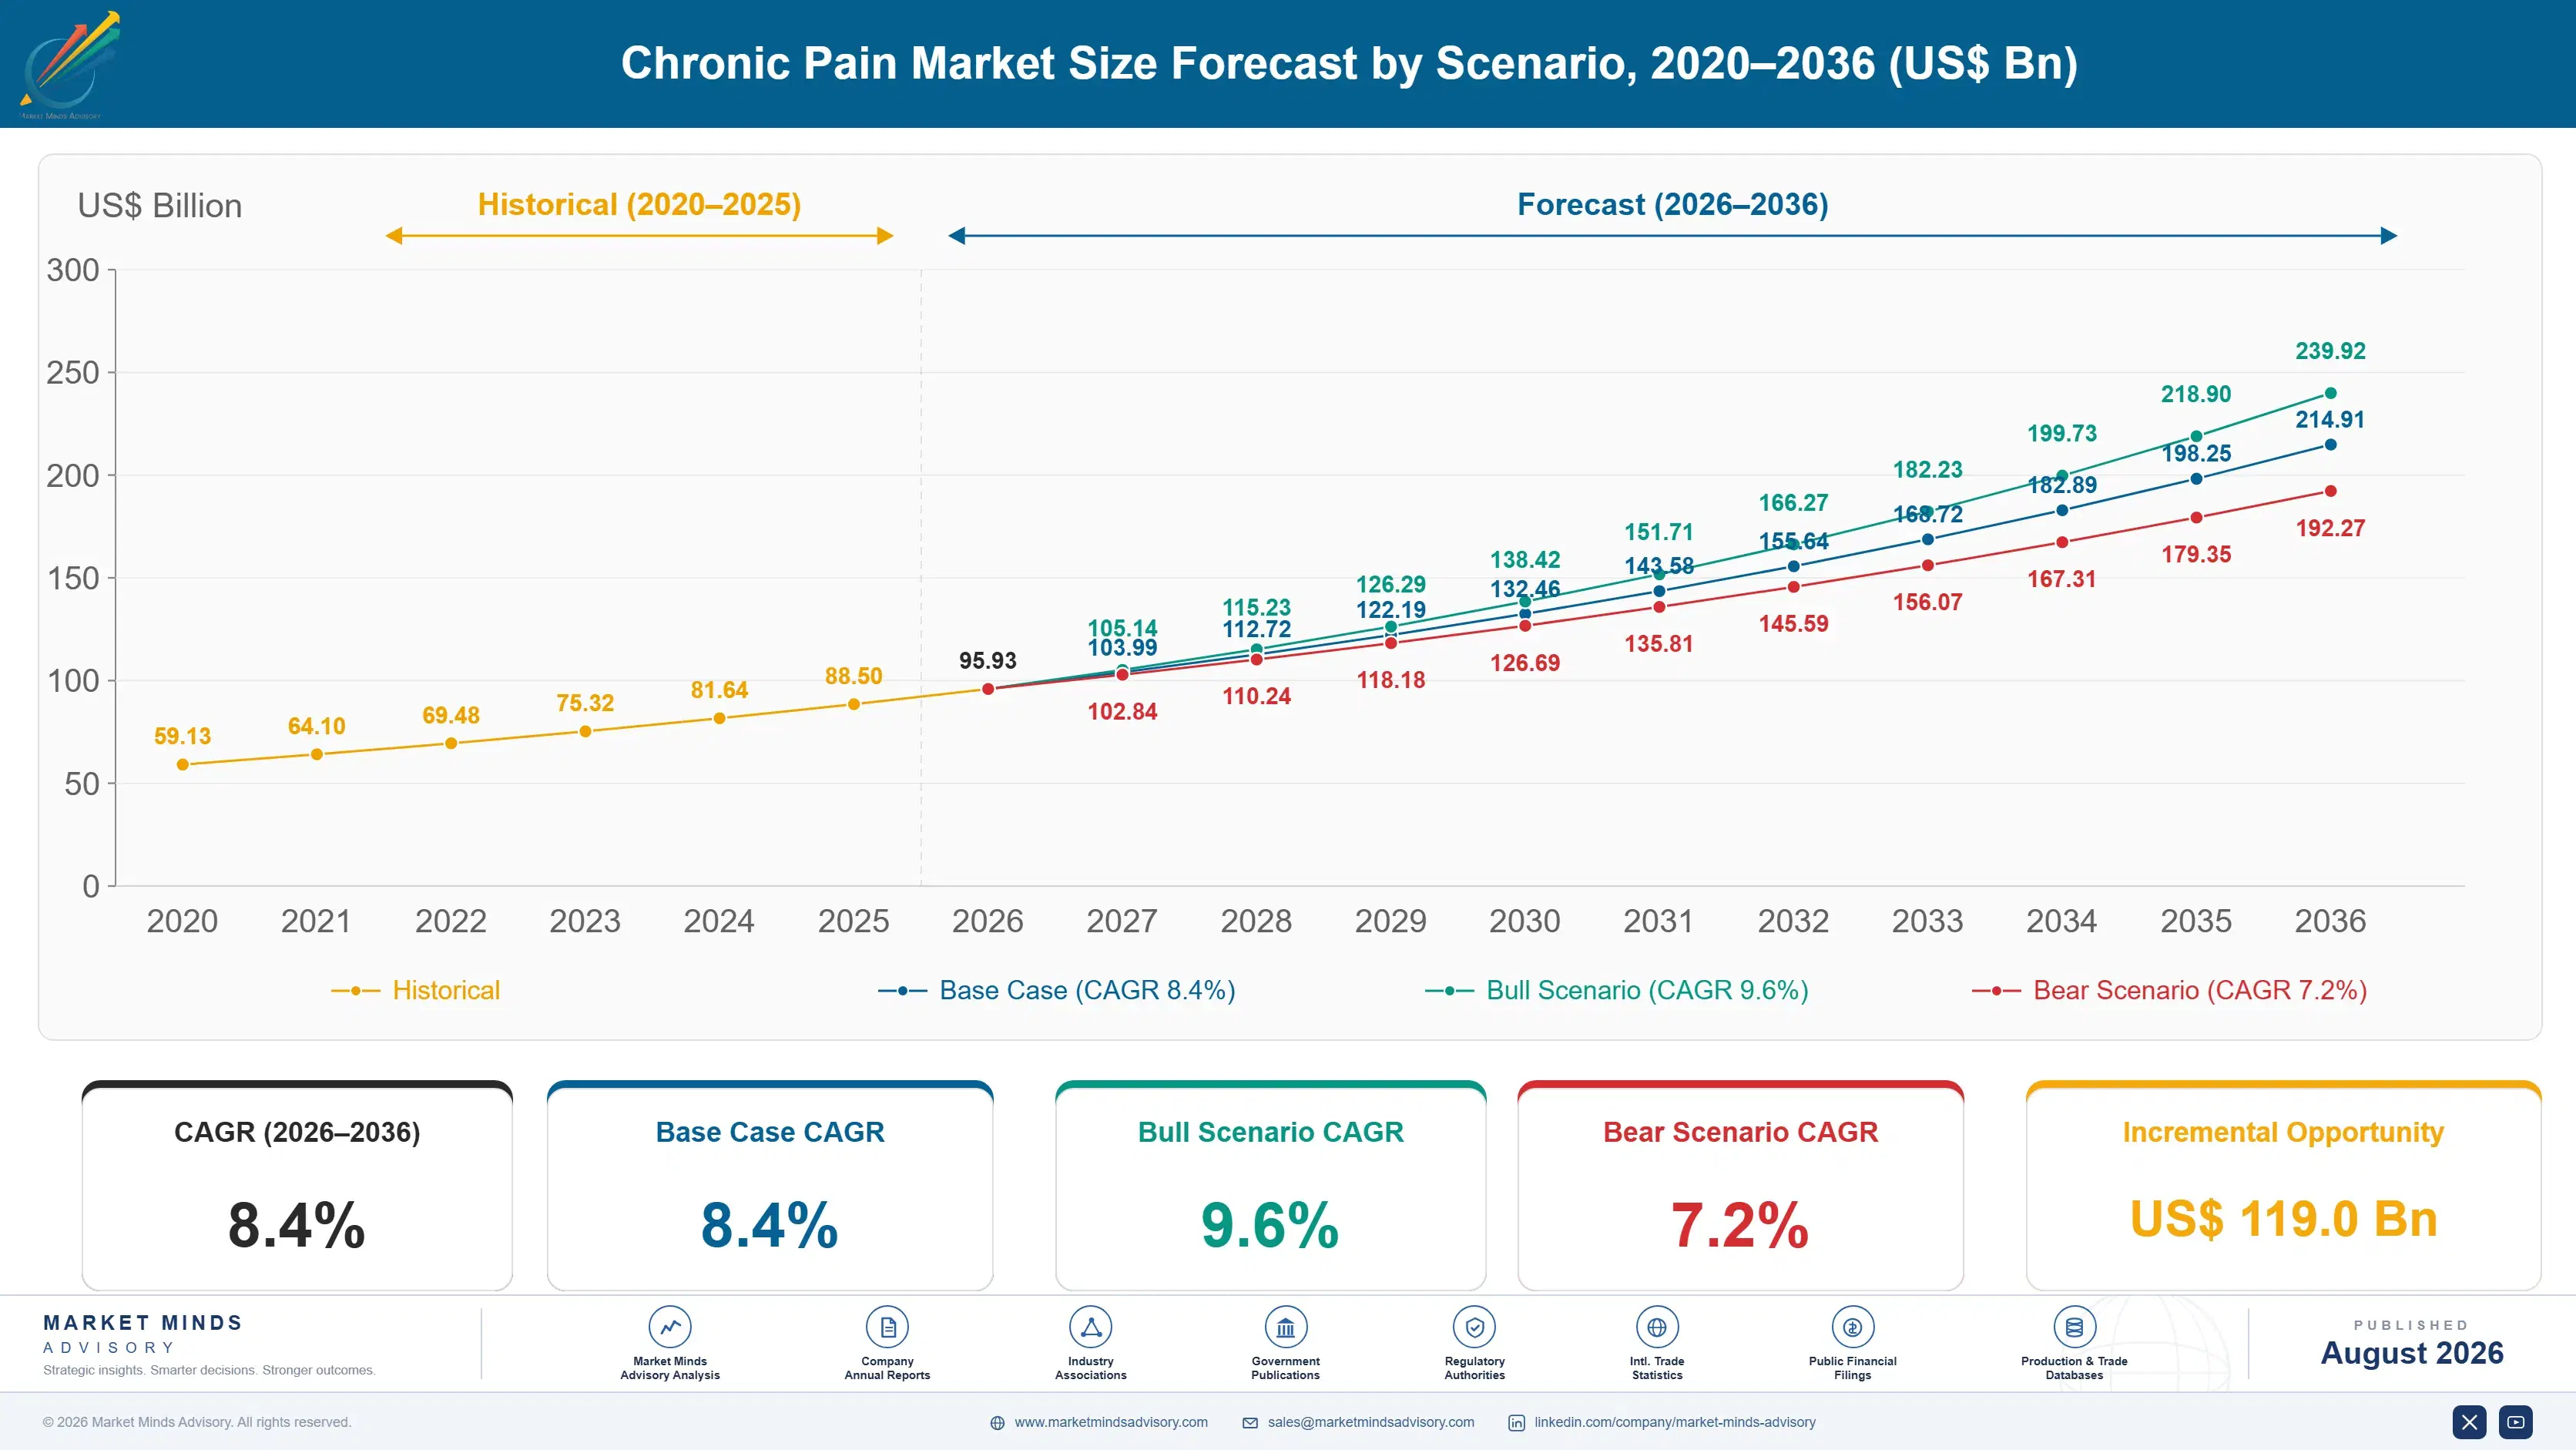
Chronic Pain Market Forecast Scenarios

chronic-pain-market-size-forecast-scenario-1787298238128
Growth from 2020 to 2025 compounded near 7.0%, held back early by pandemic-era elective procedure deferrals that suppressed neurostimulation implant volume across most major healthcare systems, then accelerated as deferred procedures resumed and non-opioid drug approvals pulled demand higher through the back half of the historical period and its recovering procedure volumes and gradually easing device component costs.
Three mechanisms carry the base case to 8.4%. First, expanding neurostimulation reimbursement coverage, which delivers durable pain relief that opioid regimens cannot reliably match across comparable dependency risk profiles. Second, tightening opioid prescribing regulation, which drives demand for non-addictive pharmacological alternatives across major prescriber networks. Third, growing chronic pain diagnosis rates across emerging healthcare markets, which sustains predictable recurring treatment demand across most developing hospital systems and their expanding capital equipment plans.
The bull case at 9.6% assumes non-opioid drug adoption accelerates into additional pain indications faster than current label expansion timelines suggest, pulling forward prescriber adoption considerably. The bear case at 7.2% assumes payer reimbursement tightens faster than manufacturers can demonstrate comparative efficacy and providers defer non-mandatory treatment upgrades across several major markets at once, stretching replacement cycles well beyond plan.

Non-Opioid Pathways Redraw Treatment Standards

Three forces converge on this market simultaneously and reshape treatment protocol decisions considerably. Neurostimulation reimbursement coverage keeps expanding as payers chase durable pain relief that opioid regimens cannot reliably match across comparable dependency risk profiles. Opioid prescribing regulation keeps tightening, driving demand for non-addictive pharmacological alternatives across major prescriber networks. Chronic pain diagnosis rates keep growing across emerging healthcare m
MARKET CONCENTRATIONCR5 44%Reflects a market shaped by diversified device makers and pharma
AVERAGE TREATMENT COSTUSD 380-42,000 per patientVaries substantially by therapy modality and treatment duration
TOP PRODUCING COUNTRY SHAREUSA 27%Reflects concentrated device manufacturing and reimbursement infrastructure scale
NEUROSTIMULATION PENETRATION9%Share of eligible chronic pain patients currently receiving implants
TRADE INTENSITY26%Share of finished devices crossing borders before reaching providers
OPIOID PRESCRIPTION SHARE34%Share of current treatment volume still relying on opioid therapy
Commercially, the market splits between large diversified medical device manufacturers defending broad multinational neurostimulation franchises across multiple pain indications simultaneously and specialty pharmaceutical companies competing hard on novel non-opioid mechanisms across prescriber accounts. Diversified device makers capture value through clinical evidence depth and multinational reimbursement coverage, while specialty pharma companies compete primarily on mechanism novelty and faster label expansion in developing treatment markets.
Looking ahead, expanding neurostimulation reimbursement, tightening opioid prescribing regulation, and growing emerging market chronic pain diagnosis will shape which companies capture the fastest-growing demand pools over the coming decade, rewarding those who invested early in both non-opioid mechanism science and neurostimulation clinical evidence rather than those relying solely on legacy opioid formulations carried over from earlier decades.
"A chronic pain prescription used to default to an opioid unless something ruled it out. Now it defaults to something else unless nothing else works, and that reversal is where the real margin sits."
Director, Pain Management and Neuromodulation Practice · MMA Healthcare - Pain M

Market Trends

Non-Opioid Mechanism Approval Accelerates Prescriber Adoption

Prescribers keep expanding non-opioid analgesic adoption across most major chronic pain treatment programmes, pushing formulary budgets toward companies that deliver dependency-free pain relief legacy opioid regimens cannot reliably match at comparable efficacy levels. Prescribers previously defaulting to opioid therapy for routine chronic pain cases increasingly rewrite treatment protocols to require non-opioid trial before escalating to controlled substances, since dependency outcomes carry substantial clinical and legal liability cost. Companies with validated non-opioid mechanisms already proven across comparable trial populations are capturing formulary placement competitors still relying on legacy opioids cannot bid on at all.
Market Impact: Chinese treatment volume grew 24%
Neurostimulation Reimbursement Expansion Reshapes Device Investment

Neurostimulation reimbursement coverage keeps expanding across most major payer programmes as clinical evidence forces payers to extend coverage criteria to a broader range of pain indications than earlier policy frameworks allowed. This shift is reshaping which manufacturers can compete profitably for large health system contracts, since achieving validated reimbursement coverage requires clinical trial investment that smaller specialty manufacturers increasingly cannot match on comparable research budgets. Manufacturers with proven reimbursement coverage are winning health system contracts that competitors relying on narrower indications increasingly cannot match on documented coverage breadth and long-term outcome data.
Market Impact: Alternative therapy demand grew 19%

Market Opportunities and Growth Drivers

Chinese Chronic Pain Diagnosis Rates Expand Very Rapidly

China's healthcare system continues expanding chronic pain diagnosis and referral capacity as hospitals pursue higher treatment throughput than previous generation informal pain management increasingly could not sustain given persistent patient volume growth simultaneously and aggressively across most major provincial and municipal healthcare systems. Each newly diagnosed patient requires substantial validated treatment pathways meeting consistent clinical standards rather than informal regional-grade protocols. Chinese health authorities increasingly treat validated pain management as a critical input in national healthcare modernisation rather than a downstream clinical decision, pushing providers further into certification earlier than before in their planning cycles.
Market Impact: Standard analgesic pricing fell over 10%

Opioid Prescribing Regulation Sustains Alternative Demand

Opioid prescribing regulation keeps tightening across most major healthcare jurisdictions, forcing prescribers to expand non-opioid procurement at a pace conventional formulary budgets increasingly struggle to accommodate across comparable patient volume growth. Health systems increasingly favor manufacturers with documented efficacy and safety credentials in recurring formulary agreements, pushing manufacturers to treat non-opioid reliability as a commercial necessity rather than a routine catalog item. Manufacturers with proven non-opioid platforms are winning multi-year formulary contracts that competitors relying on generic opioid designs increasingly cannot match on documented safety performance and long-term dependency data.
Market Impact: Adds 6 to 14 months

Market Restraints and Challenges

Generic Competition Squeezes Standard Pharmaceutical Margin

Standard oral analgesic pricing has fallen considerably faster than general pharmaceutical inflation across recent years, squeezing margin on high-volume prescription tenders won primarily through price competition rather than clinical differentiation. The root cause is generic commoditisation of conventional analgesic formulations that manufacturers cannot meaningfully differentiate once basic efficacy specifications become standard across the category. The commercial impact falls hardest on smaller regional manufacturers lacking scale to fund novel development. Several manufacturers now shift capacity toward non-opioid mechanism categories and are exiting commodity tenders where possible, redirecting sales teams toward higher-margin categories instead.
Market Impact: Non-opioid prescriptions rose 28%

Reimbursement Approval Delays Device Commercialisation Timelines

Persistent reimbursement approval delays at payer review boards are delaying device commercialisation timelines even when clinical trial data and regulatory clearance proceed on schedule without complication elsewhere in the approval process. The root cause traces to conservative payer evidence requirements outpacing rapidly expanding manufacturer clinical ambitions across most major healthcare jurisdictions globally. The commercial impact includes delayed market access and rising per-patient trial costs that erode budget manufacturers originally allocated for. Several manufacturers now engage payers earlier in trial design and are pursuing real-world evidence pathways where capital allows it.
Market Impact: Reimbursement coverage expansion grew 22%
4 additional market trends, 3 additional growth drivers, and 3 additional restraints and challenges are covered in the full report. Contact sales@marketmindsadvisory.com to access the complete intelligence.

Segment CAGR and Growth Architecture

Segmentation follows treatment modality rather than pain indication, since a single patient commonly receives several treatment types sequentially within the same overall care pathway and across the same referring physician network. This reflects how manufacturers actually organise clinical development, capital investment, and commercial catalog structure internally across their own therapeutic divisions worldwide today and going forward.
chronic-pain-market-market-share-analysis-1787298238698

Neurostimulation Devices

Neurostimulation devices deliver implantable and external electrical stimulation for chronic pain signal modulation, most valued where physicians pursue durable, non-addictive relief that pharmacological regimens reliably cannot match across comparable long-term dependency exposure. Growth outpaces every other category as payers increasingly specify neurostimulation coverage at the policy design stage rather than treating it as an optional benefit. Manufacturers with validated neurostimulation platforms already proven across comparable patient deployments are capturing reimbursement placement that competitors still relying on legacy pharmaceutical designs cannot bid on at all. The United States and China drive the bulk of current volume given their concentration of active implant procedure capacity and dense specialist clinical talent pools serving nearby hospital systems.
CAGR 12.6%

Regenerative and Biologic Therapies

Regenerative and biologic therapies deliver platelet-rich plasma, stem cell, and biologic injection treatments for chronic pain conditions, most valued where physicians pursue tissue-level repair that standard analgesics reliably cannot support across comparable long-term outcome requirements. Growth is second-fastest across the segmentation, driven by expanding orthopaedic and sports medicine adoption and rising interest in disease-modifying approaches beyond traditional symptomatic management. Manufacturers with validated biologic platforms are capturing physician adoption that competitors still relying on standard designs increasingly cannot match on documented outcome performance. Pricing reflects that complexity, commanding meaningfully higher per-treatment value than standard pharmaceutical alternatives across nearly every major clinical segment tracked in this year's report and its underlying survey data.
CAGR 11.2%
Full segment breakdown across 5 segments available in the complete report.

Regional Architecture and Country Demand Map

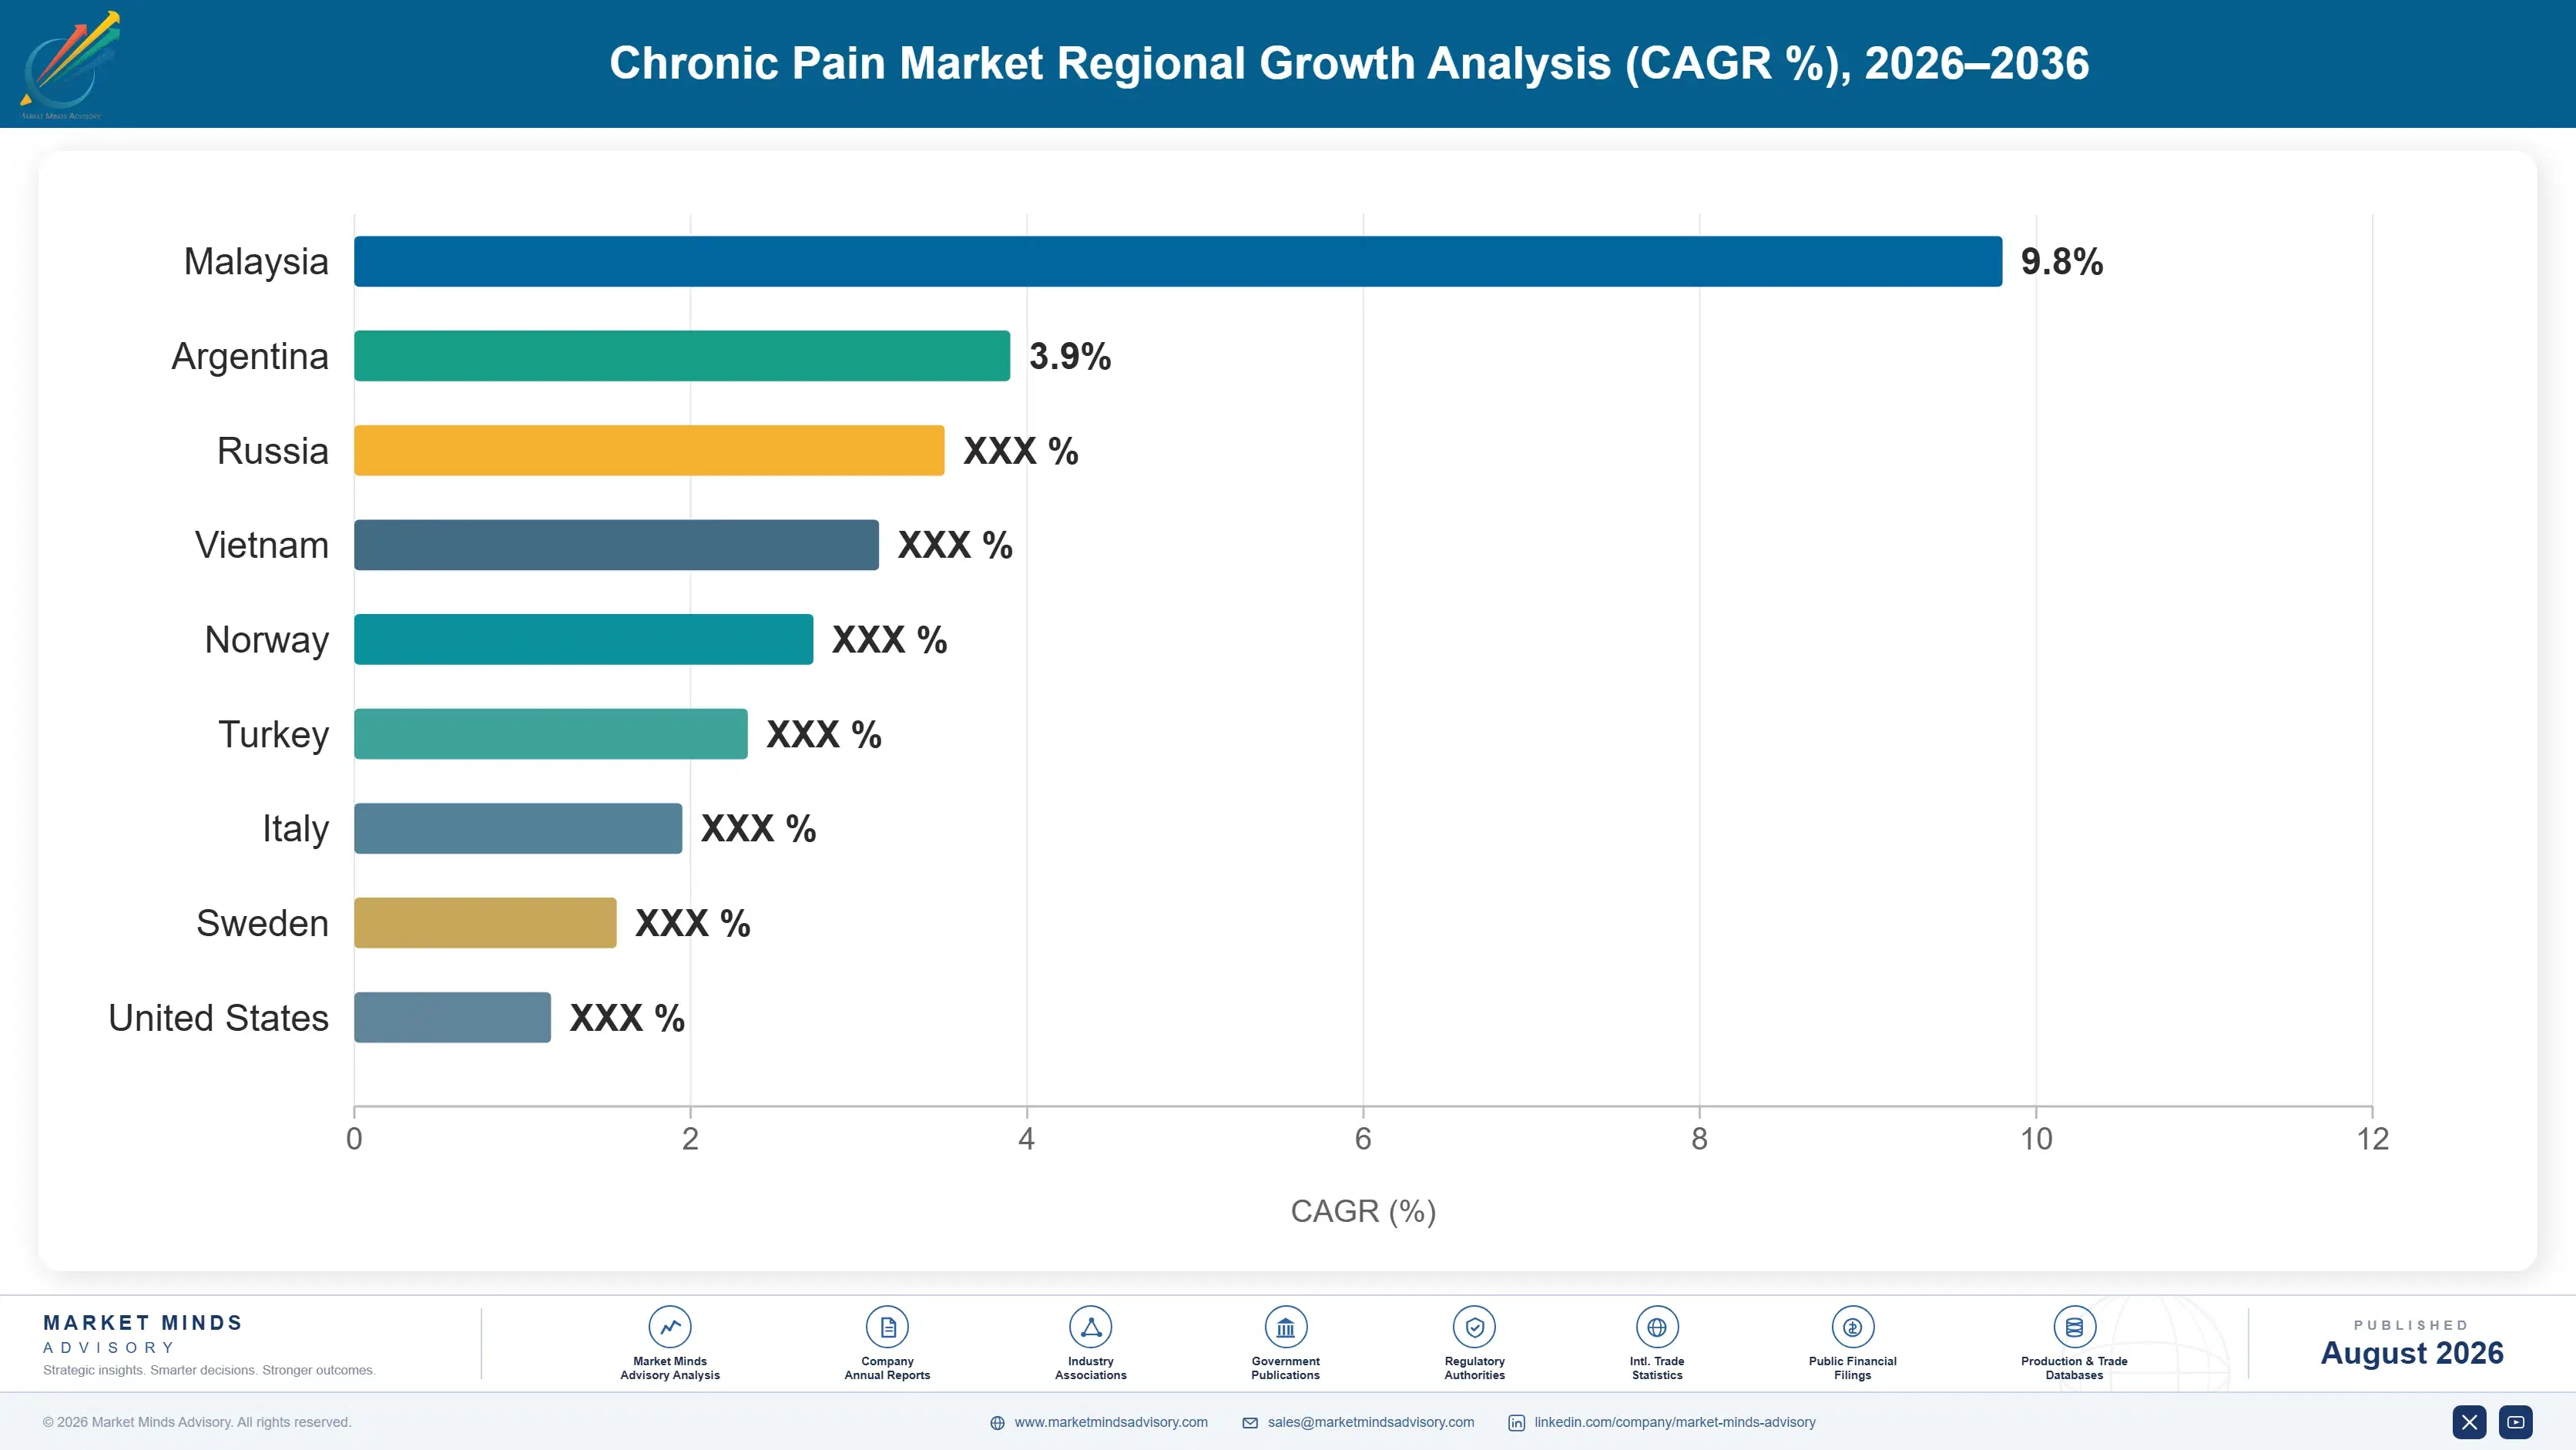
North America holds the largest share given the region's dominant device manufacturer base and reimbursement infrastructure built in direct response to the opioid crisis. China is growing fastest as expanding chronic pain diagnosis rates and modernising hospital infrastructure pull neurostimulation adoption higher across coastal and inland provinces alike.

North America

United States health systems drive the overwhelming majority of regional demand through recurring neurostimulation implant volume at massive procedure counts, with Medtronic and Abbott anchoring supply across most established pain management networks and their affiliated hospital systems. Canada contributes a meaningful base through its own public healthcare sector, tightly linked to cross-border clinical evidence and shared manufacturer relationships. Growth trails the fastest-growing regions because much of the region's treatment base already runs modern non-opioid protocols installed during previous reimbursement cycles, leaving replacement rather than new patient growth as the primary driver of near-term order volume, with payers weighing total lifecycle cost against annual maintenance contract pricing across most established hospital and specialty pain clinic accounts operating throughout the region.
Share: 32% | CAGR: 7.8% (2026 to 2036)

Western Europe

Germany anchors regional demand through its dense clinical research base and concentration of premium pain management centres running neurostimulation programmes ahead of most regional peers and their comparable reimbursement frameworks. France contributes significant volume through comparable providers serving chronic pain patients internationally from European clinical bases spanning years of accumulated treatment protocol knowledge. The United Kingdom adds further volume through its dense national health system serving both domestic and specialist referral patients directly. The region's strict opioid prescribing guidelines sustain steady treatment investment independent of demand cycles entirely. Growth trails the global average as much of the region's provider base already runs non-opioid protocols, leaving replacement rather than new capacity as the primary driver of near-term order volume.
Share: 23% | CAGR: 6.9% (2026 to 2036)
Regional intelligence for 5 additional markets available in the complete report: East Asia, South Asia and Pacific, Latin America, Middle East and Africa, Eastern Europe. Contact sales@marketmindsadvisory.com.
chronic-pain-market-country-cagr-analysis-1787298239206

Where Manufacturers Can Capture More Value

Manufacturers sit between commoditising standard analgesic pricing and rising demand for neurostimulation and biologic platforms, a position that offers several distinct paths to capture more value than a standard prescription sale provides, particularly as bundled treatment contracts and novel mechanism science gain commercial importance among payer buyers. The four levers below reflect where margin is genuinely shifting.

Bundle Neurostimulation Conversion With Treatment Contracts

Health systems navigating increasingly demanding opioid reduction targets increasingly prefer manufacturers who bundle full neurostimulation conversion with broader treatment contracts, since that pairing reduces the health system's own vendor management complexity considerably compared with sourcing pharmaceutical and device therapies separately from different suppliers. Medtronic and Abbott have both expanded dedicated conversion programmes covering health system portfolios worth well over USD 280 million combined across recent years of active contract renewal in the sector. That structure builds stickier customer relationships since switching manufacturers mid-contract would force health systems to requalify vendors entirely from scratch and delay procedures.
Market Impact: Health system conversion programmes now exceed USD 280 million

Expand Non-Opioid Development Capacity Now Aggressively

Non-opioid mechanism development demand represents a considerably more defensible margin pool than standard generic analgesic demand alone could ever support, since non-opioid pricing commands roughly 3 times standard generic per-treatment value across most major producing markets tracked in this report. Manufacturers expanding dedicated clinical development capacity capture formulary contracts that generalist competitors increasingly cannot match, generating meaningful revenue through phased pipeline conversion that unfolds across multiple budget cycles rather than a single capital purchase decision made all at once across the manufacturer's broader capital and clinical development strategy for the years ahead.
Market Impact: Non-opioid pricing exceeds standard generics by roughly 3 times

Build Direct Payer Framework Relationships Early

Large health insurers increasingly consolidate treatment procurement through direct framework agreements, and manufacturers who maintain direct relationships with these payers capture recurring multi-treatment revenue considerably more predictable than one-off individual prescriptions alone ever provide, often worth USD 7 million or more annually across a comparable payer relationship. That relationship also generates early visibility into upcoming coverage expansion cycles before competitors even learn a policy change is coming their way at all. Building this relationship depth should rank above chasing every available individual prescription across the wider treatment market and its adjacent coverage cycles.
Market Impact: Framework agreements renew across 3 to 5 year cycles

Expand Indian Healthcare Presence Immediately Now

Indian chronic pain treatment demand is scaling quickly, growing near 10% annually, as domestic providers expand capacity requiring validated treatment engineering meeting international clinical standards across most major metropolitan healthcare hubs and their satellite markets. Manufacturers establishing local commissioning and service presence early are winning multi-year hospital contracts before competitors relying solely on imported product can match local pricing and delivery turnaround speed across comparable market scale. That early-mover position compounds considerably as India's healthcare sector keeps climbing through the remainder of the decade ahead of most other regional markets.
Market Impact: Indian demand grows near 10% each year now

Who Controls the Margin Pool

Concentration sits at a moderate 44% for the top five, reflecting a market shaped by large diversified medical device manufacturers defending broad multinational neurostimulation franchises and numerous specialty pharmaceutical companies competing hard on novel non-opioid mechanisms. The gap between leaders and challengers comes down to clinical evidence depth rather than raw commercial scale alone. All participants here are assessed on one basis, annual chronic pain product and device revenue,
Competition runs along three lines. First, clinical evidence depth, since manufacturers with documented long-term outcome credentials win payer tenders competitors still completing trials cannot bid on. Second, reimbursement scalability, as health systems increasingly demand consistent multi-site coverage bundled into standard treatment agreements. Third, distribution reach, particularly for manufacturers pursuing fast-growing Indian and Southeast Asian healthcare markets directly.

Pressure is building from two directions. Specialty pharmaceutical companies are narrowing the clinical evidence gap considerably faster than expected, squeezing volume established device manufacturers previously captured on brand reputation alone. Meanwhile larger diversified healthcare companies keep acquiring specialty mechanism developers to fill pipeline gaps rather than build organically, consolidating the field further. Rankings should favor companies combining clinical evidence depth with genuine regional service reach.
chronic-pain-market-company-positioning-matrix-1787298239727

Competitive Moat and Risk Dimensions

MEDTRONIC PLC

Moat: Deep global implant reputation

Medtronic's decades-long presence across neurostimulation engineering gives it deep credibility with physicians navigating implant specification, supporting premium pricing that narrower specialty competitors cannot command. Its scale supports clinical development investment in next-generation closed-loop stimulation platforms that smaller manufacturers typically cannot match on comparable research budgets.
MEDTRONIC PLC

Risk: Broad portfolio strategic dilution

Medtronic's chronic pain device revenue remains a smaller share of a much larger medical device portfolio, leaving strategic focus more exposed to internal capital allocation shifts than pure-play competitors dedicated entirely to pain management development and their specific physician relationships. Focused rivals can often move faster on indication-specific engineering investment decisions.
VERTEX PHARMACEUTICALS INCORPORATED

Moat: First-mover non-opioid mechanism

Vertex's landmark non-opioid analgesic approval, the first new mechanism cleared in decades, gives it deep first-mover credibility with prescribers and payers that narrower generic competitors cannot easily replicate. Its regulatory relationship supports rapid label expansion that smaller specialty developers typically cannot match on approval speed across comparable pain indications.
VERTEX PHARMACEUTICALS INCORPORATED

Risk: Single-product commercial exposure

Vertex's chronic pain commercial strength remains heavily concentrated in a single approved mechanism, leaving it more exposed to competitive fast-follower entry than diversified device manufacturers with stronger positions across multiple therapeutic categories and their distinct reimbursement pathways and clinical protocols, a gap that widens further once fast-follower competitors reach approval.

Players Tracked

Prominent Players

Medtronic plc
Abbott Laboratories
Boston Scientific Corporation
Nevro Corp.
Vertex Pharmaceuticals Incorporated

Other Key Players

Saluda Medical Pty Ltd
Nalu Medical, Inc.
Avanos Medical, Inc.
Baxter International Inc.
Teva Pharmaceutical Industries Ltd.
Collegium Pharmaceutical, Inc.
Pacira BioSciences, Inc.
Grunenthal GmbH
Hisamitsu Pharmaceutical Co., Inc.
Mundipharma International Limited
Eli Lilly and Company
Pfizer Inc.
Johnson and Johnson
Cala Health, Inc.
Stryker Corporation

Recent Developments

MARCH 2025

Medtronic launches next-generation closed-loop stimulation platform

Medtronic launched a next-generation closed-loop neurostimulation platform designed to meet expanding chronic pain treatment requirements across major health systems with improved signal adaptation beyond its prior design. This was a product launch rather than an acquisition, extending Medtronic's clinical reach into a broader physician customer base worldwide.
Signal: Manufacturers are increasingly launching dedicated closed-loop platforms rather than adapting standard designs after the original release.
OCTOBER 2024

Abbott acquires specialty peripheral nerve stimulation developer

Abbott acquired a specialty peripheral nerve stimulation technology developer to strengthen its neurostimulation portfolio rather than continue developing comparable technology internally across its broader device catalog and customer base. This was a confirmed acquisition, extending Abbott's operational capability directly and permanently across its entire product division and regional service network.
Signal: Larger diversified manufacturers are acquiring specialty technology developers to internalise mechanism capability rather than license it.
MAY 2025

Boston Scientific signs multi-year supply agreement across Indian hospital network

Boston Scientific signed a multi-year device supply agreement covering validated neurostimulation deliveries across several Indian hospital network expansion projects currently under active development across multiple states. This was a confirmed supply agreement rather than an acquisition, extending Boston Scientific's South Asian presence directly and substantially over time.
Signal: Device supply agreements are increasingly tied to national healthcare expansion cycles rather than standalone one-off tenders.

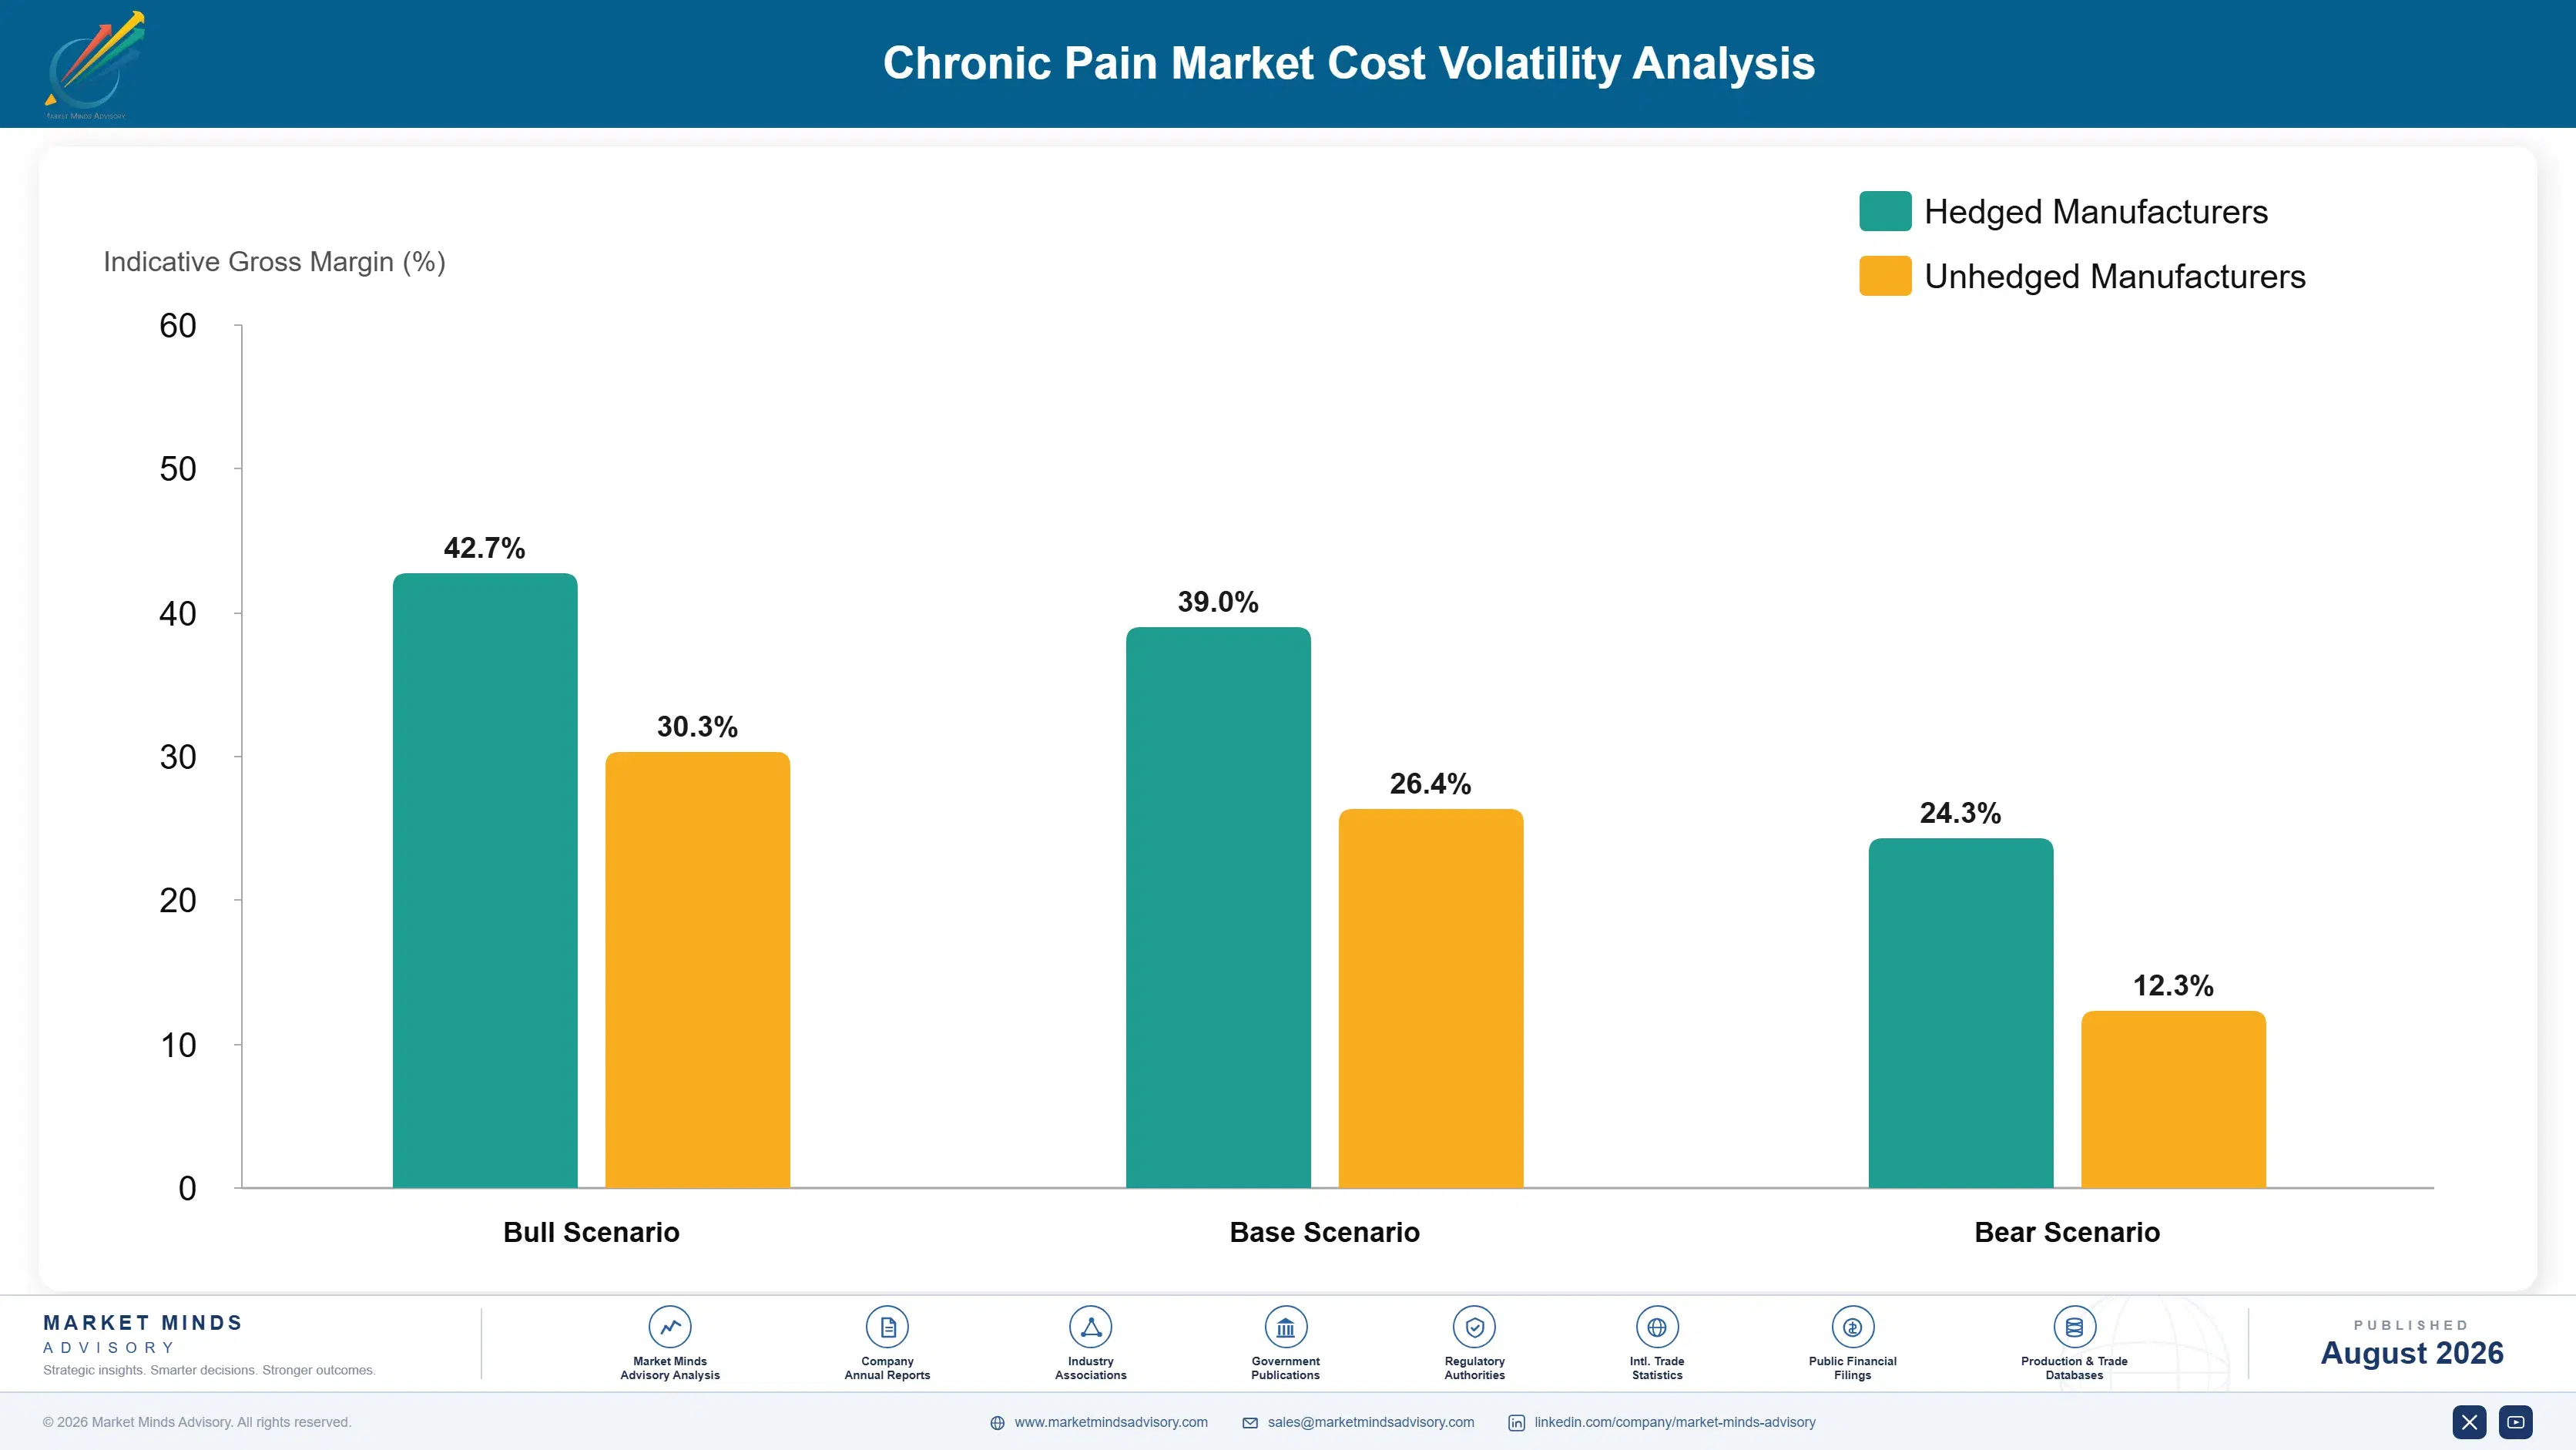
Clinical Trial and Device Component Cost Exposure

Late-stage clinical trial execution, implantable-grade electronic components, and specialty biocompatible materials together make up roughly 51% of development and production cost, with clinical trial capacity sourced through a concentrated group of contract research organisations manufacturers cannot meaningfully influence on their own, and implantable-grade components sourced through a constrained pool of specialist electronics suppliers subject to their own certification requirements and capa
Clinical trial and component input costs rose considerably through 2024, with published EIA and industry data showing sustained upward pricing pressure tied to constrained specialist electronics supply and rising global device demand competing directly with manufacturers for available trial capacity across every major producing region. Several manufacturers absorbed a meaningful share of the cost increase rather than risk losing fixed-price payer agreements already signed before the volatility began that year.

Larger diversified manufacturers with greater purchasing scale negotiate more favorable trial and component input economics than smaller regional manufacturers, who typically lack comparable volume leverage with upstream research and electronics suppliers across most specialty markets. That gap widens further for manufacturers dependent on a small number of qualified component sources, since switching sources requires renewed qualification testing taking several months to complete.
chronic-pain-market-cost-volatility-analysis-1787298239923

Qualify Multiple Trial and Component Suppliers

Manufacturers qualifying two or more sources for critical trial and component capacity reduce single-source dependency risk considerably, though the qualification process itself requires meaningful upfront testing investment and lead time before a second source becomes usable in volume production supporting validated clinical requirements across every product family currently active under development and its associated supply contracts.

Negotiate Multi-Year Index-Linked Supply Contracts

Manufacturers negotiating multi-year component supply contracts with indexed pricing formulas protect margin predictability better than those repricing purchases annually, a structure that requires accepting somewhat higher baseline pricing in exchange for materially reduced volatility exposure across the full contract term negotiated with each upstream supplier directly and renewed periodically as demand shifts over time.

Build Cost Escalation Clauses Into Payer Agreements

Manufacturers building input cost escalation clauses directly into multi-year payer supply agreements pass volatility through to buyers rather than absorbing it against thin tender margin, a structure that protects profitability during price spikes though it requires negotiating leverage smaller manufacturers often lack against larger payer systems and procurement teams with considerably more purchasing scale.

Portfolio Architecture for Margin Defence

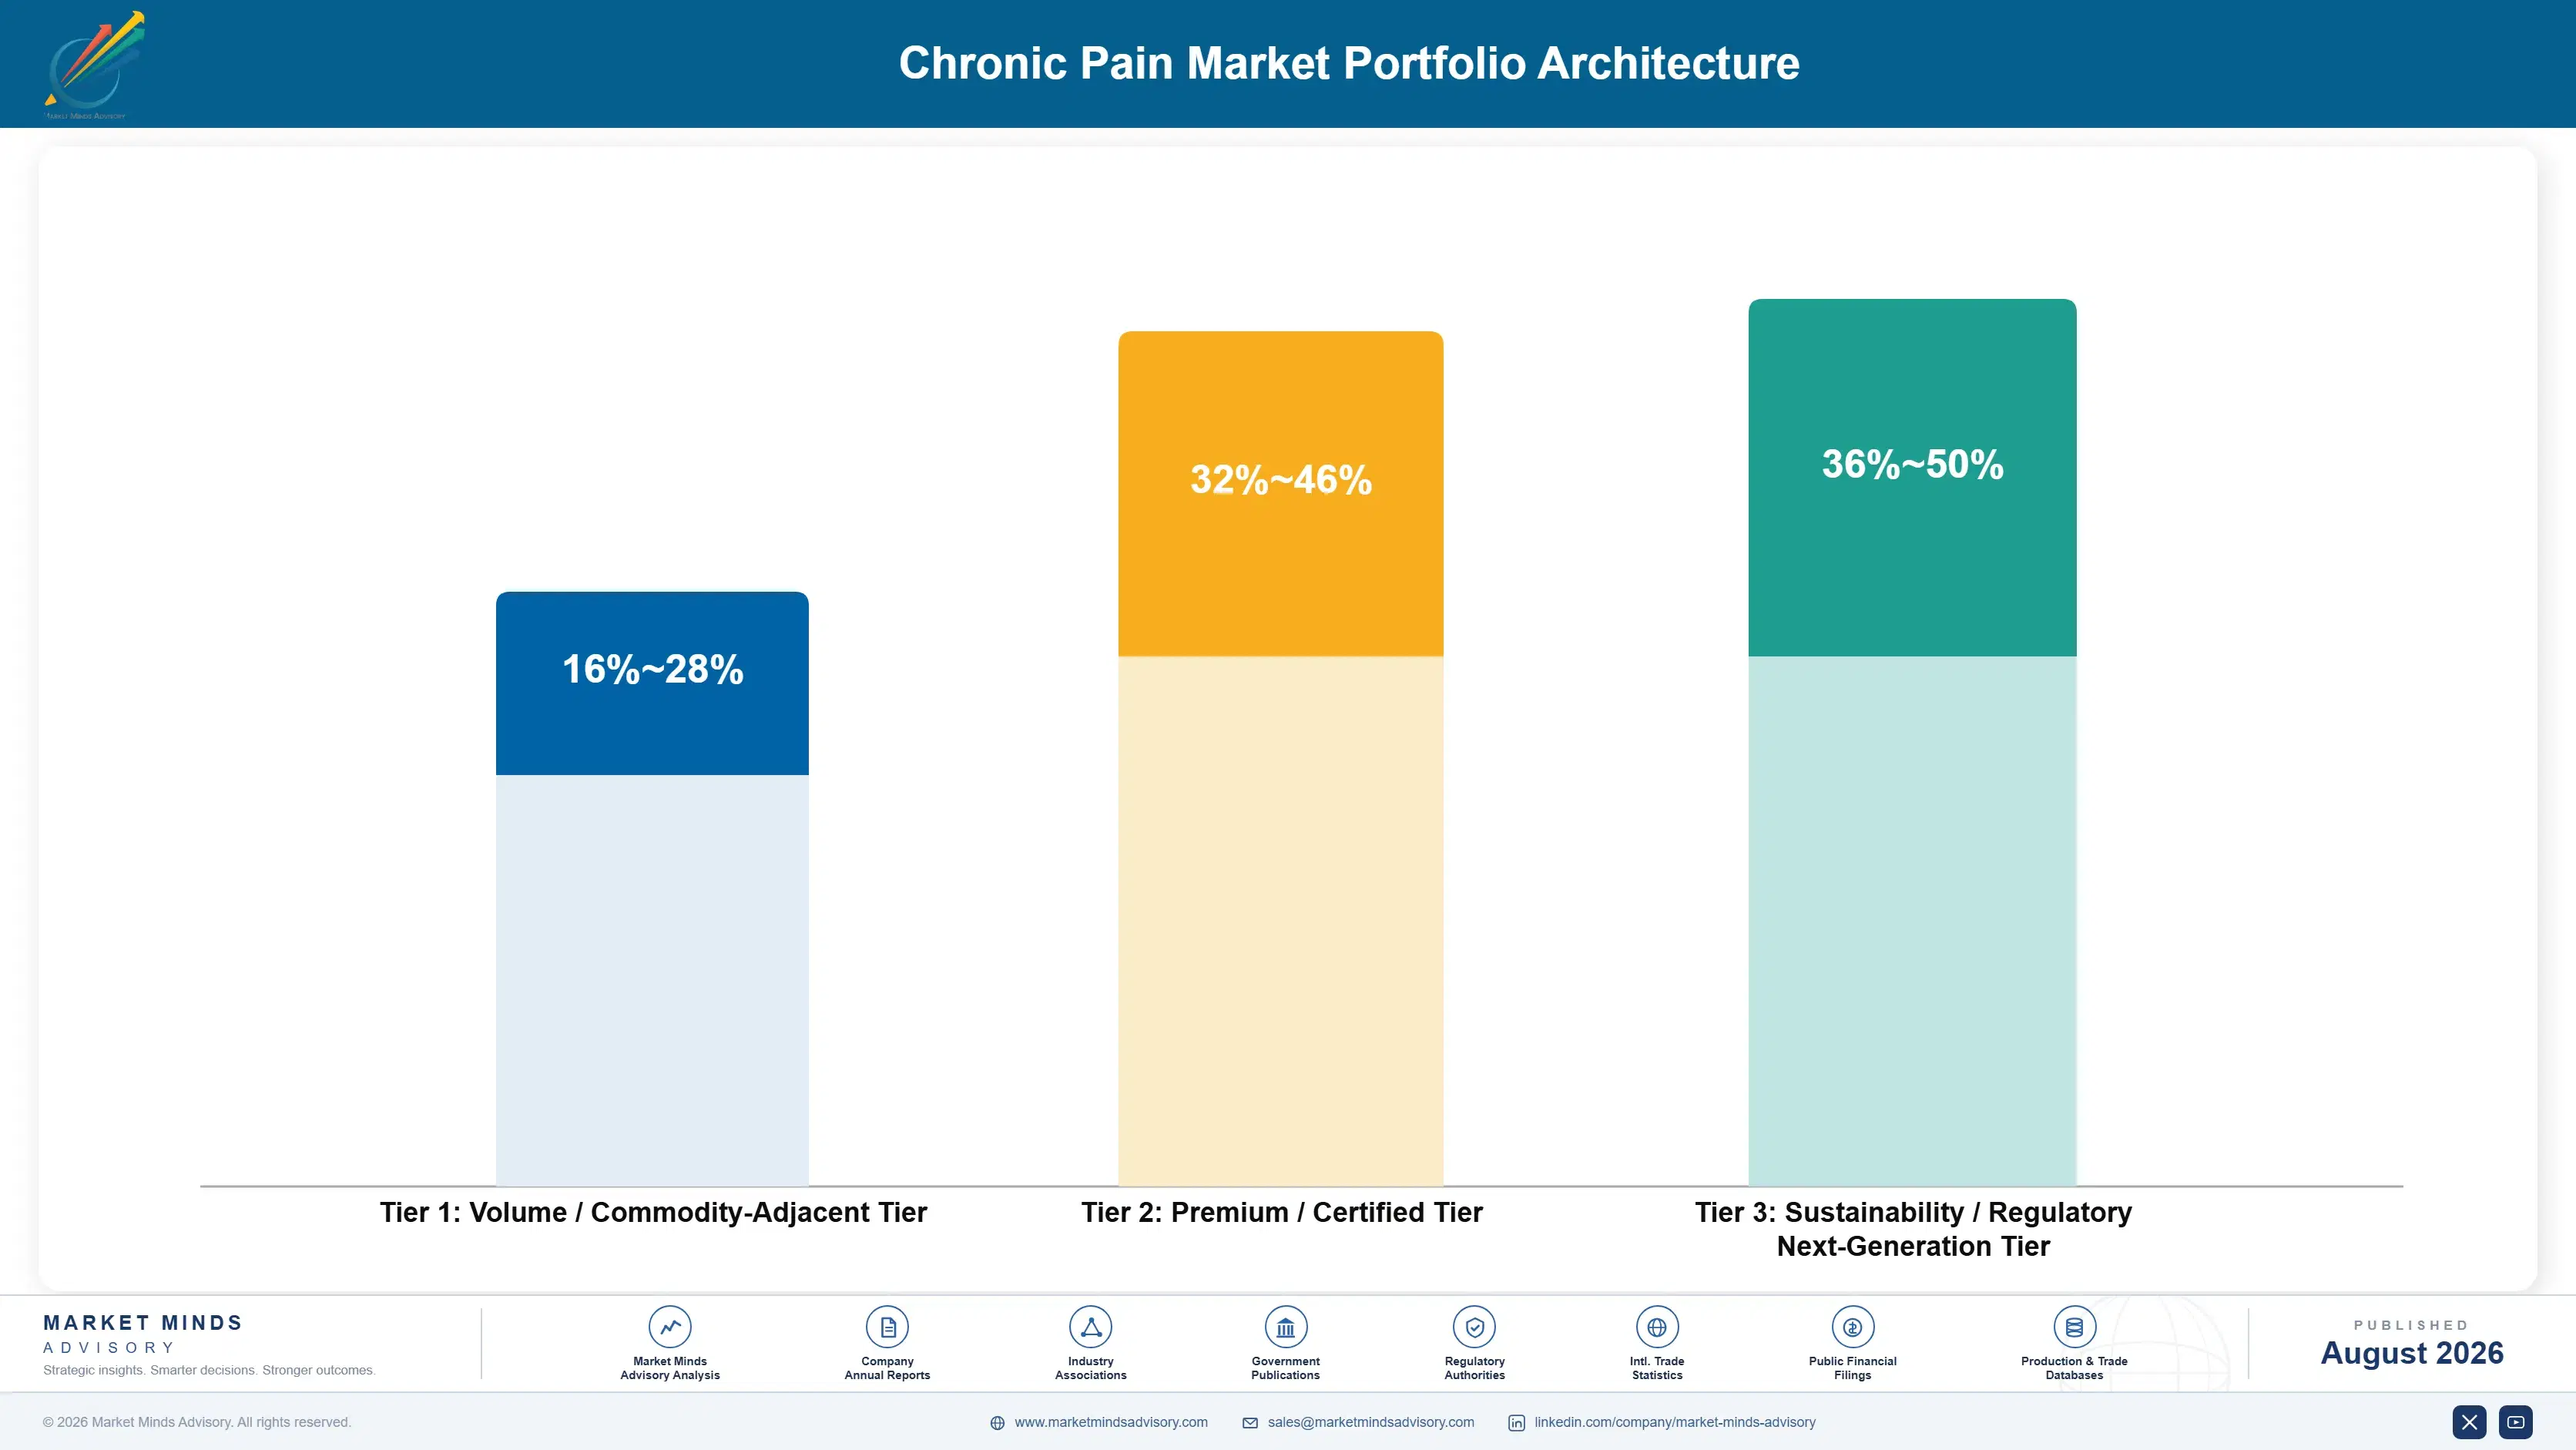
The portfolio splits into three tiers with sharply different economics. Standard generic analgesics and basic radiofrequency ablation form the volume tier, competing largely on price and formulary tender terms with margin set by manufacturing scale and distribution efficiency. Neurostimulation and regenerative biologic therapies earn considerably more because clinical evidence depth and documented outcome durability both resist the commoditisation pressure hitting standard analgesics. Closed-loo
The tension runs between winning standard generic volume on price and formulary access speed, and building neurostimulation or biologic capability that protects margin over the long run. A manufacturer chasing every standard commodity tender available eventually gets squeezed as generic producers undercut aggressively on price, yet building specialty capability requires development investment thin-margin standard sales rarely fund adequately on their own.

High-value pools concentrate where clinical complexity, validated outcome durability, or recurring payer relationships limit competition: neurostimulation platforms serving chronic implant patients, regenerative biologic systems serving orthopaedic and sports medicine customers, and framework-backed relationships spanning multiple years of recurring supply. Standard generic analgesics sit at the other end, competing almost entirely on price and formulary placement speed.

Volume / Commodity-Adjacent Tier

Standard generic analgesics and basic radiofrequency ablation for mainstream chronic pain applications, competing largely on price and formulary access speed with thin, scale-dependent margin across most tenders and payer bids reviewed each cycle.
Gross Margin: 16-28%

Premium / Certified Tier

Neurostimulation and regenerative biologic therapies with validated clinical evidence and documented outcome durability performance serving physician and health system customers directly, priced for clinical complexity, reliability depth, and payer relationship value.
Gross Margin: 32-46%

Sustainability / Regulatory / Next-Generation Tier

Closed-loop adaptive stimulation platforms with connected outcome documentation, priced on long-term compliance and clinical equity value that extends well beyond raw unit economics and standard pricing alone across most regulated segments and relationships.
Gross Margin: 36-50%
chronic-pain-market-portfolio-architecture-1787298240457

High-value Sub-segments and Strategic Watch-out

Neurostimulation Devices

High value and high growth at 12.6%, the fastest category by a wide margin, as payers chase durable, non-addictive relief that pharmacological regimens cannot reliably deliver across nearly every major producing region tracked closely throughout this entire report and its underlying survey data and forecasts today.
Gross Margin: 32-46%

Regenerative and Biologic Therapies

High value with strong growth at 11.2%, driven by expanding orthopaedic and sports medicine adoption and rising interest in disease-modifying approaches beyond traditional symptomatic management, a gap that keeps widening across most clinical categories tracked carefully across this entire report and its underlying data today.
Gross Margin: 32-46%

Pharmaceutical Therapeutics

The volume core by prescription count, growing near 6.2% as standard pharmaceutical applications remain the largest category even as growth concentrates in device and biologic formats elsewhere across the broader portfolio, margin mix, payer budget allocation, and evolving catalog structure over the entire coming decade.
Gross Margin: 16-28%

Radiofrequency Ablation and Interventional Devices

The strategic watch-out, growing slowest at roughly 5.4% and facing steady commoditisation as standard ablation applications become a bundled entry-level offer rather than a genuinely differentiated purchase decision across most regional tenders reviewed carefully throughout this entire full analysis and its underlying survey data today.
Gross Margin: 18-30%

Recurring Treatment Revenue Through Coverage Cycles

Treatment revenue increasingly behaves like an annuity layered on top of the original diagnosis rather than a one-time transaction. Every disease progression, device replacement, and coverage renewal extends the manufacturer relationship well beyond initial treatment, and manufacturers with validated clinical credentials capture repeat treatment cycles with lower friction than switching to an unproven alternative manufacturer would require of a demanding health system customer.
Adoption depth varies considerably by end-use vertical. Large academic medical centres have the deepest, most established neurostimulation adoption given clinical and reputational requirements that make unconverted treatment protocols extremely costly in outcome exposure terms, while smaller regional hospitals are earlier in adopting comparable reliability-documented manufacturers and still weighing cost against demonstrated outcome improvement. Specialty pain clinics sit differently, adopting non-opioid platforms quickly given the recurring, high-stakes nature of their prescribing liability exposure.

A generational shift is underway in prescriber and payer teams across most major markets. Younger physician leadership increasingly treats non-opioid mechanism depth and neurostimulation coverage as baseline treatment requirements rather than differentiators, a shift that is compressing the commercial advantage early-adopting manufacturers once held over competitors still running largely opioid-focused product catalogs.
chronic-pain-market-end-use-penetration-index-1787298240945

Where Manufacturers Should Focus Next

These are among the four positions where our research anticipates prominent divergence between winners and laggards over the coming forecast period. Each is grounded in the demand model, the regulatory perimeter, and the announced capacity pipeline.
01 / NEUROSTIMULATION CONVERSION BUNDLING

Bundled neurostimulation conversion increasingly separates leaders from challengers

Health systems navigating increasingly demanding opioid reduction targets increasingly prefer manufacturers who bundle full neurostimulation conversion with broader treatment contracts, since that pairing reduces the health system's own vendor management complexity considerably compared with sourcing pharmaceutical and device therapies separately from different suppliers. That structure builds stickier customer relationships since switching manufacturers mid-contract would force health systems to requalify vendors entirely from scratch. Manufacturers without comparable conversion programmes remain exposed as health systems increasingly expect integrated pain expertise rather than products alone.
02 / NON-OPIOID DEVELOPMENT EXPANSION

Non-opioid development capacity beats commodity generic volume

Non-opioid mechanism development demand represents a considerably more defensible margin pool than standard generic analgesic demand alone could ever support, since non-opioid pricing commands roughly 3 times standard generic per-treatment value across most major producing markets tracked in this report. Manufacturers expanding dedicated clinical development capacity capture formulary contracts that generalist competitors increasingly cannot match, generating meaningful revenue through phased pipeline conversion unfolding across multiple budget cycles. Building this capacity should rank above chasing standard generic tenders exclusively across every major payer relationship.
03 / PAYER FRAMEWORK RELATIONSHIPS

Direct payer relationships beat one-off prescription sales

Large health insurers increasingly consolidate treatment procurement through direct framework agreements, and manufacturers who maintain direct relationships with these payers capture recurring multi-treatment revenue considerably more predictable than one-off individual prescriptions alone ever provide across a comparable payer relationship. That relationship also generates early visibility into upcoming coverage expansion cycles before competitors even learn a policy change is coming their way. Building this relationship depth should rank above chasing every available individual prescription across the wider treatment market and its adjacent coverage cycles.
04 / INDIAN MARKET EXPANSION

Early presence in Indian healthcare expansion compounds over time

Indian chronic pain treatment demand is scaling quickly as domestic providers expand capacity requiring validated treatment engineering meeting international clinical standards across most major metropolitan healthcare hubs and their satellite markets. Manufacturers establishing local commissioning and service presence early are winning multi-year hospital contracts before competitors relying solely on imported product can match local pricing and delivery turnaround. That early position compounds considerably as India's healthcare sector keeps climbing through the remainder of the decade, rewarding early movers meaningfully over slower-moving competitors.

Engagement Snapshot From the Field

A live engagement with an industry participant carrying material or product regulatory and market exposure ahead of a defining policy shift, showing how our research translates into a defensible multi-year portfolio strategy.
MARKET MINDS ADVISORY · CLIENT ENGAGEMENT SUMMARY
Chronic Pain Producer Strategic Portfolio Review and Transition Roadmap 2026·Investment Scenario on Chronic Pain Exposure Evaluation 2025-26
CLIENT PROFILE
A mid-size integrated health system operating two flagship pain management centres engaged MMA while evaluating a system-wide opioid-to-neurostimulation protocol modernisation strategy ahead of a planned service line expansion cycle spanning the following two fiscal years. The client reported reliance on opioid-first prescribing across most of its patient population, with limited neurostimulation capability concentrated at only its flagship centre (client-reported, unverified by MMA).
STRATEGIC CHALLENGE
Leadership needed to decide whether full neurostimulation protocol conversion across both centres would reduce opioid dependency exposure faster than continuing the mixed prescribing approach, while also weighing which manufacturers offered clinical support flexible enough to sequence conversion across centres without disrupting existing patient schedules already committed to current treatment protocols and their prescribing timelines.
MMA APPROACH
MMA benchmarked four qualified manufacturers on clinical evidence credential validation, capacity flexibility, and total lifecycle cost against the health system's two-centre conversion plan in considerable detail. We modelled a phased conversion sequence prioritising the highest-volume centre first across the programme. We then assessed each manufacturer's physician training support capacity given the client's aggressive conversion timeline.
KEY FINDINGS
  1. Converting the highest-volume centre first would capture roughly 53% of projected opioid dependency exposure reduction within the programme's first full year of operation.
  2. Two of four candidate manufacturers could not guarantee implant capacity meeting the health system's aggressive conversion timeline across both centres reliably or within budget.
  3. Full neurostimulation conversion would reduce projected opioid prescription incidents by an estimated 32% once fully operational across the entire converted centre network.
  4. The leading manufacturer's bundled physician training programme would reduce the health system's own staff onboarding burden by several weeks per centre overall, freeing clinical capacity.
CLIENT PROFILE
A mid-size integrated health system operating two flagship pain management centres engaged MMA while evaluating a system-wide opioid-to-neurostimulation protocol modernisation strategy ahead of a planned service line expansion cycle spanning the following two fiscal years. The client reported reliance on opioid-first prescribing across most of its patient population, with limited neurostimulation capability concentrated at only its flagship centre (client-reported, unverified by MMA).
STRATEGIC CHALLENGE
Leadership needed to decide whether full neurostimulation protocol conversion across both centres would reduce opioid dependency exposure faster than continuing the mixed prescribing approach, while also weighing which manufacturers offered clinical support flexible enough to sequence conversion across centres without disrupting existing patient schedules already committed to current treatment protocols and their prescribing timelines.
MMA APPROACH
MMA benchmarked four qualified manufacturers on clinical evidence credential validation, capacity flexibility, and total lifecycle cost against the health system's two-centre conversion plan in considerable detail. We modelled a phased conversion sequence prioritising the highest-volume centre first across the programme. We then assessed each manufacturer's physician training support capacity given the client's aggressive conversion timeline.
KEY FINDINGS
  1. Converting the highest-volume centre first would capture roughly 53% of projected opioid dependency exposure reduction within the programme's first full year of operation.
  2. Two of four candidate manufacturers could not guarantee implant capacity meeting the health system's aggressive conversion timeline across both centres reliably or within budget.
  3. Full neurostimulation conversion would reduce projected opioid prescription incidents by an estimated 32% once fully operational across the entire converted centre network.
  4. The leading manufacturer's bundled physician training programme would reduce the health system's own staff onboarding burden by several weeks per centre overall, freeing clinical capacity.
RECOMMENDED STRATEGY
Phase 1: Phase 1 (0 to 5 months): Finalise manufacturer selection and convert the highest-volume centre identified across the entire health system first. Phase 2: Phase 2 (5 to 10 months): Complete remaining centre conversion sequenced around ongoing patient scheduling and training commitments across both locations. Phase 3: Phase 3 (10 to 18 months): Complete full network conversion and renegotiate framework terms under the newly established supply structure.
OUTCOME
The health system completed priority centre conversion within the targeted six-month window and reported opioid dependency exposure reduction tracking close to the modelled estimate across the converted centre network. Projected opioid prescription rates also declined measurably under the new treatment standard, though full eighteen-month transition figures were not yet available at the time of reporting (client-reported, unverified by MMA).

Frequently Asked Questions

Foundational context covering the market sizes, CAGR, scope, country, region and competition that inform every finding below. This section is provided to cover basics and most often pre-purchase conversations, answered from the MMA Primary Research Dataset.

What is the current size of the Chronic Pain Market?

The global chronic pain market is valued at USD 88.5 billion in 2025, covering pharmaceutical therapeutics, neurostimulation devices, ablation devices, biologic therapies, and rehabilitation services.

How large will the Chronic Pain Market be by 2036?

The market is projected to reach USD 214.91 billion by 2036, roughly 2.24 times its 2026 value of USD 95.93 billion, driven by neurostimulation adoption and non-opioid pharmacology.

What is the CAGR for the Chronic Pain Market 2026 to 2036?

The base case CAGR is 8.4%, with a bull case of 9.6% if non-opioid drug adoption accelerates into additional pain indications sooner, and a bear case of 7.2% under tighter payer reimbursement.

Which segment is growing fastest?

Neurostimulation Devices lead at a 12.6% CAGR, roughly 1.5 times the overall market rate, as payers chase durable, non-addictive relief beyond standard pharmaceutical regimens and their dependency risk.

Who are the major companies in the Chronic Pain Market?

Medtronic, Abbott, Boston Scientific, Nevro, and Vertex Pharmaceuticals lead the market, together holding roughly 44% of chronic pain product revenue generated worldwide each year, per company filings.

Which country is growing fastest?

China leads at a 10.2% CAGR as expanding chronic pain diagnosis rates and modernising hospital infrastructure pull neurostimulation adoption higher across major provincial healthcare systems nationwide.

Report Segmentation Architecture

The full report scope spans multiple orthogonal segmentation dimensions, with cross-tabulated demand data provided for each dimension pair. Coverage extends further to regional breakdowns, trend trajectories, and the competitive detail needed to support segment-level decision-making.

By Treatment Modality

  • Pharmaceutical Therapeutics
  • Neurostimulation Devices
  • Radiofrequency Ablation and Interventional Devices
  • Regenerative and Biologic Therapies
  • Physical Rehabilitation and Digital Therapeutics Services

By End-Use Setting

  • Hospital and Health System Pain Clinics
  • Ambulatory Surgical Centres
  • Specialty Pain Management Practices
  • Home and Remote Patient Monitoring

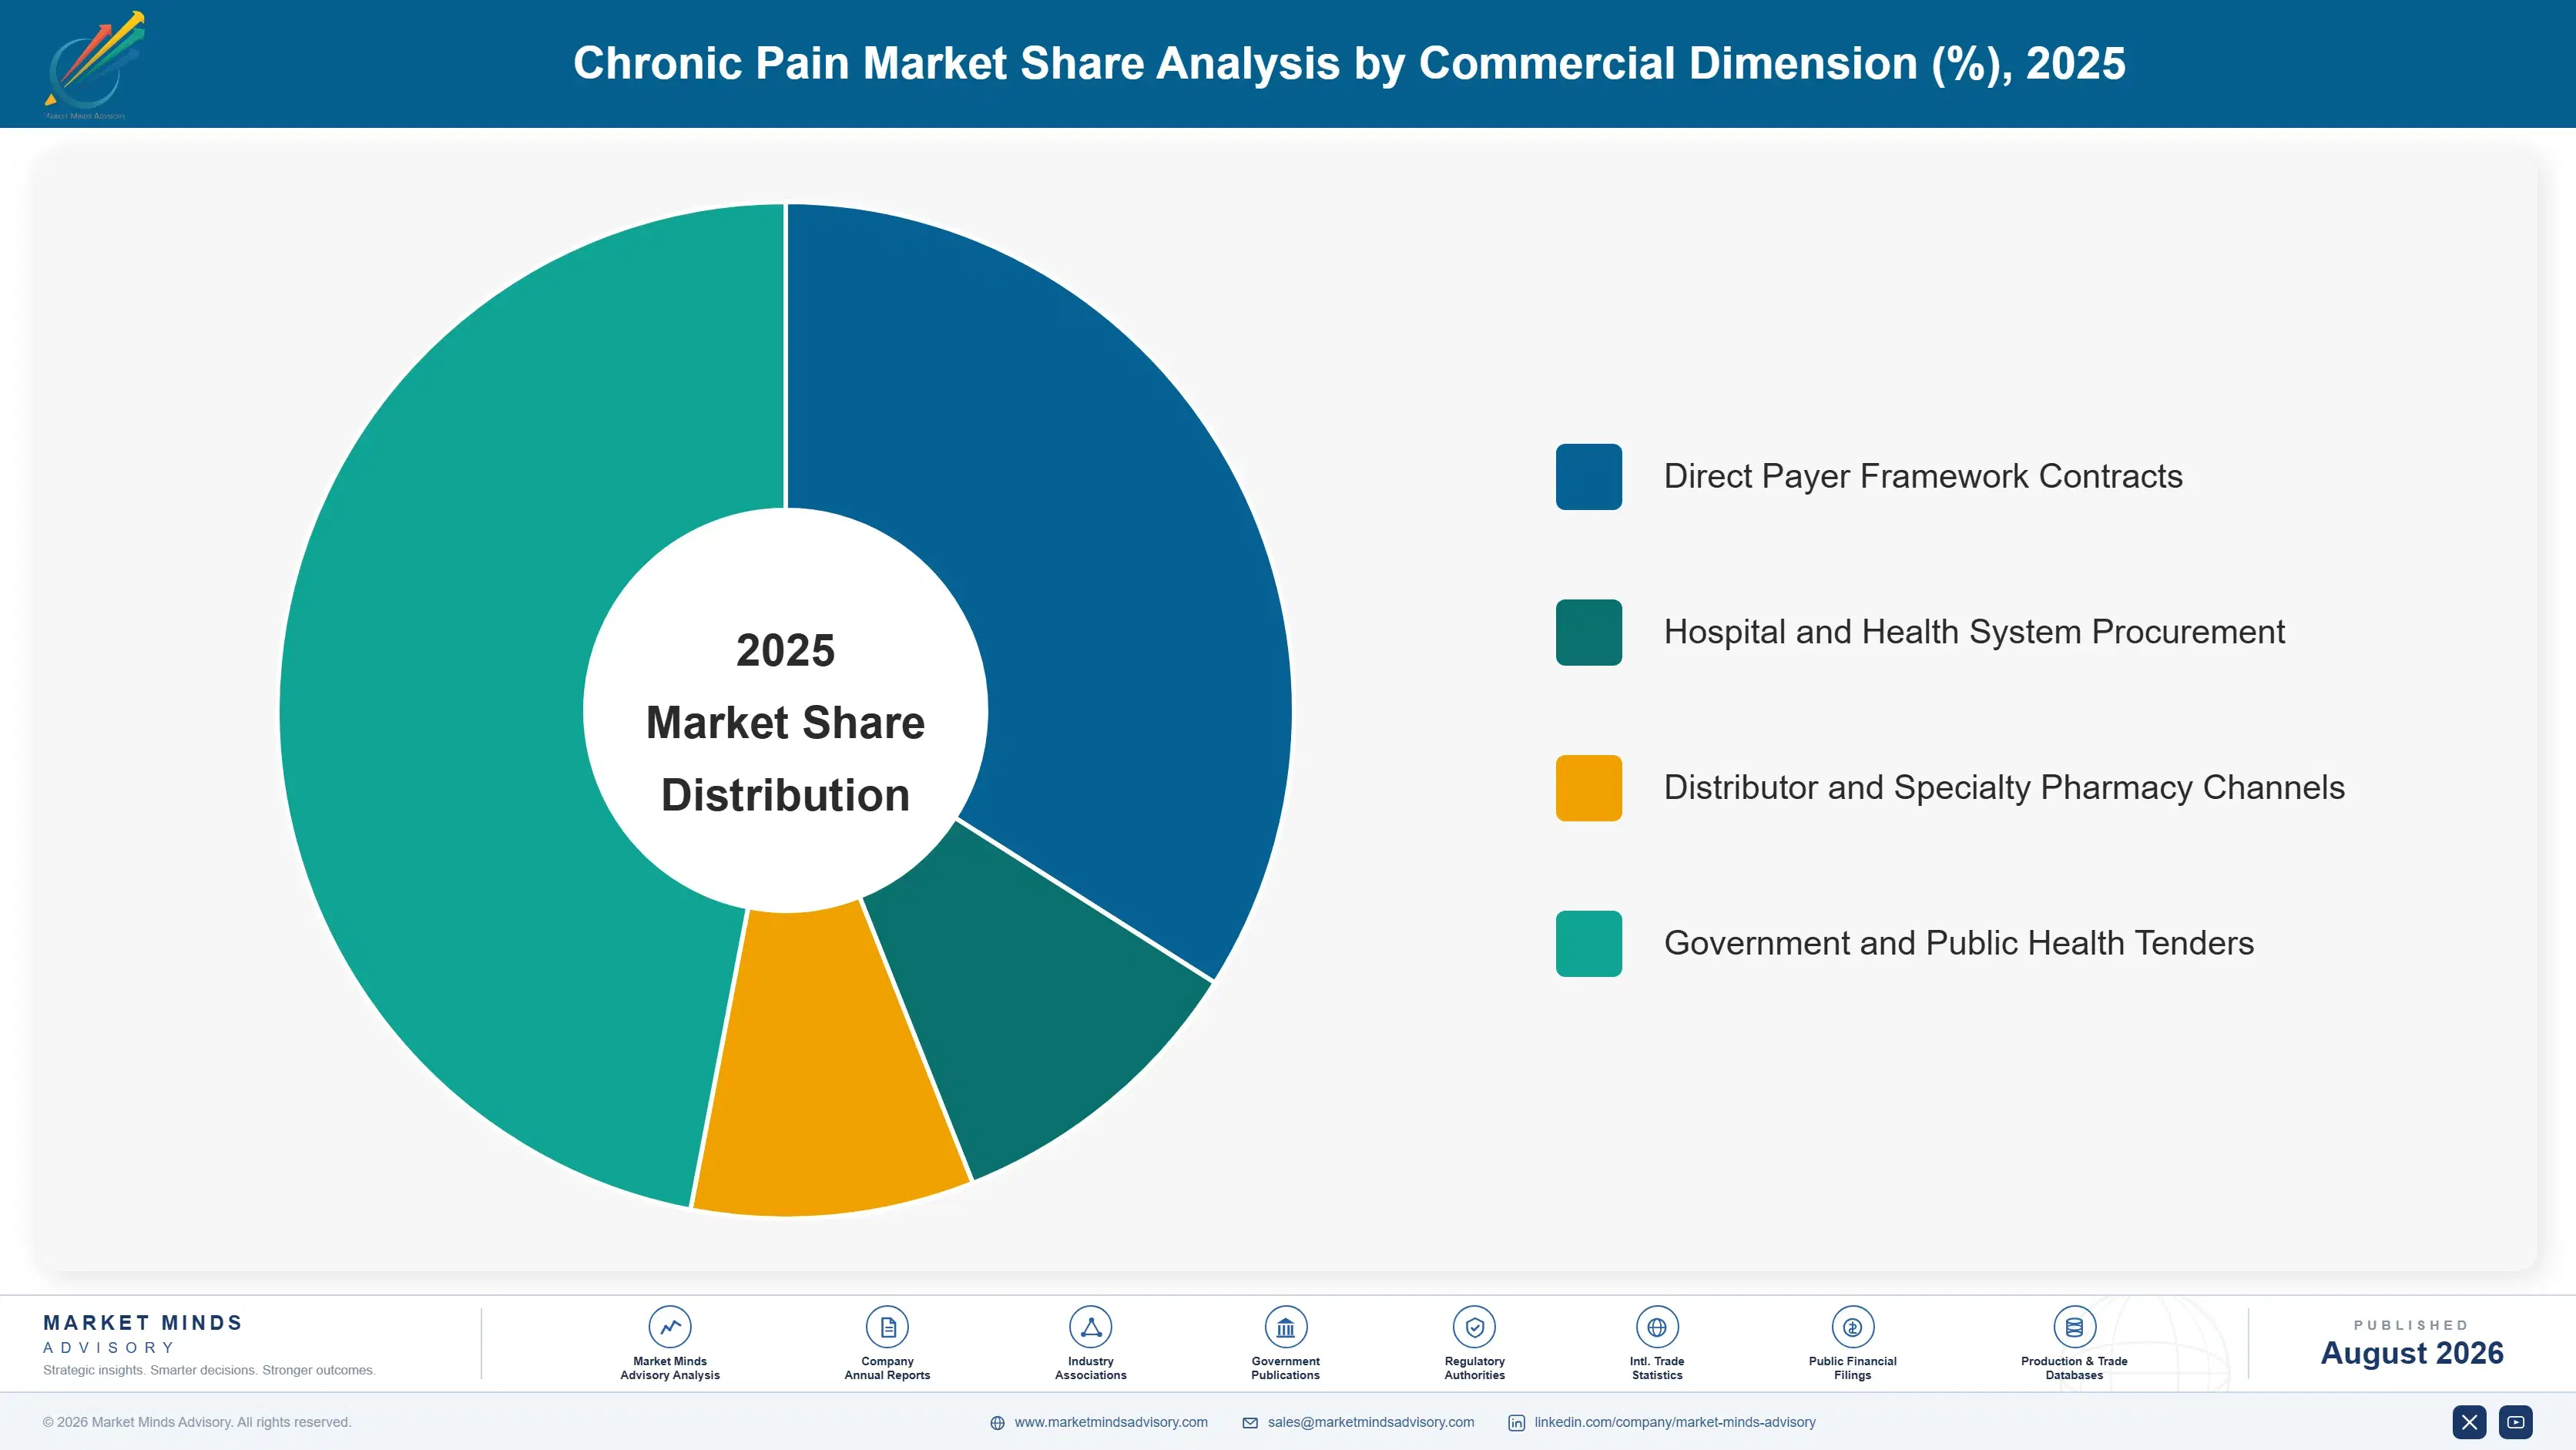
By Commercial Dimension

  • Direct Payer Framework Contracts
  • Hospital and Health System Procurement
  • Distributor and Specialty Pharmacy Channels
  • Government and Public Health Tenders

By Region

  • North America
  • Western Europe
  • East Asia
  • South Asia and Pacific
  • Latin America
  • Middle East and Africa
  • Eastern Europe

Scope, Methodology, and Coverage

Every figure in this report is reproducible from documented input assumptions. The scope below maps the historical period, the forecast horizon, the segmentation dimensions, and the countries covered, alongside the underlying primary and qualitative methodology.
Historical Period
2020 to 2025
Forecast Period
2026 to 2036
Base Year
2025 (USD billions; MMA Primary Research Dataset, August 2026)
Market Definition
The chronic pain market covers pharmaceutical therapeutics, neurostimulation devices, radiofrequency ablation and interventional devices, regenerative and biologic therapies, and physical rehabilitation and digital therapeutics services used to manage chronic pain conditions. It excludes acute post-surgical pain management confined to hospital settings and general anaesthesia products.
Quantitative Units
USD billions (current prices); treated patient volume where applicable
Segmentation Dimensions
By Treatment Modality; By End-Use Setting; By Commercial Dimension; By Region
Regions Covered
North America, Western Europe, East Asia, South Asia and Pacific, Latin America, Middle East and Africa, Eastern Europe
Countries Covered
USA, China, Germany, France, UK, Japan, South Korea, India, Australia, Canada, Brazil, Mexico, Switzerland, Netherlands, UAE, Saudi Arabia, South Africa, Nigeria, Turkey, Poland, Italy, Spain, Sweden, Israel, Singapore, and additional markets relevant to this sector
Key Companies Profiled
Medtronic plc, Abbott Laboratories, Boston Scientific Corporation, Nevro Corp., Vertex Pharmaceuticals Incorporated, Saluda Medical Pty Ltd, Nalu Medical, Inc., Avanos Medical, Inc., Baxter International Inc., Teva Pharmaceutical Industries Ltd., Collegium Pharmaceutical, Inc., Pacira BioSciences, Inc., Grunenthal GmbH, Hisamitsu Pharmaceutical Co., Inc., Mundipharma International Limited, Eli Lilly and Company, Pfizer Inc., Johnson and Johnson, Cala Health, Inc., Stryker Corporation
Quantitative Methodology
Primary survey, n=3,800 respondents, Q4 2025, six countries; demand-side model with trade association cross-validation
Qualitative Methodology
47 expert interviews, Q4 2025; applied to validate demand model assumptions, identify emerging dynamics, and assess competitive positioning
Report Format
PDF and XLSX data workbook (Word format preview document)
Publisher
Market Minds Advisory
Report Code
MMA-2026-HLT-158
Published
August 2026
Contact
sales@marketmindsadvisory.com | www.marketmindsadvisory.com

Purchase the full Chronic Pain Market Report (2026 to 2036).

The full report delivers granular sizing and forecasts across all five treatment modality segments and seven global regions through 2036. It profiles twenty companies across large diversified device manufacturers and specialty pharmaceutical companies, benchmarking clinical evidence depth, manufacturing scalability, and distribution reach in considerable detail. Analysts detail clinical trial and device component cost exposure, portfolio margin tiers, and demand architecture by end-use vertical across major global markets and their evolving procurement environments. Buyers receive both the standalone report and full access to underlying data tables supporting every figure and forecast presented throughout.
Five-segment treatment modality sizing and full forecasts
Seven-region global market share breakdown detail
Twenty-company detailed competitive profile benchmarking analysis
Clinical trial and component cost exposure mitigation analysis
Portfolio margin tier benchmarking economics framework
Anonymised client engagement outcome case study

Built For The People Who Decide

From boardroom strategy to bench-side execution, this report is read cover-to-cover by leaders shaping the next decade of their industry, turning demand scenarios, market dynamics and valuation benchmarks into decisions.
CXOs/ Presidents/ VPs/ Managers
M&A and Corporate Development
Strategy Teams and R&D Heads
Procurement and Product Directors
Regulatory and Compliance Leaders
Investor Relations and Equity Analysts