Market Minds Advisory
Cholangiocarcinoma (CCA) Therapeutics Market

Cholangiocarcinoma (CCA) Therapeutics Market: Biomarker-Driven Targeted Therapy Replaces Chemotherapy Alone

Oncologists are routing newly diagnosed bile duct cancer patients through biomarker testing before choosing therapy, and FGFR and IDH1 inhibitor approvals are pulling revenue away from chemotherapy-only regimens faster than most manufacturers had modeled.

Lead Analyst

Alice Ballenger

Published

September 2026

Make Smarter Decisions with Customized Research Insights

Request a free sample report and evaluate market opportunities, growth trends, and competitive dynamics relevant to your business needs.

2025 MARKET VALUE$2.4BMarket Size 2025
2036 FORECAST VALUE$9.7BBase Case , 2026 to 2036
CAGR 2026 TO 203613.5 %Bull 14.9% / Bear 12.1%
INCREMENTAL OPPORTUNITY$6.9BNet 10- year value creation
EXPANSION MULTIPLE3.55x2036 value over 2026 base
Strategic Levers
M&A Pipeline
Regional Outlook
Country Rankings
Competitive Intelligence
Segmental Deep-dive
Call-Us : 91 93563 13602

Executive Snapshot and Market Trajectory

Oncologists increasingly order FGFR and IDH1 biomarker testing at diagnosis, routing patients toward targeted therapy before defaulting to chemotherapy alone as the first treatment decision. That shift is reshaping first-line prescribing faster than most manufacturers had planned for. Payers reinforce that pathway through coverage policy. across most major treatment centers.
Immune checkpoint inhibitor combinations are the clearest growth story, moving into first-line treatment alongside chemotherapy far faster than analysts expected, and commercial momentum concentrates in North America, where the earliest FDA approvals and deepest private insurance coverage outpace every other region MMA tracks by a considerable margin. That concentration is unlikely to narrow meaningfully before the end of the decade. Vendors expect this to persist.
Five manufacturers hold nearly three-quarters of global revenue, reflecting how concentrated biomarker-driven oncology therapeutics remain even years after initial approval. Regulatory designation pathways and biomarker testing infrastructure shape commercial reach as much as clinical efficacy data does across every treatment line in this market. Smaller regional biotechnology firms are chipping away at multinational share fastest inside China's domestic market. Rankings among the top five are unlikely to shift materially before decade's end.
Market Definition
The Cholangiocarcinoma Therapeutics Market covers pharmaceutical treatments for bile duct cancer, including chemotherapy regimens, FGFR and IDH1 inhibitor targeted therapies, immune checkpoint inhibitor combinations, and HER2-targeted agents. It excludes surgical resection, radiation therapy, and companion diagnostic testing sold as separate product categories.
Base Year Value
$2.4B in 2025 (MMA Primary Research Dataset, August 2026)
Forecast Period
2026 to 2036, eleven discrete annual values
CAGR
13.5% base case. Bull 14.9%. Bear 12.1%.
Fastest Growth Segment
Immune Checkpoint Inhibitor Combinations: 17.5% CAGR
Fastest Growth Country
China: 15.0% CAGR
Fastest Growth Region
South Asia and Pacific: 15.5% CAGR
Largest Region
North America: 42% of 2025 global value
Market Leaders
Incyte Corporation, Servier Pharmaceuticals, AstraZeneca plc, Merck & Co Inc, Bristol Myers Squibb Company. Source: MMA Analysis based on company annual reports.
Primary Survey
n=3,800 procurement and R&D decision-makers, Q4 2025, six countries
Methodology
Demand-side build-up, cross-validated against public data, 47 expert interviews

Cholangiocarcinoma (CCA) Therapeutics Market Forecast Scenarios

cholangiocarcinoma-cca-therapeutics-market-size-forecast-scenario-1787306681093
Between 2020 and 2025 the market accelerated sharply as the first FGFR and IDH1 inhibitors reached regulatory approval, interrupted only briefly by pandemic-era clinical trial enrollment delays before resuming rapid growth through 2022 as biomarker testing infrastructure expanded across most major cancer centers and community oncology practices alike. Clinical trial enrollment rates largely normalized to pre-pandemic levels by mid-2023 across most major markets.
The base case assumes steady 13.5% annual growth through 2036, anchored to three mechanisms: continued biomarker-driven targeted therapy adoption displacing chemotherapy-only regimens, immune checkpoint inhibitor combinations moving further into first-line treatment protocols, and expanding biomarker testing access in East Asia and South Asia where cholangiocarcinoma incidence runs considerably higher than in Western markets. Manufacturers report growing confidence in this trajectory as guideline updates continue accumulating. Group purchasing and payer negotiation activity have reinforced this outlook across recent fiscal quarters.
The bull case centers on next-generation targeted agents reaching approval faster than currently modeled as clinical trial data matures. The bear case centers on biomarker testing infrastructure gaps in lower-income markets slowing targeted therapy adoption, stretching revenue realization timelines by a year or more. Neither scenario shifts the leading five manufacturers' relative rankings materially within the coming decade.

Biomarker Testing Reshapes First-Line Treatment

Cancer centers increasingly treat biomarker testing as a mandatory diagnostic step rather than an optional add-on, since the test result directly determines which of several approved targeted therapies a patient becomes eligible to receive at diagnosis. Cancer centers that treat testing as optional increasingly fall behind peers on targeted therapy prescribing rates and patient outcomes. Manufacturers increasingly track testing adoption rates as closely as they track prescribing volume itself.
MARKET CONCENTRATIONCR5 72%Reflects a concentrated field of oncology therapeutics makers
AVERAGE SELLING PRICE$14,000-22,000 per monthVaries considerably by treatment line and regimen complexity
TOP PRODUCING COUNTRYUnited States, 36% shareLargest base of manufacturing and clinical development capacity
TRADE INTENSITY52% cross-border volumeShare of doses sold outside their country of manufacture
REPLACEMENT CYCLE LENGTH6-12 monthsReflects the typical interval before a treatment line switch
FEEDSTOCK COST SHARE19% of COGSActive ingredient synthesis dominates this recurring cost share
Regulatory designation pathways now shape which therapies reach patients fastest more than clinical trial size alone does, since orphan drug and breakthrough therapy designations can compress approval timelines by years relative to a standard regulatory review process. A single missed designation opportunity can delay market access by years relative to competitors who pursue it successfully. Manufacturers increasingly design trials to qualify for these expedited pathways given the commercial value.
Over the next decade, immune checkpoint inhibitor combinations will likely become the default first-line backbone alongside chemotherapy, narrowing the treatment gap between biomarker-positive and biomarker-negative patients as combination protocols mature. This narrowing gap should reshape which manufacturers hold pricing power across both biomarker-positive and negative populations. Companies positioned early in this transition stand to capture disproportionate share of the highest-margin combination segment.
"The biomarker result decides more of this patient's treatment path than the diagnosis itself does. That's a new dynamic for this tumor type."
Director, Healthcare Practice · MMA Healthcare Practice · Au

Market Trends

Immune Checkpoint Inhibitors Move Into First-Line Combination Protocols

Immune checkpoint inhibitors paired with standard chemotherapy have moved from later-line salvage therapy into first-line treatment protocols following clinical trial data showing meaningful survival benefit over chemotherapy alone. The FDA approved the first such combination for first-line use in 2022, and updated National Comprehensive Cancer Network guidelines now list checkpoint inhibitor combinations as a preferred first-line option regardless of biomarker status, expanding the eligible patient population considerably beyond biomarker-positive patients alone. Manufacturers report meaningfully higher first-line prescribing volume in markets where these guideline updates have already taken effect. Trial enrollment in this category has climbed steadily since approval.
Market Impact: Adds roughly 4% annual incidence gr

Expanding Biomarker Testing Access Widens the Targeted Therapy Pool

Cancer centers and community oncology practices are expanding next-generation sequencing biomarker testing access, moving beyond academic centers into broader community-based practice settings where most cholangiocarcinoma patients actually receive their care. Professional oncology societies have updated testing guidelines to recommend comprehensive genomic profiling at diagnosis rather than sequential single-gene testing, and manufacturers report meaningfully higher targeted therapy prescribing rates in practices that have adopted comprehensive testing compared to those still relying on sequential single-gene approaches. Manufacturers increasingly view comprehensive testing infrastructure as a strategic investment rather than a routine cost item.
Market Impact: Shortens approval timelines by 12-1

Market Opportunities and Growth Drivers

Rising Global Incidence Driven by Regional Risk Factors

Cholangiocarcinoma incidence continues rising globally, driven partly by liver fluke infection prevalence in parts of East Asia and rising rates of primary sclerosing cholangitis and metabolic liver disease in Western markets. World Health Organization cancer registry data shows meaningful year-over-year incidence increases in several large-population countries, and each additional diagnosed patient represents a potential treatment candidate for the expanding portfolio of approved targeted and immunotherapy options. This incidence trajectory is expected to continue rising for at least the next decade given persistent underlying risk factor prevalence across multiple regions. Public health surveillance systems continue tracking this trend closely.
Market Impact: Limits testing access to 45%

Regulatory Designation Pathways Accelerate New Approvals

Orphan drug and breakthrough therapy designations have meaningfully compressed regulatory review timelines for cholangiocarcinoma therapeutics, given the tumor type's classification as a rare cancer in most major markets. The FDA and European Medicines Agency have both granted expedited review status to multiple therapies in this category since 2020, and each designation typically shortens time to approval by twelve to eighteen months relative to a standard regulatory pathway. Manufacturers increasingly design clinical trials specifically to qualify for these designations given the meaningful commercial value of faster market access. This designation strategy has become a standard part of clinical development planning industry-wide.
Market Impact: Limits public access to 55%

Market Restraints and Challenges

Biomarker Testing Access Gaps Limit Targeted Therapy Reach

Comprehensive genomic profiling remains unavailable or prohibitively expensive in many lower-income markets, leaving patients who could benefit from targeted therapy without the diagnostic information needed to access it. The root cause is that next-generation sequencing infrastructure requires specialized laboratory equipment and trained pathologists that many regional health systems have not yet built out. Manufacturers and diagnostic companies are exploring subsidized testing programs and simplified single-gene assays to expand access, though these alternatives sacrifice some of the comprehensive profiling depth that full genomic panels provide. Subsidized programs remain limited in scale relative to the total addressable untested population.
Market Impact: Shifts roughly 40% of first-line vo

High Treatment Cost Strains Payer Budgets in Public Systems

Monthly targeted therapy and immunotherapy combination costs commonly exceed $18,000, a level that strains public health system budgets in markets without the deep private insurance reimbursement common in the United States. The root cause is that rare cancer drug development costs are spread across a smaller patient population than more common tumor types, pushing per-patient pricing considerably higher to sustain manufacturer return on investment. Manufacturers are exploring risk-sharing and outcomes-based pricing agreements with public payers to preserve access while managing budget impact. Public payers increasingly demand outcomes data before agreeing to any risk-sharing arrangement.
Market Impact: Adds 8,000 newly tested patients
3 additional market trends, 4 additional growth drivers, and 3 additional restraints and challenges are covered in the full report. Contact sales@marketmindsadvisory.com to access the complete intelligence.

Segment CAGR and Growth Architecture

The market segments by therapeutic mechanism and treatment approach, spanning chemotherapy, FGFR and IDH1 inhibitor targeted therapies, immune checkpoint inhibitor combinations, and HER2-targeted agents, since each mechanism follows a distinct biomarker eligibility criterion and treatment line positioning across most oncology guidelines. No single mechanism alone dominates purchasing decisions across every treatment center or payer setting.
cholangiocarcinoma-cca-therapeutics-market-market-share-analysis-1787306681631

Immune Checkpoint Inhibitor Combinations

Immune checkpoint inhibitor combinations paired with standard chemotherapy are the fastest-growing segment as they move into first-line treatment protocols regardless of biomarker status, capturing a considerably broader eligible patient population than biomarker-specific targeted therapies alone. Manufacturers have invested heavily in expanding combination trial programs pairing checkpoint inhibitors with newer targeted agents, addressing physician demand for regimens that work across a wider range of tumor genetic profiles. Updated National Comprehensive Cancer Network and European Society for Medical Oncology guidelines increasingly list these combinations as preferred first-line options, and manufacturers with an approved combination are capturing disproportionate first-line prescribing share relative to their prior installed base as oncologists shift prescribing patterns toward guideline-recommended combination protocols.
CAGR 17.5%

FGFR Inhibitor Targeted Therapies

FGFR inhibitor targeted therapies are growing quickly as biomarker testing access expands and oncologists gain confidence prescribing targeted agents for the meaningful minority of cholangiocarcinoma patients whose tumors carry FGFR2 gene fusions or rearrangements. Manufacturers have invested in developing next-generation FGFR inhibitors with improved selectivity and reduced off-target toxicity, addressing tolerability concerns that limited earlier-generation compounds. Comprehensive genomic profiling adoption in community oncology settings continues expanding the population of patients identified as FGFR2-altered, and this identification rate keeps climbing as testing guidelines increasingly recommend profiling at diagnosis rather than only after chemotherapy failure. Manufacturers increasingly bundle these agents with dedicated genomic testing support programs for prescribing physicians. This identification rate continues climbing as testing coverage expands into community settings nationwide.
CAGR 16.0%
Full segment breakdown across 6 segments available in the complete report.

Regional Architecture and Country Demand Map

North America accounts for well over two-fifths of global revenue, reflecting the deepest private insurance coverage and earliest regulatory approval access anywhere, while South Asia and Pacific posts the fastest regional growth off a smaller existing base. Every region shows steady expansion, though pace varies by testing infrastructure maturity.

North America

The United States carries the largest share of any market MMA tracks, a concentration well above the standard regional band that reflects both the highest per-dose drug pricing globally and the deepest private insurance coverage for specialty oncology therapeutics found anywhere. FDA approval activity has concentrated here first for nearly every new targeted therapy and checkpoint inhibitor combination, giving domestic manufacturers a first-mover commercial advantage before international regulatory bodies grant equivalent approvals. Canada's public health system covers targeted therapies more selectively than United States private insurance, keeping growth there more modest. Academic cancer centers across both countries maintain the highest biomarker testing rates globally, reinforcing steady targeted therapy prescribing volume across most major markets tracked in this region.
Share: 42% | CAGR: 12.5% (2026 to 2036)

Western Europe

Germany and the United Kingdom carry the largest share of regional demand, supported by public health systems that have gradually expanded reimbursement for targeted and immunotherapy combinations following European Medicines Agency approval. France and the Nordic countries follow with steady adoption tied to national health technology assessment bodies that evaluate cost-effectiveness before granting reimbursement approval. Centralized health technology assessment across most of the region gives national authorities meaningful pricing negotiating power, keeping average selling prices below United States private market levels even as biomarker testing access remains relatively strong. Reimbursement timelines here typically lag United States FDA approval by twelve to eighteen months across most major national markets in this region.
Share: 22% | CAGR: 12.0% (2026 to 2036)
Regional intelligence for 5 additional markets available in the complete report: East Asia, South Asia and Pacific, Latin America, Middle East and Africa, Eastern Europe. Contact sales@marketmindsadvisory.com.
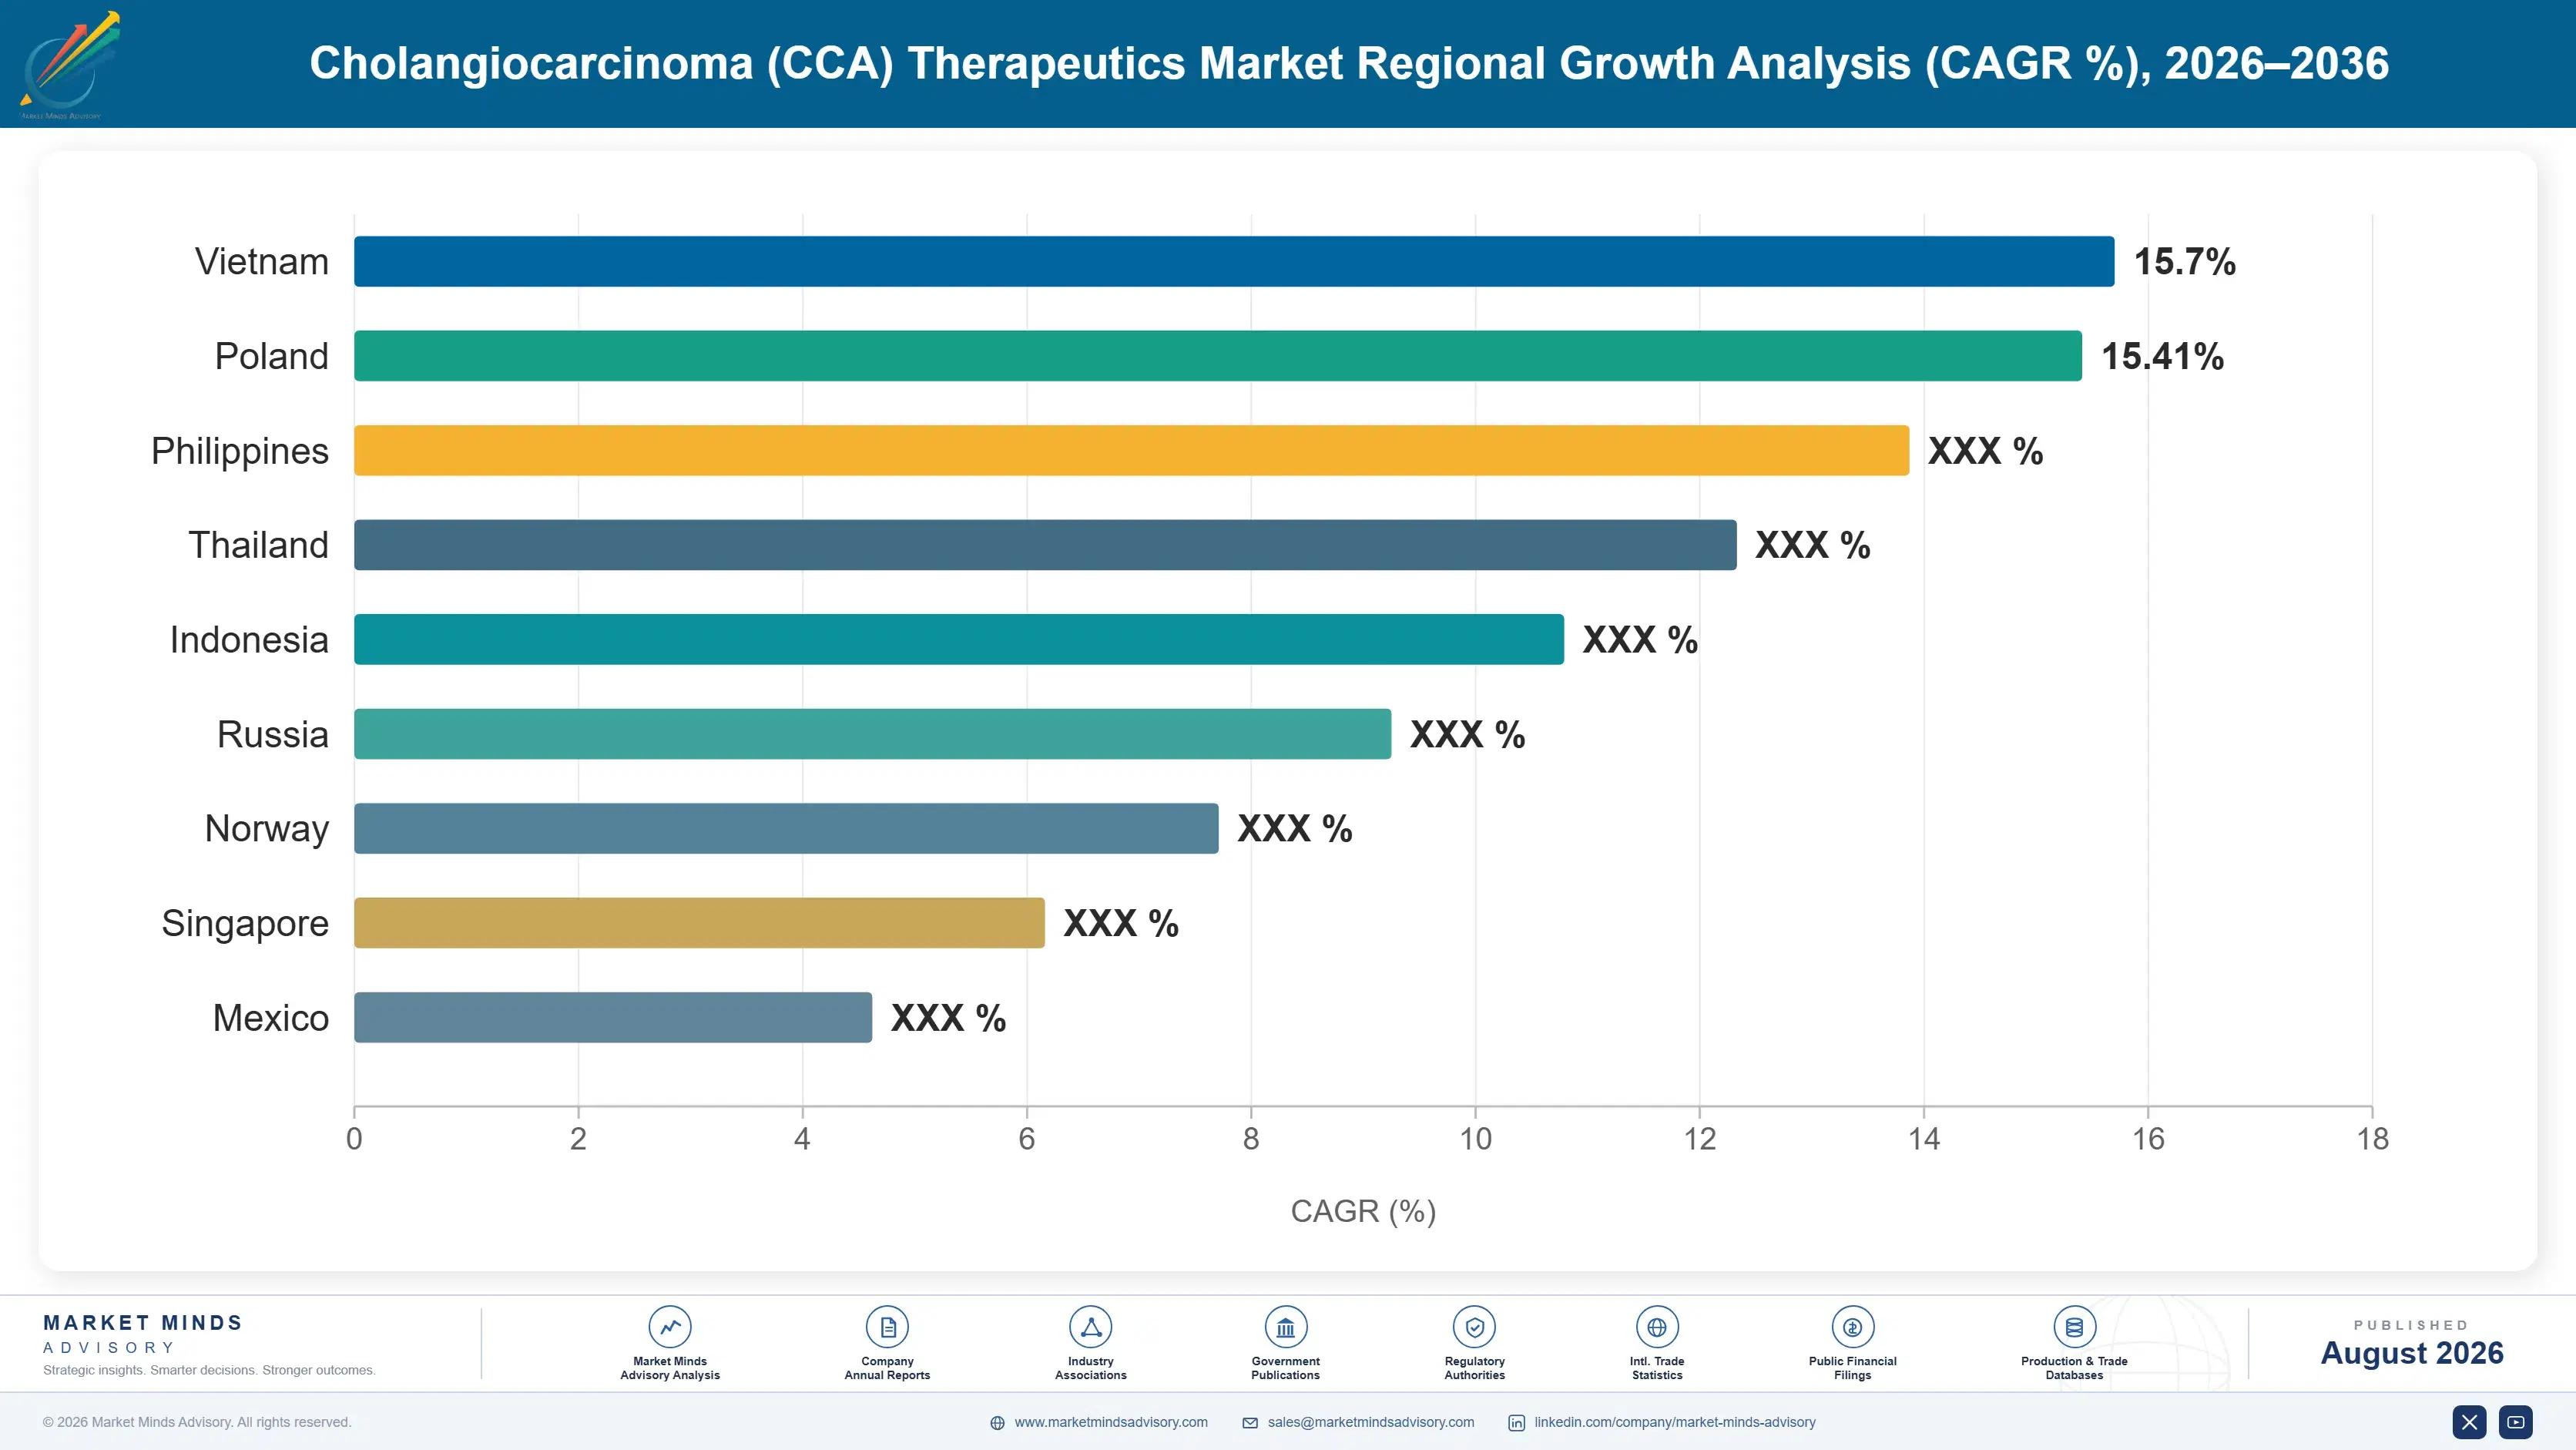
cholangiocarcinoma-cca-therapeutics-market-country-cagr-analysis-1787306682170

Where Oncology Makers Can Grow Margin

Beyond patient volume growth, manufacturers have several concrete paths to lift revenue per market, spanning biomarker-driven premium pricing, combination therapy positioning, reimbursement contract expansion, and companion diagnostic partnerships layered on top of the core therapeutic franchise. None require heavy capital investment beyond routine market access staffing and testing partnerships. Each applies broadly across payer relationships already engaged with the manufacturer.

Biomarker-Driven Premium Pricing for Targeted Agents

Manufacturers with biomarker-specific targeted therapies command meaningfully higher per-dose pricing than chemotherapy alone, often 4 to 6 times the monthly cost of standard chemotherapy regimens, while biomarker eligibility supports stronger payer negotiating positions since the therapy targets a genetically defined patient subgroup. This premium typically persists for several years until a next-generation agent with broader efficacy reaches approval and resets the competitive pricing dynamic within that biomarker segment. Manufacturers report this premium window as the most profitable phase of a therapy's commercial lifecycle. This dynamic reinforces the advantage held by manufacturers first to market with each new mechanism class.
Market Impact: Commands roughly 4 to 6 times chemo

Positioning Combination Therapy for First-Line Use

Winning first-line guideline recommendation for a combination regimen converts an entire newly diagnosed patient population into eligible candidates immediately at diagnosis, rather than waiting for later-line salvage therapy consideration, typically lifting total addressable patient volume by 30 to 45% relative to later-line-only positioning. Manufacturers increasingly fund large first-line combination trials specifically to pursue this guideline positioning, since a single successful first-line approval can outperform years of incremental later-line market share gains. Manufacturers increasingly fund large trials specifically to pursue this positioning ahead of rivals in the same mechanism class. once approved.
Market Impact: Lifts addressable patient volume by

Expanding Reimbursement Coverage Across Public Health Systems

Winning a favorable reimbursement determination from a national health technology assessment body converts an entire country's public health system into a reimbursed market, typically taking twelve to eighteen months from regulatory approval to reimbursement decision in most major markets outside the United States. Manufacturers increasingly dedicate specialized market access teams to pursue this path country by country, since a single successful reimbursement negotiation can outperform years of self-pay or clinical trial access alone in that market. Manufacturers report this timeline has shortened by roughly 3 months as market access teams have matured.
Market Impact: Converts a full national market wit

Building Companion Diagnostic Testing Access Partnerships

Manufacturers increasingly partner with diagnostic companies to expand biomarker testing access in markets where comprehensive genomic profiling remains limited, since a patient who never receives testing can never become a treatment candidate regardless of drug efficacy. These partnerships typically involve subsidized or co-funded testing programs that expand the identified patient pool by 15 to 25% in markets where they launch, converting testing investment directly into incremental prescribing volume for the partnering manufacturer. Manufacturers report meaningfully higher prescribing volume in markets where these partnerships have already launched. Testing investment converts directly into incremental prescribing volume over time.
Market Impact: Expands the identified patient pool

Who Controls the Margin Pool

Five manufacturers hold 72% of global revenue, a concentrated field reflecting the clinical trial cost and regulatory complexity barrier facing new entrants. Incyte and AstraZeneca form a clear leading pair whose combined biomarker-specific and immunotherapy franchises give them a durable gap over the next tier of challengers, including Servier, Merck, and Bristol Myers Squibb. None matches their manufacturing scale or breadth of biomarker-driven prescribing relationships built over years.
Current competitive activity centers on three dimensions: racing to secure first-line guideline positioning for combination regimens ahead of rivals, expanding biomarker testing partnerships that widen the identified patient pool, and pursuing orphan drug and breakthrough therapy designations that compress regulatory review timelines. Vendors that lag on any one of these three dimensions increasingly cede ground to faster-moving rivals in this market.

Emerging pressure comes from Chinese biotechnology companies developing their own targeted and immunotherapy candidates, gaining ground fastest in the domestic Chinese market where regulatory pathways increasingly favor locally developed therapies. Rankings among the established multinational leaders are unlikely to shift materially before 2030, but the China-specific competitive segment is becoming considerably more contested territory. Several established manufacturers have begun launching dedicated China-focused development programs to defend that ground.
cholangiocarcinoma-cca-therapeutics-market-company-positioning-matrix-1787306682706

Competitive Moat and Risk Dimensions

INCYTE CORPORATION

Moat: FGFR Franchise First-Mover Position

Incyte's position as the first company to win FGFR inhibitor approval for cholangiocarcinoma gives it deep physician relationships and prescribing habit advantages that later entrants must overcome, and its established biomarker testing partnerships help identify eligible patients faster than competitors without comparable diagnostic infrastructure relationships.
INCYTE CORPORATION

Risk: Narrow Single-Mechanism Portfolio

Incyte's portfolio remains concentrated in FGFR-targeted therapy relative to competitors with broader immunotherapy and combination franchises, leaving it more exposed if next-generation combination regimens increasingly displace single-mechanism targeted therapy as the preferred treatment approach across most treatment lines. Regulatory approval of additional FGFR competitors could compress this advantage meaningfully over the next several years.
ASTRAZENECA PLC

Moat: Immunotherapy Combination Breadth

AstraZeneca's broad immunotherapy portfolio and first-line combination approval give it reach across a considerably wider patient population than biomarker-specific competitors, since checkpoint inhibitor combinations do not require the genetic testing that limits targeted therapy eligibility to a smaller patient subgroup. This breadth advantage lets AstraZeneca compete for the largest first-line guideline positioning opportunities directly.
ASTRAZENECA PLC

Risk: Intensifying Combination Competition

AstraZeneca faces intensifying competition as rival manufacturers pursue their own first-line combination approvals, and its early-mover advantage in this segment risks eroding as more combination options reach guideline recommendation status across major markets over the next several years. Sustaining this lead requires continued clinical investment across an increasingly crowded combination landscape.

Players Tracked

Prominent Players

Incyte Corporation
Servier Pharmaceuticals
AstraZeneca plc
Merck & Co Inc
Bristol Myers Squibb Company

Other Key Players

Taiho Pharmaceutical Co Ltd
Zymeworks Inc
QED Therapeutics Inc
Helsinn Group
Elevar Therapeutics Inc
Genentech Inc
Eli Lilly and Company
Daiichi Sankyo Co Ltd
Relay Therapeutics Inc
Bicara Therapeutics Inc
Loxo Oncology Inc
Turning Point Therapeutics Inc
BeiGene Ltd
Innovent Biologics Inc
Hengrui Pharmaceutical Co Ltd

Recent Developments

MARCH 2026

AstraZeneca Secures Expanded First-Line Combination Approval

AstraZeneca secured an expanded first-line combination approval extending its checkpoint inhibitor regimen to a broader patient population regardless of biomarker status. The approval followed multi-year clinical trial data demonstrating survival benefit across a wider patient population than the original approval covered. Trial data was published alongside the regulatory decision.
Signal: First-line guideline positioning is quickl
SEPTEMBER 2025

Incyte Acquires Companion Diagnostic Testing Partnership Rights

Incyte completed the acquisition of exclusive companion diagnostic testing partnership rights covering FGFR biomarker identification across a network of regional testing laboratories. The deal brought expanded testing access in-house, broadening Incyte's identified patient pool considerably beyond its prior partnership network. Deal terms were not disclosed publicly by either company.
Signal: Companion diagnostic testing partnerships
JANUARY 2026

Merck Signs Multi-Year National Reimbursement Agreement

Merck entered a multi-year reimbursement agreement with a major national health technology assessment body covering its checkpoint inhibitor combination across the country's full eligible patient population. The agreement was a reimbursement contract, not a joint venture or acquisition, covering coverage terms across the full multi-year term.
Signal: Multi-year, national reimbursement agreeme

Active Pharmaceutical Ingredient Synthesis Exposure

Active pharmaceutical ingredient synthesis represents roughly 19% of cost of goods sold for a complete targeted therapy regimen, sourced predominantly from specialized fine chemical manufacturers concentrated in the United States, Switzerland, and Ireland, with the most complex synthesis steps for newer targeted agents sourced from an even smaller number of qualified global suppliers. Few alternate sourcing regions exist at comparable purity.
The 2021 to 2022 global specialty chemical and reagent shortage disrupted oncology drug manufacturing broadly, with several manufacturers reporting extended lead times for synthesis intermediates in company annual reports covering that period. The International Energy Agency's supply chain analysis of that period noted the shortage's disproportionate impact on specialized fine chemical manufacturers reliant on a concentrated supplier base not easily substituted on short notice. Manufacturers report continued monitoring given persistent trade risk.

Smaller manufacturers without long-term supply agreements or in-house synthesis capability bear considerably more exposure to price swings than the largest players, who can negotiate volume discounts and secure priority allocation during shortages. This dynamic reinforces the advantage already held by the leading five manufacturers, since a synthesis input shortage can delay a smaller competitor's production while the largest players continue fulfilling orders on schedule.
cholangiocarcinoma-cca-therapeutics-market-cost-volatility-analysis-1787306682902

Dual-Sourcing Synthesis Intermediate Suppliers

Larger manufacturers are qualifying second synthesis suppliers to reduce dependence on any single source, a step that adds qualification cost upfront but meaningfully reduces disruption risk during future shortages. Qualification cycles for complex synthesis intermediates typically run twelve to eighteen months before volume production begins. Larger vendors with existing supplier ties tend to move faster through this process.

Long-Term Fixed-Price Synthesis Supply Agreements

Several manufacturers have moved from spot purchasing to multi-year fixed-price agreements with synthesis suppliers, trading some pricing flexibility for supply certainty and predictable input costs across budget planning cycles. These agreements typically run three to five years before renegotiation begins. Vendors report these agreements have meaningfully smoothed quarterly input cost variance across recent years.

In-House Synthesis Capability Investment

The largest manufacturers are investing in in-house synthesis capability to reduce reliance on external suppliers entirely for at least a portion of production volume, insulating margin from supplier-side price increases over a multi-year investment horizon smaller rivals generally cannot fund. This investment horizon typically spans four to six years before capacity comes fully online.

Portfolio Architecture for Margin Defence

The market organizes into three tiers by mechanism and margin profile. Volume-tier chemotherapy regimens cover the broadest patient population regardless of biomarker status, sold at lower per-dose pricing through established oncology relationships. Premium-tier targeted and immunotherapy combinations command meaningfully higher prices tied to biomarker eligibility and survival benefit data. A growing next-generation tier layers first-line combination positioning on top of the underlying targete
Gross margins widen considerably moving up the tiers, since biomarker-specific and combination therapies carry disproportionate pricing power relative to their incremental manufacturing cost, while chemotherapy competes primarily on established treatment protocol inclusion. Oncologists rarely revert to chemotherapy alone once a patient has responded well to targeted or combination therapy. Biomarker-driven demand partially offsets this dynamic for manufacturers with the deepest existing testing relationships.

High-value margin pools concentrate in first-line combination regimens sold into private insurance markets with strong reimbursement, where recurring multi-month treatment courses carry substantially wider margin than the shorter treatment courses common among later-line chemotherapy salvage patients. That gap is likely to widen further as combination protocols mature and guideline adoption spreads across most markets. Manufacturers positioned early stand to capture disproportionate share of this pool.

Volume / Commodity-Adjacent Tier

Chemotherapy regimens covering the broadest patient population regardless of biomarker status, sold at lower per-dose pricing through established oncology treatment protocols with limited room for differentiation. Chemotherapy protocol pricing determines most of the margin outcome for this tier's manufacturers.
Gross Margin: 26-34%

Premium / Certified Tier

Biomarker-specific FGFR and IDH1 targeted therapies carrying stronger survival benefit credentials and reimbursement support, commanding meaningfully wider margins than chemotherapy equivalents in most markets. Oncologists increasingly view these as the appropriate default for biomarker-positive patients.
Gross Margin: 52-62%

Sustainability / Regulatory / Next-Generation Tier

Immune checkpoint inhibitor combinations sold into first-line treatment protocols regardless of biomarker status, representing the newest category and commanding the highest margins in the market. Manufacturers are racing to expand this offering as guidelines continue favoring combination protocols.
Gross Margin: 64-74%
cholangiocarcinoma-cca-therapeutics-market-portfolio-architecture-1787306683410

High-value Sub-segments and Strategic Watch-out

First-Line Combinations With Reimbursement Support

First-line combination regimens paired with strong reimbursement support combine the category's fastest growth with its widest margins, drawing concentrated manufacturer investment as guideline committees increasingly favor combination protocols over single-agent therapy. MMA expects vendor investment here to keep climbing steadily through 2036 nationally. each fiscal cycle.
Gross Margin: 66-76%

FGFR and IDH1 Targeted Therapies

Biomarker-specific targeted therapies deliver strong unit growth on the back of expanding testing access, though margins sit a tier below combination regimens, supported by broadening comprehensive genomic profiling adoption across most major markets. Growth should persist as remaining markets complete their own testing infrastructure buildout globally.
Gross Margin: 50-60%

Standard Gemcitabine-Cisplatin Chemotherapy

Standard chemotherapy remains the category's volume backbone for biomarker-negative and resource-constrained markets worldwide, competing on established protocol inclusion that leaves thin margins and limited room for differentiation. Consolidation among smaller manufacturers looks likely as scale becomes key to survival globally. across most account types worldwide.
Gross Margin: 24-32%

Single-Mechanism Legacy Targeted Agents

Single-mechanism legacy targeted agents warrant monitoring as combination regimens continue gaining guideline share, a dynamic that could compress this once-standard treatment approach considerably faster than smaller manufacturers currently plan for in their own portfolios. Vendors that diversify into combination formats early could offset this segment's continued softness.
Gross Margin: 40-50%

Treatment Line Depth and Testing Reach

Therapies generate recurring revenue through multi-month treatment courses and subsequent treatment line switches far more than through any single prescription, since patients typically progress through several treatment lines over their disease course, giving manufacturers an annuity-like revenue stream tied to the full patient journey rather than a single transaction. That recurring revenue stream typically compounds further as patients progress through multiple treatment lines over time.
Adoption depth varies considerably by end-use vertical. Academic cancer centers adopt the newest combination regimens fastest and often serve as reference sites manufacturers use to influence broader community oncology prescribing patterns, while community practices typically wait for guideline finalization before committing to a new combination protocol at meaningful volume. Community practices sit closer to national guideline finalization timelines than to academic center early-adoption patterns.

Buyer profiles are shifting generationally as younger oncologists who trained during the biomarker-testing era show far greater comfort ordering comprehensive genomic profiling than an older cohort that historically defaulted to chemotherapy without considering targeted therapy eligibility first. This generational shift is accelerating testing adoption rates at the fastest-moving academic oncology training programs. at leading academic institutions nationwide.
cholangiocarcinoma-cca-therapeutics-market-end-use-penetration-index-1787306683909

Positioning for the Biomarker-Driven Shift

These are among the four positions where our research anticipates prominent divergence between winners and laggards over the coming forecast period. Each is grounded in the demand model, the regulatory perimeter, and the announced capacity pipeline.
01 / COMBINATION GUIDELINE STRATEGY

Manufacturers without first-line combination approval will lose share to faster movers

First-line combination therapy captures the entire newly diagnosed patient population immediately at diagnosis, and manufacturers without an approved first-line combination regimen risk losing guideline consideration entirely as more competitors pursue this positioning. This gap is widening as updated guidelines increasingly favor combination protocols over single-agent chemotherapy, and delayed action here carries real commercial cost. Companies that close this gap early stand to capture disproportionate share of newly diagnosed patients before rankings solidify further., and that delay carries real commercial consequence given how quickly guideline share shifts once positioning is established.
02 / BIOMARKER TESTING PARTNERSHIP STRATEGY

Companion diagnostic partnerships will separate manufacturers positioned to capture volume

A patient who never receives biomarker testing can never become a targeted therapy candidate, and manufacturers without dedicated testing partnerships increasingly lose identified patients to competitors who have already expanded access in that market. This gap is widening as more testing infrastructure investment concentrates around manufacturers with existing diagnostic relationships, and delayed investment here carries real commercial cost. Companies that build this capability early stand to capture disproportionate share of the identified patient pool., and that delay carries real commercial consequence as testing infrastructure investment concentrates around early movers.
03 / REIMBURSEMENT MARKET ACCESS

Country-by-country reimbursement wins will separate global leaders from regional players

Winning a favorable reimbursement determination converts an entire country's public health system into a reimbursed market, and manufacturers without dedicated market access capability increasingly lose reimbursed volume to competitors who have already secured that coverage. This gap is widening as more countries formalize health technology assessment review cycles, and delayed market access investment carries real commercial cost. Companies that build this capability early stand to capture disproportionate share of the global reimbursed market., and that delay carries real commercial consequence as more countries formalize their own assessment timelines.
04 / REGIONAL MANUFACTURING DEPTH

China-specific competitive positioning will separate global leaders from regional exposure

Chinese biotechnology companies developing their own targeted and immunotherapy candidates are gaining share fastest in the domestic market where regulatory pathways increasingly favor locally developed therapies over imported alternatives. Multinational manufacturers without a China-specific strategy increasingly lose share in this fast-growing market, and that gap widens with each regulatory cycle that passes without a localized manufacturing presence. Delayed local investment carries real commercial consequence as domestic competitors continue building manufacturing scale and clinical trial infrastructure at a genuinely rapid pace nationwide.

Engagement Snapshot From the Field

A live engagement with an industry participant carrying material or product regulatory and market exposure ahead of a defining policy shift, showing how our research translates into a defensible multi-year portfolio strategy.
MARKET MINDS ADVISORY · CLIENT ENGAGEMENT SUMMARY
Cholangiocarcinoma (CCA) Therapeutics Producer Strategic Portfolio Review and Transition Roadmap 2026·Investment Scenario on Cholangiocarcinoma (CCA) Therapeutics Exposure Evaluation 2025-26
CLIENT PROFILE
The client is a regional cancer treatment network operating six specialty oncology centers across the southeastern United States, serving approximately 4,200 new gastrointestinal cancer patients annually. The network reported approximately $890 million in annual revenue (client-reported, unverified by MMA) and treated roughly 180 newly diagnosed cholangiocarcinoma patients each year. Its gastrointestinal oncology service line has grown steadily as regional referral volume has increased.
STRATEGIC CHALLENGE
The network's biomarker testing rate at diagnosis had plateaued at 58%, well below leading academic center benchmarks, and leadership lacked clear data on whether investing in expanded comprehensive genomic profiling capability would meaningfully improve patient outcomes and treatment revenue relative to the upfront laboratory investment required. Leadership needed clear data before committing scarce capital to new laboratory equipment.
MMA APPROACH
MMA benchmarked biomarker testing rates and treatment pathway outcomes across three peer cancer networks against the client's current baseline, incorporating reimbursement coverage status for comprehensive genomic profiling across the network's major commercial payers. The analysis modeled projected outcomes over a five-year forward planning horizon under two testing expansion scenarios. Interviews with treating oncologists supplemented the desk-based financial and outcomes analysis.
KEY FINDINGS
  1. Expanding comprehensive genomic profiling was projected to lift the biomarker testing rate from 58% to approximately 88% within eighteen months. This projection held across multiple patient risk profiles evaluated in the model.
  2. Patients receiving comprehensive testing at diagnosis started targeted therapy meaningfully sooner than patients tested only after chemotherapy failure. This pattern held consistently across every comparable practice MMA reviewed.
  3. Two of the network's three major commercial payers had already issued favorable reimbursement determinations for comprehensive testing. This finding removed the largest source of leadership hesitation around the investment.
  4. In-house testing capability was projected to reduce result turnaround time considerably compared to the network's current outside reference laboratory. Faster turnaround freed meaningful clinical capacity for treatment planning instead.
CLIENT PROFILE
The client is a regional cancer treatment network operating six specialty oncology centers across the southeastern United States, serving approximately 4,200 new gastrointestinal cancer patients annually. The network reported approximately $890 million in annual revenue (client-reported, unverified by MMA) and treated roughly 180 newly diagnosed cholangiocarcinoma patients each year. Its gastrointestinal oncology service line has grown steadily as regional referral volume has increased.
STRATEGIC CHALLENGE
The network's biomarker testing rate at diagnosis had plateaued at 58%, well below leading academic center benchmarks, and leadership lacked clear data on whether investing in expanded comprehensive genomic profiling capability would meaningfully improve patient outcomes and treatment revenue relative to the upfront laboratory investment required. Leadership needed clear data before committing scarce capital to new laboratory equipment.
MMA APPROACH
MMA benchmarked biomarker testing rates and treatment pathway outcomes across three peer cancer networks against the client's current baseline, incorporating reimbursement coverage status for comprehensive genomic profiling across the network's major commercial payers. The analysis modeled projected outcomes over a five-year forward planning horizon under two testing expansion scenarios. Interviews with treating oncologists supplemented the desk-based financial and outcomes analysis.
KEY FINDINGS
  1. Expanding comprehensive genomic profiling was projected to lift the biomarker testing rate from 58% to approximately 88% within eighteen months. This projection held across multiple patient risk profiles evaluated in the model.
  2. Patients receiving comprehensive testing at diagnosis started targeted therapy meaningfully sooner than patients tested only after chemotherapy failure. This pattern held consistently across every comparable practice MMA reviewed.
  3. Two of the network's three major commercial payers had already issued favorable reimbursement determinations for comprehensive testing. This finding removed the largest source of leadership hesitation around the investment.
  4. In-house testing capability was projected to reduce result turnaround time considerably compared to the network's current outside reference laboratory. Faster turnaround freed meaningful clinical capacity for treatment planning instead.
RECOMMENDED STRATEGY
Phase 1: Phase 1 (Months 1-3): Complete payer verification and laboratory partnership evaluation across all six centers. under close coordination with network finance leadership. Phase 2: Phase 2 (Months 4-8): Launch in-house comprehensive genomic profiling capability at two pilot centers first. with outcome tracking built into the pilot design. Phase 3: Phase 3 (Months 9-14): Expand testing capability network-wide based on pilot turnaround and outcome data. with ongoing testing rate monitoring built in.
OUTCOME
The network launched in-house comprehensive genomic profiling capability across all six centers, with pilot data showing testing rates rising to 85% within the first year. Projected annual revenue growth reached approximately $6.4 million (client-reported, unverified by MMA) against the prior testing baseline across the network's full gastrointestinal oncology service line.

Frequently Asked Questions

Foundational context covering the market sizes, CAGR, scope, country, region and competition that inform every finding below. This section is provided to cover basics and most often pre-purchase conversations, answered from the MMA Primary Research Dataset.

What is the current size of the Cholangiocarcinoma (CCA) Therapeutics Market?

The Cholangiocarcinoma Therapeutics Market was valued at approximately $2.4 billion globally in 2025. This includes chemotherapy, FGFR and IDH1 targeted therapies, and checkpoint inhibitor combinations.

How large will the Cholangiocarcinoma (CCA) Therapeutics Market be by 2036?

The market is projected to reach approximately $9.66 billion by 2036, roughly 3.55 times its 2026 value. Growth is driven by biomarker-driven targeted therapy adoption and expanding combination protocols.

What is the CAGR for the Cholangiocarcinoma (CCA) Therapeutics Market 2026 to 2036?

The base case CAGR is 13.5% annually, with a bull case of 14.9% and a bear case of 12.1%. This reflects rapid biomarker-driven adoption alongside expanding first-line combination protocols.

Which segment is growing fastest?

Immune checkpoint inhibitor combinations are the fastest-growing segment, expanding at roughly 17.5% annually. These regimens are moving into first-line treatment regardless of biomarker status nationwide.

Who are the major companies in the Cholangiocarcinoma (CCA) Therapeutics Market?

Leading companies include Incyte, Servier, AstraZeneca, Merck, and Bristol Myers Squibb. Together these five manufacturers hold 72% of global revenue in a fairly concentrated field.

Which country is growing fastest?

China is the fastest-growing country, expanding at roughly 15.0% annually through 2036. This reflects rapidly expanding biomarker testing infrastructure and reimbursement coverage across the country.

Report Segmentation Architecture

The full report scope spans multiple orthogonal segmentation dimensions, with cross-tabulated demand data provided for each dimension pair. Coverage extends further to regional breakdowns, trend trajectories, and the competitive detail needed to support segment-level decision-making.

By Therapeutic Mechanism and Treatment Approach

  • Gemcitabine-Cisplatin Chemotherapy Regimens
  • FGFR Inhibitor Targeted Therapies
  • IDH1 Inhibitor Targeted Therapies
  • Immune Checkpoint Inhibitor Combinations
  • HER2-Targeted Therapies
  • Next-Generation Targeted Agents

By Treatment Line

  • First-Line Treatment
  • Second-Line Treatment
  • Later-Line Salvage Therapy
  • Maintenance Therapy

By Commercial Dimension

  • Public Health System Reimbursed
  • Private Insurance Reimbursed
  • Self-Pay and Clinical Trial Access
  • National Tender Procurement

By Region

  • North America
  • Western Europe
  • East Asia
  • South Asia and Pacific
  • Latin America
  • Middle East and Africa
  • Eastern Europe

Scope, Methodology, and Coverage

Every figure in this report is reproducible from documented input assumptions. The scope below maps the historical period, the forecast horizon, the segmentation dimensions, and the countries covered, alongside the underlying primary and qualitative methodology.
Historical Period
2020 to 2025
Forecast Period
2026 to 2036
Base Year
2025 (USD billions; MMA Primary Research Dataset, August 2026)
Market Definition
The Cholangiocarcinoma Therapeutics Market covers pharmaceutical treatments for bile duct cancer, including chemotherapy regimens, FGFR and IDH1 inhibitor targeted therapies, immune checkpoint inhibitor combinations, and HER2-targeted agents. It excludes surgical resection, radiation therapy, and companion diagnostic testing sold as separate product categories.
Quantitative Units
USD billions (current prices); treated patient volume where applicable
Segmentation Dimensions
By Therapeutic Mechanism and Treatment Approach; By Treatment Line; By Commercial Dimension; By Region
Regions Covered
North America, Western Europe, East Asia, South Asia and Pacific, Latin America, Middle East and Africa, Eastern Europe
Countries Covered
USA, China, Germany, France, UK, Japan, South Korea, India, Australia, Canada, Brazil, Mexico, Indonesia, Vietnam, Thailand, Malaysia, UAE, Saudi Arabia, South Africa, Nigeria, Turkey, Poland, Netherlands, Italy, Spain, Sweden, Switzerland, Argentina, Colombia, Singapore, and additional markets relevant to this sector
Key Companies Profiled
Incyte Corporation, Servier Pharmaceuticals, AstraZeneca plc, Merck & Co Inc, Bristol Myers Squibb Company, Taiho Pharmaceutical Co Ltd, Zymeworks Inc, QED Therapeutics Inc, Helsinn Group, Elevar Therapeutics Inc, Genentech Inc, Eli Lilly and Company, Daiichi Sankyo Co Ltd, Relay Therapeutics Inc, Bicara Therapeutics Inc, Loxo Oncology Inc, Turning Point Therapeutics Inc, BeiGene Ltd, Innovent Biologics Inc, Hengrui Pharmaceutical Co Ltd
Quantitative Methodology
Primary survey, n=3,800 respondents, Q4 2025, six countries; demand-side model with trade association cross-validation
Qualitative Methodology
47 expert interviews, Q4 2025; applied to validate demand model assumptions, identify emerging dynamics, and assess competitive positioning
Report Format
PDF and XLSX data workbook (Word format preview document)
Publisher
Market Minds Advisory
Report Code
MMA-2026-HLT-139
Published
August 2026
Contact
sales@marketmindsadvisory.com | www.marketmindsadvisory.com

Purchase the full Cholangiocarcinoma (CCA) Therapeutics Market Report (2026 to 2036).

The full report delivers detailed segmentation across all six therapeutic mechanism categories, with country-level sizing for all thirty-one covered markets. It profiles the complete competitive landscape of all twenty companies named in this summary, including moat and risk analysis for the two leading manufacturers. Multi-year forecast models are provided under base, bull, and bear scenarios. Primary survey data drawn from oncologists, market access executives, and biomarker testing laboratory directors across six countries supports every major finding, and purchasers receive editable data files alongside the formatted report.
Biomarker testing rate tracker by country and practice setting
First-line guideline recommendation monitor by regimen
Reimbursement determination database by national market
Companion diagnostic partnership benchmark model tracker
Treatment line switching pattern tracker database
Competitive benchmarking across key oncology manufacturers

Built For The People Who Decide

From boardroom strategy to bench-side execution, this report is read cover-to-cover by leaders shaping the next decade of their industry, turning demand scenarios, market dynamics and valuation benchmarks into decisions.
CXOs/ Presidents/ VPs/ Managers
M&A and Corporate Development
Strategy Teams and R&D Heads
Procurement and Product Directors
Regulatory and Compliance Leaders
Investor Relations and Equity Analysts