Market Minds Advisory
Chlorella Extracts Market

Chlorella Extracts Market: Chlorella Extracts Market: The Cell Wall Is The Whole Problem, Growth Factor Means Nothing In Particular, And A Third Of It Feeds Fish, 2026 to 2036

Only about 12% of products state measured cell wall disruption rather than merely claiming it, no compositional standard exists behind the growth factor term, and 34% of volume goes to feed.

Lead Analyst

Published

September 2026

Make Smarter Decisions with Customized Research Insights

Request a free sample report and evaluate market opportunities, growth trends, and competitive dynamics relevant to your business needs.

2025 MARKET VALUE$0.7BMarket Size 2025
2036 FORECAST VALUE$1.8BBase Case , 2026 to 2036
CAGR 2026 TO 20368.4 %Bull 9.6% / Bear 7.2%
INCREMENTAL OPPORTUNITY$1.0BNet 10- year value creation
EXPANSION MULTIPLE2.25x2036 value over 2026 base
Strategic Levers
M&A Pipeline
Regional Outlook
Country Rankings
Competitive Intelligence
Segmental Deep-dive
Call-Us : 91 93563 13602

Executive Snapshot and Market Trajectory.

Chlorella has a cell wall tough enough that undisrupted material passes through largely unabsorbed. Around 12% of products state a measured disruption figure. The rest print the words broken cell wall on a pack and leave a buyer with nothing to compare. No agreed method exists to measure against.
Protein isolates and hydrolysates grow at 12.6%, half again the market rate of 8.4%, on heterotrophic cultivation that produces consistent composition without the contamination risk open ponds carry. Polysaccharide fractions follow at 10.8%. Whole-cell soluble extracts grow slowest of the six fractions at 5.9%, and carry most of the category's contamination exposure. Chlorophyll and pigment extracts sit at 6.8% and depend entirely on photoautotrophic cultivation, which is the route contamination scrutiny is moving against.
East Asia holds 44% of demand, with Chinese growth of 12.4% leading every market covered. About 34% of category volume goes to aquaculture and animal feed rather than to human nutrition, which almost no consumer-facing material mentions. Roughly 58% of biomass is still grown in open ponds exposed to airborne contamination. Around 9% of retail lots already exceed voluntary cadmium or lead limits, and regulated buyers increasingly decline that material.
Market Definition
This market covers extracts and fractions derived from Chlorella microalgae biomass, including protein isolates and hydrolysates, polysaccharide fractions, lipid and lutein fractions, nucleotide-peptide growth factor extracts, chlorophyll and pigment extracts, and whole-cell soluble extracts. It excludes whole dried chlorella powder and tablets, spirulina and other microalgae, algal omega-3 oils, finished consumer supplements, and algal biomass grown for biofuel or industrial use.
Base Year Value
$0.7B in 2025 (MMA Primary Research Dataset, September 2026)
Forecast Period
2026 to 2036, eleven discrete annual values
CAGR
8.4% base case. Bull 9.6%. Bear 7.2%.
Fastest Growth Segment
Protein Isolates And Hydrolysates: 12.6% CAGR
Fastest Growth Country
China: 12.4% CAGR
Fastest Growth Region
South Asia and Pacific: 10.4% CAGR
Largest Region
East Asia: 44% of 2025 global value
Market Leaders
Taiwan Chlorella Manufacturing, Sun Chlorella, Yaeyama Shokusan, Roquette, and Algatechnologies lead the field. Source: MMA Primary Research Dataset, July 2026.
Primary Survey
n=3,800 procurement and R&D decision-makers, Q4 2025, six countries
Methodology
Demand-side build-up, cross-validated against public data, 47 expert interviews

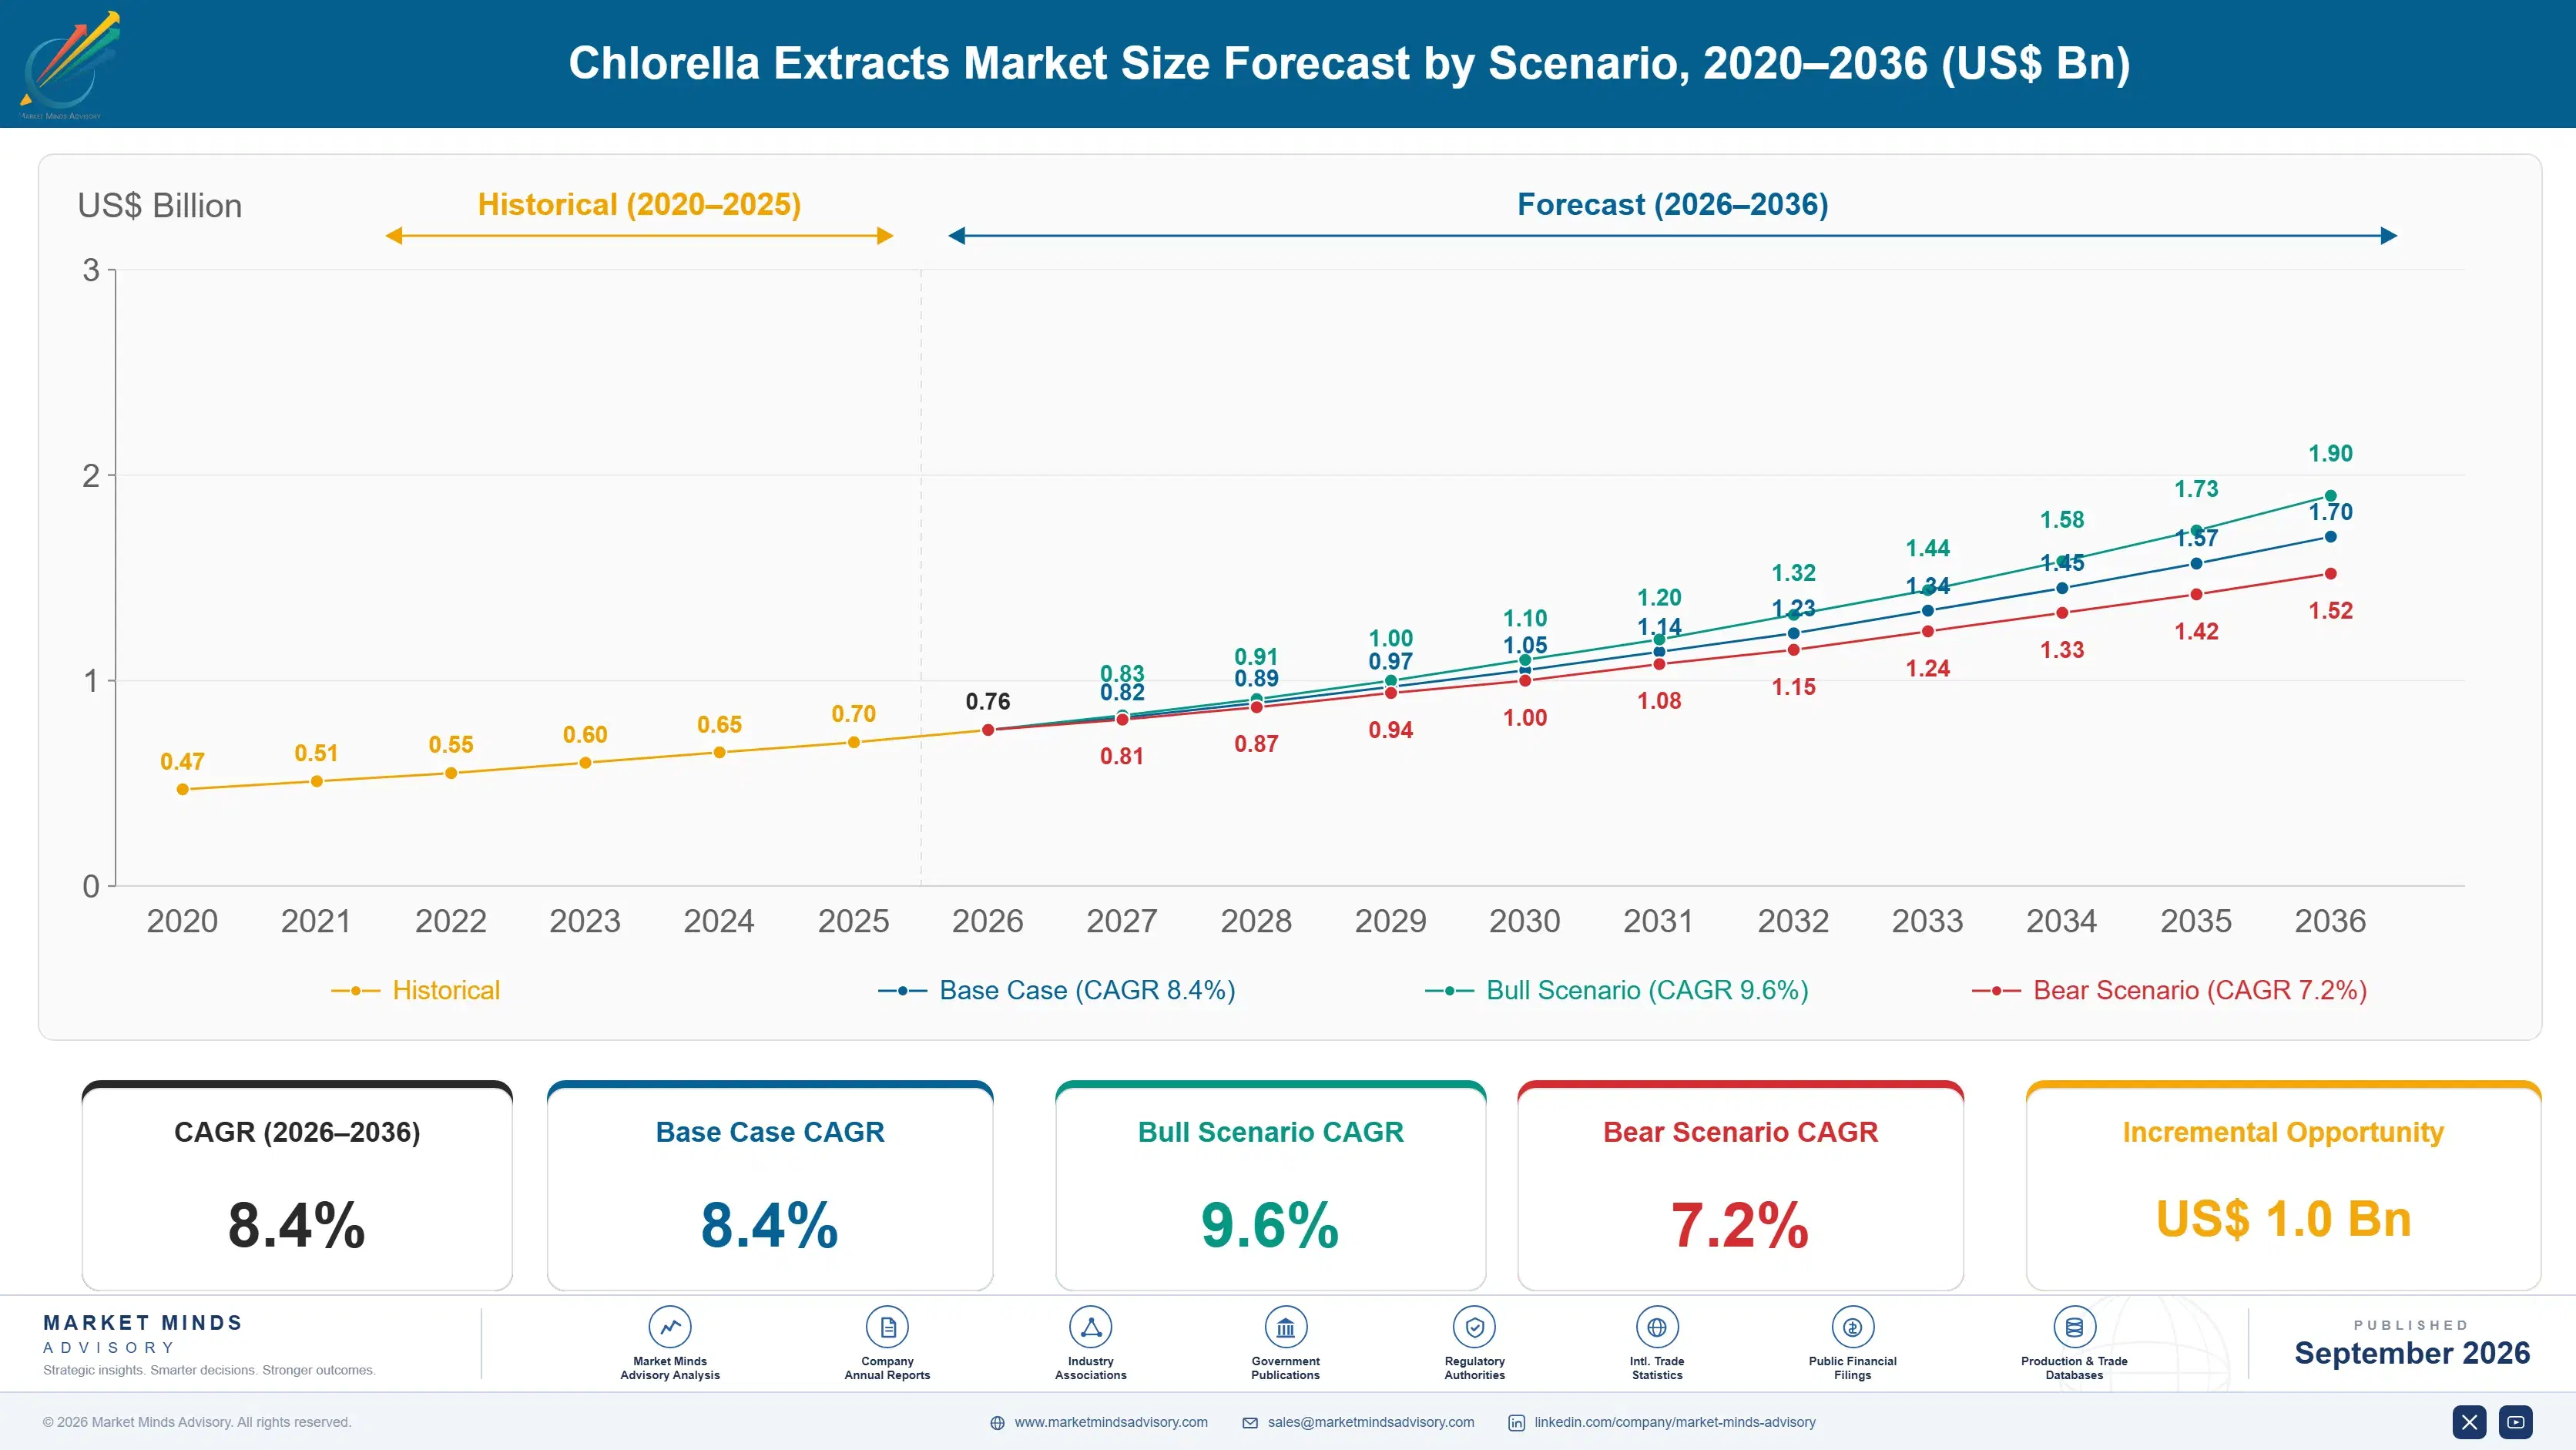
Chlorella Extracts Market Forecast Scenarios

chlorella-extracts-market-size-forecast-scenario-1790019173137
Growth from 2020 to 2025 ran at 7.3% and its composition shifted more than its rate. Human nutrition demand grew slowly and steadily on established Japanese and Taiwanese consumption, while aquaculture feed demand expanded considerably faster as hatcheries moved away from wild-caught feed inputs. Heterotrophic cultivation scaled through the same period and began displacing open pond material in applications where consistency matters.
The base case at 8.4% rests on three mechanisms. Heterotrophic protein isolates keep taking share from open pond material on composition consistency and contamination avoidance. Chinese production and domestic nutrition demand expand together, with country growth of 12.4% leading every market covered. And aquaculture hatchery demand keeps rising as feed formulators substitute microalgal inputs for wild-caught alternatives under supply pressure. None of the three assumes a disruption measurement standard arrives during the period.
The bull case at 9.6% depends on a disruption measurement standard emerging, which would let genuinely well-processed material demonstrate the difference and reprice the category around it. The bear case at 7.2% is contamination: roughly 9% of retail lots already exceed voluntary cadmium or lead limits, and a regulator making those limits mandatory would remove open pond volume rather than reprice it.

What The Cell Wall Decides

Chlorella protects itself with a wall tough enough to survive most of a digestive tract intact, which is the single fact that determines whether any of this works. Bead milling, high pressure homogenisation, or enzymatic treatment releases the contents; without it much of what a consumer swallows passes through unabsorbed. Around 12% of products state a measured disruption figure and the rest simply claim the wall is broken.
TOP FIVE CONCENTRATION43%Share of category revenue held by the leading producers
DISRUPTION METHOD DISCLOSURE12%Products stating measured cell wall disruption rather than claiming it
OPEN POND VOLUME SHARE58%Biomass grown in open systems exposed to airborne contamination
GROWTH FACTOR STANDARDS0Agreed compositional definitions behind the growth factor trade term
FEED APPLICATION SHARE34%Category volume going to aquaculture and animal feed applications
HEAVY METAL TEST FAILURES9%Retail lots exceeding voluntary cadmium or lead limits
The second imprecision is the growth factor term. Chlorella Growth Factor is a hot water extract containing nucleotides and peptides, and it has no agreed compositional definition anywhere. Two products carrying the name can differ substantially in what they contain, and a formulator specifying against the term is specifying against a trade description rather than a substance. Producers publishing compositional profiles are rare and separate themselves considerably when they do.
Then there is where the biomass comes from. Roughly 58% is grown in open ponds, which are exposed to airborne heavy metals and to cyanobacterial cross-growth that can introduce microcystins. Around 9% of retail lots exceed voluntary cadmium or lead limits. Closed photobioreactor and heterotrophic cultivation avoid both at higher cost, which is why heterotrophic material grows fastest.
"Everything about this ingredient turns on whether the wall was actually broken, and almost nobody publishes a number for it. The rest of the category argues about growth factor content in a term nobody has ever defined compositionally."
Practice Director, Nutrition Ingredients and Industrial Biotechnology · MMA Chemicals and Materials Practice · September 2026

Market Trends

Heterotrophic Cultivation Displaces Open Pond Volume

Protein isolates and hydrolysates grow at 12.6%, fastest of the six fractions, and heterotrophic cultivation is what carries them. Feeding chlorella sugar in a closed fermenter rather than growing it under sunlight produces consistent composition, higher cell density, and no exposure to airborne heavy metals or cyanobacterial cross-growth. The commercial awkwardness is that the resulting material contains far less chlorophyll and does not photosynthesise, which sits badly with green marketing built on sunlight. Producers are increasingly leading with consistency and purity instead, which is the stronger argument anyway. Consistency and purity are the stronger arguments anyway.
Market Impact: Country grows at 12.4%
Feed Demand Grows Where Nobody Reports It

About 34% of category volume goes to aquaculture and animal feed, and hatchery demand has grown considerably faster than human nutrition through the last five years. Shrimp and fish larvae feed on microalgae directly, and formulators have been substituting cultivated chlorella for wild-caught inputs under supply pressure. Almost no consumer-facing material in this category mentions that a third of it feeds fish. Producers reporting feed and nutrition volumes together make published category growth harder to interpret than it appears. Feed rewards cultivation cost position and nothing else, which suits the open pond capacity that regulated nutrition increasingly rejects outright.
Market Impact: Substitution covers 34% volume

Market Opportunities and Growth Drivers

Chinese Production And Domestic Demand Expand Together

China grows at 12.4%, faster than any country covered, as production capacity and domestic nutrition demand expand at the same time. East Asia holds 44% of world demand, and Taiwan remains the reference point for quality despite Chinese volume now exceeding it substantially. Japanese consumption is the longest established anywhere and treats chlorella as an ordinary daily supplement rather than a specialist one. Western producers competing on open pond biomass alone find the cost gap unbridgeable and increasingly sell heterotrophic material instead. Regional aquaculture hatcheries also absorb substantial feed-grade volume alongside the nutrition business.
Market Impact: Only 12% state figures

Hatchery Substitution Pulls Steady Industrial Volume

Aquaculture hatcheries feed microalgae directly to shrimp and fish larvae, and wild-caught feed inputs have been under supply pressure for a decade. Cultivated chlorella substitutes cleanly, arrives on a predictable schedule, and carries none of the seasonal variability wild inputs do. That demand runs on biological cycles rather than on consumer sentiment, which makes it considerably more predictable than the nutrition business. It also takes industrial-grade material at prices that reward cost position and nothing else at all. Producers holding both feed and nutrition positions need two separate cost structures to serve them.
Market Impact: About 9% exceed limits

Market Restraints and Challenges

Nobody Measures The Thing That Decides Efficacy

Only about 12% of products state a measured cell wall disruption figure, and the root cause is that no agreed method or standard exists to measure against. Commercially this caps what well-processed material can charge, since a producer achieving genuine disruption cannot demonstrate it against one that claims it. Producers respond by publishing microscopy and release assays with method documentation, by offering digestibility data, and by pushing trade bodies toward a shared measurement before a regulator writes one. Until such a standard exists, well-processed material competes on price against material that merely carries the claim.
Market Impact: Isolates grow at 12.6%

Open Pond Cultivation Carries Contamination Exposure

Roughly 58% of biomass is grown in open ponds and around 9% of retail lots exceed voluntary cadmium or lead limits, with the root cause being that an open system accumulates whatever the air and water deliver. Cyanobacterial cross-growth adds a separate microcystin risk that testing catches inconsistently. Commercially the exposure is concentrated in the cheapest material. Producers respond by moving to closed photobioreactors, by adopting heterotrophic cultivation, and by lot-level testing published to customers. Microcystin panels are absent from most incoming specifications entirely, so the risk is often not even looked for.
Market Impact: Feed takes 34% volume
3 additional market trends, 4 additional growth drivers, and 2 additional restraints and challenges are covered in the full report. Contact sales@marketmindsadvisory.com to access the complete intelligence.

Segment CAGR and Growth Architecture

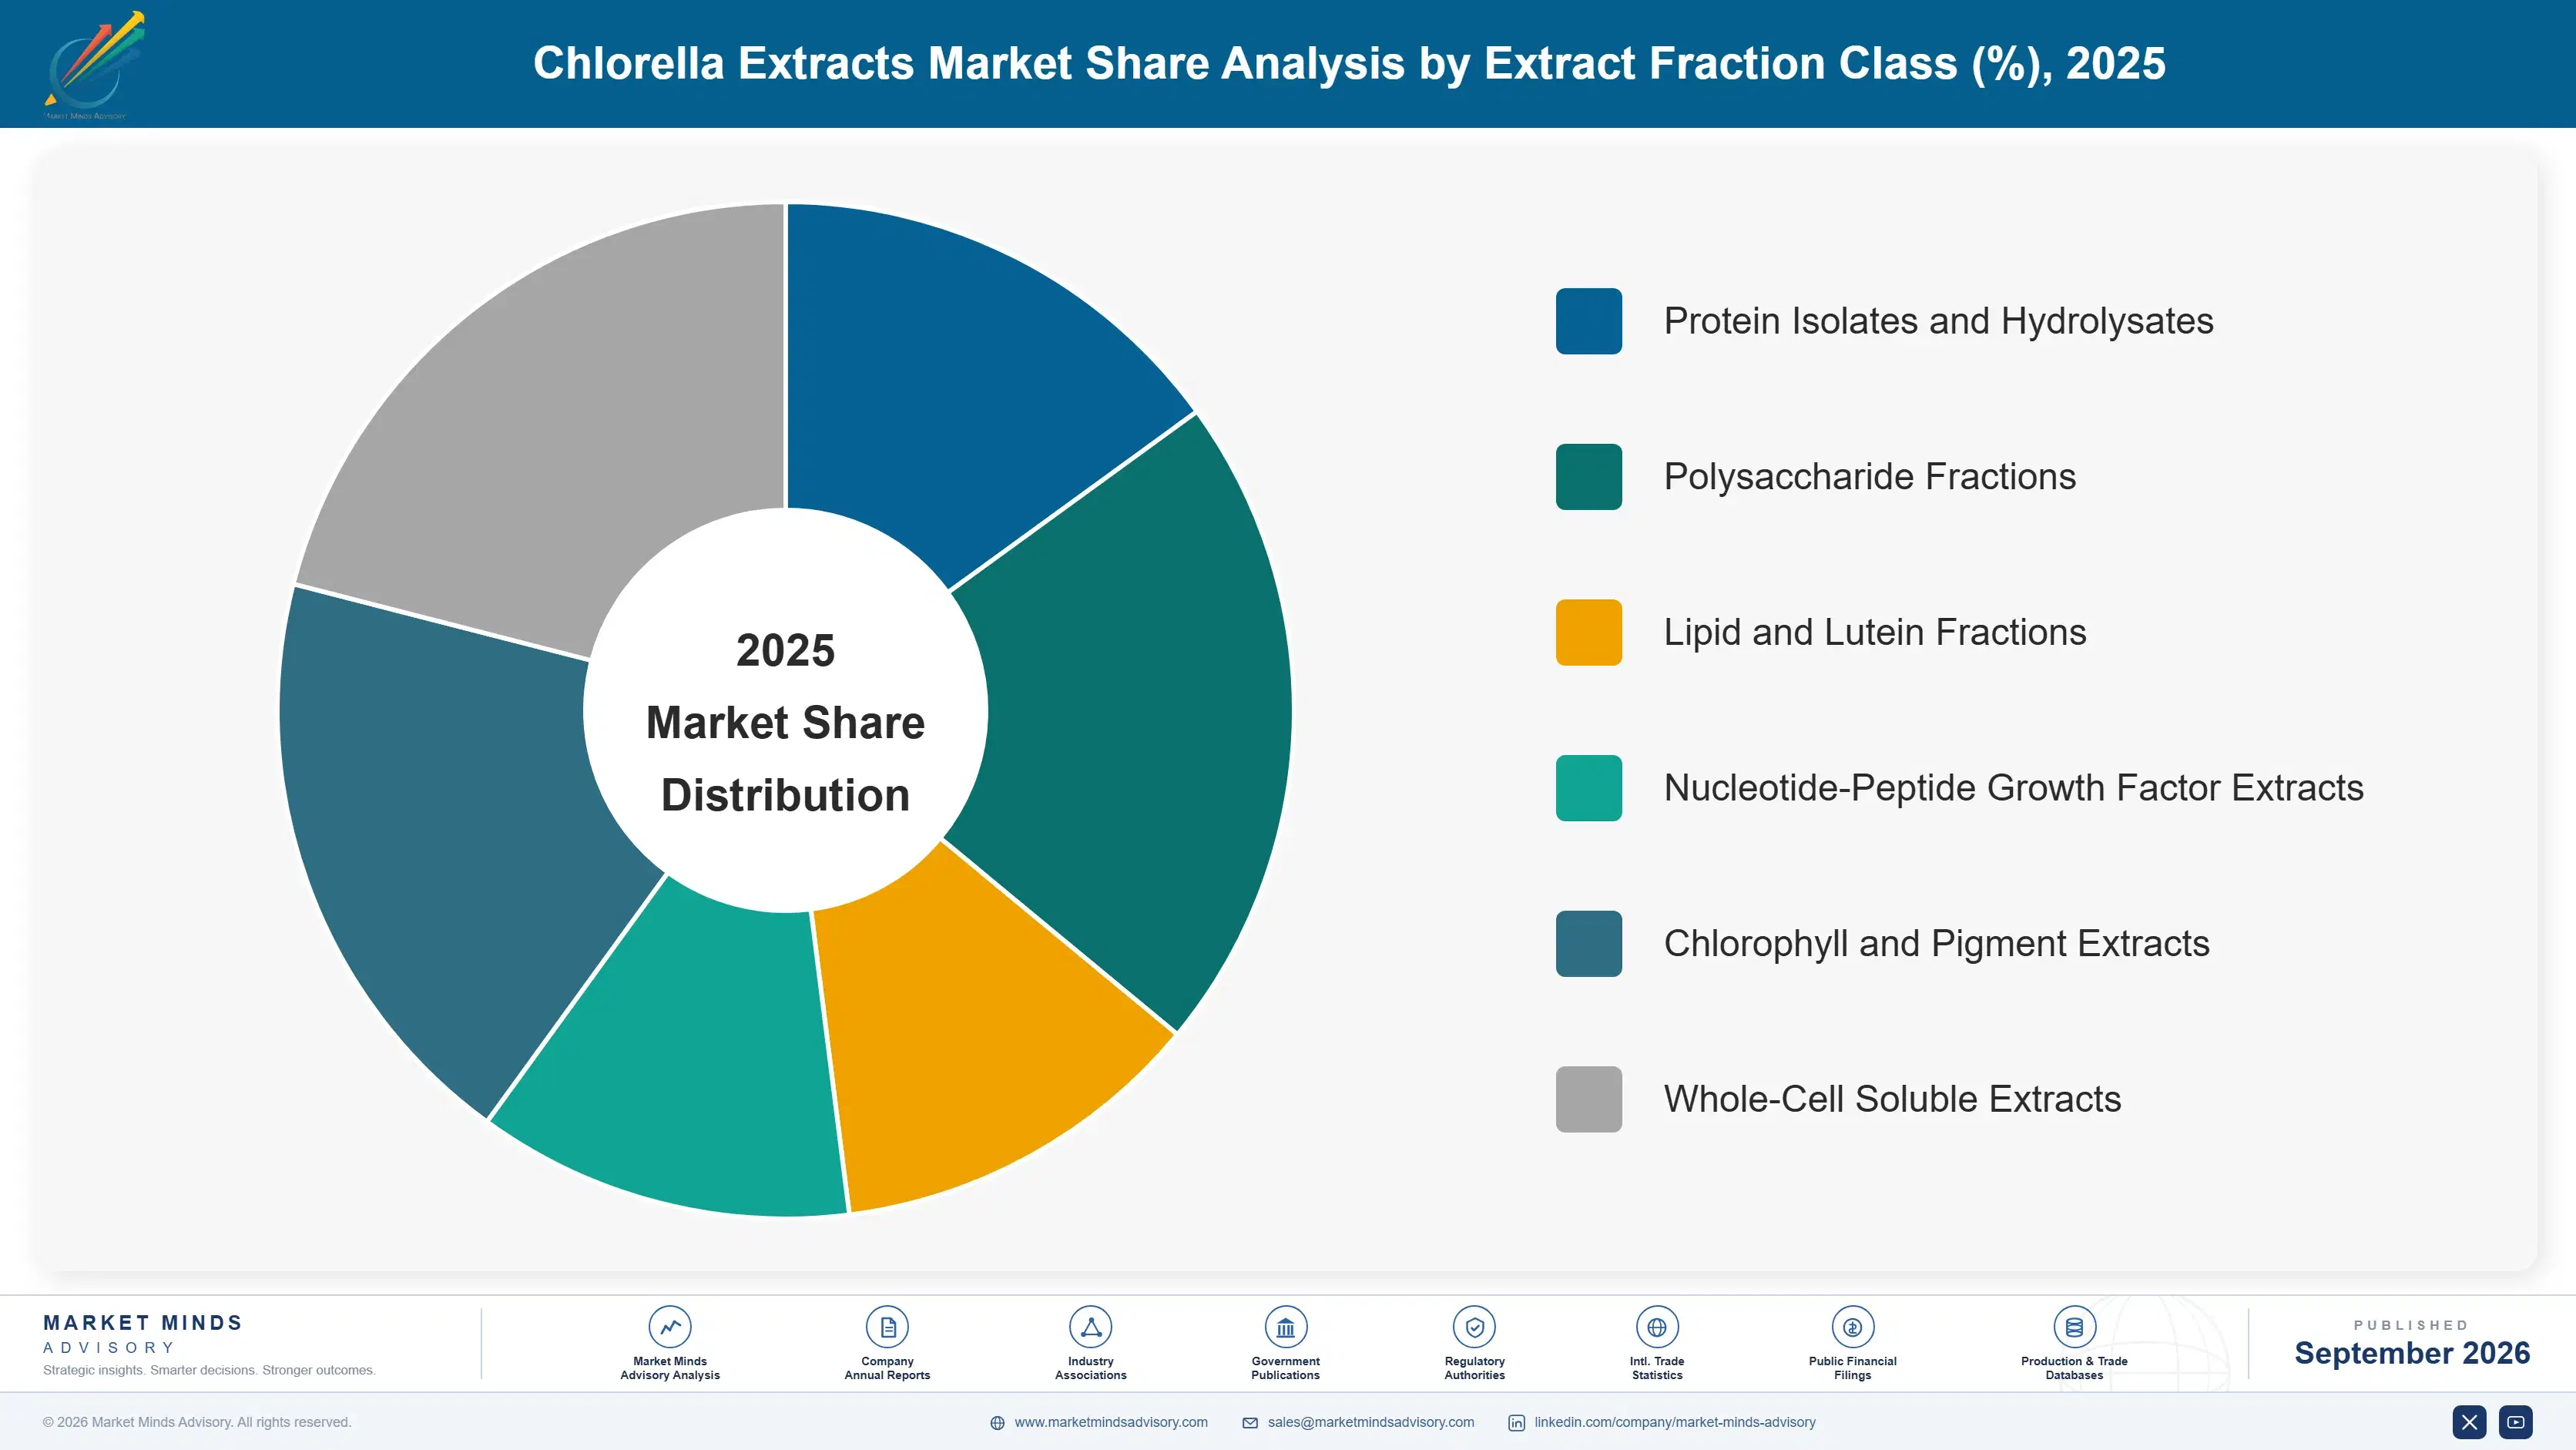
Segmentation follows extract fraction class across six categories: protein isolates and hydrolysates, polysaccharide fractions, lipid and lutein fractions, nucleotide-peptide growth factor extracts, chlorophyll and pigment extracts, and whole-cell soluble extracts. Cultivation route, end-use application, and purity grade are treated as separate dimensions entirely. Whole dried powder, spirulina, and algal omega-3 oils fall outside the defined scope entirely.
chlorella-extracts-market-market-share-analysis-1790019174436

Protein Isolates And Hydrolysates

Protein isolates and hydrolysates grow at 12.6%, half again the market rate of 8.4%, and heterotrophic cultivation is what makes them work commercially. Growing chlorella on sugar in a closed fermenter produces cell densities far above open pond systems, composition consistent enough to specify against, and no exposure to airborne heavy metals or cyanobacterial cross-growth. Hydrolysis then removes the digestibility question that the cell wall creates in whole-cell material. The awkwardness is presentational: heterotrophic biomass contains far less chlorophyll and never sees sunlight, which sits badly against green positioning. Producers leading on consistency and purity rather than on photosynthesis are performing considerably better. Regulated nutrition buyers increasingly will not qualify anything else at all.
CAGR 12.6%

Polysaccharide Fractions

Polysaccharide fractions grow at 10.8% on immune and skin barrier positioning supported by a genuinely better evidence base than most of this category carries. Beta-glucan and sulphated polysaccharide fractions from chlorella have been studied in ways whole-cell material has not, which gives a formulator something specific to specify against. Extraction is where the difficulty sits, since polysaccharide recovery competes directly with protein recovery from the same biomass and the two processes pull in opposite directions. Producers running integrated fractionation capture both; those optimising one discard value in the other. Yield economics rather than demand currently limit the segment. Producers running integrated fractionation capture both fractions from a single biomass stream.
CAGR 10.8%
Full segment breakdown across 6 segments available in the complete report.

Regional Architecture and Country Demand Map

Regional shares reflect where chlorella extracts are consumed in formulation and feed rather than where biomass is cultivated. Five regions sit outside the standard bands, for reasons named in their own paragraphs and summarised below for operator review. Cultivation route and application mix vary sharply between them.

East Asia

At 44% this sits far above the standard band, and the justification is that Japan and Taiwan established chlorella as an everyday supplement decades before Western markets encountered it, while China now produces more than either. Chinese growth of 12.4% leads every country covered. Taiwanese producers remain the quality reference and hold the deepest disruption processing capability anywhere. Japanese consumption is habitual rather than trend-driven, which makes regional demand unusually stable. Chinese open pond capacity supplies most world volume at prices no other region approaches. Regional aquaculture hatcheries also absorb substantial feed-grade material. Heterotrophic capacity is expanding fastest in China, aimed at export nutrition customers rather than at the domestic market that open pond volume already serves adequately.
Share: 44% | CAGR: 9.4% (2026 to 2036)

Western Europe

European novel food rules govern which chlorella species and preparations may be sold, which has narrowed the field to established material and raised the documentation burden on newer fractions. Growth of 6.9% is the slowest of the seven regions. German, Dutch, and Portuguese producers hold strong positions in closed photobioreactor cultivation, where contamination avoidance rather than cost is the selling argument. Heavy metal limits are applied more consistently here than in most markets. Aquaculture demand from Norwegian and Scottish operations adds meaningful feed-grade volume alongside human nutrition. Closed cultivation costs considerably more per kilogram and buyers here increasingly accept that, because a contamination rejection costs more than the premium does across a year of supply.
Share: 18% | CAGR: 6.9% (2026 to 2036)
Regional intelligence for 5 additional markets available in the complete report: North America, South Asia and Pacific, Latin America, Middle East and Africa, Eastern Europe. Contact sales@marketmindsadvisory.com.
chlorella-extracts-market-country-cagr-analysis-1790019176049

Where Chlorella Producers Build Position

Four commercial moves matter in a category whose central quality variable is unmeasured, whose signature ingredient term is undefined, and a third of whose volume feeds fish. Each replaces a claim with something a buyer can verify, which is scarce across the whole field at present. None of the four requires new cultivation technology to be developed.

Publish Measured Cell Wall Disruption Data

Only about 12% of products state a measured disruption figure, so a producer achieving genuine wall breakage competes against one that merely claims it. Producers publishing microscopy and release assay data with method documentation report price realisation 2.4 times higher than claim-only equivalents. The measurement is routine laboratory work costing very little per lot. Setting the norm first also shapes what a trade body or regulator eventually asks the rest of the field to demonstrate on every pack. Well-processed material currently competes on price against material carrying only the claim, which is the position disclosure ends.
Market Impact: Raises achieved price realisation to 2.4 times higher

Move Cultivation Into Closed Or Heterotrophic Systems

Roughly 58% of biomass grows in open ponds and around 9% of retail lots exceed voluntary heavy metal limits, which is exposure concentrated in the cheapest material. Producers operating closed photobioreactor or heterotrophic cultivation report contamination rejection rates 3.6 times lower alongside composition consistent enough for a formulator to specify against. The cost per kilogram is higher and the rejection avoidance frequently covers it. Buyers in regulated nutrition increasingly will not qualify open pond material at all. Open pond capacity still serves feed applications perfectly well, so the shift is a mix decision rather than an abandonment of existing assets.
Market Impact: Cuts contamination rejection rates 3.6 times lower overall

Define Growth Factor Composition Before Someone Else Does

No agreed compositional definition exists behind the growth factor term, so two products carrying the name can differ substantially in nucleotide and peptide content. Producers publishing compositional profiles report specification retention 2.2 times higher than those selling against the trade description alone. A formulator specifying against an undefined term cannot defend that specification internally, which makes disclosure useful to them rather than merely honest. Very few producers in this field have attempted it so far. Publishing a compositional profile costs routine analytical work and converts a trade description into a specification.
Market Impact: Raises specification retention rates to 2.2 times higher

Build Aquaculture Feed Volume On Purpose

About 34% of category volume goes to feed and hatchery demand runs on biological cycles rather than consumer sentiment, which makes it considerably more predictable than nutrition. Producers holding both nutrition and feed positions report earnings volatility 1.9 times lower through demand cycles than nutrition-only competitors. Feed takes industrial-grade material at prices rewarding cost position alone, so it suits open pond capacity that regulated nutrition increasingly rejects. The two applications need different cost structures and very few operate both well. Hatchery demand also runs counter to nutrition seasonality, which smooths an otherwise idle production schedule.
Market Impact: Cuts earnings volatility to 1.9 times lower overall

Who Controls the Margin Pool

Concentration is moderate. Five producers hold 43% of category revenue, measured consistently on that basis across all participants, and the field divides between long-established Taiwanese and Japanese producers, Chinese open pond capacity operating at volume, European closed photobioreactor specialists, and a small group of heterotrophic fermentation entrants competing on consistency rather than cost. The leader to challenger gap is wide in nutrition grades and almost absent in feed.
Competition currently turns on three dimensions: cell disruption capability and whether it is measured or merely asserted; cultivation route, which determines contamination exposure and therefore access to regulated nutrition; and fractionation depth, since polysaccharide and protein recovery compete for the same biomass and integrated processing captures both. Price decides in feed and commodity grades, which together carry roughly a third of category volume and reward no processing capability whatsoever.

Pressure builds from two directions. Chinese open pond capacity sets the world floor on feed and commodity grades. Contamination scrutiny in regulated nutrition markets is tightening steadily. Rankings will shift toward producers holding closed or heterotrophic cultivation and published disruption data rather than volume in open pond biomass. Producers holding only open pond capacity face the most exposed position in the field.
chlorella-extracts-market-company-positioning-matrix-1790019178053

Competitive Moat and Risk Dimensions

TAIWAN CHLORELLA MANUFACTURING

Moat: Disruption Processing And Quality Reference

Decades of continuous chlorella processing have produced cell disruption capability and quality practice that the rest of the field measures itself against, and Taiwanese material is specified by name in formulations elsewhere. That reputation compounds slowly and cannot be assembled by a competitor entering the category now.
TAIWAN CHLORELLA MANUFACTURING

Risk: Cost Position Against Chinese Volume

Chinese open pond capacity operates at a scale and cost that Taiwanese production cannot approach, and much of the market buys on price rather than on processing quality. Defending a premium on disruption capability requires a measurement standard that does not yet exist anywhere in the field.
ROQUETTE

Moat: Fermentation And Fractionation Depth

Industrial fermentation capability combined with downstream fractionation lets a single producer run heterotrophic cultivation and recover protein and polysaccharide fractions from the same biomass. That integration captures value that single-fraction processors discard, and it is genuinely difficult to assemble without existing fermentation assets. Single-fraction processors discard value the integration recovers.
ROQUETTE

Risk: Green Positioning Works Against It

Heterotrophic biomass contains far less chlorophyll and never photosynthesises, which sits badly with consumer positioning built on sunlight and green algae imagery. Selling consistency and purity instead is the stronger argument commercially and requires brand customers to change how they talk about the ingredient. Brand customers have to change how they describe the ingredient.

Players Tracked

Prominent Players

Taiwan Chlorella Manufacturing
Sun Chlorella
Yaeyama Shokusan
Roquette
Algatechnologies

Other Key Players

Chlorella Industry Company
Far East Bio-Tec
Euglena Company
DIC Corporation
Cyanotech
Fuqing King Dnarmsa Spirulina
Allmicroalgae
Duplaco
Alpha Biotech
Necton
Fitoplancton Marino
Parry Nutraceuticals
Zhejiang Binmei Biotechnology
GreenTech
Phycom

Recent Developments

MARCH 2026

Taiwan Chlorella Publishes Measured Disruption Data Across Its Range

Taiwan Chlorella Manufacturing released measured cell wall disruption figures with microscopy and release assay documentation across its extract range. The disclosure puts a comparable number where broken cell wall claims have stood alone across the whole category. Figures were published per grade rather than as a single aggregate.
Signal: A measured figure separates genuine processing from a phrase on a pack. Measurement ends the position where claims compete equally.
SEPTEMBER 2025

Roquette Expands Heterotrophic Chlorella Fermentation Capacity

Roquette completed an organic expansion of heterotrophic chlorella fermentation, funded internally with no partner involved. Management cited demand from regulated nutrition customers unwilling to qualify open pond material rather than any shortage of supply. Downstream hydrolysis capacity was expanded alongside the fermentation vessels themselves as well.
Signal: Regulated nutrition buyers are declining open pond material outright now. Qualification refusal rather than price is driving this shift.
MAY 2025

Algatechnologies Acquires Integrated Fractionation Technology Business

Algatechnologies completed an acquisition of a business developing integrated protein and polysaccharide fractionation for microalgal biomass. The transaction was an outright acquisition rather than a joint venture or minority stake, with yield economics cited as the rationale. Process engineering staff transferred with the business under agreed terms.
Signal: Recovering both fractions from one biomass is where the yield sits. Protein and polysaccharide recovery pull against each other.

What Chlorella Extract Costs

Three cost groups dominate. Cell disruption, extraction, and purification run 30% to 38% of cost of goods sold, the largest single group and the one determining whether material reaches nutrition grade at all. Cultivation inputs, covering nutrients, sugar feedstock in heterotrophic systems, and energy, take 28% to 36%. Harvesting and dewatering account for 20% to 28%, and the range separates open pond from closed and fermenter systems sharply.
Sugar and glucose feedstock pricing moved through 2024 and 2025 on harvest conditions and competing industrial demand, and United States Department of Agriculture crop statistics documented the underlying movements across the period. Industrial electricity pricing moved separately on regional generation mix, with Energy Information Administration series recording that divergence. Several producers described dewatering energy as the faster-rising line in their annual reports. The three moved independently.

The competitive disadvantage mechanism runs through downstream processing rather than through cultivation yield. A producer growing biomass cheaply but lacking disruption and fractionation capability sells into feed and commodity grades where price alone decides, and cannot reach the nutrition tier at any cultivation cost. Exposure therefore varies by process integration rather than by cultivation scale, and open pond producers without downstream depth are permanently capped.
chlorella-extracts-market-cost-volatility-analysis-1790019178509

Invest Downstream Before Adding Cultivation Capacity

Disruption, extraction, and purification form the largest cost group and determine which grades a producer can reach at all. Adding pond or fermenter capacity without matching downstream depth simply produces more commodity biomass into the part of the market where price alone decides and margin is thinnest. It is where most producers underinvest relative to where the money goes.

Run Feed And Nutrition On Separate Cost Structures

Feed grades reward cost position and nothing else, while nutrition grades reward disruption, purity, and documentation at many times the price. Operating both from a single cost structure serves neither well, and producers doing it properly maintain genuinely separate cultivation and processing routes for each application. Serving both from one route serves neither application properly.

Contract Sugar And Power On Separate Calendars

Agricultural sugar and industrial electricity follow harvest conditions and generation mix respectively, with no meaningful relationship between them in any period. Contracting the two separately rather than through one procurement view prevents a single approach from carrying exposure to markets that move entirely independently of each other. Harvest conditions and generation mix answer to different authorities.

Portfolio Architecture for Margin Defence

Margin follows processing depth and cultivation route rather than the organism. Feed-grade whole biomass competes close to commodity terms against Chinese open pond capacity. Chlorophyll and pigment extracts earn modestly on colour performance. Disrupted whole-cell nutrition grades earn well where the disruption is measured and published, and heterotrophic protein isolates with documented composition earn most of anything in this market. The spread from bottom to top tier is unusually wide for an ingredient category.
The tension between volume and premium runs through what the buyer is specifying. A feed formulator buying chlorella by protein content and delivered cost is running a commodity purchase that price and freight decide entirely. A nutrition brand specifying measured disruption, published composition, and lot-level contamination testing is buying a documented process, and switching supplier means requalifying against all three.

High-value pools concentrate in heterotrophic protein isolates for regulated nutrition, in polysaccharide fractions with published composition, and in disrupted material carrying measured release data. Where the product is open pond biomass sold into aquaculture feed on protein content, Chinese capacity holds cost and scale together and there is very little available to anybody else. Feed formulators specify on protein content and delivered cost alone.

Volume / Commodity-Adjacent

Open pond biomass and basic extracts sold into aquaculture feed and commodity nutrition on protein content and delivered cost. The ten-point range reflects cultivation location and freight rather than any capability a formulator would pay a premium to obtain.
Gross Margin: 18% to 28%

Premium / Certified

Disrupted whole-cell extracts, chlorophyll fractions, and growth factor preparations supplied with lot-level testing and traceability. The twelve-point range separates genuine disruption processing capability from producers claiming it without any supporting measurement.
Gross Margin: 34% to 46%

Sustainability / Regulatory / Next-Generation

Heterotrophic protein isolates and hydrolysates and polysaccharide fractions with published composition and measured disruption data. The sixteen-point range reflects fermentation and fractionation depth, neither of which can be assembled quickly.
Gross Margin: 52% to 68%
chlorella-extracts-market-portfolio-architecture-1790019179601

High-value Sub-segments and Strategic Watch-out

Heterotrophic Protein Isolates

Highest value in the category, offering composition consistent enough to specify against and no contamination exposure at all. The sixteen-point range reflects fermentation and hydrolysis depth, which very few producers currently hold at commercial scale. Regulated nutrition buyers increasingly will not qualify anything else at all.
Gross Margin: 54% to 70%

Published Composition Polysaccharide Fractions

High value on an evidence base genuinely better than most of this category carries, particularly in immune and barrier applications. The fourteen-point range reflects fractionation capability, since polysaccharide recovery competes directly with protein recovery. Yield economics rather than demand are what currently limit this segment.
Gross Margin: 44% to 58%

Measured Disruption Nutrition Grades

Volume core where a published disruption figure separates real processing from a claim on a pack. The twelve-point range reflects measurement practice rather than any difference in the biomass being processed and supplied. No agreed method exists anywhere yet, which is precisely where the opportunity sits.
Gross Margin: 36% to 48%

Open Pond Feed Grade Biomass

The strategic watch-out. Chinese capacity holds cost and scale, contamination exposure concentrates here, and regulated nutrition increasingly will not qualify it. The ten-point range reflects cultivation location and freight alone. Feed remains a perfectly legitimate home for this material, and regulated nutrition increasingly does not.
Gross Margin: 16% to 26%

How This Demand Repeats

Nutrition demand repeats on formulation life and behaves like any qualified ingredient. A supplement or food brand that has qualified a chlorella extract against disruption data, composition, and lot testing does not revisit that decision, because requalifying means repeating all three at a cost far exceeding any price difference. What breaks the pattern is a contamination failure, which forces an immediate substitution that the replacement supplier usually keeps.
Feed demand repeats on biology rather than on any purchasing decision at all. A shrimp hatchery consumes microalgae on larval cycles measured in weeks, orders against a production schedule, and switches supplier on delivered cost per kilogram of protein without much ceremony. The volume is large, predictable, and thin, and it rewards cultivation cost position rather than any processing capability whatsoever.

The buyer is shifting toward regulatory and quality functions in nutrition as contamination scrutiny tightens. A team qualifying an ingredient now asks for cultivation route, lot-level heavy metal data, and increasingly a disruption figure, and a producer arriving with a broken cell wall claim and a competitive price is answering none of those questions. Feed buyers have not changed and are unlikely to.
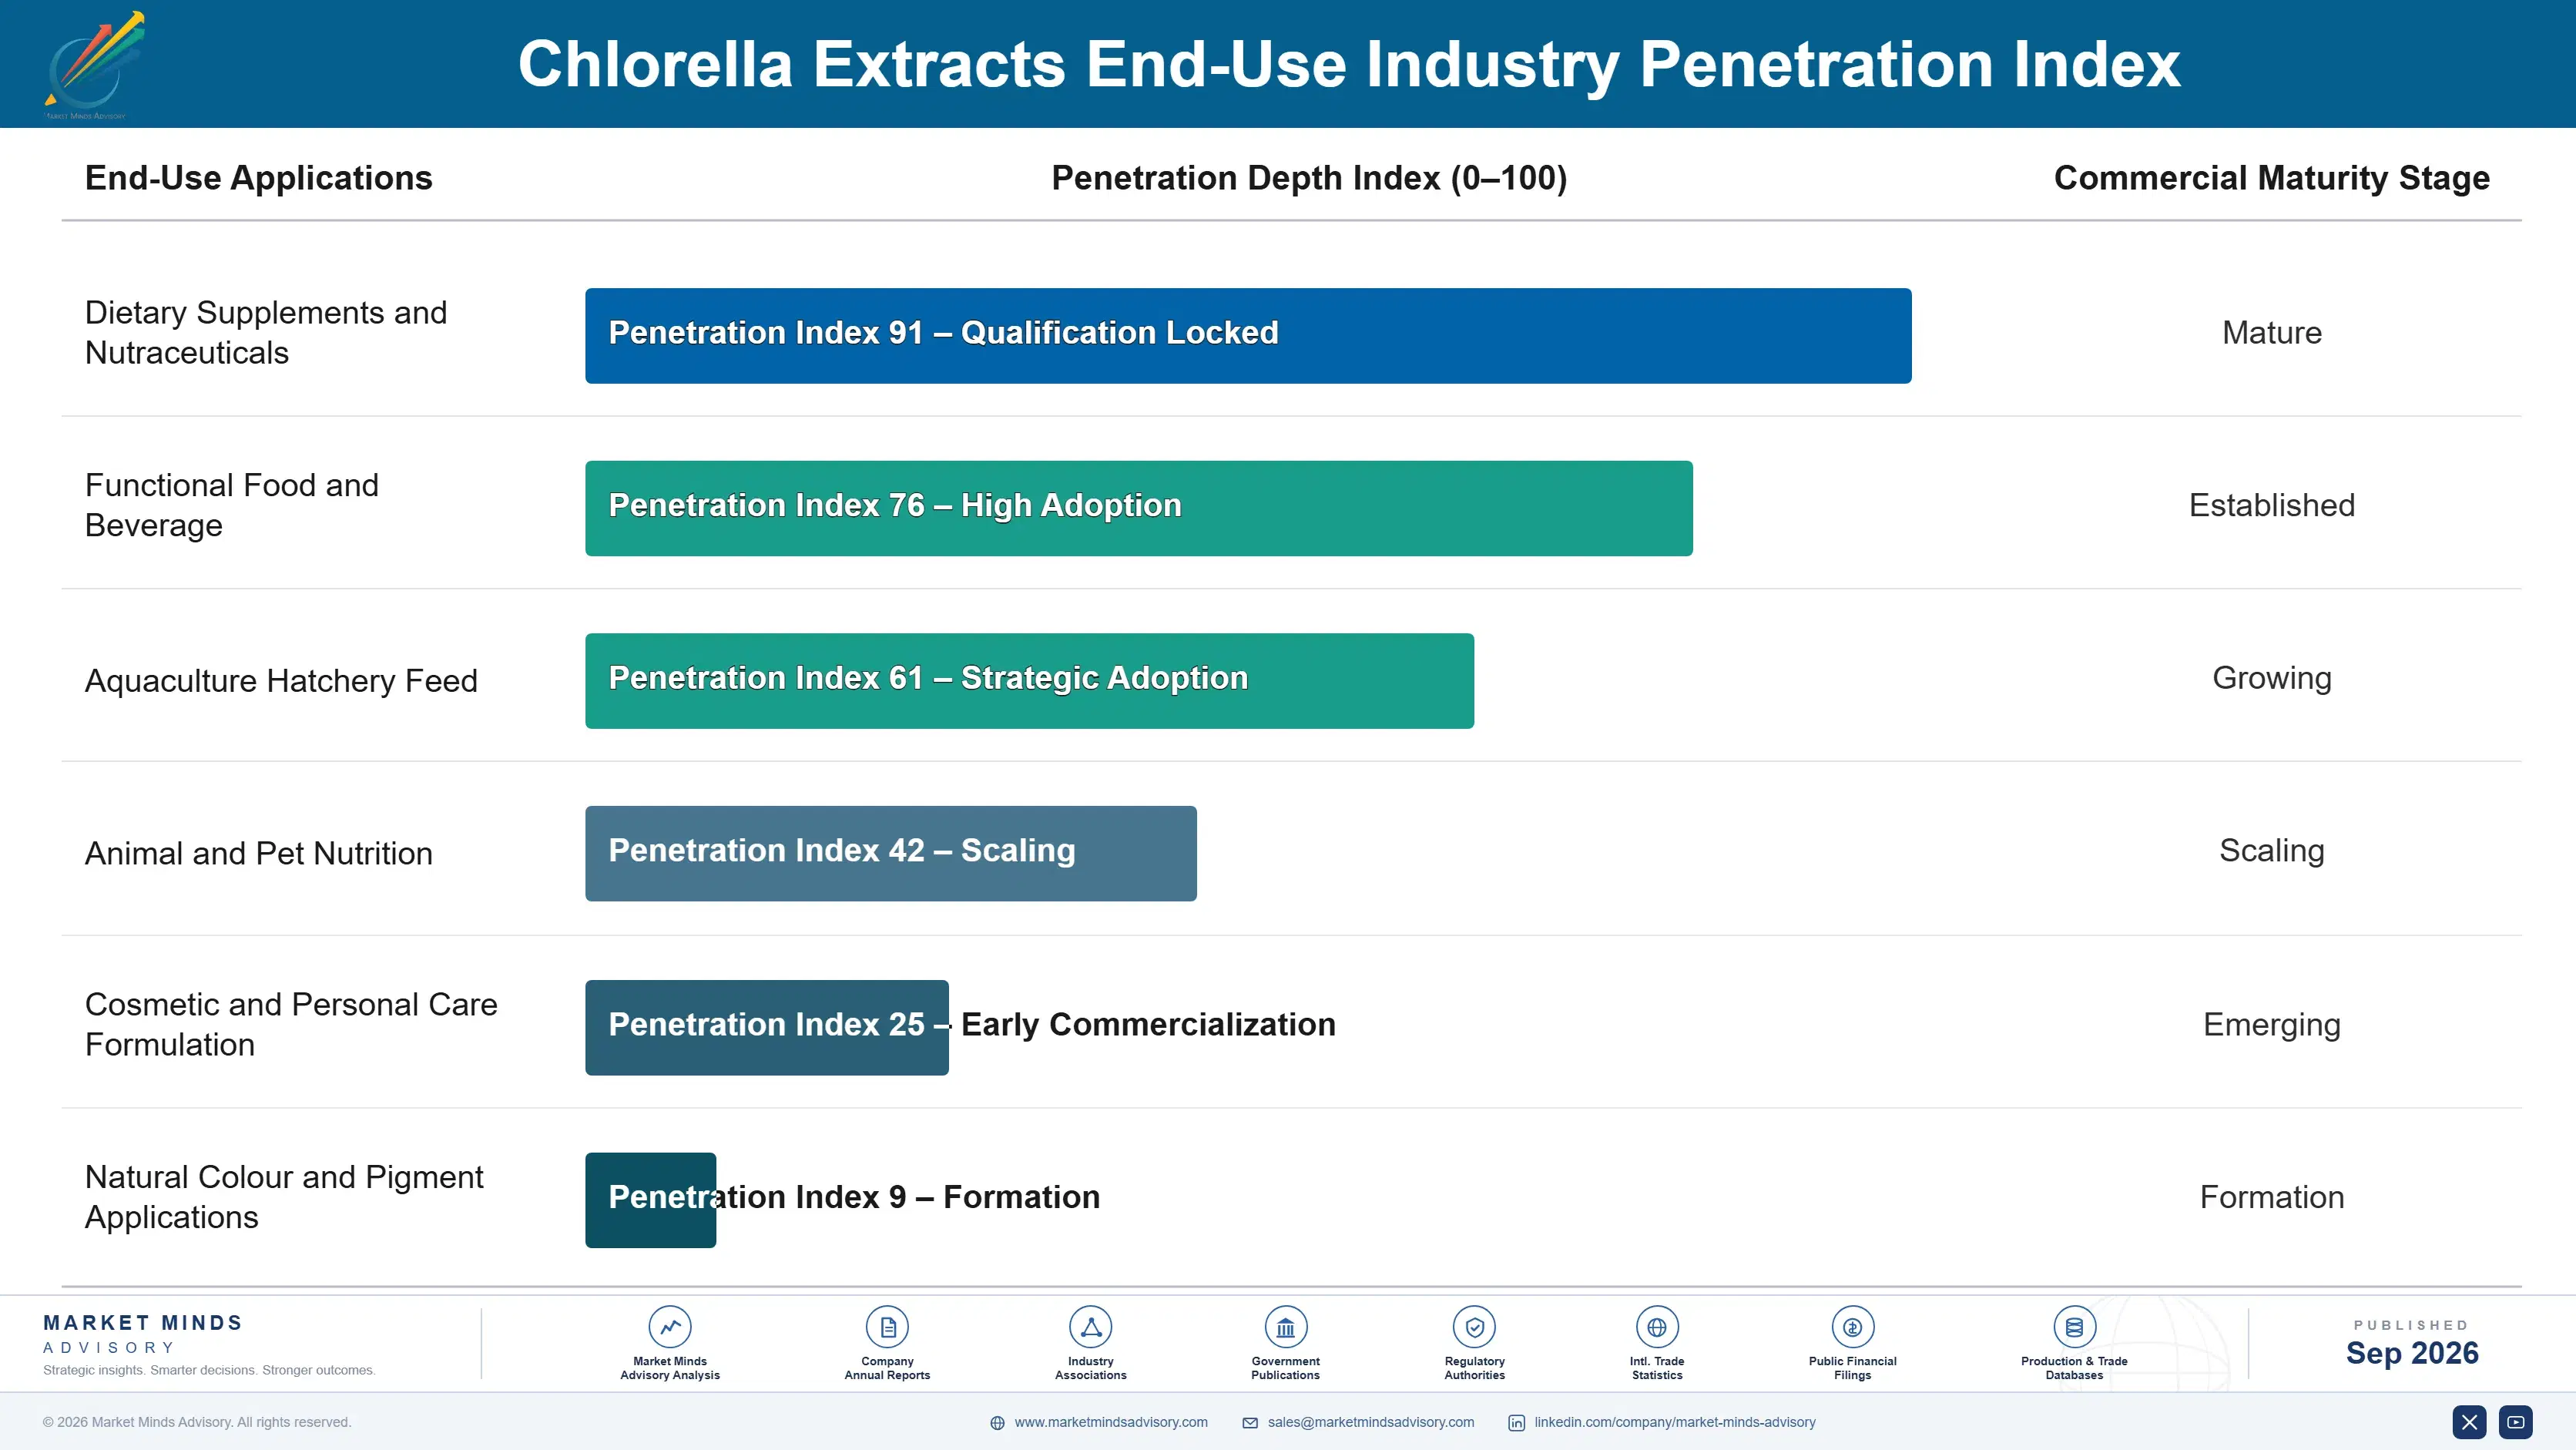
chlorella-extracts-market-end-use-penetration-index-1790019180488

Where This Market Rewards

These are among the four positions where our research anticipates prominent divergence between winners and laggards over the coming forecast period. Each is grounded in the demand model, the regulatory perimeter, and the announced capacity pipeline.
01 / DISRUPTION MEASUREMENT PUBLISHING

The wall decides whether anything works

Only about 12% of products state a measured cell wall disruption figure, which means a producer achieving genuine breakage competes on equal terms against one that simply prints the claim. Producers publishing microscopy and release assay data with method documentation report price realisation 2.4 times higher than claim-only equivalents. The measurement is routine laboratory work, and setting the norm first shapes what a trade body eventually requires everybody to demonstrate, and well-processed material currently competes on price against material carrying only the claim.
02 / CULTIVATION ROUTE SELECTION

Open ponds accumulate what falls in

Roughly 58% of biomass grows in open ponds and around 9% of retail lots exceed voluntary cadmium or lead limits, with contamination exposure concentrated in the cheapest material available. Producers operating closed photobioreactor or heterotrophic cultivation report contamination rejection rates 3.6 times lower alongside composition consistent enough to specify against. Buyers in regulated nutrition are increasingly declining to qualify open pond material at any price at all, and open pond capacity still serves feed applications perfectly well, so this is a mix decision.
03 / GROWTH FACTOR DEFINITION

A trade term, not a substance

No agreed compositional definition exists behind the growth factor term, so two products carrying that name can differ substantially in their nucleotide and peptide content. Producers publishing compositional profiles report specification retention 2.2 times higher than those selling against the trade description alone. A formulator specifying against an undefined term cannot defend that specification internally, which makes disclosure genuinely useful to them rather than merely honest, and publishing a compositional profile costs only routine analytical work to produce and publish openly.
04 / FEED VOLUME BALANCE

A third of it feeds fish

About 34% of category volume goes to aquaculture and animal feed, where hatchery demand runs on larval biological cycles rather than on any consumer sentiment or seasonal purchasing pattern. Producers holding both nutrition and feed positions report earnings volatility 1.9 times lower through demand cycles than nutrition-only competitors. The two applications require genuinely different cost structures, and very few producers operate both of them well, and hatchery demand also runs counter to nutrition seasonality, which smooths a production schedule that would otherwise idle.

Engagement Snapshot From the Field

A live engagement with an industry participant carrying material or product regulatory and market exposure ahead of a defining policy shift, showing how our research translates into a defensible multi-year portfolio strategy.
MARKET MINDS ADVISORY · CLIENT ENGAGEMENT SUMMARY
Chlorella Extracts Producer Strategic Portfolio Review and Transition Roadmap 2026·Investment Scenario on Chlorella Extracts Exposure Evaluation 2025-26
CLIENT PROFILE
A nutraceutical brand group with chlorella ingredient spend near USD 18 million (client-reported, unverified by MMA) across nine markets. An independent retail testing programme had flagged one of its products for cadmium, and the quality function had proposed increasing incoming lot testing frequency rather than examining the source. Cultivation route had never been recorded anywhere in the specification.
STRATEGIC CHALLENGE
The group had bought open pond material for a decade on price and a broken cell wall claim, and had never established what disruption was actually achieved or where the biomass was cultivated. Testing more frequently would have detected contamination without preventing any of it. Detection was being confused with prevention throughout the proposal.
MMA APPROACH
MMA traced the supply chain to cultivation site, measured cell wall disruption across incoming lots and four alternative suppliers, tested for cadmium, lead, and microcystins across a stratified sample, and modelled outcomes under increased testing, closed photobioreactor sourcing, and heterotrophic substitution. Supplier lots were tested blind to origin so the site correlation could be established independently.
KEY FINDINGS
  1. Measured disruption across incoming lots varied enormously and several lots fell well below the level required for meaningful absorption, despite every one carrying the same claim.
  2. Cadmium levels tracked cultivation site rather than lot, which meant increased testing frequency would have detected the problem repeatedly without ever preventing it.
  3. Two lots carried detectable microcystins from cyanobacterial cross-growth, a contaminant the group's testing panel had never included at any point. Nobody had considered it a plausible risk.
  4. Heterotrophic material cost materially more per kilogram and eliminated both contamination pathways while delivering composition consistent enough to specify properly. The premium was smaller than one recall.
CLIENT PROFILE
A nutraceutical brand group with chlorella ingredient spend near USD 18 million (client-reported, unverified by MMA) across nine markets. An independent retail testing programme had flagged one of its products for cadmium, and the quality function had proposed increasing incoming lot testing frequency rather than examining the source. Cultivation route had never been recorded anywhere in the specification.
STRATEGIC CHALLENGE
The group had bought open pond material for a decade on price and a broken cell wall claim, and had never established what disruption was actually achieved or where the biomass was cultivated. Testing more frequently would have detected contamination without preventing any of it. Detection was being confused with prevention throughout the proposal.
MMA APPROACH
MMA traced the supply chain to cultivation site, measured cell wall disruption across incoming lots and four alternative suppliers, tested for cadmium, lead, and microcystins across a stratified sample, and modelled outcomes under increased testing, closed photobioreactor sourcing, and heterotrophic substitution. Supplier lots were tested blind to origin so the site correlation could be established independently.
KEY FINDINGS
  1. Measured disruption across incoming lots varied enormously and several lots fell well below the level required for meaningful absorption, despite every one carrying the same claim.
  2. Cadmium levels tracked cultivation site rather than lot, which meant increased testing frequency would have detected the problem repeatedly without ever preventing it.
  3. Two lots carried detectable microcystins from cyanobacterial cross-growth, a contaminant the group's testing panel had never included at any point. Nobody had considered it a plausible risk.
  4. Heterotrophic material cost materially more per kilogram and eliminated both contamination pathways while delivering composition consistent enough to specify properly. The premium was smaller than one recall.
RECOMMENDED STRATEGY
Phase 1: Phase one: stop buying open pond material for the affected products and qualify a heterotrophic or closed photobioreactor source instead. Phase 2: Phase two: write measured disruption and a microcystin panel into every incoming specification rather than accepting a broken cell wall claim. Phase 3: Phase three: audit cultivation site rather than lot, since the contamination followed the site in every case examined. Re-audit each site annually rather than on incident.
OUTCOME
No further contamination flag occurred in the following four quarters and absorption-related consumer complaints fell materially (client-reported, unverified by MMA). Ingredient cost rose by roughly a fifth. Cultivation route now appears in every ingredient specification the group issues. Two competitors adopted comparable specification language within the following year.

Frequently Asked Questions

Foundational context covering the market sizes, CAGR, scope, country, region and competition that inform every finding below. This section is provided to cover basics and most often pre-purchase conversations, answered from the MMA Primary Research Dataset.

What is the current size of the Chlorella Extracts Market?

The market was worth USD 0.7 billion in 2025 and stands at USD 0.8 billion in 2026. Value covers extracts and fractions from Chlorella biomass at producer selling price.

How large will the Chlorella Extracts Market be by 2036?

MMA forecasts USD 1.8 billion by 2036, an increase of USD 1.0 billion across the forecast period. That represents 2.25 times the 2026 base of USD 0.8 billion.

What is the CAGR for the Chlorella Extracts Market 2026 to 2036?

The base case compound annual growth rate is 8.4%, with a bull case at 9.6% and a bear case at 7.2%. Historical growth from 2020 to 2025 ran at 7.3%.

Which segment is growing fastest?

Protein isolates and hydrolysates grow at 12.6%, half again the market rate of 8.4%. Heterotrophic cultivation gives them consistent composition and no contamination exposure, at a materially higher cost per kilogram.

Who are the major companies in the Chlorella Extracts Market?

Taiwan Chlorella Manufacturing, Sun Chlorella, Yaeyama Shokusan, Roquette and Algatechnologies lead the field. Together they hold 43% of category revenue, with Chinese open pond capacity setting the commodity floor.

Which country is growing fastest?

China grows at 12.4%, as production capacity and domestic nutrition demand expand together. Taiwan remains the quality reference despite Chinese volume now exceeding it substantially.

Report Segmentation Architecture

The full report scope spans multiple orthogonal segmentation dimensions, with cross-tabulated demand data provided for each dimension pair. Coverage extends further to regional breakdowns, trend trajectories, and the competitive detail needed to support segment-level decision-making.

By Extract Fraction Class

  • Protein Isolates and Hydrolysates
  • Polysaccharide Fractions
  • Lipid and Lutein Fractions
  • Nucleotide-Peptide Growth Factor Extracts
  • Chlorophyll and Pigment Extracts
  • Whole-Cell Soluble Extracts

By End-Use Industry

  • Dietary Supplements and Nutraceuticals
  • Functional Food and Beverage
  • Aquaculture Hatchery Feed
  • Animal and Pet Nutrition
  • Cosmetic and Personal Care Formulation
  • Natural Colour and Pigment Applications

By Commercial Dimension

  • Brand Owner Direct Supply
  • Contract Manufacturer Supply
  • Ingredient Distribution Channels
  • Aquaculture Feed Formulator Supply
  • Fractionation Development Contracts
  • Quality and Testing Service Agreements

By Region

  • East Asia
  • Western Europe
  • North America
  • South Asia and Pacific
  • Latin America
  • Middle East and Africa
  • Eastern Europe

Scope, Methodology, and Coverage

Every figure in this report is reproducible from documented input assumptions. The scope below maps the historical period, the forecast horizon, the segmentation dimensions, and the countries covered, alongside the underlying primary and qualitative methodology.
Historical Period
2020 to 2025
Forecast Period
2026 to 2036
Base Year
2025 (USD billions; MMA Primary Research Dataset, September 2026)
Market Definition
This market covers extracts and fractions derived from Chlorella microalgae biomass, across protein isolates and hydrolysates, polysaccharide fractions, lipid and lutein fractions, nucleotide-peptide growth factor extracts, chlorophyll and pigment extracts, and whole-cell soluble extracts. It excludes whole dried chlorella powder and tablets, spirulina and other microalgae, algal omega-3 oils, finished consumer supplements, and algal biomass grown for biofuel or industrial use.
Quantitative Units
USD billions, revenue at producer selling price
Segmentation Dimensions
Extract fraction class, end-use application, commercial dimension, region
Regions Covered
East Asia, Western Europe, North America, South Asia and Pacific, Latin America, Middle East and Africa, Eastern Europe
Countries Covered
China, Japan, Taiwan, South Korea, Germany, Netherlands, France, Portugal, United Kingdom, Spain, Italy, Poland, Czechia, United States, Canada, Mexico, India, Indonesia, Vietnam, Thailand, Australia, Brazil, Ecuador, Chile, Peru, Saudi Arabia, United Arab Emirates, Turkey, Egypt, South Africa
Key Companies Profiled
Taiwan Chlorella Manufacturing, Sun Chlorella, Yaeyama Shokusan, Roquette, Algatechnologies, Chlorella Industry Company, Far East Bio-Tec, Euglena Company, DIC Corporation, Cyanotech, Fuqing King Dnarmsa Spirulina, Allmicroalgae, Duplaco, Alpha Biotech, Necton, Fitoplancton Marino, Parry Nutraceuticals, Zhejiang Binmei Biotechnology, GreenTech, Phycom
Quantitative Methodology
Primary survey, n=3,800 respondents, Q4 2025, six countries; demand-side model with trade association cross-validation
Qualitative Methodology
47 expert interviews, Q4 2025; applied to validate demand model assumptions, identify emerging dynamics, and assess competitive positioning
Report Format
PDF and XLSX data workbook (Word format preview document)
Publisher
Market Minds Advisory
Report Code
MMA-2026-CHM-601
Published
September 2026
Contact
sales@marketmindsadvisory.com | www.marketmindsadvisory.com

Purchase the full Chlorella Extracts Market Report (2026 to 2036).

The full report sizes the chlorella extracts market across six fraction classes, seven regions, and thirty countries, with forecasts to 2036 under base, bull, and bear cases. It measures cell wall disruption disclosure across the field, separates open pond from closed and heterotrophic cultivation by contamination exposure, and sizes the aquaculture feed volume that consumer-facing material rarely mentions. Competitive analysis covers twenty participants evaluated consistently on category revenue, with detailed treatment of disruption capability and fractionation depth. Cost structure across cultivation, harvesting, and downstream processing is analysed throughout. Primary research includes 3,800 survey responses and 47 expert interviews.
Six extract fraction classes sized and forecast separately
Twenty participants evaluated on category revenue consistently
Cell wall disruption disclosure measured across the field
Contamination exposure compared by cultivation route
Aquaculture feed volume separated from human nutrition
Growth factor compositional variation assessed between producers

Built For The People Who Decide

From boardroom strategy to bench-side execution, this report is read cover-to-cover by leaders shaping the next decade of their industry, turning demand scenarios, market dynamics and valuation benchmarks into decisions.
CXOs/ Presidents/ VPs/ Managers
M&A and Corporate Development
Strategy Teams and R&D Heads
Procurement and Product Directors
Regulatory and Compliance Leaders
Investor Relations and Equity Analysts