Market Minds Advisory
China Fintech Market

China Fintech Market: Learning To Hold The Loans It Used To Arrange

Platforms once originated credit and passed almost all of it to bank partners. A rule requiring them to fund 30% themselves turned an asset-light fee business into a capital-heavy one.

Lead Analyst

Published

September 2026

Make Smarter Decisions with Customized Research Insights

Request a free sample report and evaluate market opportunities, growth trends, and competitive dynamics relevant to your business needs.

2025 MARKET VALUE$86.4BMarket Size 2025
2036 FORECAST VALUE$218.5BBase Case , 2026 to 2036
CAGR 2026 TO 20368.8 %Bull 10.0% / Bear 7.6%
INCREMENTAL OPPORTUNITY$124.5BNet 10- year value creation
EXPANSION MULTIPLE2.32x2036 value over 2026 base
Strategic Levers
M&A Pipeline
Regional Outlook
Country Rankings
Competitive Intelligence
Segmental Deep-dive
Call-Us : 91 93563 13602

Executive Snapshot and Market Trajectory

One single rule reshaped the whole sector. Requiring a platform to fund at least 30% of any co-lent loan from its own balance sheet converted arranging credit into holding it, and the business models built on the previous arrangement have not recovered.
Domestic activity carries 57% of value, far above the usual regional band, because this is a single-country market whose participants generate almost all of their revenue at home. Cross-border payment and acceptance services grow at 13.2%, half again the market rate of 8.8%, as acceptance infrastructure and wallet interoperability expand across Southeast Asian markets that welcome it. Nothing whatsoever about that expansion has ever required a single domestic rule to change anywhere at all.
Concentration reaches 61%, the highest of any major fintech market, resting on two payment networks that between them reach around 87% of adults monthly. Merchant fees run near 0.5% of transaction value, a fraction of Western card economics, so payments earns almost nothing directly and everything through what attaches to it. The payment leg was never the business, and restrictions on products sold across it struck where the money was.
Market Definition
The market covers revenue earned by financial technology providers operating in China, spanning digital payments and merchant acquiring, platform consumer and small business lending, digital wealth and fund distribution, insurance distribution and insurtech, cross-border payment and acceptance services, and regulatory technology and financial infrastructure software. Traditional bank net interest income, securities brokerage and exchange operations, insurance underwriting risk margin, cloud infrastructure sold outside financial services, and cryptoasset trading are excluded.
Base Year Value
$86.4B in 2025 (MMA Primary Research Dataset, August 2026)
Forecast Period
2026 to 2036, eleven discrete annual values
CAGR
8.8% base case. Bull 10.0%. Bear 7.6%.
Fastest Growth Segment
Cross-Border Payment and Acceptance Services: 13.2% CAGR
Fastest Growth Country
Indonesia: 10.8% CAGR
Fastest Growth Region
South Asia and Pacific: 11.0% CAGR
Largest Region
East Asia: 57% of 2025 global value
Market Leaders
Ant Group, Tencent, JD Technology, Lufax, Du Xiaoman. Source: MMA Analysis based on disclosed fintech and financial services segment revenue, company annual reports 2025.
Primary Survey
n=3,800 procurement and R&D decision-makers, Q4 2025, six countries
Methodology
Demand-side build-up, cross-validated against public data, 47 expert interviews

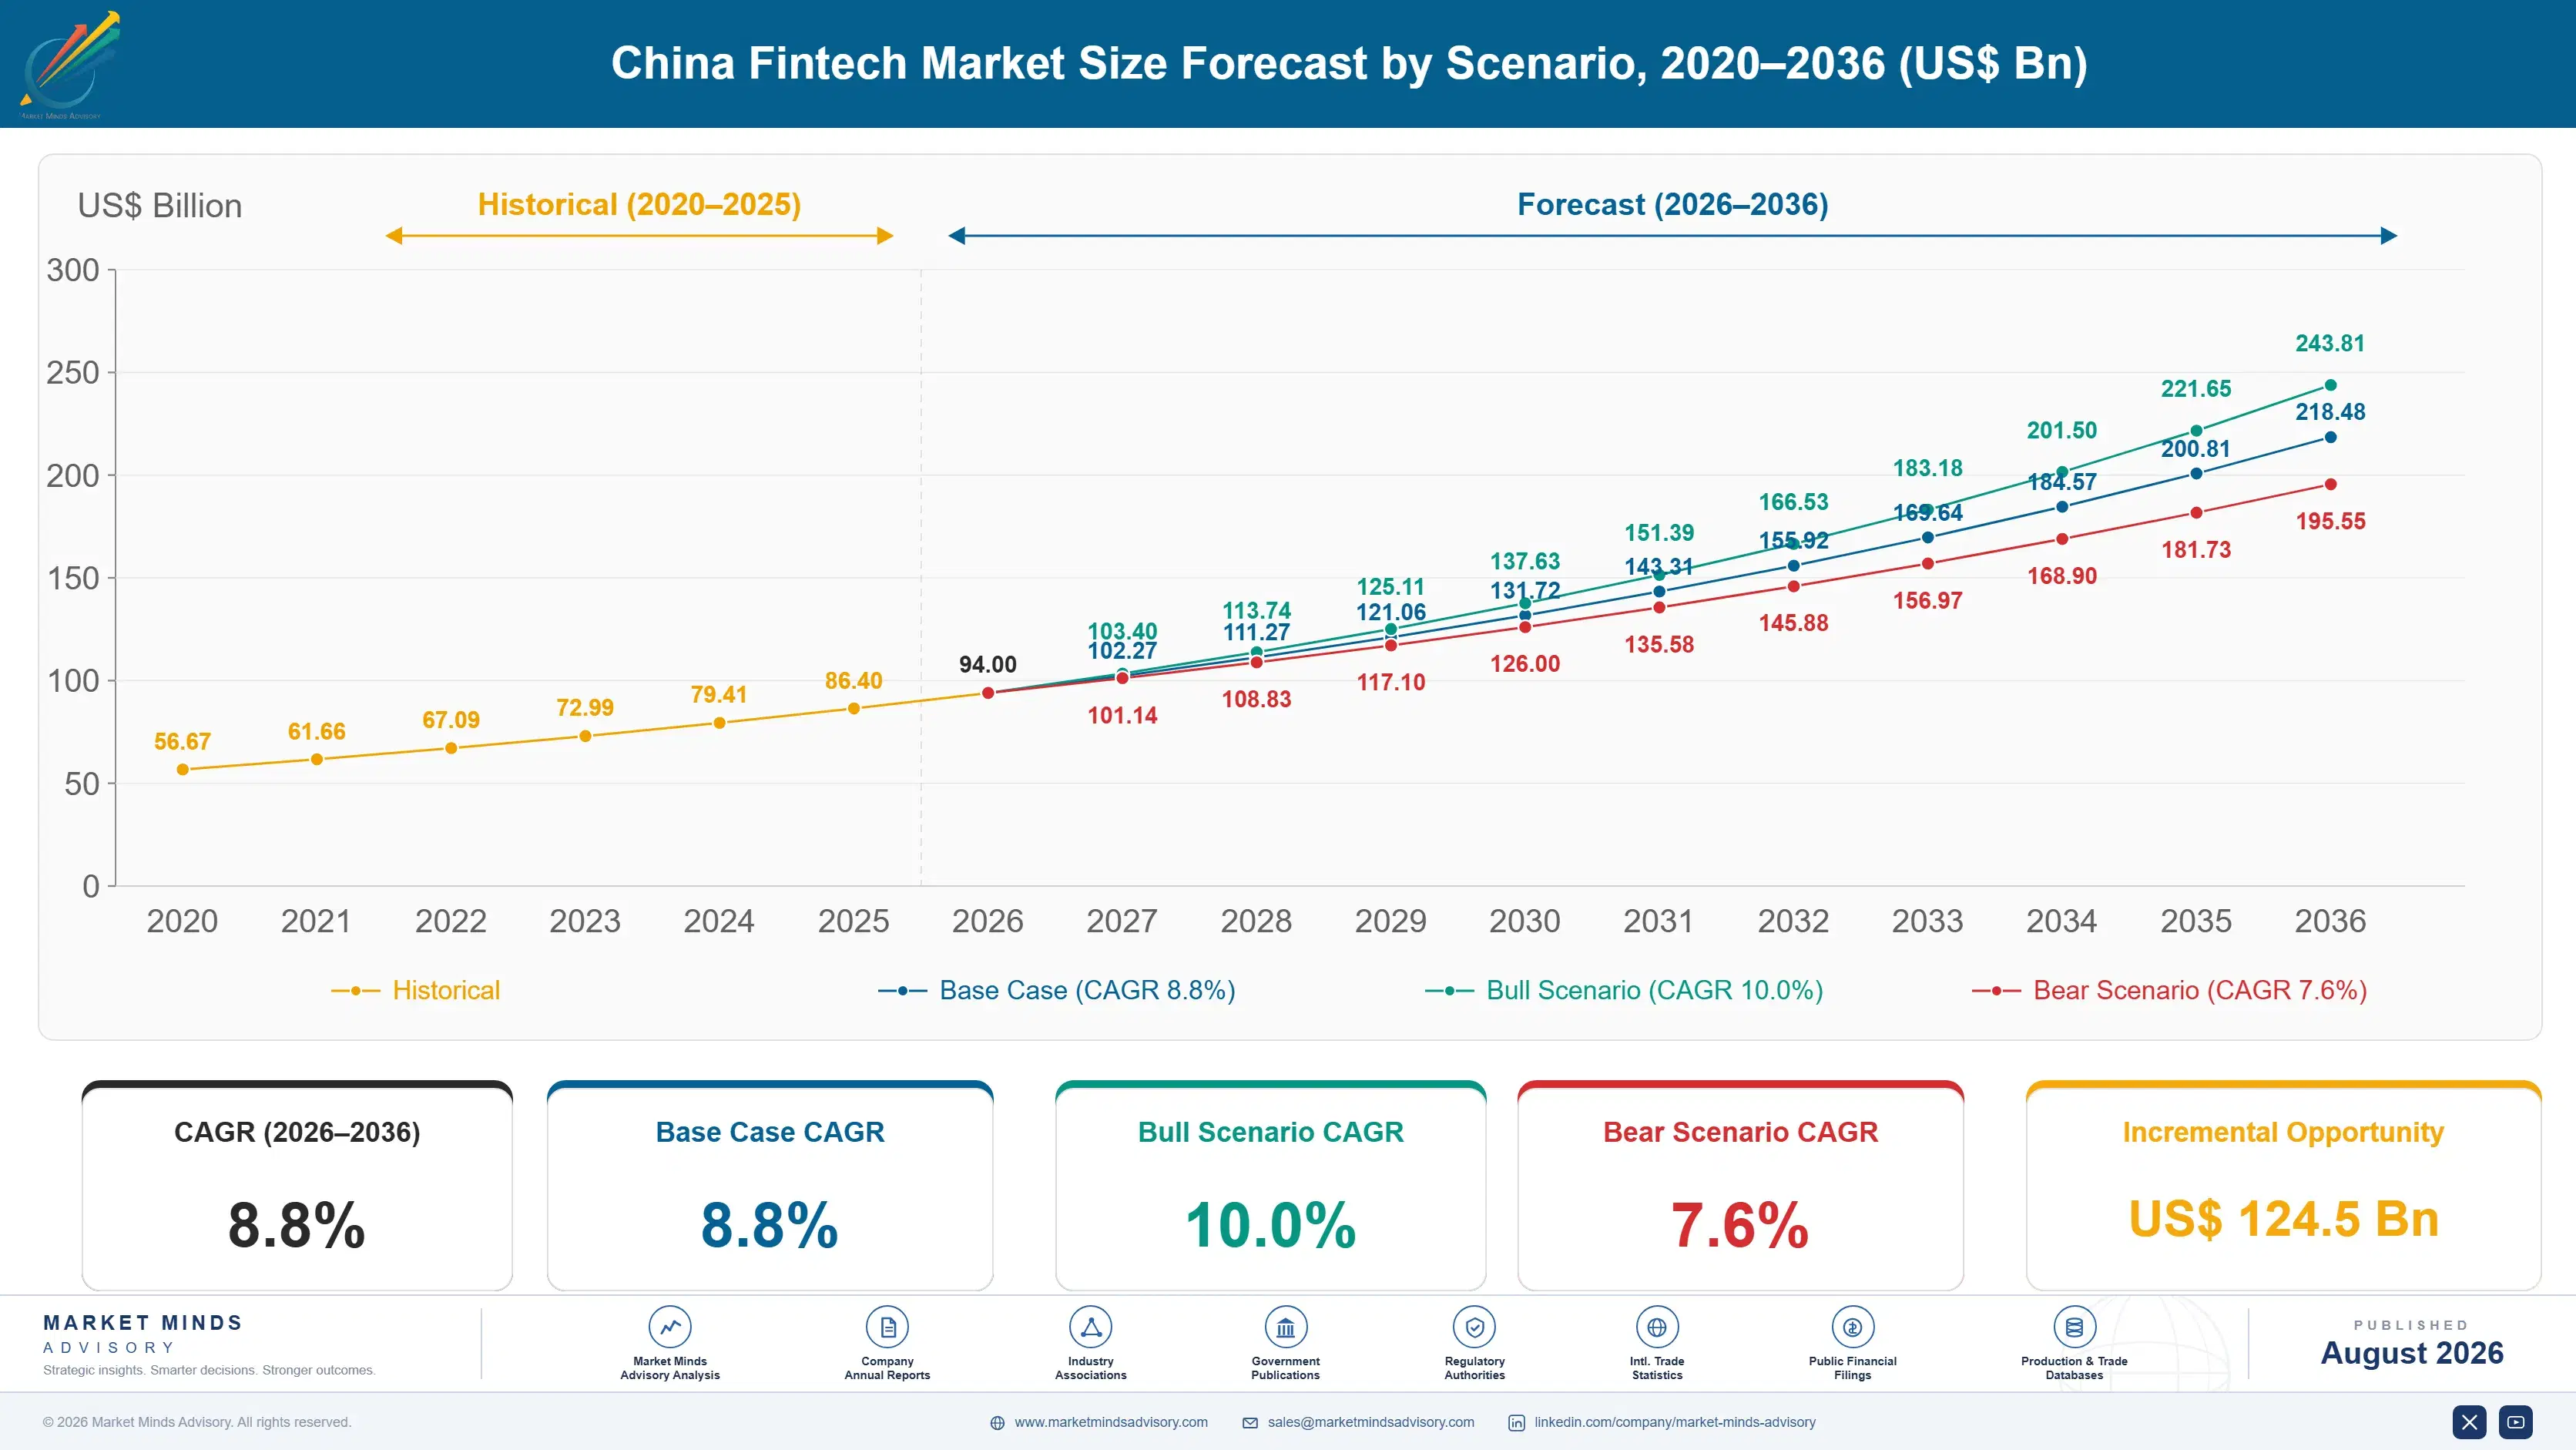
China Fintech Market Forecast Scenarios

china-fintech-market-size-forecast-scenario-1787913350574
Growth from 2020 to 2025 ran at 7.6% and a sequence of regulatory changes explains nearly all of it. Online micro-lending rules imposed the co-lending capital requirement. Platforms were converted into supervised financial holding companies. Consumer credit data was routed through licensed reporting bureaus rather than held privately. Personal information legislation restricted how behavioural data could be used. Growth slowed sharply and stabilised at a more modest level.
The 8.8% base case rests on three mechanisms. Cross-border acceptance and wallet interoperability keep expanding across Southeast Asia, where Chinese payment infrastructure is genuinely welcome. Insurance distribution keeps growing from low penetration on products that suit digital sale. And infrastructure software keeps growing because every supervised institution now needs reporting and compliance capability it did not previously build. None of the three depends on domestic platform lending recovering at all.
The bull case at 10.0% assumes cross-border expansion accelerates and wealth distribution recovers as product restrictions ease. The bear case at 7.6% is the official digital currency taking meaningful share from the two payment networks, which would remove the free distribution layer that everything else has always been sold through and leave platforms paying to reach customers they currently reach for nothing.

Capital Rules Changed The Business

The co-lending requirement did more than any other single measure. Platforms had originated loans, collected an arrangement fee and passed almost all the funding and credit risk to bank partners, which produced enormous returns on very little capital. Requiring at least 30% of each loan to sit on the platform's own balance sheet ended that immediately. Platform lending growth slowed and never returned to the previous trajectory.
FIVE-FIRM CONCENTRATION61%Share of category revenue held by the largest domestic providers
CO-LENDING CAPITAL RULE30%Loan share a platform must now fund from itself
MERCHANT PAYMENT FEE0.5%Charge applied on a typical mobile transaction value
MOBILE PAYMENT PENETRATION87%Adults using phone based payment at least monthly
LICENSED BUREAU ROUTING100%Platform credit data passing through supervised reporting channels
DIGITAL CURRENCY PILOTS26Locations where the official digital currency now operates
Payments reaches almost everybody and earns almost nothing directly. Around 87% of adults use mobile payment monthly and merchant fees run near 0.5% of transaction value, against Western card economics several times higher. The payment leg was never the business. It was distribution, giving free universal access to customers who could then be sold credit, funds and insurance, and every restriction on those products struck the actual source of profit.
Credit data no longer belongs to whoever collected it. Platform consumer credit information now routes through licensed reporting bureaus rather than staying inside the collector, which removed a genuine information advantage that the largest platforms had spent a decade accumulating. Behavioural data use narrowed further under personal information legislation. Underwriting advantage has moved toward institutions with balance sheets rather than institutions with datasets.
"Everybody describes what happened here as a crackdown on technology companies. It was actually a decision that firms doing lending should hold capital against it, which is what every other country worked out considerably earlier and with rather less drama attached."
Director, Digital Finance Practice · MMA Financial Technology and Digital Finance Practice · August 2026

Market Trends

Cross-Border Acceptance Becomes The Growth Story

Payment acceptance infrastructure and wallet interoperability across Southeast Asian markets has expanded quickly, carrying both outbound traveller spending and local merchant acquiring under arrangements that regional operators have generally welcomed. That segment grows at 13.2%. Indonesia grows fastest at 10.8%. It works because the technology is genuinely good, the commercial terms are attractive to local partners and nothing about it requires the domestic regulatory position to change at all. Growth continued here right through the whole period when almost every domestic segment was being reshaped by supervision at home entirely.
Market Impact: Grows infrastructure software 12.6%
Balance Sheet Beats Dataset In Consumer Credit

Routing platform credit information through licensed reporting bureaus removed the private data advantage that the largest platforms spent a decade accumulating, and the co-lending capital requirement made funding capacity the binding constraint instead. Institutions with deposits now hold the stronger position. Platforms have responded by acquiring banking licences, partnering more deeply, or accepting a smaller arranging role than the one their valuations were originally built upon. A decade of accumulated behavioural information stopped being an advantage almost overnight, and nothing anybody built afterwards has replaced what that data used to be worth.
Market Impact: Grows insurance distribution 11.4%

Market Opportunities and Growth Drivers

Compliance Software Demand Follows Supervised Status

Converting platforms into supervised financial holding companies created reporting, capital calculation and risk management obligations that technology firms had never previously built anything for. That segment grows at 12.6%. Demand comes from institutions that must comply rather than from anybody choosing to improve, which makes it dependable and largely insensitive to commercial conditions. Domestic vendors dominate because the requirements are specific to one regulatory framework and change frequently. Nobody buys this because they want it, which makes the revenue considerably more dependable than anything sold on merit alone ever is.
Market Impact: Operates across 26 pilot cities

Insurance Distribution Suits Digital Sale Unusually Well

Insurance penetration remains low relative to income levels and several product types sell well through digital channels, particularly short-duration health, accident and shipping return cover attached directly to transactions people are already completing. That segment grows at 11.4%. Distribution rules tightened considerably after early growth was driven by products consumers did not always understand, which slowed the market and improved what remained of it. Commission accrues without any underwriting risk attaching to the distributor, which makes this one of very few segments here that earns well while requiring no capital at all.
Market Impact: Caps growth at 30% funding

Market Restraints and Challenges

Official Digital Currency Threatens The Distribution Layer

The official digital currency now operates across 26 pilot locations and settles directly between the central bank layer and users, which bypasses the two payment networks that currently provide free universal distribution for everything else these platforms sell. Root cause is a deliberate policy design. Commercial impact would fall on customer reach rather than on payment revenue, which is already minimal. Mitigation involves integration as a wallet, preserving the interface if not the rail. The customer interface can be kept even where the underlying rail sitting underneath it changes entirely.
Market Impact: Grows cross-border services at 13.2%

Capital Requirements Cap How Fast Lending Can Grow

Holding 30% of every co-lent loan means expanding the book requires proportionate capital, which converts growth from a technology question into a balance sheet one and imposes a ceiling nothing about better underwriting removes. Root cause is prudential regulation applied consistently. Commercial impact is that lending growth now tracks capital rather than demand. Mitigation involves securitisation, banking licences and partnerships where the partner genuinely holds the risk. Better underwriting produces a better book and no additional capacity whatsoever, which is a lesson platforms took several years longer to accept than supervisors expected.
Market Impact: Requires 30% own funding
3 additional market trends, 4 additional growth drivers, and 2 additional restraints and challenges are covered in the full report. Contact sales@marketmindsadvisory.com to access the complete intelligence.

Segment CAGR and Growth Architecture

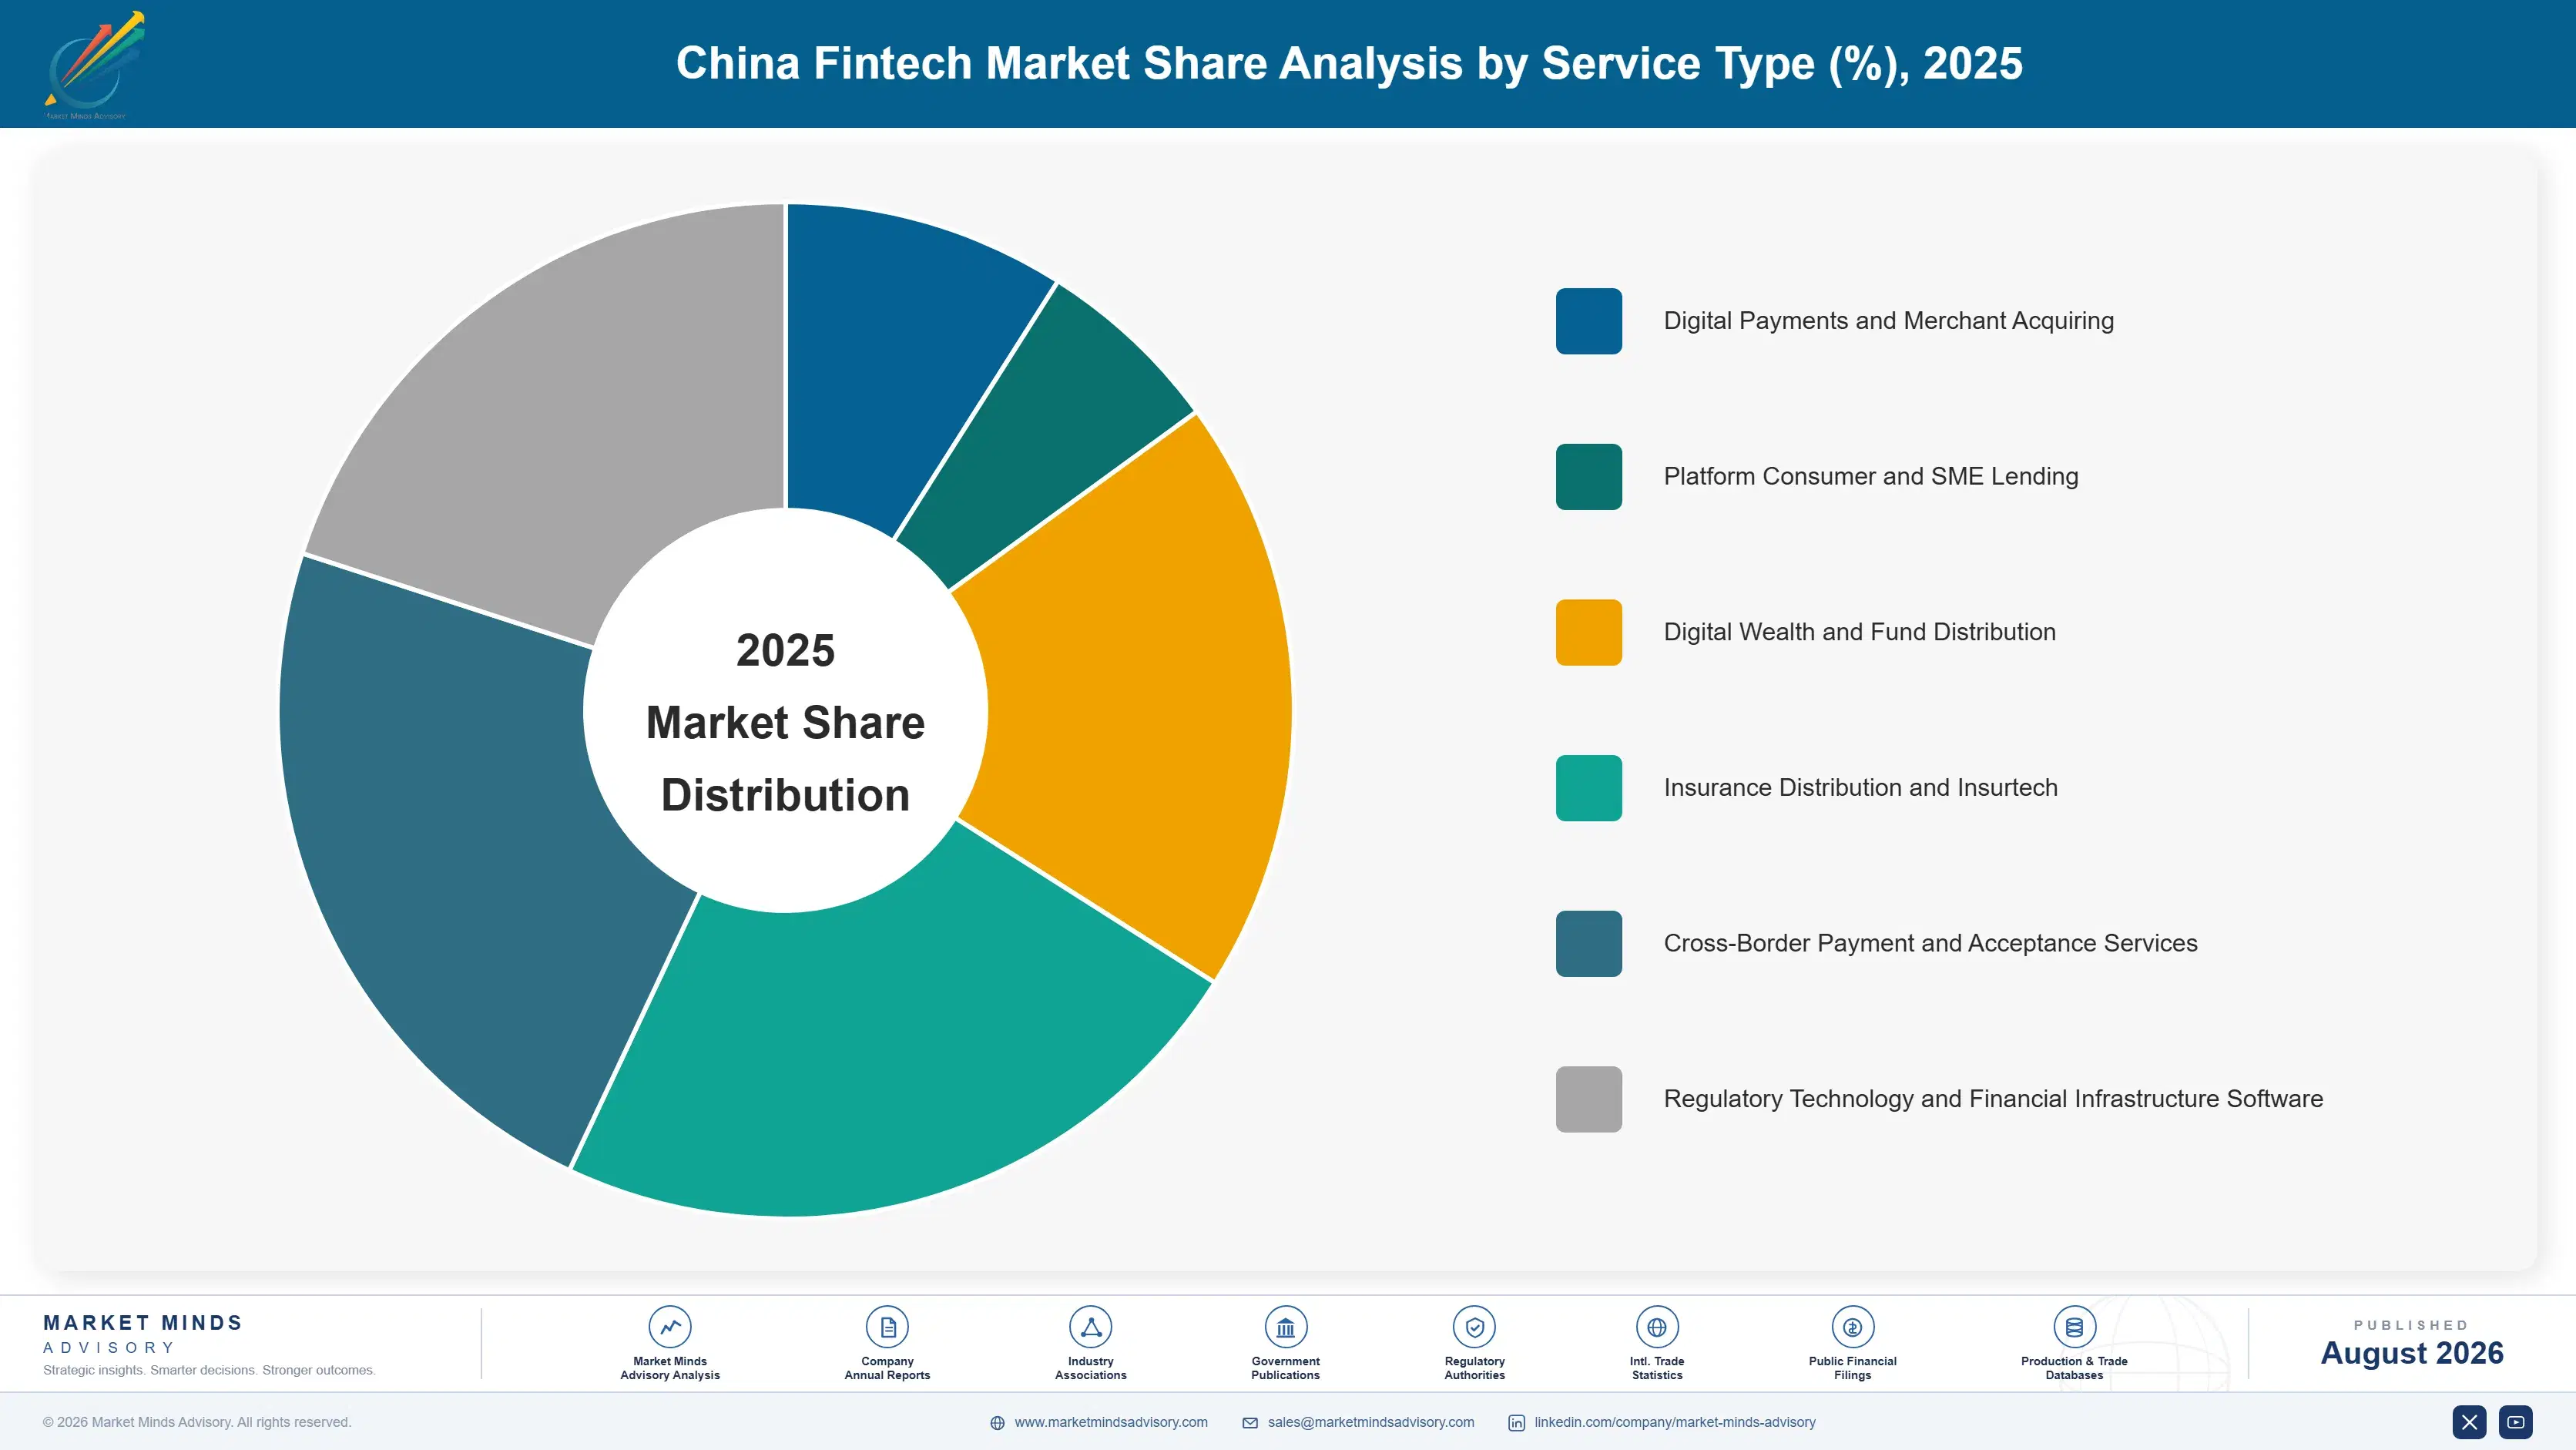
Segmentation follows service type, since regulatory treatment, capital requirement and revenue model all differ by service rather than by customer or channel. Six categories cover the market without overlap. Customer segment, distribution channel and licence type are treated as separate commercial dimensions throughout this report rather than as segmentation logic in their own right.
china-fintech-market-market-share-analysis-1787913351115

Cross-Border Payment and Acceptance Services

Cross-border services grow at 13.2%, half again the market rate of 8.8%, on acceptance infrastructure and wallet interoperability expanding across Southeast Asian markets where the technology is welcome and the commercial terms suit local partners. Indonesia grows fastest at 10.8%. Nothing about this expansion depends on the domestic regulatory position changing, which is precisely why it has continued growing while almost every domestic segment was being reshaped by supervision at the same time. Acceptance infrastructure and local partnership arrangements carry the revenue rather than any consumer relationship, which makes this a genuinely different business from the domestic one and considerably less exposed to anything a domestic supervisor might decide next.
CAGR 13.2%

Regulatory Technology and Financial Infrastructure Software

Compliance and infrastructure software grows at 12.6% because converting platforms into supervised financial holding companies created reporting, capital calculation and risk management obligations that technology firms had built nothing for previously. Demand comes from institutions that must comply rather than from anybody choosing to improve, which makes it dependable and largely insensitive to commercial conditions. Domestic vendors dominate, since requirements are specific to a single regulatory framework and revised often enough that foreign products cannot keep pace. Selling capability originally built for a provider's own supervision turns a mandatory internal cost into external revenue, though productising work designed for one organisation is considerably harder than most participants expect it to be.
CAGR 12.6%
Full segment breakdown across 6 segments available in the complete report.

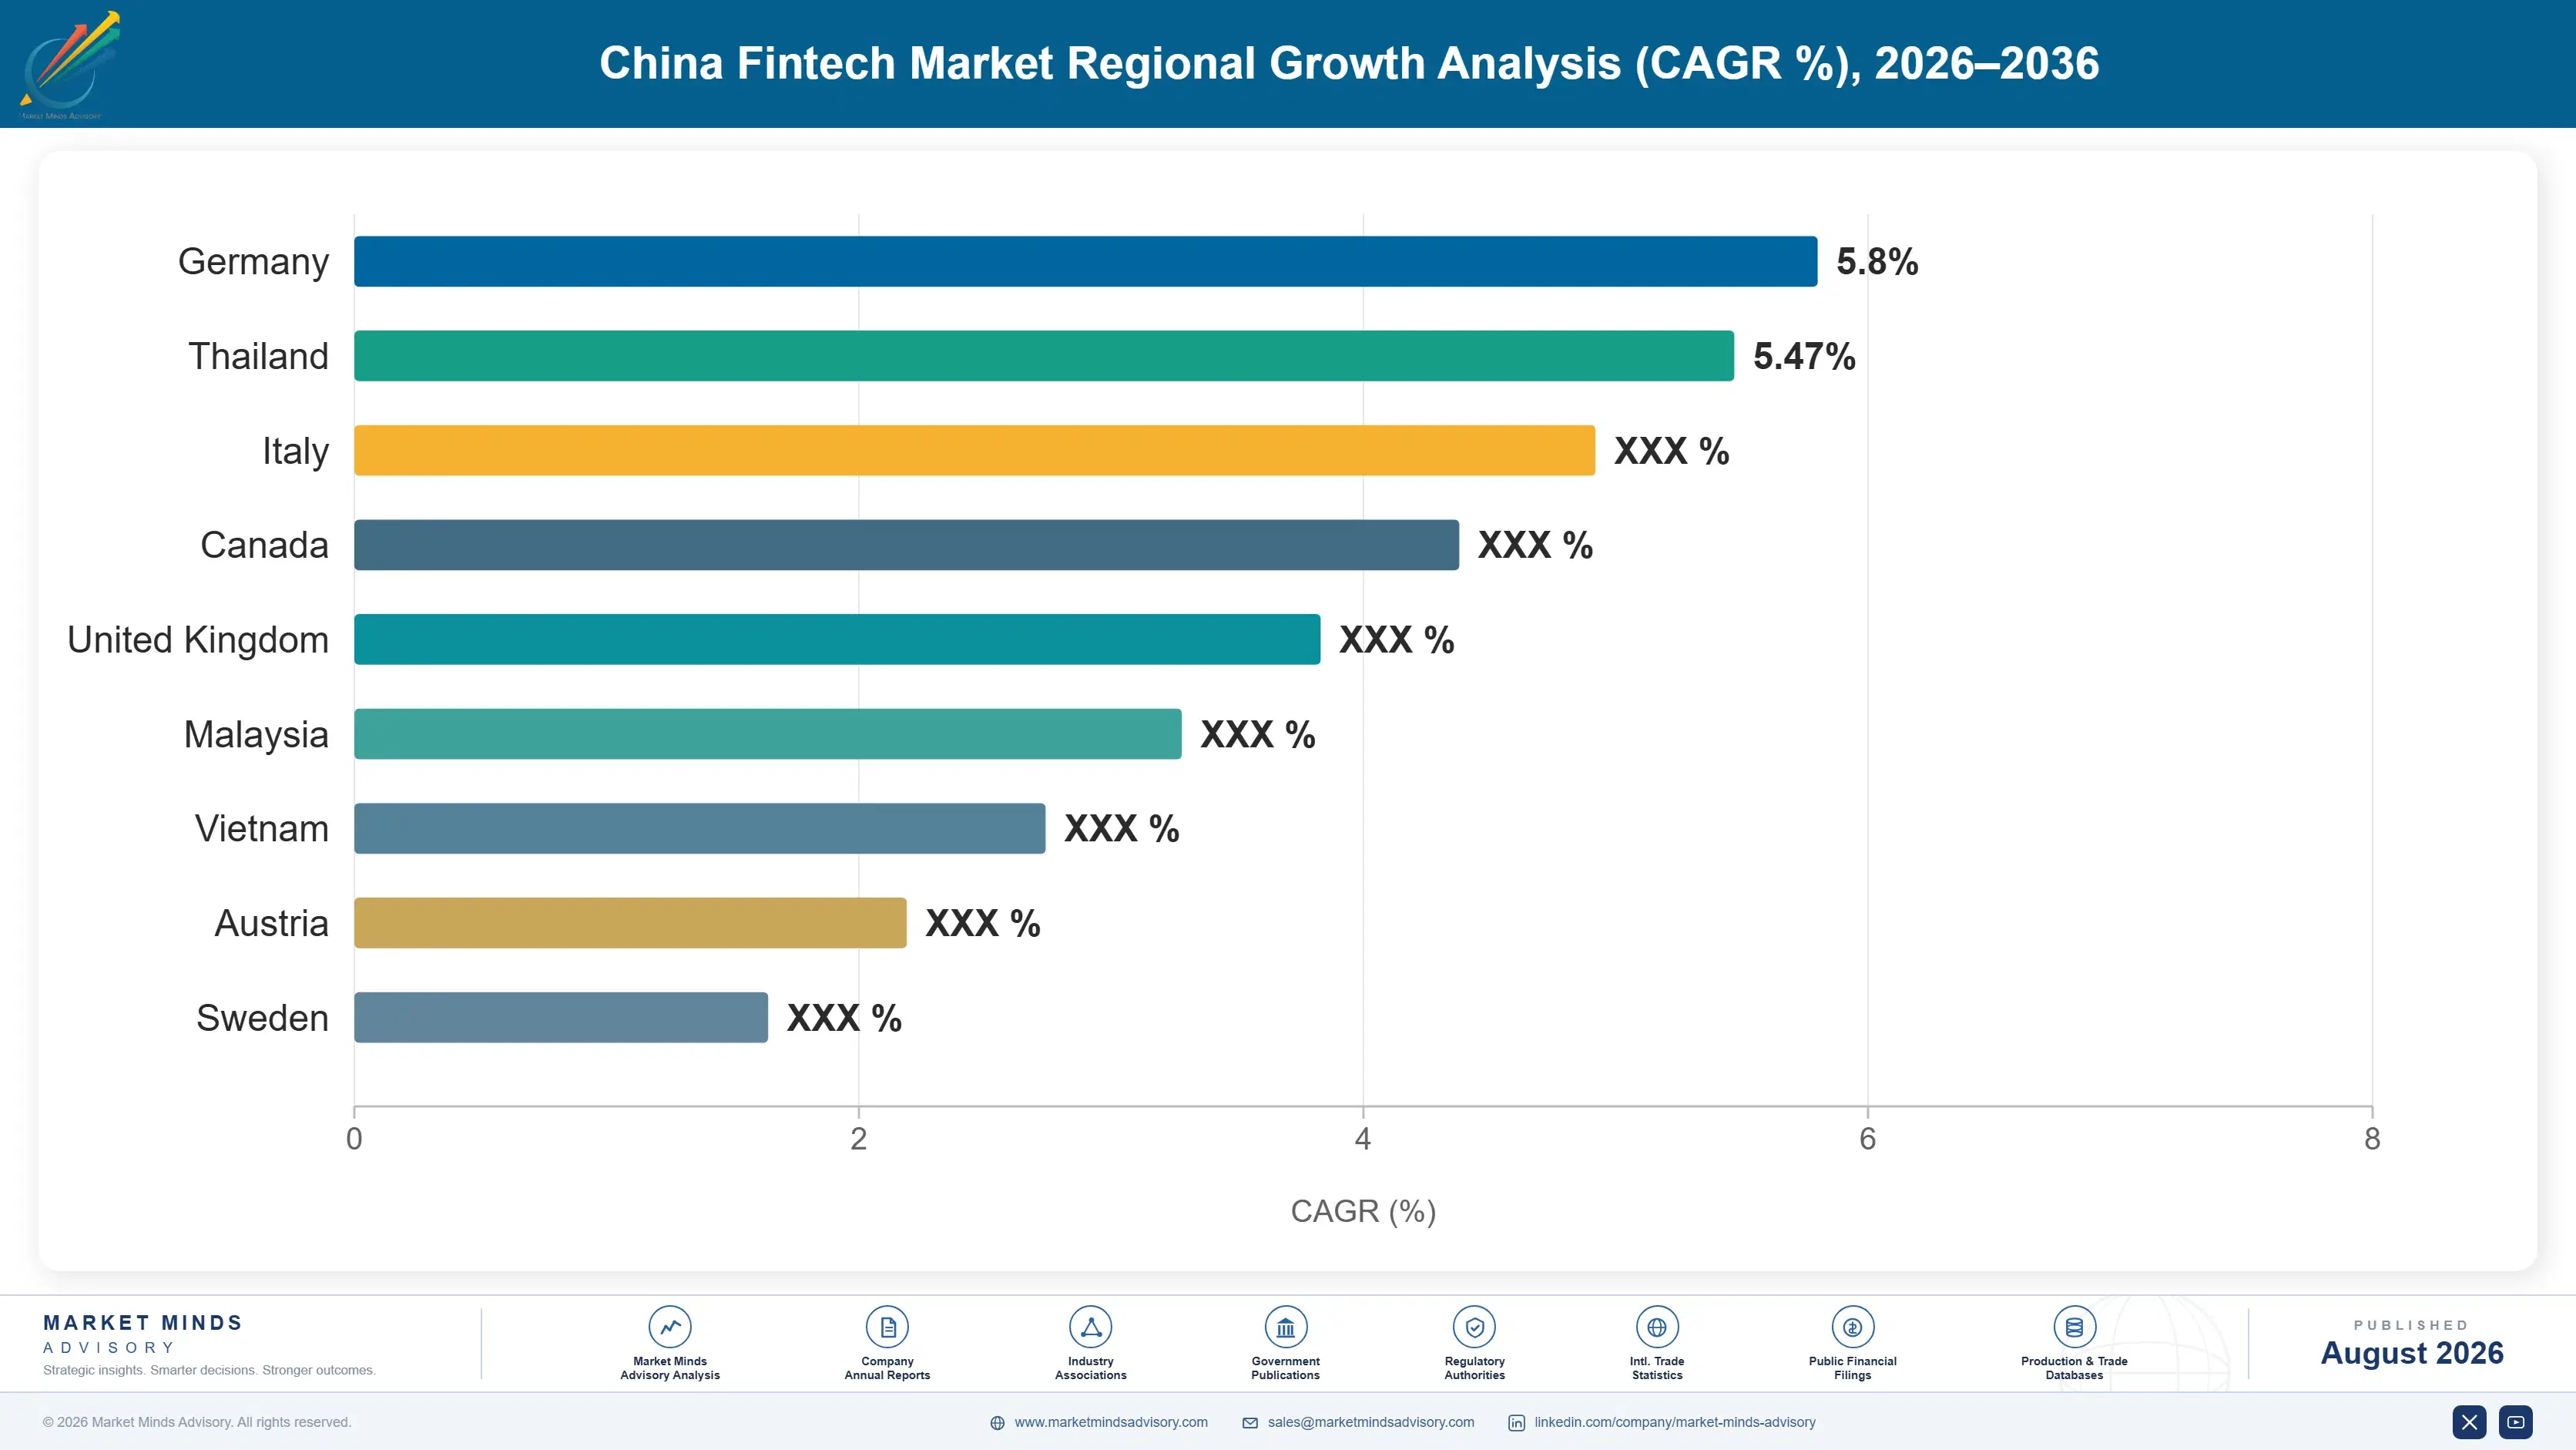
Regional Architecture and Country Demand Map

This is a single-country market, so regional distribution reflects where the revenue of Chinese financial technology providers is actually generated rather than where any technology happens to originate. Domestic activity dominates here in a way that no genuinely multinational participant would ever manage to produce.

North America

Share sits at 10%, far below the standard regional band, because this is a single-country market and domestic revenue dominates every participant's accounts. That justification is definitional rather than analytical. Activity here is limited to merchant acceptance for Chinese travellers and shoppers, cross-border settlement for trade flows, and technology licensing arrangements. Regulatory and political sensitivity around Chinese financial technology has restricted expansion considerably, and several providers have concluded the market is not practically available to them. Business payment services supporting trade flows in both directions represent the more durable proposition here, since they solve a genuine settlement problem for companies on both sides rather than depending on any consumer relationship that could be politically reconsidered.
Share: 10% | CAGR: 7.6% (2026 to 2036)

Western Europe

Share sits at 10%, below the standard regional band, for the same definitional reason. Acceptance for Chinese travellers is the principal activity, concentrated in luxury retail, hospitality and duty-free where transaction values justify the integration work. Cross-border business payment services for European exporters selling into China have grown steadily and represent the more durable proposition. Regulatory scrutiny of data handling under European privacy rules constrains what any provider can offer without substantial local arrangement. Traveller acceptance volumes recovered slower than most operators expected after travel resumed, and several providers have concluded that the merchant integration effort involved is difficult to justify outside the small number of locations where transaction values are genuinely large.
Share: 10% | CAGR: 7.2% (2026 to 2036)
Regional intelligence for 5 additional markets available in the complete report: East Asia, South Asia and Pacific, Latin America, Middle East and Africa, Eastern Europe. Contact sales@marketmindsadvisory.com.
china-fintech-market-country-cagr-analysis-1787913351624

Capital, Corridors And Compliance Together

Co-lending requires 30% own funding, merchant fees run near 0.5%, mobile payment reaches 87% of adults monthly and cross-border grows at 13.2%. Four levers work on capital efficiency, corridor expansion, compliance demand and distribution defence rather than on domestic lending volume, which capital rules have in any case already placed a firm ceiling over.

Solve The Capital Problem Rather Than Avoid It

Holding 30% of every co-lent loan makes balance sheet capacity the binding constraint on lending growth, and no improvement in underwriting removes that ceiling. Banking licences, securitisation programmes and genuine risk-sharing partnerships all address it directly. Platforms still structuring arrangements designed to look like arranging while functioning as lending are managing a supervisory relationship rather than a business, and supervisors have shown remarkably little patience for exactly that game. The rule was not written to be worked around and it has not been worked around by anybody yet at all.
Market Impact: Funds the full required 30% loan share properly

Expand Corridors Where The Technology Is Welcome

Cross-border acceptance and wallet interoperability grow at 13.2% across markets that want the infrastructure and offer local partners commercial terms they like. Indonesia grows fastest at 10.8%. Nothing about that expansion depends on domestic regulatory conditions changing. Providers concentrating effort where political reception is favourable build durable positions, while those pursuing markets that have already restricted Chinese financial technology are spending against an outcome already decided. Political reception decides more of this than commercial merit does, and several very large markets were closed to these providers by decisions nobody in the business participated in.
Market Impact: Grows the corridor revenue base at 13.2% annually

Sell Compliance Capability To Newly Supervised Institutions

Converting platforms into supervised financial holding companies created reporting, capital calculation and risk management obligations that technology firms had built nothing for, and that demand grows at 12.6% from institutions with no choice about buying. It is dependable revenue largely insensitive to commercial conditions. Domestic vendors hold it because requirements are framework-specific and revised often enough that anything built abroad falls behind within a year. Every converted platform built this capability at considerable expense during a period when revenue growth had already slowed, which makes selling it onward an unusually straightforward decision.
Market Impact: Grows the compliance software line at 12.6% annually

Defend Wallet Position Against The Official Currency

The official digital currency operating across 26 pilot locations settles between the central bank layer and users directly, bypassing the payment networks that currently provide free universal distribution reaching around 87% of adults. Integrating it as a wallet option preserves the customer interface even where the underlying rail changes. Losing the interface means paying to reach customers who currently arrive for nothing, which would reprice every product sold through them. Habit and merchant acceptance protect the interface even where the rail underneath it is being quietly replaced beneath them entirely.
Market Impact: Protects the reach across 87% of all adults

Who Controls the Margin Pool

Measured on disclosed fintech and financial services segment revenue, the five largest providers hold a CR5 of 61%, the highest of any major fintech market and resting on two payment networks that between them reach the overwhelming majority of adults. Ant Group and Tencent carry those networks and the products attached to them, JD Technology holds substantial supply chain and consumer positions, and Lufax and Du Xiaoman hold meaningful lending franchises. Nobody outside that group holds a payment network reaching anything close to the same share of the population.
Three contests define activity. Payments competes for wallet position rather than fee income. Lending competes on funding capacity now that data advantage has largely gone. Cross-border competes on local partnership terms and political reception. The three contests reward completely different things, and only the largest two participants compete seriously across all of them.

Pressure builds from banks recovering underwriting position as balance sheet matters more than dataset. Rankings shift toward whoever holds capital and licences rather than whoever holds the most user behaviour data. Data advantage was the founding premise of this whole sector and it has largely been legislated away.
china-fintech-market-company-positioning-matrix-1787913352145

Competitive Moat and Risk Dimensions

ANT GROUP

Moat: Payment Network And Merchant Reach

A payment network reaching most adults and most merchants provides distribution that no competitor can buy at any price, because the two-sided position took a decade of subsidy and merchant recruitment to establish. Every financial product the group sells reaches customers through it for effectively nothing. That distribution survived the regulatory reset entirely intact.
ANT GROUP

Risk: Capital Requirements On Lending Growth

Funding 30% of every co-lent loan converts lending expansion into a capital question that distribution reach does not answer, and the returns available on a capital-heavy lending business are simply nothing like those on an arranging fee. Growth now depends on balance sheet rather than on reach, which reverses the advantage the group was built around.
TENCENT

Moat: Messaging Integration And Daily Frequency

Payment embedded inside a messaging platform used continuously throughout the day produces transaction frequency and habitual use that a standalone financial application cannot approach. Social transfer between individuals drove adoption in a way merchant payment alone never would have. That integration is genuinely unrepeatable, since it depends on owning the communication layer rather than on any financial capability at all.
TENCENT

Risk: Financial Products Restricted Repeatedly

Wealth distribution, insurance sale and consumer lending have each faced tightened rules, and the group's financial revenue depends on selling those products across its distribution rather than on the payment itself. Restrictions strike the monetisation layer while leaving the reach untouched, which is an uncomfortable position to hold indefinitely.

Players Tracked

Prominent Players

Ant Group
Tencent
JD Technology
Lufax
Du Xiaoman

Other Key Players

WeBank
MYbank
Qifu Technology
LexinFintech
FinVolution Group
Yiren Digital
OneConnect
Yeahka
Lakala Payment
PingPong
XTransfer
ZhongAn Online
Baidu
Meituan
ByteDance

Recent Developments

MARCH 2025

Platform lender expands securitisation programme to fund co-lending share

A platform lender expanded its asset-backed securitisation programme to fund the portion of co-lent loans it is required to hold on balance sheet. This was a funding structure decision rather than any change in origination model, and it addresses a capital constraint rather than removing it.
Signal: Capital efficiency has now replaced origination volume as the metric that actually matters here at all.
AUGUST 2025

Wallet interoperability extended to further Southeast Asian operators

Wallet interoperability arrangements were extended to additional Southeast Asian payment operators, allowing cross-recognition of acceptance across participating markets. This was a partnership expansion rather than any acquisition, and it grows corridor volume without requiring any domestic regulatory change of any kind whatsoever at all anywhere.
Signal: Corridor growth here continues regardless of whatever happens next to the domestic regulatory position at all.
NOVEMBER 2025

Official digital currency pilot extended to additional locations and use cases

The official digital currency pilot was extended to further locations alongside additional public sector and salary disbursement use cases. This was a policy implementation step rather than any commercial development, and it settles directly between the central bank layer and the end users of it themselves.
Signal: The distribution layer that everything else here depends upon is now being quietly built around entirely.

Capital, Compliance, Acquisition

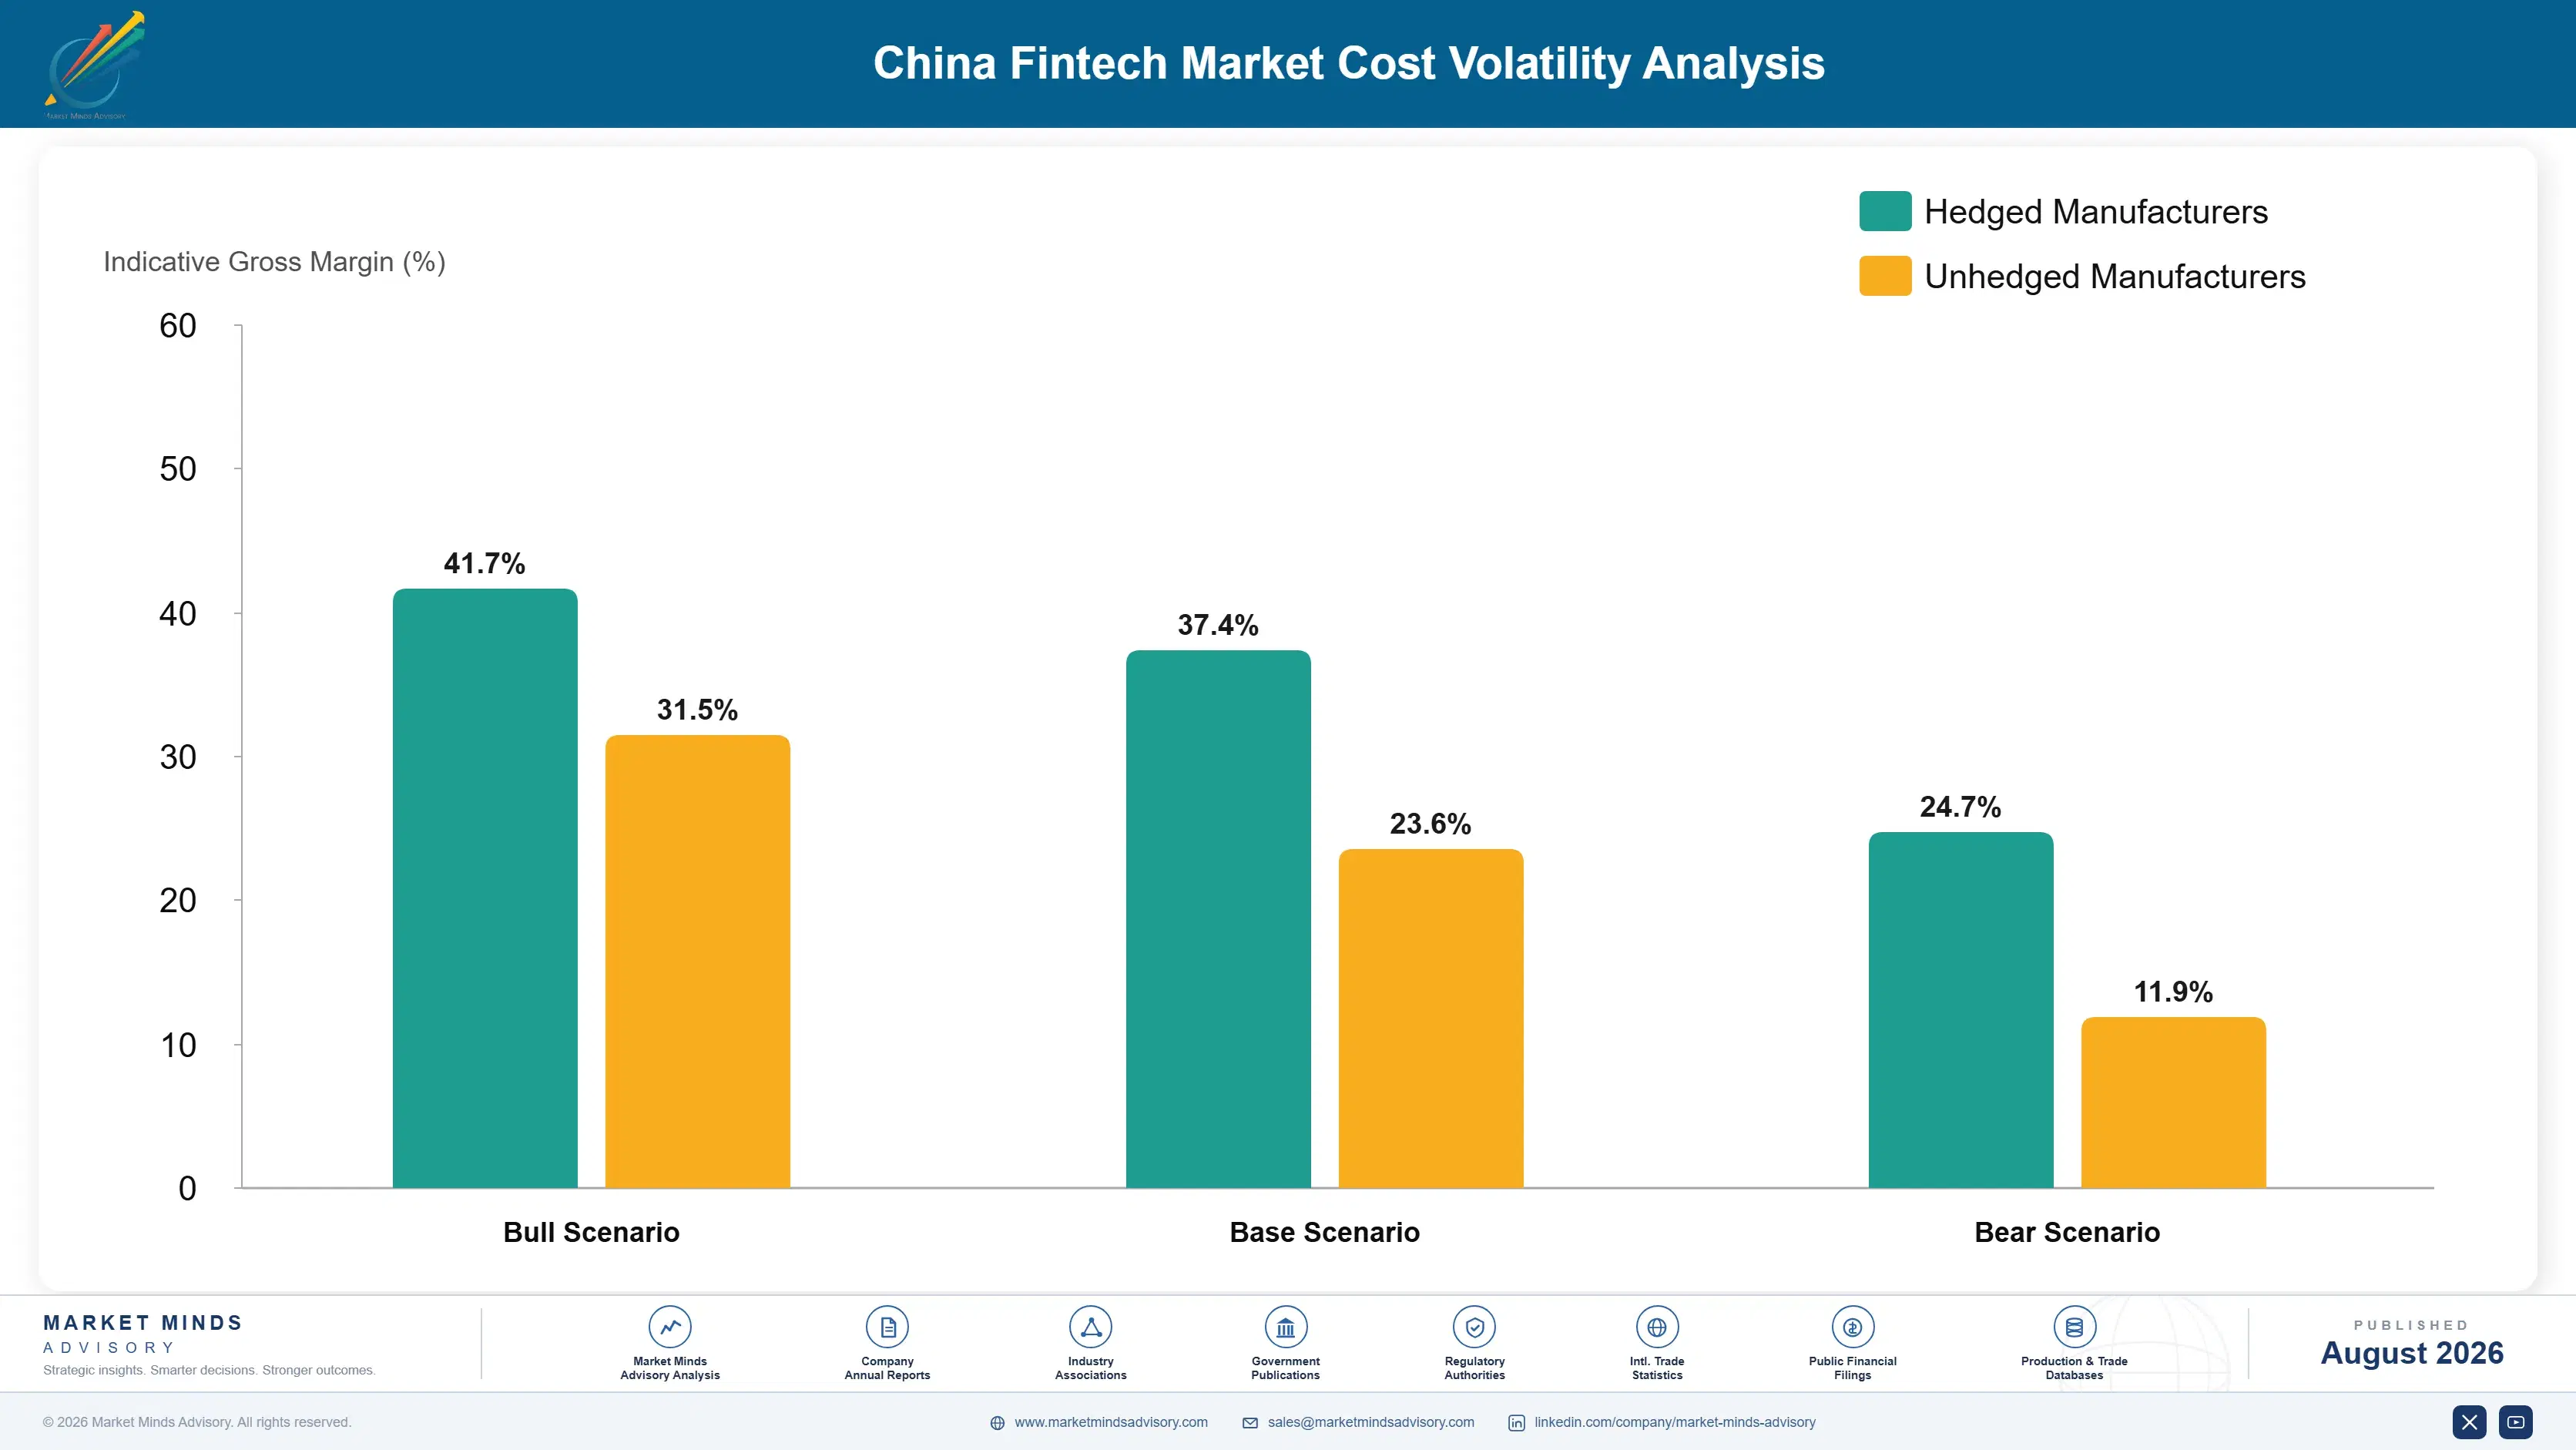
Three costs dominate. Funding and credit provision on retained loan balances, compliance and licensing operations under supervised status, and technology infrastructure with customer acquisition together account for 66 to 79% of revenue at a typical provider. Capital cost has moved most, since holding 30% of co-lent balances converted a fee business into one requiring genuine balance sheet, and the returns available differ enormously between those two positions.
Regulation did what markets did not. Online micro-lending rules, financial holding company conversion and licensed credit reporting routing arrived in sequence from 2020, and People's Bank of China implementation materials document each step. Compliance headcount and capital both rose sharply while revenue growth slowed. Tencent Annual Report 2024 and Lufax Annual Report 2024 disclosures describe the resulting financial services cost environment across quite different business mixes.

Exposure divides by licence position rather than by technology capability. Providers holding banking licences fund from deposits and hold a cost advantage that no platform efficiency closes. Those funding retained balances from wholesale markets carry spread widening exactly when credit conditions worsen. Pure software providers avoid capital cost entirely and accept far smaller revenue, which several participants now regard as the better position.
china-fintech-market-cost-volatility-analysis-1787913352339

Acquire deposit funding rather than borrowing wholesale

Retained co-lending balances of 30% require funding, and wholesale spreads widen precisely when credit conditions deteriorate and the balances most need supporting. Banking licences bring supervision, capital requirements and considerable operational obligation. They also bring deposit funding that no amount of platform efficiency substitutes for on a genuinely capital-heavy lending book of this particular kind.

Build compliance capability as a product, not a cost

Supervised status created reporting, capital calculation and risk management obligations that every converted platform had to build from nothing at considerable expense. Selling that capability to other newly supervised institutions turns a mandatory internal cost into external revenue growing at 12.6%. It requires productising work built for one organisation, which is genuinely harder than it sounds.

Concentrate corridor investment where reception is favourable

Cross-border expansion succeeds where local partners want the infrastructure and political reception permits it, and fails entirely where restrictions have already been imposed regardless of any commercial merit. Concentrating investment accordingly means abandoning markets that look attractive on size alone. It avoids spending against outcomes that were decided by somebody else a long time ago.

Portfolio Architecture for Margin Defence

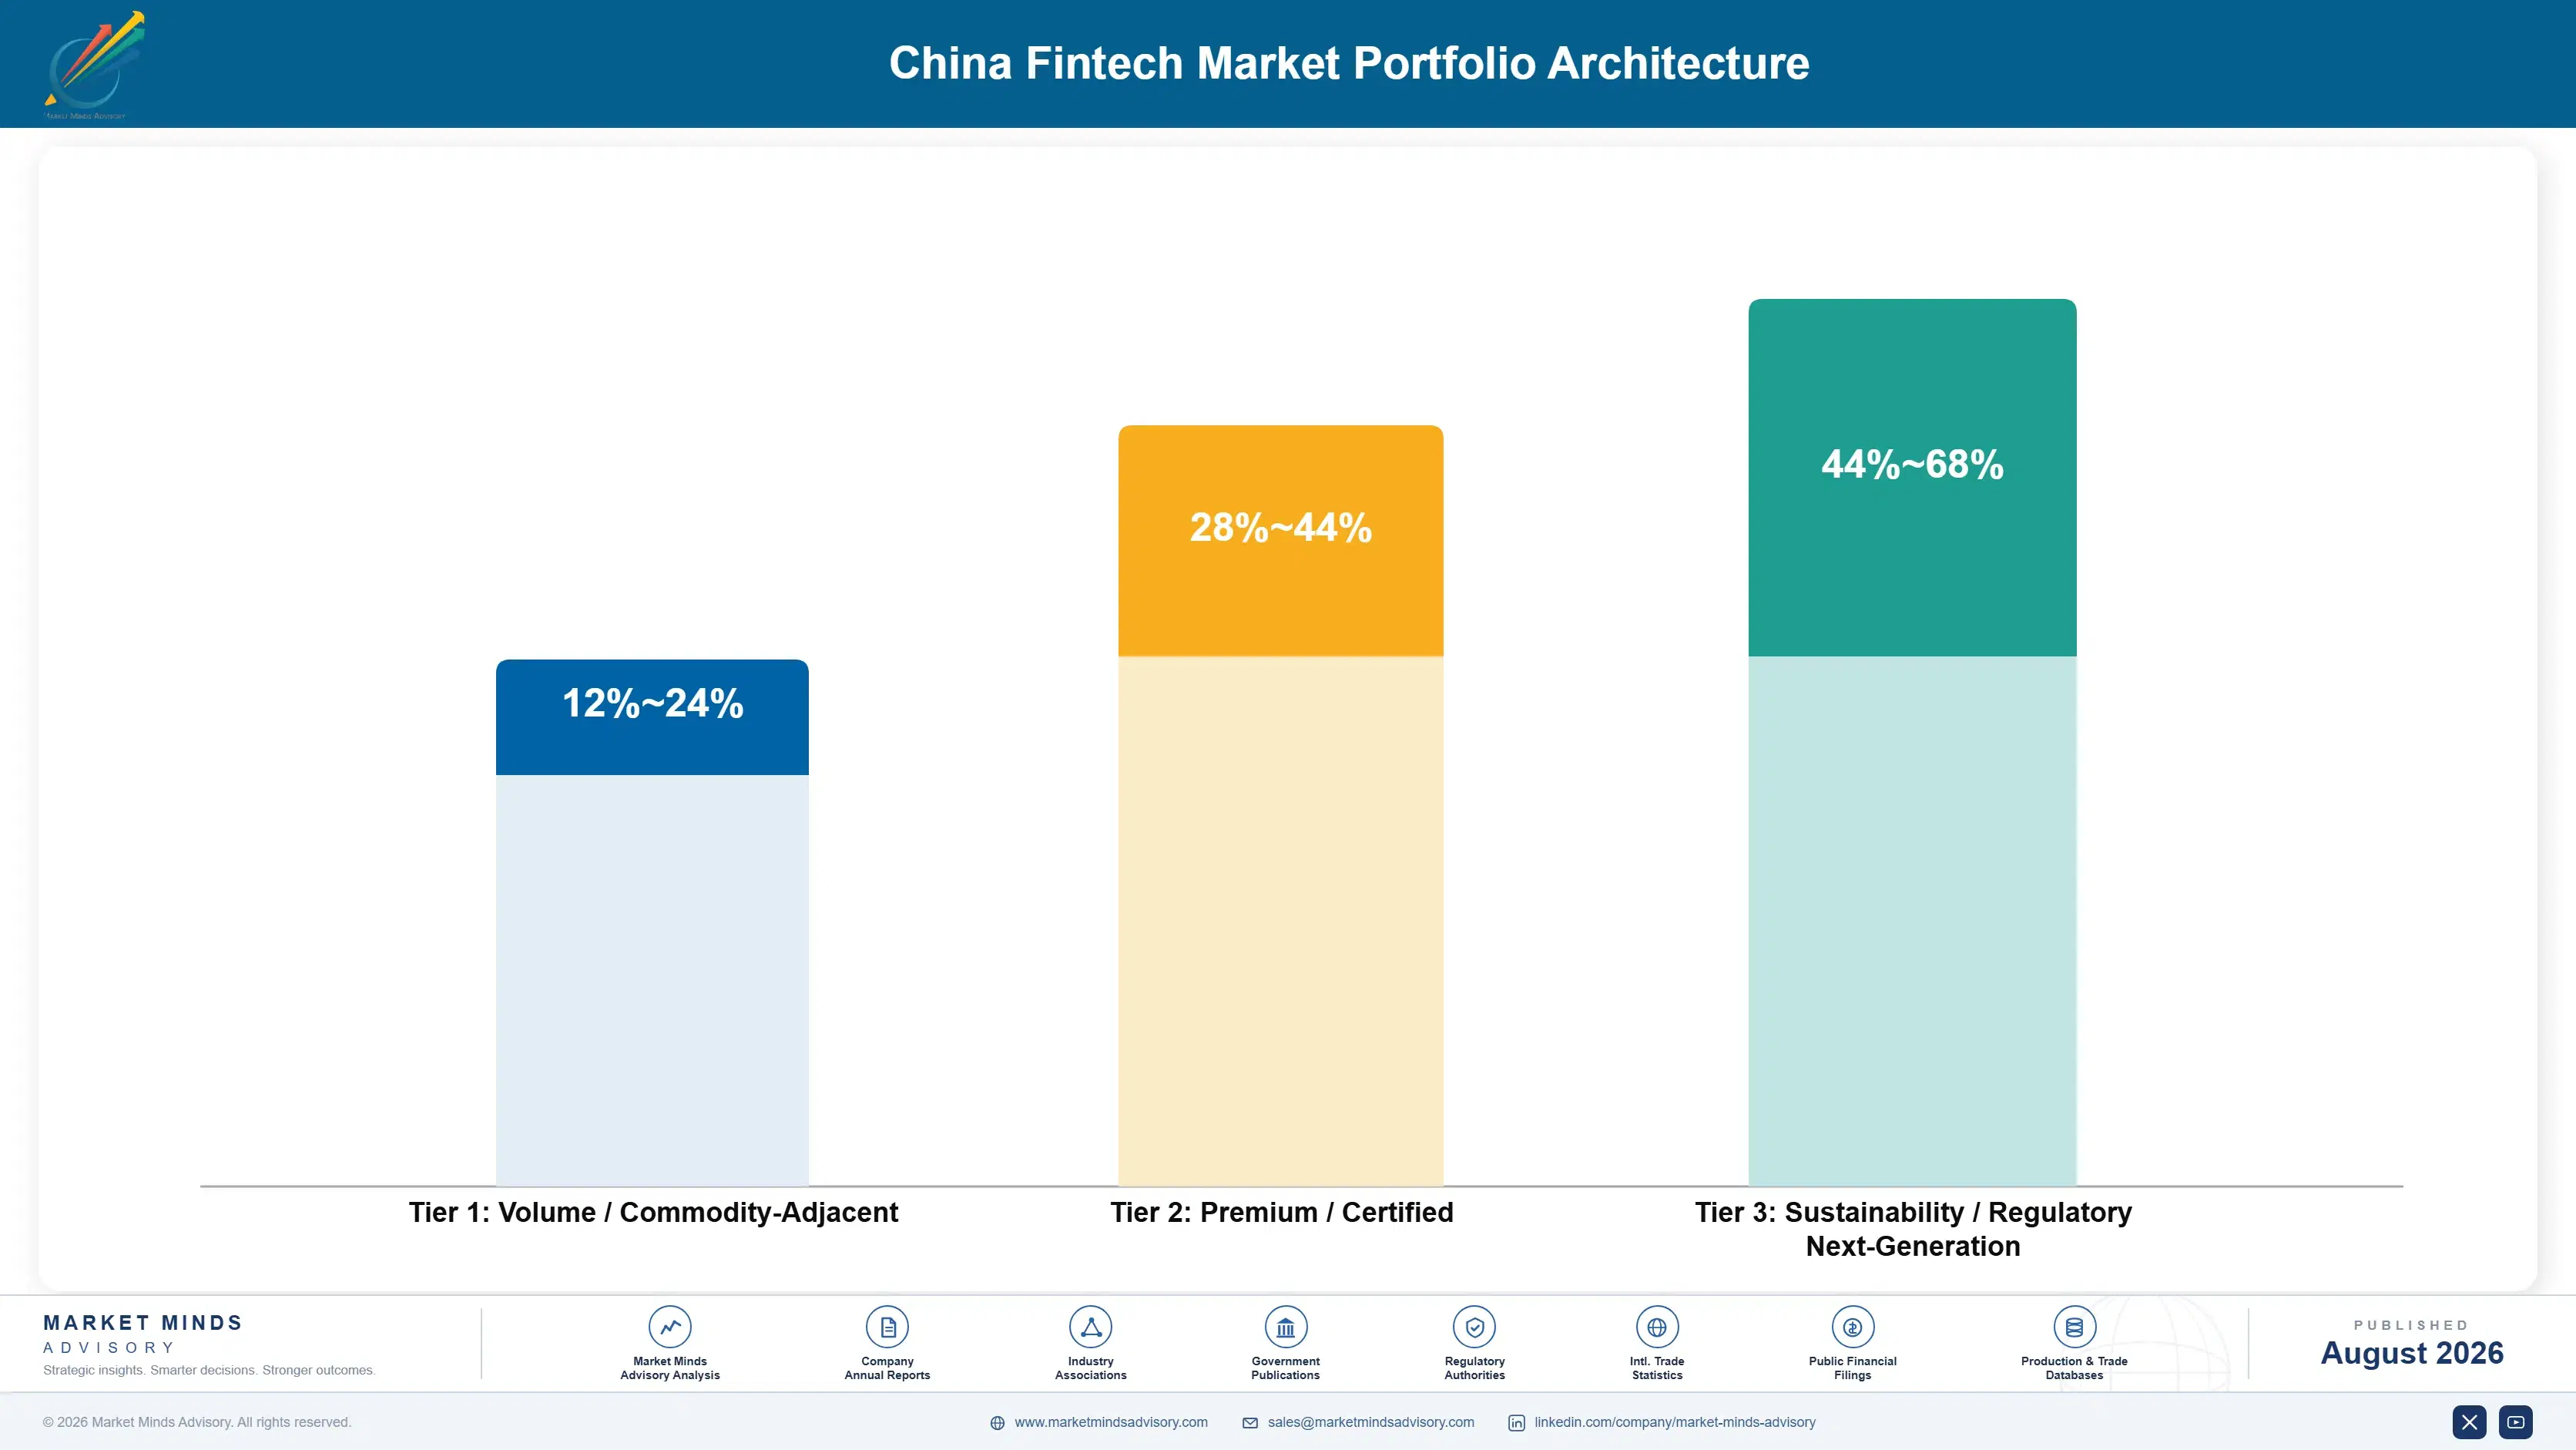
Margin follows capital intensity inversely, which is the clearest lesson of the past five years. Digital payments earns almost nothing directly at fees near 0.5%. Platform lending earns moderately now that 30% of balances sit on the books. Digital wealth distribution earns reasonably on fund fees. Insurance distribution earns well on commission without underwriting risk. Cross-border services earn better on corridor economics. Infrastructure software earns best, on obligation rather than choice.
The tension is that the business with universal reach makes no money and the businesses that make money depend entirely on it. Payments touches around 87% of adults monthly and earns nearly nothing, functioning as free distribution for everything else. Every restriction on lending, wealth and insurance therefore strikes the profit while leaving the reach intact, and the reach cannot be monetised on its own at fees this low.

High-value pools sit in three places. Infrastructure and compliance software, bought by institutions with no choice and growing at 12.6%. Cross-border corridors where reception is favourable and nothing depends on domestic conditions. And insurance distribution, which earns commission without carrying underwriting risk or the capital that goes with it.

Volume / Commodity-Adjacent

Digital payments and merchant acquiring at fees near 0.5% of transaction value across enormous volume. The 12-point range separates providers with wallet distribution from those supplying acquiring services into merchants without any consumer relationship.
Gross Margin: 12-24%

Premium / Certified

Platform lending and digital wealth distribution carrying capital requirements and supervised product restrictions respectively. The 16-point spread reflects how differently retained lending balances and fee-based fund distribution perform under current rules.
Gross Margin: 28-44%

Sustainability / Regulatory / Next-Generation

Infrastructure software, insurance distribution and cross-border corridor services carrying no lending capital requirement at all. The 24-point range is wide because obligation-driven software and commission-based distribution earn on entirely different structures.
Gross Margin: 44-68%
china-fintech-market-portfolio-architecture-1787913352862

High-value Sub-segments and Strategic Watch-out

Compliance And Infrastructure Software

Highest margin and near-fastest growth at 12.6%, bought by supervised institutions with no choice about compliance and no realistic foreign alternative available. The risk is that requirements change often enough to demand continuous rebuilding at the vendor's own expense. And the vendor pays for all of that.
Gross Margin: 56-68%

Cross-Border Corridor Services

Strong economics growing at 13.2% in markets that welcome the infrastructure and where nothing depends on domestic regulatory conditions changing. The risk is political reception shifting, which has already closed several large markets entirely to these providers. Political reception decides rather more than merit here.
Gross Margin: 46-60%

Digital Payment Volume

The volume core reaching around 87% of adults monthly and earning almost nothing directly at current fee levels. Providers hold it because it is the free distribution layer, not because payments themselves make any money. Nothing about the payments themselves actually makes any real money.
Gross Margin: 14-26%

Capital-Constrained Platform Lending

The strategic watch-out. Funding 30% of every co-lent loan makes growth a balance sheet question rather than a technology one. The risk is competing against banks on the one dimension where banks have always been stronger. Banks have always been rather stronger on precisely that.
Gross Margin: 24-36%

Free Reach, Expensive Products

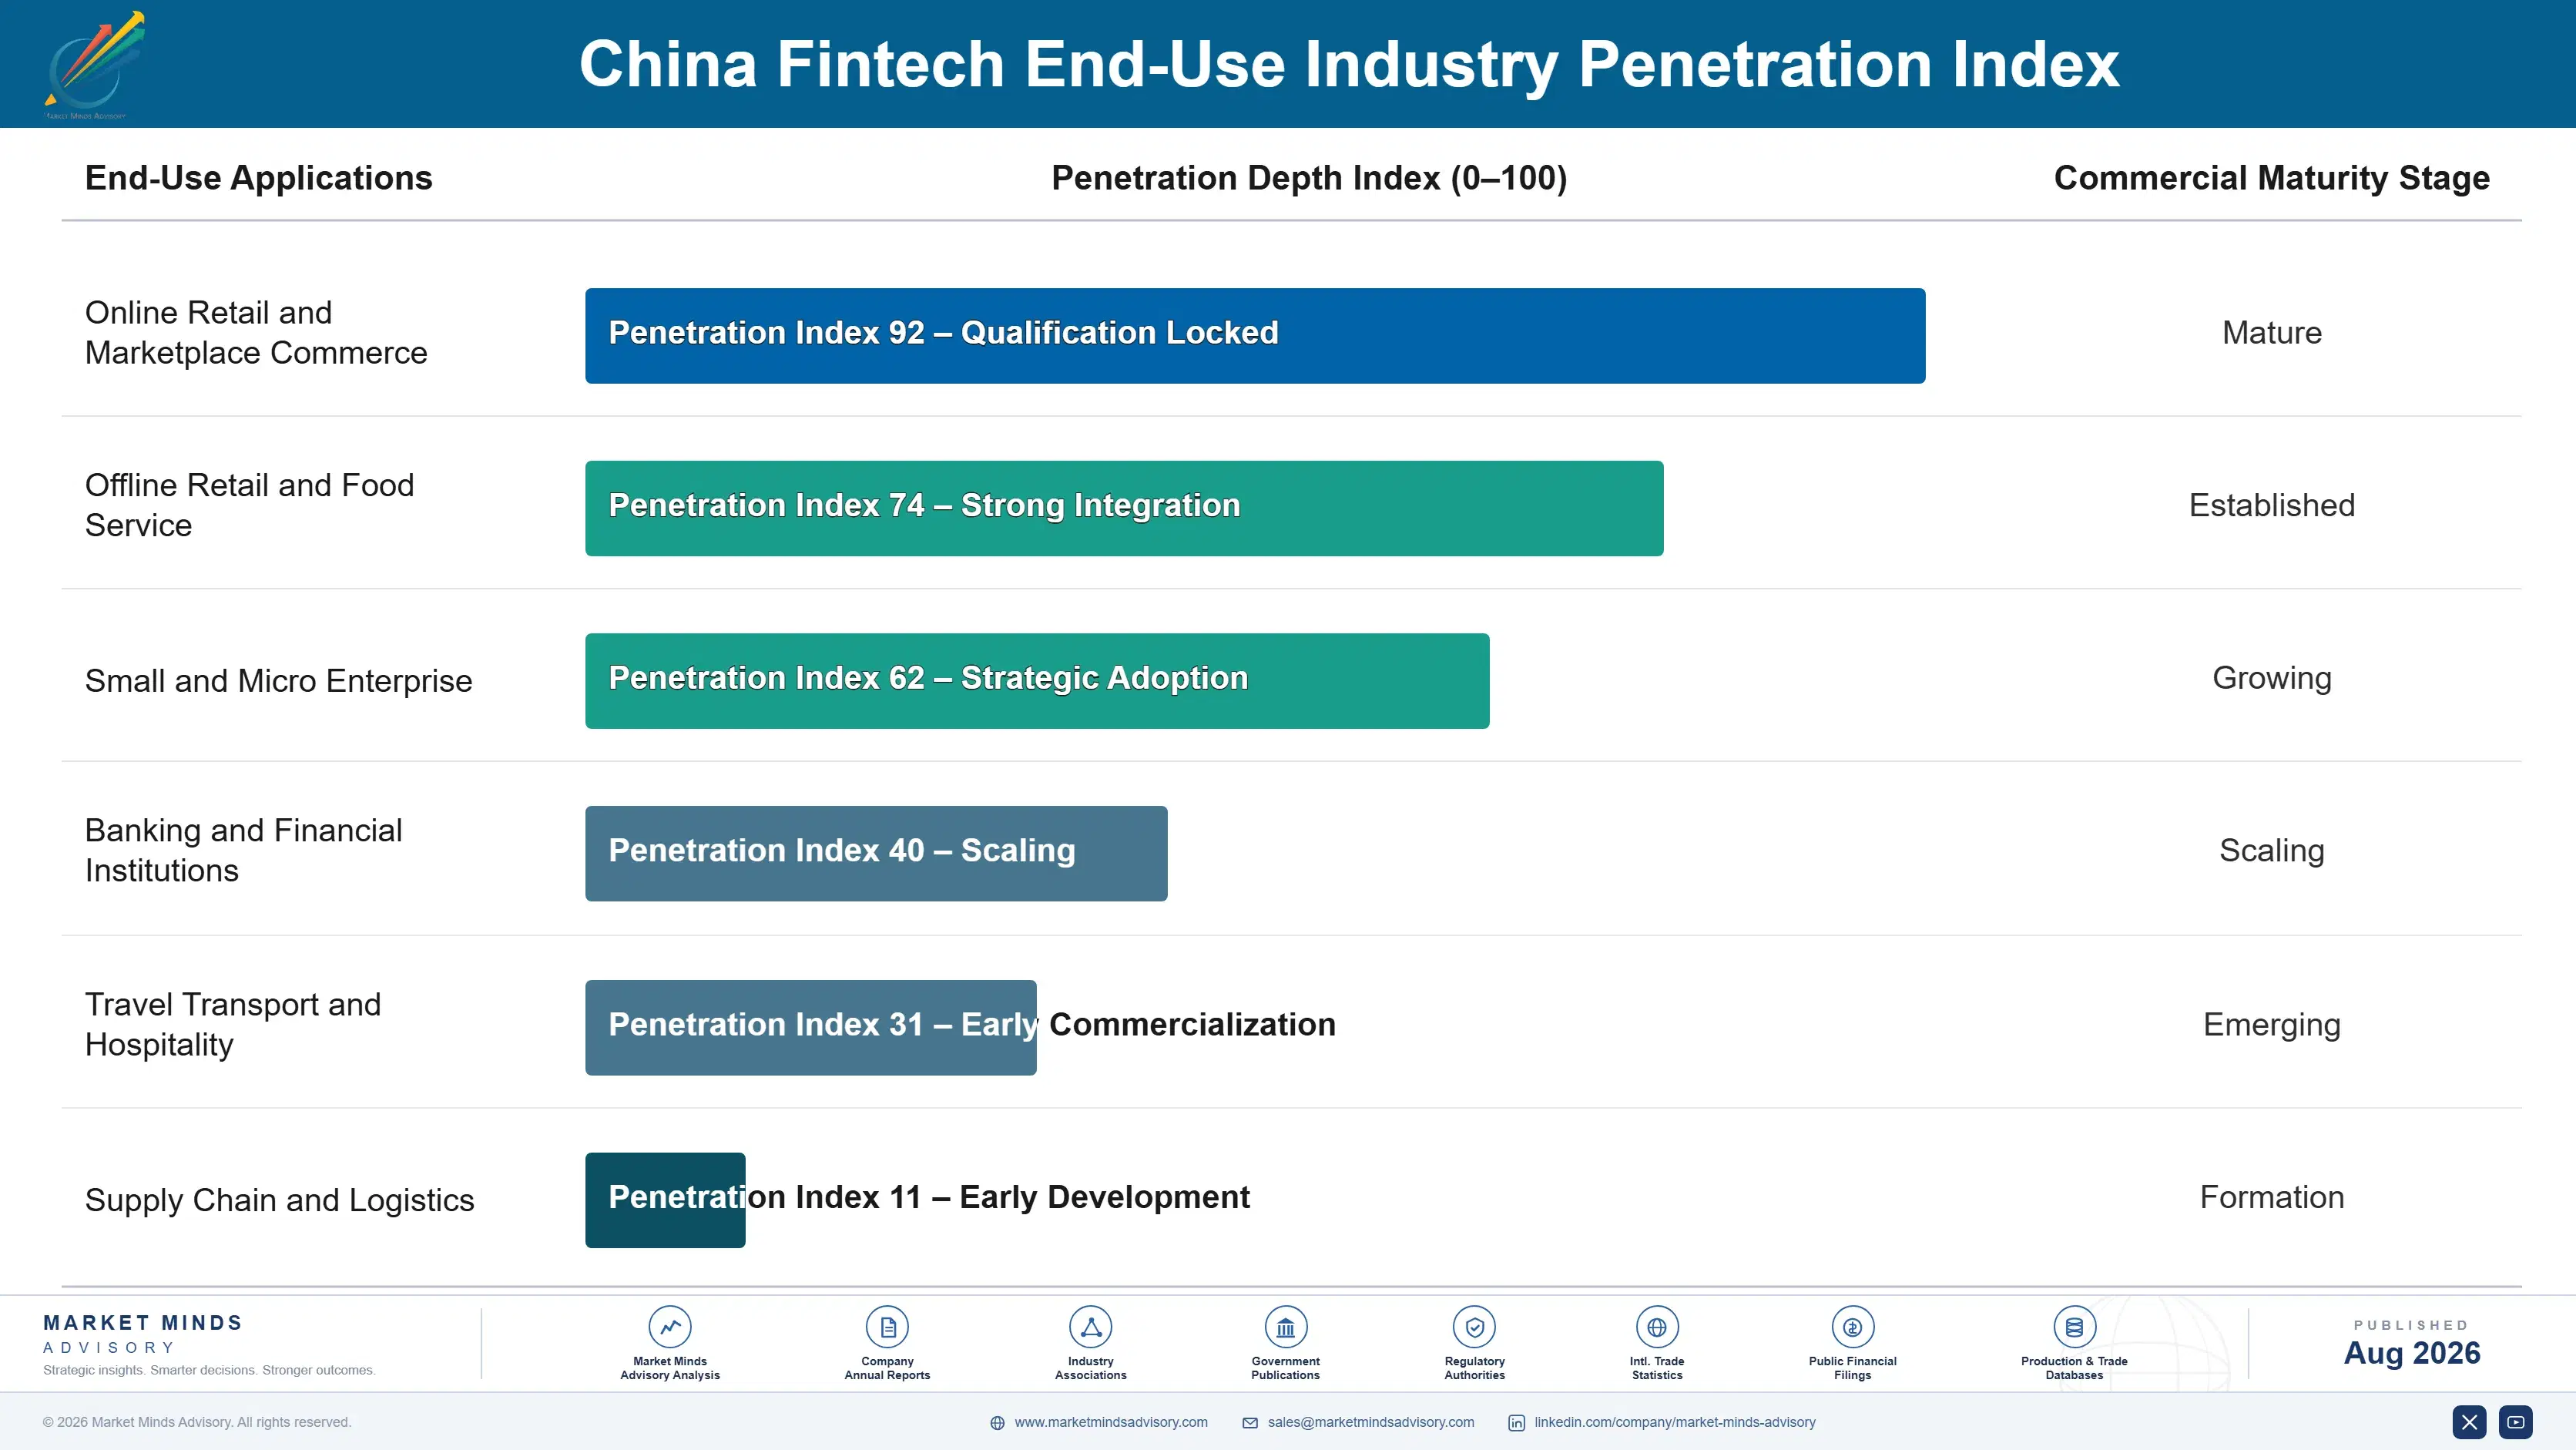
Annuity economics here are unusually strong on the distribution side and unusually fragile on the revenue side. Payment usage recurs daily among around 87% of adults, generating habitual engagement no competitor can buy, and that engagement costs almost nothing to maintain once established. What is fragile is what gets sold across it, since every product carrying real margin has faced tightened rules at least once and can face them again without warning.
Stickiness varies dramatically by service. Payment position is extremely sticky through habit and merchant acceptance, and remains so unless the underlying rail itself changes. Lending relationships are considerably less sticky now that credit data routes through licensed bureaus and any institution can see the same file. Infrastructure software is sticky through integration and regulatory dependency, which is a durable combination few other segments here can claim.

The buyer has changed in a way outsiders rarely appreciate. Consumers once chose products inside an application with very little friction and almost no comparison. Supervised distribution rules introduced suitability requirements and disclosure obligations that slowed that considerably. Meanwhile the institutional buyer arrived, since newly supervised platforms now purchase compliance capability the way any regulated financial institution does.
china-fintech-market-end-use-penetration-index-1787913353347

Capital Now Decides Growth

These are among the four positions where our research anticipates prominent divergence between winners and laggards over the coming forecast period. Each is grounded in the demand model, the regulatory perimeter, and the announced capacity pipeline.
01 / CAPITAL STRUCTURE RESOLUTION

Thirty percent is a balance sheet problem

Funding at least 30% of every single co-lent loan converts lending expansion into a capital question that no improvement in underwriting or in distribution reach can possibly answer on its own. Banking licences, securitisation programmes and any genuine risk-sharing partnerships each address it directly and each carries a real cost of its own. Platforms still structuring arrangements designed to look like arranging while actually functioning as lending are managing a supervisory relationship rather than building any real business at all.
02 / CORRIDOR SELECTION DISCIPLINE

Expand where the technology is actually welcome

Cross-border acceptance and wallet interoperability together grow at 13.2% across markets whose operators actually want the infrastructure and find the commercial terms genuinely attractive, and Indonesia grows fastest of any of those at 10.8% a year. Nothing whatsoever about that expansion requires the domestic regulatory position to change at all. Providers who are still pursuing markets that have already restricted Chinese financial technology are simply spending real money against an outcome that somebody else decided years ago entirely without them.
03 / OBLIGATION REVENUE CAPTURE

Sell the compliance you were forced to build

Supervised status obliged every single converted platform to build reporting, capital calculation and risk management capability up from nothing at considerable internal expense during exactly the period when revenue growth had already slowed sharply everywhere. Selling that same capability onward to the other newly supervised institutions turns a mandatory internal cost into external revenue growing at 12.6% a year. Productising work originally built for one single organisation is genuinely harder than it sounds, and it is well worth doing anyway.
04 / DISTRIBUTION LAYER DEFENCE

Free reach is the only asset that survived

Payments touch around 87% of all adults every month at merchant fees near 0.5%, earning almost nothing at all directly while providing free universal distribution for every product that actually carries any margin. The official digital currency now operating across some 26 pilot locations settles directly and it bypasses that whole layer entirely. Losing that customer interface would mean paying to reach people who currently arrive for nothing at all, which reprices absolutely everything that is currently sold through it.

Engagement Snapshot From the Field

A live engagement with an industry participant carrying material or product regulatory and market exposure ahead of a defining policy shift, showing how our research translates into a defensible multi-year portfolio strategy.
MARKET MINDS ADVISORY · CLIENT ENGAGEMENT SUMMARY
China Fintech Producer Strategic Portfolio Review and Transition Roadmap 2026·Investment Scenario on China Fintech Exposure Evaluation 2025-26
CLIENT PROFILE
A platform consumer lender operating under supervised status with reported financial services revenue of 780 million dollars (client-reported, unverified by MMA). Roughly 82% came from consumer lending where 30% of co-lent balances sat on its own balance sheet. Cross-border activity was minimal and compliance capability built for supervision had never been offered to anybody externally at all.
STRATEGIC CHALLENGE
Lending growth had stalled against capital capacity while wholesale funding costs rose, and returns had fallen well below the levels the business was designed around. Management proposed raising equity to fund further lending expansion. That committed expensive capital to competing against banks on funding cost, which is the one dimension where banks have always held the stronger position.
MMA APPROACH
MMA rebuilt returns by segment on a capital-allocated basis, separating businesses requiring balance sheet from those that do not. Twenty-three expert interviews with regulators' former staff, bank partners, Southeast Asian payment operators and compliance software buyers established where capital-light revenue actually exists. The analysis treated compliance productisation and corridor expansion as the available routes forward.
KEY FINDINGS
  1. Capital-allocated returns on retained lending balances were less than half those on fee-based activity, and no internal report had ever presented the comparison in that form.
  2. Compliance and reporting capability built for the client's own supervision closely matched what several smaller supervised institutions were actively trying to buy.
  3. Cross-border corridor opportunities existed with two Southeast Asian operators who had approached the client directly and been declined for lack of focus.
  4. Wholesale funding spreads had widened by more than the lending margin across two years, and the equity proposal would have funded exactly that spread.
CLIENT PROFILE
A platform consumer lender operating under supervised status with reported financial services revenue of 780 million dollars (client-reported, unverified by MMA). Roughly 82% came from consumer lending where 30% of co-lent balances sat on its own balance sheet. Cross-border activity was minimal and compliance capability built for supervision had never been offered to anybody externally at all.
STRATEGIC CHALLENGE
Lending growth had stalled against capital capacity while wholesale funding costs rose, and returns had fallen well below the levels the business was designed around. Management proposed raising equity to fund further lending expansion. That committed expensive capital to competing against banks on funding cost, which is the one dimension where banks have always held the stronger position.
MMA APPROACH
MMA rebuilt returns by segment on a capital-allocated basis, separating businesses requiring balance sheet from those that do not. Twenty-three expert interviews with regulators' former staff, bank partners, Southeast Asian payment operators and compliance software buyers established where capital-light revenue actually exists. The analysis treated compliance productisation and corridor expansion as the available routes forward.
KEY FINDINGS
  1. Capital-allocated returns on retained lending balances were less than half those on fee-based activity, and no internal report had ever presented the comparison in that form.
  2. Compliance and reporting capability built for the client's own supervision closely matched what several smaller supervised institutions were actively trying to buy.
  3. Cross-border corridor opportunities existed with two Southeast Asian operators who had approached the client directly and been declined for lack of focus.
  4. Wholesale funding spreads had widened by more than the lending margin across two years, and the equity proposal would have funded exactly that spread.
RECOMMENDED STRATEGY
Phase 1: Phase one: stop growing retained lending balances and reallocate management attention toward the fee-based activity earning considerably better capital returns. Phase 2: Phase two: productise the compliance and reporting capability already built internally and sell it onward to other smaller supervised institutions. Phase 3: Phase three: reopen the two Southeast Asian corridor discussions, since neither requires capital and both were initiated by the counterparty.
OUTCOME
Retained lending balances were held flat and capital-allocated returns improved across two quarters (client-reported, unverified by MMA). Compliance productisation reached first external contract within the year. One corridor discussion progressed to agreement. The equity raise was cancelled, having proposed funding a spread the business could not earn its way out of.

Frequently Asked Questions

Foundational context covering the market sizes, CAGR, scope, country, region and competition that inform every finding below. This section is provided to cover basics and most often pre-purchase conversations, answered from the MMA Primary Research Dataset.

What is the current size of the China Fintech Market?

The market was worth 86.4 billion dollars in provider revenue in 2025, covering payments, lending, wealth, insurance distribution, cross-border and infrastructure software. It reaches 94.00 billion dollars in 2026.

How large will the China Fintech Market be by 2036?

MMA forecasts 218.48 billion dollars by 2036, an increase of 124.48 billion dollars over the 2026 base. That represents an expansion multiple of 2.32 times across the forecast period.

What is the CAGR for the China Fintech Market 2026 to 2036?

The base case compounds at 8.8% annually. The bull case reaches 10.0% on faster cross-border expansion, while the bear case sits at 7.6% if the official digital currency takes meaningful payment share.

Which segment is growing fastest?

Cross-border payment and acceptance services, at 13.2%, half again the market rate of 8.8%. Nothing about that expansion depends on domestic regulatory conditions changing at all.

Who are the major companies in the China Fintech Market?

Ant Group, Tencent, JD Technology, Lufax and Du Xiaoman lead on disclosed fintech segment revenue. Concentration reaches 61%, the highest of any major fintech market anywhere.

Which country is growing fastest?

Indonesia at 10.8%, supported by acceptance infrastructure, wallet interoperability and equity positions in local firms giving genuine participation rather than merely a settlement payment corridor alone.

Report Segmentation Architecture

The full report scope spans multiple orthogonal segmentation dimensions, with cross-tabulated demand data provided for each dimension pair. Coverage extends further to regional breakdowns, trend trajectories, and the competitive detail needed to support segment-level decision-making.

By Service Type

  • Digital Payments and Merchant Acquiring
  • Platform Consumer and SME Lending
  • Digital Wealth and Fund Distribution
  • Insurance Distribution and Insurtech
  • Cross-Border Payment and Acceptance Services
  • Regulatory Technology and Financial Infrastructure Software

By End-Use Industry

  • Online Retail and Marketplace Commerce
  • Offline Retail and Food Service
  • Small and Micro Enterprise
  • Banking and Financial Institutions
  • Travel Transport and Hospitality
  • Supply Chain and Logistics

By Commercial Dimension

  • Consumer Wallet Distribution
  • Merchant Acquiring Contracts
  • Bank Co-Lending Partnerships
  • Institutional Software Licensing
  • Cross-Border Operator Interoperability
  • Licensed Bureau Data Arrangements

By Region

  • North America
  • Western Europe
  • East Asia
  • South Asia and Pacific
  • Latin America
  • Middle East and Africa
  • Eastern Europe

Scope, Methodology, and Coverage

Every figure in this report is reproducible from documented input assumptions. The scope below maps the historical period, the forecast horizon, the segmentation dimensions, and the countries covered, alongside the underlying primary and qualitative methodology.
Historical Period
2020 to 2025
Forecast Period
2026 to 2036
Base Year
2025 (USD billions; MMA Primary Research Dataset, August 2026)
Market Definition
Scope covers revenue earned by financial technology providers operating in China, spanning digital payments and merchant acquiring, platform consumer and small business lending including arranged and co-lent balances, digital wealth and fund distribution, insurance distribution and insurtech services, cross-border payment acceptance and settlement services, and regulatory technology and financial infrastructure software supplied to financial institutions. Traditional bank net interest income and fee income earned outside technology channels, securities brokerage and exchange operations, insurance underwriting risk margin retained by insurers, cloud and enterprise infrastructure sold outside financial services, cryptoasset trading or custody, and central bank digital currency issuance itself are excluded from the market size and all derived figures.
Quantitative Units
USD billions of provider revenue (current prices); payment transaction value in RMB trillions; co-lending capital share as percentage; merchant fee rates as percentage of transaction value; mobile payment penetration among adults
Segmentation Dimensions
By Service Type; By End-Use Industry; By Commercial Dimension; By Region
Regions Covered
North America, Western Europe, East Asia, South Asia and Pacific, Latin America, Middle East and Africa, Eastern Europe
Countries Covered
China, with revenue geography analysed across Hong Kong, Singapore, Indonesia, Malaysia, Thailand, Japan, South Korea, USA, UK, Germany, Australia, Brazil, Mexico, United Arab Emirates, Nigeria
Key Companies Profiled
Ant Group, Tencent, JD Technology, Lufax, Du Xiaoman, WeBank, MYbank, Qifu Technology, LexinFintech, FinVolution Group, Yiren Digital, OneConnect, Yeahka, Lakala Payment, PingPong, XTransfer, ZhongAn Online, Baidu, Meituan, ByteDance
Quantitative Methodology
Primary survey, n=3,800 respondents, Q4 2025, six countries; demand-side model with trade association cross-validation
Qualitative Methodology
47 expert interviews, Q4 2025; applied to validate demand model assumptions, identify emerging dynamics, and assess competitive positioning
Report Format
PDF and XLSX data workbook (Word format preview document)
Publisher
Market Minds Advisory
Report Code
MMA-2026-TEC-201
Published
August 2026
Contact
sales@marketmindsadvisory.com | www.marketmindsadvisory.com

Purchase the full China Fintech Market Report (2026 to 2036).

The full report runs to 205 pages and covers all six service type segments, seven revenue regions and 20 profiled providers in detail. It includes the complete segment CAGR set, analysis of the regulatory sequence from 2020 onward, and capital-allocated return comparison across balance sheet and fee activity. Company profiles carry evaluation on disclosed fintech and financial services segment revenue, with moat and risk assessment for the top five providers. The competitive section extends to 16 tracked regulatory, funding and corridor developments across 2024 and 2025. Primary research inputs include a quantitative survey of 3,800 respondents and 47 expert interviews conducted in Q4 2025.
Six service type segments with individual CAGR forecasts
Seven revenue regions with corridor and acceptance analysis
Twenty provider profiles on consistent segment revenue basis
Sixteen tracked regulatory and corridor developments with commercial interpretation
Capital-allocated returns compared across balance sheet and fee activity
Official digital currency assessed as a distribution layer risk

Built For The People Who Decide

From boardroom strategy to bench-side execution, this report is read cover-to-cover by leaders shaping the next decade of their industry, turning demand scenarios, market dynamics and valuation benchmarks into decisions.
CXOs/ Presidents/ VPs/ Managers
M&A and Corporate Development
Strategy Teams and R&D Heads
Procurement and Product Directors
Regulatory and Compliance Leaders
Investor Relations and Equity Analysts