Market Minds Advisory
Chimeric Antigen Receptor (CAR) T-Cell Therapy Market

Chimeric Antigen Receptor (CAR) T-Cell Therapy Market: Manufacturing Is the Product, and the Waiting List Is the Market

Patients die on the apheresis waiting list rather than from the disease the therapy would have treated, which makes manufacturing turnaround the clinical variable and the commercial one at once.

Lead Analyst

Alice Ballenger

Published

September 2026

Make Smarter Decisions with Customized Research Insights

Request a free sample report and evaluate market opportunities, growth trends, and competitive dynamics relevant to your business needs.

2025 MARKET VALUE$5.4BMarket Size 2025
2036 FORECAST VALUE$25.4BBase Case , 2026 to 2036
CAGR 2026 TO 203615.2 %Bull 16.6% / Bear 13.9%
INCREMENTAL OPPORTUNITY$19.2BNet 10- year value creation
EXPANSION MULTIPLE4.12x2036 value over 2026 base
Strategic Levers
M&A Pipeline
Regional Outlook
Country Rankings
Competitive Intelligence
Segmental Deep-dive
Call-Us : 91 93563 13602

Executive Snapshot and Market Trajectory

The bottleneck in this therapy has never been the science. It is that each dose must be manufactured from one patient's own cells, and roughly 19% of patients who begin the process never receive the product because the disease moves faster than the factory. The factory is the constraint.
Allogeneic and off-the-shelf CAR therapies compound at 22.8%, a full 1.50x the market rate, because a product sitting in a freezer removes the manufacturing wait entirely. East Asia holds the largest share at 31%, on Chinese trial activity exceeding the rest of the world combined and on domestic approvals at prices a fraction of Western levels. Roughly 1,150 certified treatment centres now operate worldwide. Certified centre density limits how much reaches patients at all.
Concentration is extreme at 84%, split between two large pharmaceutical groups and three specialists. Vein-to-vein time near 26 days is the number that decides everything: it determines who survives to treatment, which centres will refer, and whether the therapy can move earlier in the treatment sequence where the patients are healthier. Bispecific antibodies compete in the same indications with no manufacturing wait at all, which sharpens that argument further.
Market Definition
This market covers chimeric antigen receptor T-cell therapies for haematological and solid tumour indications, spanning autologous CD19-directed therapies, autologous BCMA-directed therapies, allogeneic and off-the-shelf CAR therapies, next-generation and armoured CAR constructs, and in-vivo CAR generation approaches. T-cell receptor engineered therapies, tumour infiltrating lymphocyte therapies, natural killer cell therapies without chimeric receptors, bispecific antibodies, manufacturing equipment and reagents, and apheresis services billed separately are excluded.
Base Year Value
$5.4B in 2025 (MMA Primary Research Dataset, August 2026)
Forecast Period
2026 to 2036, eleven discrete annual values
CAGR
15.2% base case. Bull 16.6%. Bear 13.9%.
Fastest Growth Segment
Allogeneic and Off-the-Shelf CAR Therapies: 22.8% CAGR
Fastest Growth Country
India: 19.4% CAGR
Fastest Growth Region
South Asia and Pacific: 17.6% CAGR
Largest Region
East Asia: 31% of 2025 global value
Market Leaders
Novartis, Bristol Myers Squibb, Gilead Sciences, Johnson and Johnson, and Legend Biotech. Source: MMA Primary Research Dataset, July 2026.
Primary Survey
n=3,800 procurement and R&D decision-makers, Q4 2025, six countries
Methodology
Demand-side build-up, cross-validated against public data, 47 expert interviews

Chimeric Antigen Receptor (CAR) T-Cell Therapy Market Forecast Scenarios

chimeric-antigen-receptor-car-t-cell-therapy-marke-size-forecast-scenario-1787306495055
Growth ran near 13.8% from 2020 to 2025 and manufacturing capacity rather than demand set the pace throughout. Approved products had waiting lists measured in months while sponsors built and validated additional suites, and the constraint was slot availability rather than patient identification. BCMA-directed therapies in myeloma added a second wave of demand that arrived before capacity for the first had fully caught up.
Base case growth of 15.2% rests on three mechanisms. Approved indications keep moving earlier in the treatment sequence into second-line and eventually first-line use, where patient numbers are considerably larger. Manufacturing turnaround keeps shortening, which converts waiting list attrition into treated patients directly. And allogeneic products progressing through late-stage trials would remove the manufacturing wait altogether for eligible patients. Two of the three operate whether or not an allogeneic product ever reaches approval.
The bull case at 16.6% assumes an allogeneic product reaches approval and demonstrates durability comparable to autologous therapy, which would change the economics of the entire field. The bear case at 13.9% reflects bispecific antibodies taking share in the same indications, since they are available immediately, require no manufacturing slot and cost considerably less to deliver.

Cell Therapy: Slots, Turnaround and Attrition

An autologous CAR T therapy is not really a drug and the industry has never quite adjusted to that. Each dose is manufactured from a specific patient's own lymphocytes, which means there is no inventory, no shelf and no possibility of treating somebody tomorrow because a slot opened. The product is a manufacturing service with a biological output, and the entire commercial structure follows from that fact.
TOP FIVE CONCENTRATION84%Extremely concentrated among sponsors holding approved cell therapy products
VEIN-TO-VEIN TIME26 daysDays from apheresis collection to infusion of finished product
MANUFACTURING ATTRITION19%Patients starting the process who never receive their product
LIST PRICE PER COURSE$465,000Typical single-course therapy price before hospital delivery costs
CERTIFIED TREATMENT CENTRES1,150 centresFacilities certified to collect, handle and administer these therapies
MANUFACTURING SUCCESS RATE93%Batches meeting release specification once manufacturing has begun
The consequence is attrition. Vein-to-vein time averages around 26 days, and roughly 19% of patients who undergo apheresis never receive their product, either because the disease progressed during manufacturing or because they died waiting. That figure is the most important number in the field and it appears in remarkably few commercial discussions, which is odd given that it represents patients a sponsor has already committed cost to.
Everything competitive follows from turnaround. Shorter manufacturing means less attrition, which means better real-world outcomes than trial data alone would predict, which means referring haematologists send patients earlier. It also determines whether these therapies can move into second and first-line use, where patients are healthier and can wait, and where the treated population is several times larger than the refractory setting.
"The trial data tells you what happens to patients who received the product. It does not tell you about the fifth of patients who were enrolled and never got there. In this field the manufacturing failure rate and the waiting list are clinical outcomes, and the sponsors who treat them as operational details are measuring the wrong thing."
Principal Analyst, Cell and Gene Therapy Commercialisation Practice · MMA Health

Market Trends

Turnaround time becomes the primary competitive dimension

With multiple approved products carrying broadly comparable efficacy in overlapping indications, referring haematologists increasingly select on how quickly a patient can be treated rather than on response rates that differ little between them. Vein-to-vein time near 26 days is the figure clinicians actually compare, and every day removed reduces the roughly 19% attrition between apheresis and infusion. Sponsors that shortened manufacturing meaningfully gained referral share without any change in clinical evidence, which is unusual in oncology and tells you where the real constraint sits. Manufacturing investment therefore returns more than additional efficacy trials do.
Market Impact: Segment compounding at 22.8% annual

Approved indications move earlier into the treatment sequence

Regulatory approvals have progressively moved these therapies from third-line and later into second-line use across large B-cell lymphoma and myeloma, and trials in earlier settings continue. Each step earlier multiplies the eligible population substantially while treating patients who are healthier and better able to tolerate the manufacturing wait. That combination improves both the addressable market and the attrition rate simultaneously, which is why sponsors pursue earlier-line approvals harder than they pursue new indications entirely. Sponsors pursue earlier-line approvals harder than new indications for exactly that reason. The regulatory burden is substantial and the return still exceeds it.
Market Impact: Roughly 1,150 certified centres ope

Market Opportunities and Growth Drivers

Allogeneic products would remove the manufacturing wait entirely

A product manufactured from healthy donor cells and held frozen can be infused within days of a treatment decision, which eliminates apheresis, the manufacturing slot and the attrition that follows both. That is a fundamentally different clinical proposition rather than an incremental improvement, and it explains growth of 22.8% in a segment with no fully approved product in major markets yet. Persistence and durability remain the open questions, since donor cells face rejection that autologous products do not. Gene editing to reduce rejection adds regulatory complexity autologous products never faced.
Market Impact: Attrition running near 19% currentl

Treatment centre certification expands the referral network

These therapies can only be delivered at facilities certified to collect, handle and administer cell products, and roughly 1,150 such centres now operate worldwide against far fewer five years ago. Each certification converts a geography from referral-out to treatment-capable, which materially raises the proportion of eligible patients who actually reach therapy. Certification is slow and expensive for a hospital to obtain, so sponsors that support the process directly build referral relationships years before any patient is treated. Centres treat preferentially with whichever product they certified around first, which makes certification support the most influential activity a sponsor can fund.
Market Impact: Therapy priced at $465,000 per cour

Market Restraints and Challenges

A fifth of enrolled patients never receive their product

Roughly 19% of patients who undergo apheresis never receive an infusion, because the disease progressed during the manufacturing interval or because they died waiting for it. The root cause is that autologous manufacturing takes weeks in patients whose disease is measured in the same units. Commercial impact is that a sponsor commits cost to patients who generate no revenue and no outcome data. Participants respond by shortening turnaround, adding bridging therapy protocols and pursuing earlier-line approvals where patients can wait. It is a commercial loss as much as a clinical one.
Market Impact: Vein-to-vein time near 26 days

Bispecific antibodies compete without a manufacturing wait

Bispecific antibodies target the same antigens in the same indications, are available from a pharmacy shelf immediately, require no apheresis and cost a fraction of $465,000 per course to deliver. The root cause is that they achieve related biology through a manufacturable molecule rather than a manufactured cell. Commercial impact falls hardest where CAR therapy waiting lists are longest, since availability substitutes for efficacy when a patient cannot wait. Participants respond by competing on durability, single-administration convenience and depth of response. Availability substitutes for efficacy whenever a patient cannot survive the wait.
Market Impact: Eligible population roughly 3x earl
3 additional market trends, 4 additional growth drivers, and 2 additional restraints and challenges are covered in the full report. Contact sales@marketmindsadvisory.com to access the complete intelligence.

Segment CAGR and Growth Architecture

Five therapy classes divide this market by cell source and construct design, which together determine manufacturing model, turnaround and therefore commercial structure. The division separates products made from a patient's own cells from those held in inventory, and that single distinction shapes almost every economic property of each class. Cell source decides the economics entirely.
chimeric-antigen-receptor-car-t-cell-therapy-marke-market-share-analysis-1787306495605

Allogeneic and Off-the-Shelf CAR Therapies

Compounding at 22.8%, a full 1.50x the market rate, these products are manufactured in batches from healthy donor cells and held frozen, which removes apheresis, the manufacturing slot and the roughly 19% attrition that autologous therapy carries. A patient can be treated within days of the decision rather than weeks. Persistence and durability remain genuinely unresolved, since donor cells face host rejection that autologous cells avoid, and gene editing to reduce that adds regulatory complexity. Approval in a major market would reset the economics of the whole field immediately. Sponsors without a programme here are defending a model the field is trying to escape. Approval in any major market would reset the field's economics within a single year.
CAGR 22.8%

Autologous BCMA-Directed Therapies

Growing at 17.6%, BCMA-directed products treat multiple myeloma and represent the second major wave of approvals after CD19-directed therapy in lymphoma and leukaemia. Response depth in heavily pretreated myeloma exceeded expectations substantially, and approvals have since moved toward earlier lines where patient numbers are considerably larger. Manufacturing capacity constrained launch more visibly than in any previous cell therapy, with waiting lists measured in months. Competition from bispecific antibodies targeting the same antigen is more advanced here than in lymphoma, which sharpens the turnaround argument further. Waiting lists measured in months mean revenue is capped by validated suite capacity rather than by clinical performance, and cell therapy suite validation timelines cannot be compressed. Capacity expansion decides growth here.
CAGR 17.6%
Full segment breakdown across 5 segments available in the complete report.

Regional Architecture and Country Demand Map

Regional distribution reflects trial activity, treatment centre certification and pricing, and those three pull in different directions. The region conducting the most clinical activity is not the one generating the most revenue per patient, which makes share and influence diverge considerably here. Certified centre density governs reachable population.

East Asia

Thirty-one per cent of global value, the largest regional position, and clinical activity rather than pricing explains it. Note: this exceeds the 22 to 30% band because China runs more registered CAR T trials than the rest of the world combined and has approved domestic products at prices a fraction of Western levels, which converts enormous patient volume into substantial aggregate value. Legend Biotech emerged from that research base into global partnership. Japan reimburses approved therapies through its health insurance system at negotiated prices with strict centre certification requirements limiting delivery capacity. Certified centre capacity across China limits how much of that trial activity converts into commercial treatment. Trial breadth exceeds commercial delivery capacity considerably.
Share: 31% | CAGR: 16.4% (2026 to 2036)

North America

Twenty-nine per cent of value on far fewer patients than East Asia, reflecting list pricing near $465,000 per course before hospital delivery costs. Treatment centre certification is most advanced here and referral networks are the most developed, which raises the proportion of eligible patients who actually reach therapy. Payer scrutiny is correspondingly intense, with outcomes-based arrangements increasingly common. Manufacturing capacity for the approved products is concentrated here, which shortens turnaround for domestic patients relative to those in markets requiring international shipment. Referring haematologists here increasingly select on vein-to-vein time rather than on efficacy, since approved products differ little on response rates and considerably on how fast a patient reaches infusion.
Share: 29% | CAGR: 14.6% (2026 to 2036)
Regional intelligence for 5 additional markets available in the complete report: Western Europe, South Asia and Pacific, Latin America, Middle East and Africa, Eastern Europe. Contact sales@marketmindsadvisory.com.
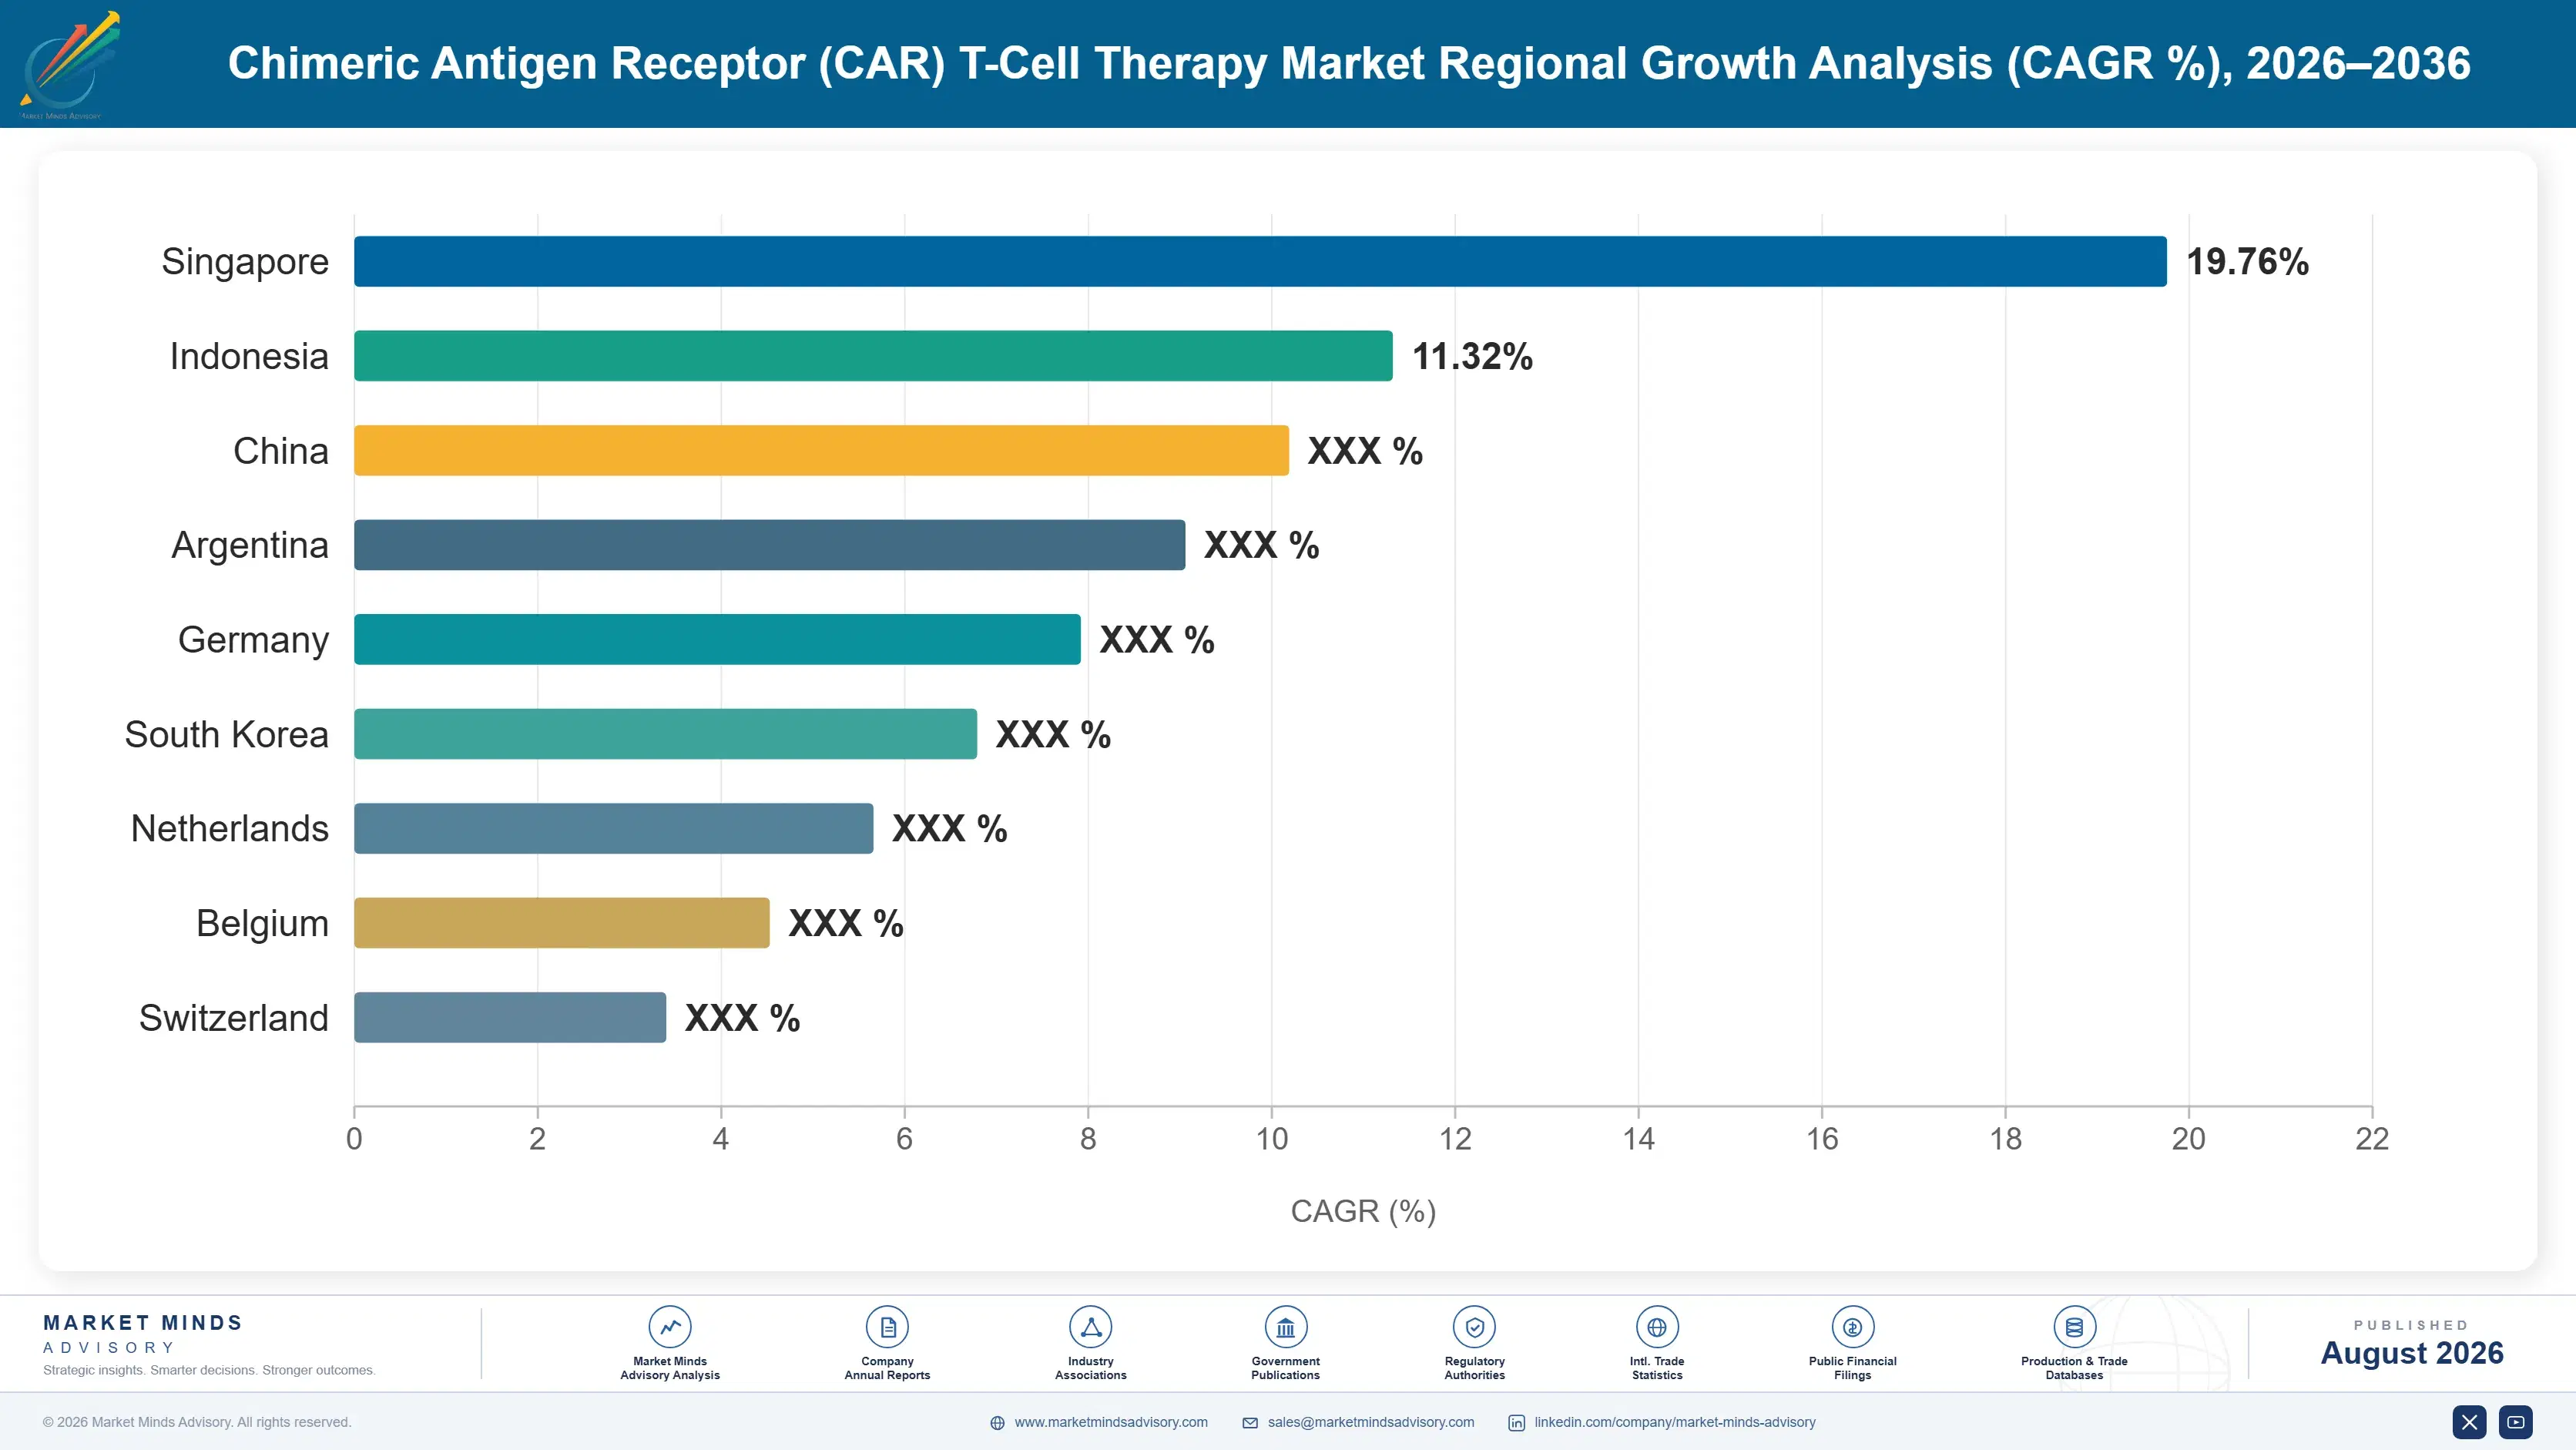
chimeric-antigen-receptor-car-t-cell-therapy-marke-country-cagr-analysis-1787306496130

Where Cell Therapy Value Actually Turns

Efficacy differences between approved products are small enough that clinicians rarely decide on them. What decides referrals, survival and eventually market share is how fast a patient can be treated, how many centres can treat them, and whether the therapy reaches patients while they are still well enough to wait. None of those three is an efficacy question at all.

Compete on days rather than on response rates

Approved products carry broadly comparable efficacy in overlapping indications, so referring haematologists select on how quickly a patient can be treated. Vein-to-vein time near 26 days is the figure they actually compare, and each day removed reduces the 19% attrition between apheresis and infusion. Sponsors that shortened manufacturing meaningfully gained referral share with no change to their clinical evidence at all. Manufacturing investment therefore returns more than additional trials do, which is not how oncology commercial budgets are usually allocated. Oncology commercial budgets rarely allocate that way. The constraint sits after referral rather than before it.
Market Impact: Attrition falling from a 19% baseli

Fund treatment centre certification years ahead

Roughly 1,150 certified centres operate worldwide, and each one converts a geography from referral-out to treatment-capable. Certification is slow, expensive and administratively demanding for a hospital, which means sponsors that support the process build relationships years before any patient is treated there. The centre then treats with whichever product it certified around first in most cases. Interviewed centres described certification support as the single most influential sponsor activity, well ahead of any clinical or commercial engagement. Certification takes far longer than any sales cycle. Relationships form years before treatment begins.
Market Impact: Roughly 1,150 centres are now certi

Push earlier into the treatment sequence deliberately

Each move earlier in the treatment line multiplies eligible patients roughly threefold while treating people healthy enough to survive the manufacturing interval, which improves the addressable population and the attrition rate at the same time. Second-line approvals have already demonstrated this and first-line trials continue. The regulatory and evidence burden is substantial, but the return exceeds what any new indication in the refractory setting could deliver. Sponsors treating earlier-line expansion as secondary to new indications have the priority inverted. Each line back roughly triples the eligible population while reaching patients who can survive a 26 day manufacturing interval.
Market Impact: Eligible population roughly 3x per

Take the manufacturing wait out of the equation

Allogeneic products held frozen remove apheresis, the manufacturing slot and the attrition that both create, letting a patient be treated within days of a decision. The segment compounds at 22.8% with no fully approved product in major markets, which reflects what the field expects rather than what it has. Durability against host rejection is the unresolved question. Sponsors without an allogeneic programme are defending a manufacturing model that the entire field is trying to escape from. The segment compounds at 22.8% with no fully approved product in any major market, which reflects expectation rather than performance.
Market Impact: Allogeneic segment compounding at 2

Who Controls the Margin Pool

The top five hold 84% of the market measured on revenue from approved chimeric antigen receptor therapies, the basis used throughout this section. That concentration reflects how few products have reached approval rather than any competitive dynamic, and the gap between approved sponsors and everyone else is absolute rather than gradual. Novartis and Gilead lead in CD19-directed lymphoma while Bristol Myers Squibb, Johnson and Johnson and Legend Biotech hold the BCMA myeloma positions.
Competitive activity runs along three lines. Sponsors are investing in manufacturing capacity and turnaround reduction rather than in additional efficacy trials, having recognised where the constraint sits. Several are pursuing allogeneic programmes intended to eliminate the manufacturing wait entirely. And earlier-line approvals are being pursued harder than new indications, because each line multiplies the eligible population several times over.

Pressure comes from two directions that are quite different in character. Bispecific antibodies compete on immediate availability and much lower delivery cost in the same indications. And Chinese and Indian sponsors have approved products at prices a fraction of Western levels, which will eventually reach markets that cannot fund $465,000 courses. Rankings shift on manufacturing turnaround and on which sponsor reaches allogeneic approval first.
chimeric-antigen-receptor-car-t-cell-therapy-marke-company-positioning-matrix-1787306496659

Competitive Moat and Risk Dimensions

NOVARTIS

Moat: First approval and certified network

The first approved product built the certified treatment centre network, the reimbursement precedents and the referral relationships that every subsequent entrant has had to work within. Centres certified around this product first treat with it preferentially, and the manufacturing and logistics infrastructure assembled over years is genuinely difficult for a later sponsor to replicate at comparable scale.
NOVARTIS

Risk: Autologous model under pressure

The position rests on autologous manufacturing that the entire field is attempting to escape through allogeneic approaches, and a successful off-the-shelf product would make the certified apheresis network considerably less valuable than it is today. Bispecific antibodies also compete in the same indications with no manufacturing wait and much lower delivery cost.
LEGEND BIOTECH

Moat: Response depth in myeloma

The BCMA-directed product demonstrated response depth in heavily pretreated myeloma that exceeded what the field expected, which built clinician conviction that competing evidence has not displaced. Partnership with a large pharmaceutical group supplies the manufacturing scale and commercial reach that a specialist could not assemble alone, and approvals have moved steadily toward earlier lines.
LEGEND BIOTECH

Risk: Manufacturing capacity constrains growth

Demand exceeded manufacturing capacity from launch, with waiting lists measured in months and patients lost to progression while they waited. That constraint caps revenue independently of clinical performance and hands opportunity to bispecific antibodies that face no such limit. Capacity expansion is underway but validation timelines for cell therapy suites cannot be compressed easily.

Players Tracked

Prominent Players

Novartis
Bristol Myers Squibb
Gilead Sciences
Johnson and Johnson
Legend Biotech

Other Key Players

Allogene Therapeutics
Autolus Therapeutics
Arcellx
Caribou Biosciences
CARsgen Therapeutics
JW Therapeutics
IASO Biotechnology
Fosun Kite Biotechnology
ImmunityBio
Precision BioSciences
Cellectis
Adaptimmune Therapeutics
Immatics
ImmunoACT
Miltenyi Biotec

Recent Developments

APRIL 2022

Second-line approval granted in large B-cell lymphoma

Regulators approved chimeric antigen receptor therapy for second-line treatment of large B-cell lymphoma, moving the therapy earlier in the sequence than the refractory setting where it was first approved. The decision multiplied the eligible population substantially and reached patients healthier and better able to tolerate the manufacturing interval.
Signal: Moving earlier in the treatment line impro
OCTOBER 2023

Indigenously developed therapy approved in India

Indian regulators approved a domestically developed CD19-directed therapy priced at a small fraction of Western levels, following academic development and local manufacturing. The approval converted a therapy that had been entirely unreachable for the Indian population into an accessible one, and it demonstrated that the cost structure was not immovable.
Signal: Domestic development at a fraction of West
AUGUST 2024

Bispecific antibodies expand in overlapping indications

Bispecific antibodies targeting the same antigens gained expanded approvals in lymphoma and myeloma, offering immediate availability with no apheresis, no manufacturing slot and considerably lower delivery cost. These were regulatory approvals of competing products rather than any transaction, and they intensified pressure where cell therapy waiting lists were longest.
Signal: Availability substitutes for efficacy when

What Actually Costs Money Here

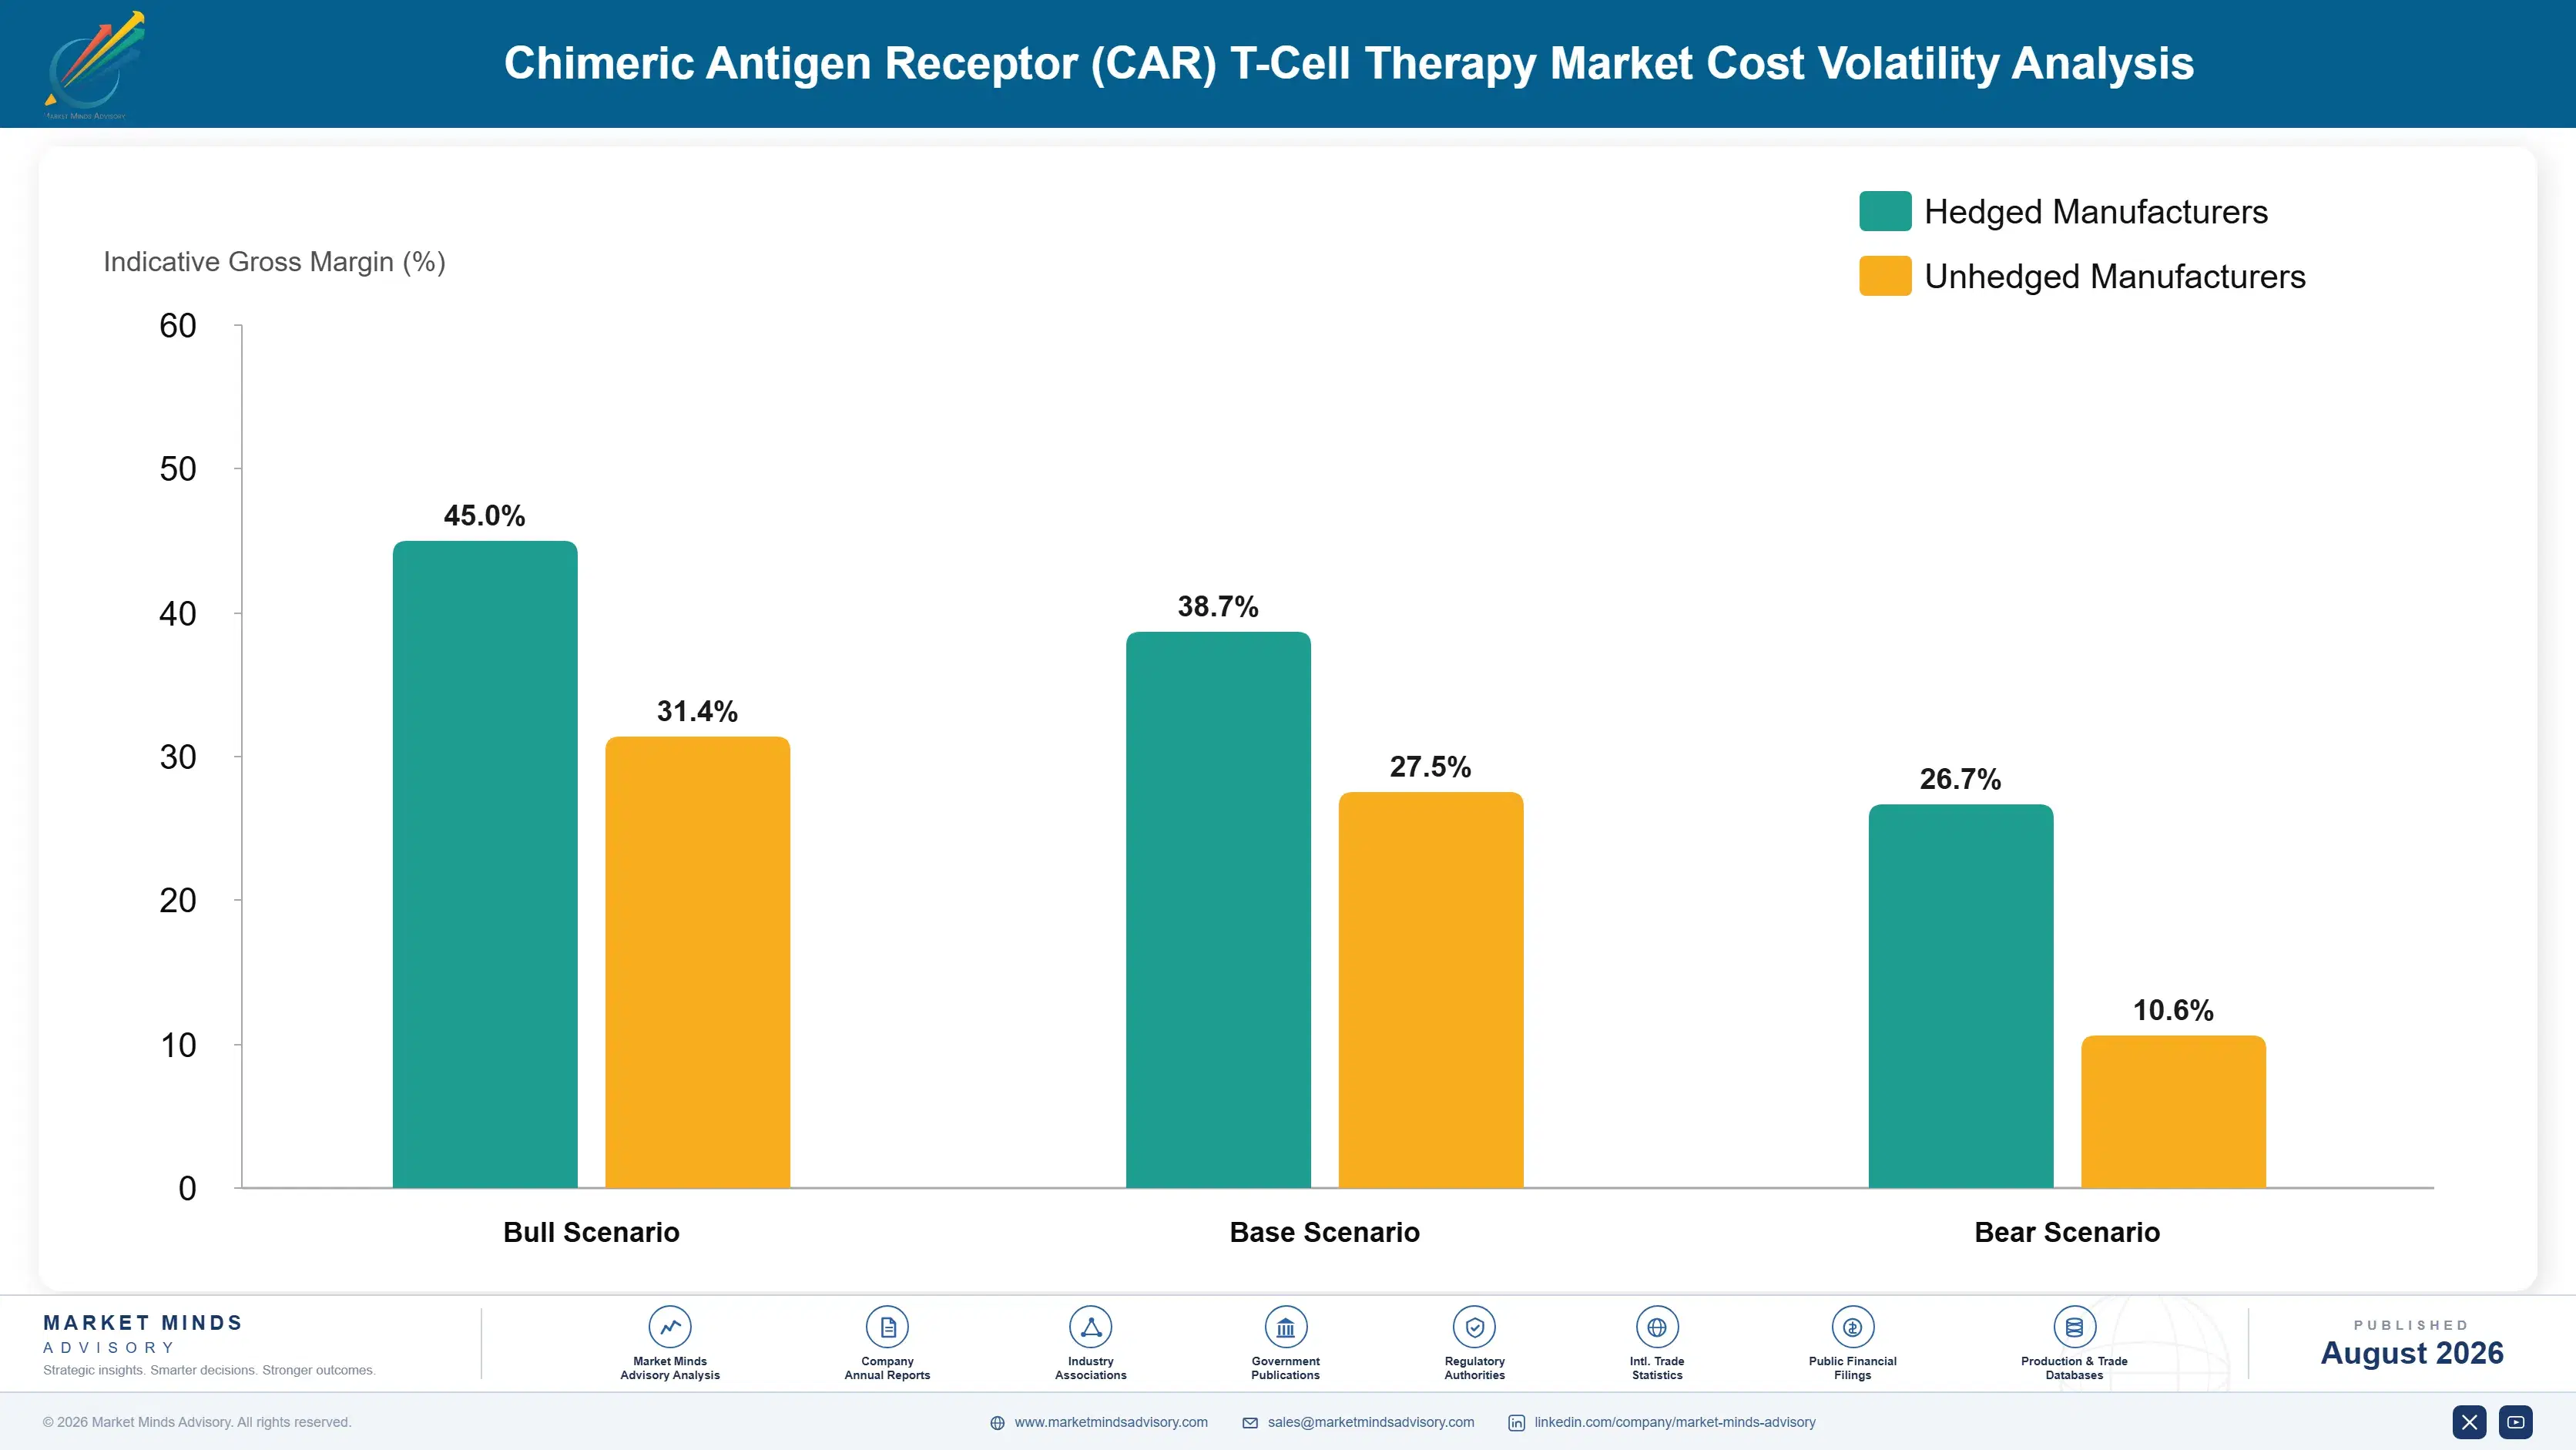
This cost base looks nothing like conventional pharmaceutical manufacturing. Viral vector supply, cell culture media, cytokines and selection reagents account for roughly 31% of cost of goods, sourced from a narrow set of specialist suppliers. Cleanroom suite operation, qualified personnel and batch-specific quality release absorb around 38%, and none of it benefits from scale because every batch serves exactly one patient.
Viral vector capacity constrained the entire field through 2021 and 2022 as cell and gene therapy demand outstripped contract manufacturing availability, and sponsors reported vector supply as a limiting factor in annual disclosures. Cell therapy manufacturing personnel remain genuinely scarce, and wage inflation for qualified operators has run well above general pharmaceutical labour costs across every major manufacturing location. Qualified operator availability limits throughput more than cleanroom space does.

Exposure varies fundamentally by manufacturing model. Autologous producers carry per-patient cost that does not decline with volume, since each batch is a separate manufacturing campaign with its own release testing. Allogeneic producers would carry conventional batch economics with cost per dose falling substantially at scale, which is a large part of the commercial argument for the approach. Sponsors relying on contract manufacturing carry capacity risk they cannot directly control.
chimeric-antigen-receptor-car-t-cell-therapy-marke-cost-volatility-analysis-1787306496858

Automated closed-system manufacturing platforms

Manual open processing requires highly qualified operators whose availability limits throughput more than cleanroom space does. Closed automated platforms reduce operator time per batch and improve consistency, though validation of a process change for an approved product requires regulatory work that sponsors postpone until capacity pressure forces the decision. Capacity pressure usually forces the decision eventually.

Decentralised manufacturing near treatment centres

Shipping cells to a central facility and back adds days to vein-to-vein time, which matters directly given attrition during the wait. Manufacturing at or near the treatment centre removes that transit, but multiplies the number of facilities requiring qualification and inspection, which regulators approach cautiously and sponsors find expensive. Regulators approach the model cautiously in every market.

Vector supply secured through dedicated capacity

Viral vector availability constrained the whole field during recent demand peaks, and sponsors dependent on shared contract capacity lost manufacturing slots they could not recover. Dedicated or owned vector capacity removes that exposure at substantial capital cost, and several sponsors concluded the insurance was worth the investment. Several concluded the insurance justified the capital.

Portfolio Architecture for Margin Defence

Margin architecture in this field is unlike conventional pharmaceuticals because cost of goods is genuinely material. Autologous therapy priced near $465,000 per course carries manufacturing cost that does not fall with volume, since each batch serves one patient and requires its own release testing, which holds gross margin well below what a small molecule at that price would produce. Allogeneic products would carry conventional batch economics entirely.
The tension is between the approved and the promised. Autologous products generate all current revenue, hold the certified centre relationships and carry manufacturing economics nobody would design deliberately. Allogeneic products would fix the economics and the attrition together, and none has reached full approval in a major market. Sponsors weighted entirely toward autologous face a transition they cannot control the timing of.

High-value pools concentrate where the therapy reaches patients who can actually receive it. Earlier-line indications, geographies with dense certified centre coverage and any product removing the manufacturing wait all sit there. Everything treating heavily refractory patients through a four-week manufacturing interval loses roughly a fifth of them before infusion, and that attrition is a commercial loss as much as a clinical one.

Volume / Commodity-Adjacent Tier

Academic and hospital-exemption manufactured products delivered at institutional cost in markets where commercial pricing is unreachable, competing on access rather than on any performance or regulatory advantage. Clinical data from these programmes carries genuine international weight.
Gross Margin: 18-34%

Premium / Certified Tier

Approved autologous therapies delivered through certified treatment centres under negotiated reimbursement, protected by regulatory approval, referral networks and manufacturing infrastructure that took years to assemble. Manufacturing economics here are poor by pharmaceutical standards.
Gross Margin: 48-64%

Sustainability / Regulatory / Next-Generation Tier

Allogeneic, armoured and in-vivo CAR approaches promising batch economics and immediate availability, defended by construct intellectual property and by gene editing capability that few participants hold at clinical scale. None has reached full approval yet.
Gross Margin: 66-82%
chimeric-antigen-receptor-car-t-cell-therapy-marke-portfolio-architecture-1787306497356

High-value Sub-segments and Strategic Watch-out

Allogeneic and Off-the-Shelf Therapies

High value and the fastest growth at 22.8%, removing apheresis, manufacturing slots and attrition together. Durability against host rejection remains unresolved, and approval in a major market would reset the field's economics immediately. Every sponsor in the field is pursuing it. Nothing else changes the economics.
Gross Margin: 66-82%

Autologous BCMA-Directed Therapies

High value at 17.6%, carrying response depth in myeloma that exceeded expectations. Manufacturing capacity rather than demand constrains it, and bispecific competition is more advanced here than in lymphoma indications. Suite validation timelines cannot be compressed. Capacity rather than demand caps revenue here entirely. Expansion is underway.
Gross Margin: 48-64%

Autologous CD19-Directed Therapies

The established core at 12.4%, holding the certified centre relationships and reimbursement precedents everything else was built upon. Manufacturing economics are poor and bispecific antibodies compete directly in the same indications. Reimbursement precedents set here still govern the field. Bispecific competition is direct. Economics remain poor.
Gross Margin: 48-64%

In-Vivo CAR Generation Approaches

The strategic watch-out, engineering cells inside the patient and removing manufacturing altogether. Early clinical stage and scientifically demanding, but it would make every current manufacturing investment in this field redundant. Scientifically demanding and very early clinically. It would make current manufacturing investment redundant. Very early clinically.
Gross Margin: 70-86%

Who Refers and What Reaches Treatment

Revenue arrives as single high-value courses rather than as recurring therapy, which makes patient identification and referral the entire commercial mechanism. A treated patient generates roughly $465,000 once and then nothing, so volume depends on how many eligible patients reach a certified centre in time. Roughly 19% of those who begin the process never complete it, which means a fifth of committed commercial effort produces no revenue whatsoever.
Referral depth varies enormously by geography and certification density. Patients treated at academic centres with in-house certification reach therapy fastest and complete it most reliably. Those referred from community haematology face additional delay at every handoff, and each delay raises the probability of progression during the wait. Roughly 1,150 certified centres worldwide is the binding constraint on how much of the eligible population can be reached at all.

The referring physician profile is also broadening in ways that change commercial requirements. These therapies began as academic centre procedures discussed among transplant specialists. Community haematologists now refer directly, and they need to understand eligibility, timing and what happens to their patient during the manufacturing interval. That audience is far larger, considerably less specialised and reached through entirely different channels than the original one.
chimeric-antigen-receptor-car-t-cell-therapy-marke-end-use-penetration-index-1787306497847

Where Value Actually Sits

These are among the four positions where our research anticipates prominent divergence between winners and laggards over the coming forecast period. Each is grounded in the demand model, the regulatory perimeter, and the announced capacity pipeline.
01 / TURNAROUND TIME COMPETITION

Days beat response rates in this field

Approved products carry broadly comparable efficacy across overlapping indications, so referring haematologists increasingly select on how quickly a specific patient can actually be treated. Vein-to-vein time near 26 days is the figure they compare directly against each other, and every day removed reduces the roughly 19% attrition occurring between apheresis and eventual infusion. Sponsors that shortened manufacturing meaningfully gained referral share with no change whatsoever to their underlying clinical evidence, which tells you exactly where the binding constraint actually sits.
02 / CERTIFICATION NETWORK INVESTMENT

Support the centre before the patient exists

Roughly 1,150 certified treatment centres now operate worldwide, and each new certification converts an entire geography from referring its patients away into treating them locally instead. The certification process itself is slow, expensive and administratively demanding for any hospital to complete at all without direct help from a sponsor. Interviewed centres described certification support as the single most influential sponsor activity available to any of them, ranking it well ahead of clinical or commercial engagement of every other kind entirely.
03 / EARLIER LINE PRIORITISATION

Each line back triples the eligible population

Moving a therapy one line earlier in the treatment sequence multiplies the eligible patient population roughly threefold overall, while simultaneously reaching people who are healthy enough to survive a four-week manufacturing interval without progressing during it. That improves both the addressable population and the attrition rate simultaneously, which no new indication in the refractory setting can achieve at all. Sponsors that treat earlier-line expansion as secondary to pursuing additional new indications entirely have their commercial priorities precisely and expensively inverted.
04 / MANUFACTURING MODEL TRANSITION

The whole field is escaping autologous manufacturing

Allogeneic products held frozen in inventory remove apheresis, the manufacturing slot and the attrition that both create, letting a patient be treated within days of the treatment decision being made. That segment compounds at 22.8% despite having no fully approved product in any major market anywhere, which reflects what the field expects rather than what it has actually delivered. Sponsors without any allogeneic programme in development are defending a manufacturing model that the entire field is now actively trying to leave behind.

Engagement Snapshot From the Field

A live engagement with an industry participant carrying material or product regulatory and market exposure ahead of a defining policy shift, showing how our research translates into a defensible multi-year portfolio strategy.
MARKET MINDS ADVISORY · CLIENT ENGAGEMENT SUMMARY
Chimeric Antigen Receptor (CAR) T-Cell Therapy Producer Strategic Portfolio Review and Transition Roadmap 2026·Investment Scenario on Chimeric Antigen Receptor (CAR) T-Cell Therapy Exposure Evaluation 2025-26
CLIENT PROFILE
A cell therapy sponsor with annual revenue near $410 million (client-reported, unverified by MMA), holding one approved autologous CD19-directed product and a BCMA candidate in late-stage development. Revenue had plateaued despite growing clinical awareness, and leadership could not determine whether the constraint was referral generation, manufacturing capacity or competition from bispecific antibodies entering the same indications.
STRATEGIC CHALLENGE
Commercial spending was concentrated on clinical evidence communication and haematologist education, on the assumption that referral generation was the limiting factor. Leadership needed to establish where eligible patients were actually being lost, whether manufacturing investment would return more than commercial investment, and how bispecific competition was changing referral decisions in practice.
MMA APPROACH
We tracked patient flow from initial referral through apheresis to infusion across 14 certified centres, identifying loss points at each stage. Forty-one referring haematologists were interviewed on how they choose between cell therapy and bispecific antibodies. We modelled manufacturing turnaround reduction against additional commercial investment using treated patient count as the comparison.
KEY FINDINGS
  1. Patient loss was concentrated between apheresis and infusion at 21% rather than at referral, where the client had assumed the constraint sat and had directed its spending.
  2. Referring haematologists chose bispecific antibodies over cell therapy primarily on availability rather than on efficacy, and 33 of 41 said turnaround was their deciding consideration.
  3. Centres where the client had supported certification directly referred patients at roughly twice the rate of centres certified around a competitor product first.
  4. Reducing vein-to-vein time by seven days modelled a larger increase in treated patients than doubling the entire commercial education budget would have produced.
CLIENT PROFILE
A cell therapy sponsor with annual revenue near $410 million (client-reported, unverified by MMA), holding one approved autologous CD19-directed product and a BCMA candidate in late-stage development. Revenue had plateaued despite growing clinical awareness, and leadership could not determine whether the constraint was referral generation, manufacturing capacity or competition from bispecific antibodies entering the same indications.
STRATEGIC CHALLENGE
Commercial spending was concentrated on clinical evidence communication and haematologist education, on the assumption that referral generation was the limiting factor. Leadership needed to establish where eligible patients were actually being lost, whether manufacturing investment would return more than commercial investment, and how bispecific competition was changing referral decisions in practice.
MMA APPROACH
We tracked patient flow from initial referral through apheresis to infusion across 14 certified centres, identifying loss points at each stage. Forty-one referring haematologists were interviewed on how they choose between cell therapy and bispecific antibodies. We modelled manufacturing turnaround reduction against additional commercial investment using treated patient count as the comparison.
KEY FINDINGS
  1. Patient loss was concentrated between apheresis and infusion at 21% rather than at referral, where the client had assumed the constraint sat and had directed its spending.
  2. Referring haematologists chose bispecific antibodies over cell therapy primarily on availability rather than on efficacy, and 33 of 41 said turnaround was their deciding consideration.
  3. Centres where the client had supported certification directly referred patients at roughly twice the rate of centres certified around a competitor product first.
  4. Reducing vein-to-vein time by seven days modelled a larger increase in treated patients than doubling the entire commercial education budget would have produced.
RECOMMENDED STRATEGY
Phase 1: Phase one: redirect commercial investment toward manufacturing turnaround reduction, since patient loss occurs after referral rather than before it. Manufacturing returns more than education does. Phase 2: Phase two: fund treatment centre certification in geographies currently referring patients outward, building relationships years ahead of any treated patient. Phase 3: Phase three: reposition against bispecific antibodies on durability and single administration rather than contesting availability, which cannot be won. Availability is not a winnable argument.
OUTCOME
Manufacturing investment was reprioritised ahead of commercial expansion, reversing the previous allocation. Vein-to-vein time fell by five days within a year and treated patient numbers rose by roughly 18% (client-reported, unverified by MMA). Two certification support programmes were funded, and both centres began referring during the following year.

Frequently Asked Questions

Foundational context covering the market sizes, CAGR, scope, country, region and competition that inform every finding below. This section is provided to cover basics and most often pre-purchase conversations, answered from the MMA Primary Research Dataset.

What is the current size of the Chimeric Antigen Receptor (CAR) T-Cell Therapy Market?

The global market is valued at $5.4 billion in 2025, rising to $6.16 billion in 2026. East Asia holds the largest share at 31%, reflecting Chinese trial activity and domestically approved products.

How large will the Chimeric Antigen Receptor (CAR) T-Cell Therapy Market be by 2036?

MMA forecasts $25.36 billion by 2036, an increase of $19.20 billion over the 2026 base and an expansion multiple of 4.12x. Earlier-line approvals and allogeneic products carry most of that growth.

What is the CAGR for the Chimeric Antigen Receptor (CAR) T-Cell Therapy Market 2026 to 2036?

The base case compound annual growth rate is 15.2%, with a bull case at 16.6% and a bear case at 13.9%. Historical growth from 2020 to 2025 ran near 13.8%, set by manufacturing capacity rather than demand.

Which segment is growing fastest?

Allogeneic and off-the-shelf CAR therapies compound at 22.8%, a full 1.50x the market rate. A product held frozen removes apheresis, the manufacturing slot and the attrition that both create.

Who are the major companies in the Chimeric Antigen Receptor (CAR) T-Cell Therapy Market?

Novartis, Bristol Myers Squibb, Gilead Sciences, Johnson and Johnson and Legend Biotech together hold 84% of revenue from approved chimeric antigen receptor therapies. Concentration reflects how few products have reached approval.

Which country is growing fastest?

India compounds at 19.4%, faster than any other country covered, following domestic approval of an indigenously developed therapy priced at a small fraction of Western levels. That converted an unreachable therapy into an accessible one.

Report Segmentation Architecture

The full report scope spans multiple orthogonal segmentation dimensions, with cross-tabulated demand data provided for each dimension pair. Coverage extends further to regional breakdowns, trend trajectories, and the competitive detail needed to support segment-level decision-making.

By Therapy Class

  • Autologous CD19-Directed Therapies
  • Autologous BCMA-Directed Therapies
  • Allogeneic and Off-the-Shelf CAR Therapies
  • Next-Generation and Armoured CAR Constructs
  • In-Vivo CAR Generation Approaches

By End-Use Industry

  • Academic Cancer Centres
  • Certified Community Treatment Centres
  • Paediatric Oncology Programmes
  • Stem Cell Transplant Units
  • Hospital Exemption Manufacturing Programmes
  • Clinical Trial Sites

By Commercial Dimension

  • National Reimbursement Coverage
  • Outcomes-Based Payment Arrangements
  • Private Insurance Coverage
  • Hospital Exemption and Academic Supply
  • Managed Access and Named Patient Routes
  • Self-Funded and Cross-Border Treatment

By Region

  • East Asia
  • North America
  • Western Europe
  • South Asia and Pacific
  • Latin America
  • Middle East and Africa
  • Eastern Europe

Scope, Methodology, and Coverage

Every figure in this report is reproducible from documented input assumptions. The scope below maps the historical period, the forecast horizon, the segmentation dimensions, and the countries covered, alongside the underlying primary and qualitative methodology.
Historical Period
2020 to 2025
Forecast Period
2026 to 2036
Base Year
2025 (USD billions; MMA Primary Research Dataset, August 2026)
Market Definition
This market comprises chimeric antigen receptor T-cell therapies for haematological and solid tumour indications, measured at sponsor net revenue or institutional cost across national reimbursement coverage, outcomes-based payment arrangements, private insurance coverage, hospital exemption and academic supply, managed access and named patient routes, and self-funded or cross-border treatment. Coverage spans autologous CD19-directed therapies for lymphoma and leukaemia, autologous BCMA-directed therapies for multiple myeloma, allogeneic and off-the-shelf CAR therapies manufactured from healthy donor cells, next-generation and armoured constructs incorporating additional signalling or cytokine elements, and in-vivo CAR generation approaches engineering cells within the patient. T-cell receptor engineered therapies, tumour infiltrating lymphocyte therapies, natural killer and macrophage cell therapies without chimeric antigen receptors, bispecific and trispecific antibodies, haematopoietic stem cell transplantation, cell therapy manufacturing equipment, viral vectors and reagents sold as inputs, apheresis collection services billed independently, and lymphodepleting chemotherapy fall outside scope.
Quantitative Units
USD millions (sponsor net revenue); patients treated by therapy class; patients undergoing apheresis; vein-to-vein time; manufacturing attrition rate; certified treatment centres; price per course by market
Segmentation Dimensions
By Therapy Class; By End-Use Industry; By Commercial Dimension; By Region
Regions Covered
East Asia, North America, Western Europe, South Asia and Pacific, Latin America, Middle East and Africa, Eastern Europe
Countries Covered
China, Japan, South Korea, Taiwan, United States, Canada, Germany, France, United Kingdom, Italy, Spain, Netherlands, Belgium, Sweden, Switzerland, India, Australia, Singapore, Thailand, Malaysia, Brazil, Mexico, Argentina, Chile, Colombia, Saudi Arabia, United Arab Emirates, Israel, South Africa, Poland, Czechia, Hungary, Romania, Turkey, and additional markets relevant to cell therapy analysis
Key Companies Profiled
Novartis, Bristol Myers Squibb, Gilead Sciences, Johnson and Johnson, Legend Biotech, Allogene Therapeutics, Autolus Therapeutics, Arcellx, Caribou Biosciences, CARsgen Therapeutics, JW Therapeutics, IASO Biotechnology, Fosun Kite Biotechnology, ImmunityBio, Precision BioSciences, Cellectis, Adaptimmune Therapeutics, Immatics, ImmunoACT, Miltenyi Biotec
Quantitative Methodology
Primary survey, n=3,800 respondents, Q4 2025, six countries; demand-side model with trade association cross-validation
Qualitative Methodology
47 expert interviews, Q4 2025; applied to validate demand model assumptions, identify emerging dynamics, and assess competitive positioning
Report Format
PDF and XLSX data workbook (Word format preview document)
Publisher
Market Minds Advisory
Report Code
MMA-2026-HLT-528
Published
August 2026
Contact
sales@marketmindsadvisory.com | www.marketmindsadvisory.com

Purchase the full Chimeric Antigen Receptor (CAR) T-Cell Therapy Market Report (2026 to 2036).

The full MMA report treats manufacturing turnaround as the clinical and commercial variable it actually is, and quantifies the patients lost between apheresis and infusion. It sizes five therapy classes and seven regions to 2036, modelling patients treated, apheresis volumes, vein-to-vein time, attrition rates, certified centre counts and pricing by market separately. Competitive assessment covers twenty sponsors on one consistent revenue basis. Cost exposure is traced through vectors, reagents and cleanroom operation. Four commercial levers and a strategic verdict close the report, grounded in 47 expert interviews and a 3,800-respondent survey.
Five therapy classes sized separately through 2036
Patient flow tracked from referral through apheresis to infusion
Certified treatment centre coverage mapped across every covered market
Twenty sponsors assessed on one consistent revenue basis
Bispecific antibody competition modelled against cell therapy referral decisions
Anonymised sponsor engagement with tested investment allocation recommendations

Built For The People Who Decide

From boardroom strategy to bench-side execution, this report is read cover-to-cover by leaders shaping the next decade of their industry, turning demand scenarios, market dynamics and valuation benchmarks into decisions.
CXOs/ Presidents/ VPs/ Managers
M&A and Corporate Development
Strategy Teams and R&D Heads
Procurement and Product Directors
Regulatory and Compliance Leaders
Investor Relations and Equity Analysts