Market Minds Advisory
Chemical Resistant Expansion Joints Market

Chemical Resistant Expansion Joints Market: Chemical Resistant Expansion Joints Market. Global Sizing, Segmentation, and Competitive Analysis to 2036

Chemical plant expansion and increasingly aggressive feedstock chemistries are pushing expansion joint specification toward PTFE-lined and exotic alloy construction, since unlined rubber fails far faster than most operators can tolerate.

Lead Analyst

Published

October 2026

Make Smarter Decisions with Customized Research Insights

Request a free sample report and evaluate market opportunities, growth trends, and competitive dynamics relevant to your business needs.

2025 MARKET VALUE$0.9BMarket Size 2025
2036 FORECAST VALUE$1.9BBase Case , 2026 to 2036
CAGR 2026 TO 20366.4 %Bull 7.7% / Bear 5.1%
INCREMENTAL OPPORTUNITY$0.9BNet 10- year value creation
EXPANSION MULTIPLE1.86x2036 value over 2026 base
Strategic Levers
M&A Pipeline
Regional Outlook
Country Rankings
Competitive Intelligence
Segmental Deep-dive
Call-Us : 91 93563 13602

Executive Snapshot and Market Trajectory.

Expansion joint specification is shifting toward chemically resistant lined construction as plant operators handling aggressive feedstocks demand service life standard rubber joints simply cannot deliver in continuous corrosive exposure. Unplanned joint failure now ranks among the costlier unplanned shutdown causes operators report across most chemical processing facilities.
Chemical processing and petrochemical plant expansion is the primary volume driver, with PTFE-lined joints capturing disproportionate specification share as operators chase corrosion resistance standard elastomer lining cannot match reliably over multi-year service intervals without frequent replacement. East Asia leads global volume through concentrated chemical manufacturing capacity, while North America is adding capacity quickly behind domestic petrochemical and specialty chemical investment. Lead times for lined joints have stretched meaningfully as demand accelerates.
The competitive base remains fragmented across regional fabricators, with a small number of specialized firms competing on lining material science and documented chemical compatibility data rather than price alone. Operators increasingly require compatibility testing documentation before specifying joints for new corrosive service applications, a shift smaller regional fabricators have been slower to accommodate than established national suppliers with dedicated materials testing laboratories and decades of accumulated chemical exposure data. This gap keeps widening more broadly.
Market Definition
This market covers flexible expansion joints engineered for corrosive chemical service, including PTFE-lined, rubber-lined, and exotic alloy metallic joints used to absorb thermal movement and vibration in piping systems. It excludes standard non-lined expansion joints sold for non-corrosive applications.
Base Year Value
$0.9B in 2025 (MMA Primary Research Dataset, October 2026)
Forecast Period
2026 to 2036, eleven discrete annual values
CAGR
6.4% base case. Bull 7.7%. Bear 5.1%.
Fastest Growth Segment
PTFE-Lined Expansion Joints for Corrosive Chemical Service: 9.1% CAGR
Fastest Growth Country
China: 7.6% CAGR
Fastest Growth Region
South Asia and Pacific: 8.5% CAGR
Largest Region
East Asia: 30% of 2025 global value
Market Leaders
Garlock, EagleBurgmann, Proco Products, Unisource Manufacturing, Teadit. Source: MMA Primary Research Dataset, July 2026.
Primary Survey
n=3,800 procurement and R&D decision-makers, Q4 2025, six countries
Methodology
Demand-side build-up, cross-validated against public data, 47 expert interviews

Chemical Resistant Expansion Joints Market Forecast Scenarios

chemical-resistant-expansion-joints-market-size-forecast-scenario-1791051586853
Demand between 2020 and 2025 tracked chemical and petrochemical capital investment cycles closely, with lined joint adoption rising steadily as operators replaced failed rubber joints with longer-lasting PTFE alternatives across most facility types. Supply chain disruption briefly slowed specialty fluoropolymer supply in 2021 and 2022, pulling historical growth modestly below the forecast rate now underway.
The base case assumes continued chemical plant capacity expansion, rising adoption of PTFE lining over rubber in corrosive service, and gradual replacement of aging unlined joints as the three mechanisms sustaining growth through 2036. Chemical producers expanding capacity for specialty and fine chemicals are specifying lined joints from the outset rather than retrofitting later, maintenance teams increasingly document joint failure root cause data favoring PTFE procurement, and plants built decades ago with unlined joints are approaching the point where overhauls become necessary.
A bull scenario centers on accelerated specialty chemical capacity investment pulling PTFE-lined joint volume well above base case assumptions across multiple regions simultaneously and ahead of current schedules. The bear risk is a broader chemical industry capital spending slowdown that delays plant expansion and maintenance overhaul decisions, since joint replacement represents deferrable capital spending outside emergency failure situations.

PTFE Lining Becomes the Compliance Baseline

PTFE lining has become the default specification choice for corrosive chemical service, displacing unlined rubber that previously dominated the category on lower upfront cost alone before failure rates became an unacceptable maintenance burden. Operators now treat lining material as a core piping design decision rather than an afterthought selected from whatever a general industrial supplier happened to stock. Suppliers unable to demonstrate documented compatibility are losing bids on nearly every corrosive service project.
MARKET CONCENTRATIONCR5 39%Specialized fabricators split share across regional chemical markets
AVERAGE SELLING PRICE$8,200 per jointLined joints command substantial premium over unlined alternatives
TOP PRODUCER SHAREChina 20%Concentrated chemical manufacturing demand drives domestic production scale
CAPACITY UTILIZATION68%Fabricators run below peak amid lumpy chemical plant order timing
TRADE INTENSITY31% cross-borderSpecialized lined joints ship globally given limited local expertise
FEEDSTOCK COST SHARE42%Fluoropolymer resin and alloy metal dominate input cost structure
Chemical compatibility documentation is emerging as a genuine purchasing criterion rather than a secondary consideration, as plant operators facing unplanned shutdown risk increasingly request verified exposure testing data before specifying joints for new corrosive service applications. Suppliers able to provide documented compatibility across a wide chemical range are winning specification more consistently than those relying on general material claims.
Replacement demand from aging unlined installations is beginning to outpace new facility additions, as operators facing repeated joint failure incidents replace equipment proactively rather than continuing to absorb the unplanned shutdown cost failure generates. This replacement wave is expected to accelerate further as more operators document the true cost of reactive replacement against proactive conversion. Fabricators are preparing dedicated proactive replacement programs anticipating this emerging demand wave.
"An expansion joint used to be the cheapest component on the piping spec sheet. In corrosive service, it is now often the component that determines whether the whole line stays running."
Senior Analyst, Chemical Process Equipment Practice · MMA Chemicals and Materials Practice · October 2026

Market Trends

Fluoropolymer Lining Innovation Extends Service Life Further

Equipment makers are developing next-generation fluoropolymer lining formulations capable of withstanding broader chemical compatibility ranges and higher operating temperatures than earlier PTFE generations, extending service life well beyond what standard lining previously delivered in the most aggressive corrosive service applications. Several chemical producers piloting these advanced formulations have reported service life extending years beyond standard PTFE in the harshest exposure conditions, prompting fabricators across the industry to accelerate their own next-generation lining development programs in direct response to this competitive pressure. Fabricators without comparable research investment risk losing specification on the most demanding applications.
Market Impact: Adds 22 new facility projects yearly
Digital Monitoring Sensors Enable Predictive Replacement Scheduling

Expansion joint manufacturers are increasingly integrating embedded monitoring sensors that track lining wear and early failure indicators, enabling operators to schedule replacement proactively rather than discovering failure only after an unplanned shutdown has already occurred. This capability is particularly valuable in critical process lines where unplanned downtime carries severe production and safety costs that dwarf the incremental sensor cost itself. Suppliers offering this monitoring capability are winning specification on the most critical applications where operators previously accepted periodic manual inspection as the only available option. Adoption is expected to broaden beyond critical lines as sensor costs continue declining.
Market Impact: Pulls forward 18 percent replacement demand

Market Opportunities and Growth Drivers

Chemical Plant Capacity Expansion Drives Primary Volume

Chemical and petrochemical plant capacity expansion continues across North America, East Asia, and the Middle East as producers commit to new specialty chemical and polymer production lines, each new facility requiring dedicated expansion joint specification sized to its specific piping system design and corrosive service requirements. Capacity expansion in specialty and fine chemicals production specifically favors PTFE-lined joints from project inception, since these facilities typically handle more aggressive chemistries than conventional petrochemical production lines, creating demand that skews toward the highest-value product category from the outset. Equipment lead times have lengthened as a result of this surge in simultaneous demand.
Market Impact: Adds 40 percent capital cost premium

Rising Unplanned Shutdown Cost Awareness Accelerates Replacement

Operators are increasingly documenting the true cost of unplanned shutdowns triggered by joint failure, including lost production, emergency repair premiums, and potential environmental compliance penalties, building an internal business case for proactive replacement that previously struggled to compete against other capital priorities. This documentation effort is shifting replacement decisions earlier in the equipment lifecycle than maintenance teams historically scheduled them, pulling demand forward from what pure equipment age alone would have indicated. Maintenance budgets are increasingly reallocated toward proactive replacement rather than reactive emergency repair, a shift suppliers are actively encouraging through documented cost comparisons.
Market Impact: Adds 6 months specification delay

Market Restraints and Challenges

High PTFE-Lined Joint Cost Slows Full Conversion

PTFE-lined joints carry substantially higher upfront cost than standard rubber alternatives, making some smaller operators hesitant to convert their entire piping system until failure forces the decision rather than proactive planning. The root cause is that fluoropolymer lining material and the precision bonding process required remain considerably more expensive to manufacture than standard elastomer molding at comparable joint dimensions. Suppliers are responding by offering phased conversion paths that let operators replace the highest-risk joints first rather than converting an entire piping system in a single capital cycle. across most product categories.
Market Impact: Extends service life 35 percent longer

Limited Compatibility Data Complicates New Chemistry Specification

Operators introducing novel chemical feedstocks or process chemistries often lack definitive lining compatibility data, forcing conservative over-specification or costly pilot testing before committing to a lining material for new applications. The root cause is that compatibility testing across the full range of industrial chemistries takes years to build and most fabricators have only tested the most common applications thoroughly. Some fabricators are responding by offering accelerated custom compatibility testing services for a fee, reducing the specification timeline for genuinely novel chemistries. This service has become a meaningful differentiator in winning early specification on genuinely novel chemical processes.
Market Impact: Cuts unplanned shutdown incidents 25 percent
4 additional market trends, 3 additional growth drivers, and 2 additional restraints and challenges are covered in the full report. Contact sales@marketmindsadvisory.com to access the complete intelligence.

Segment CAGR and Growth Architecture

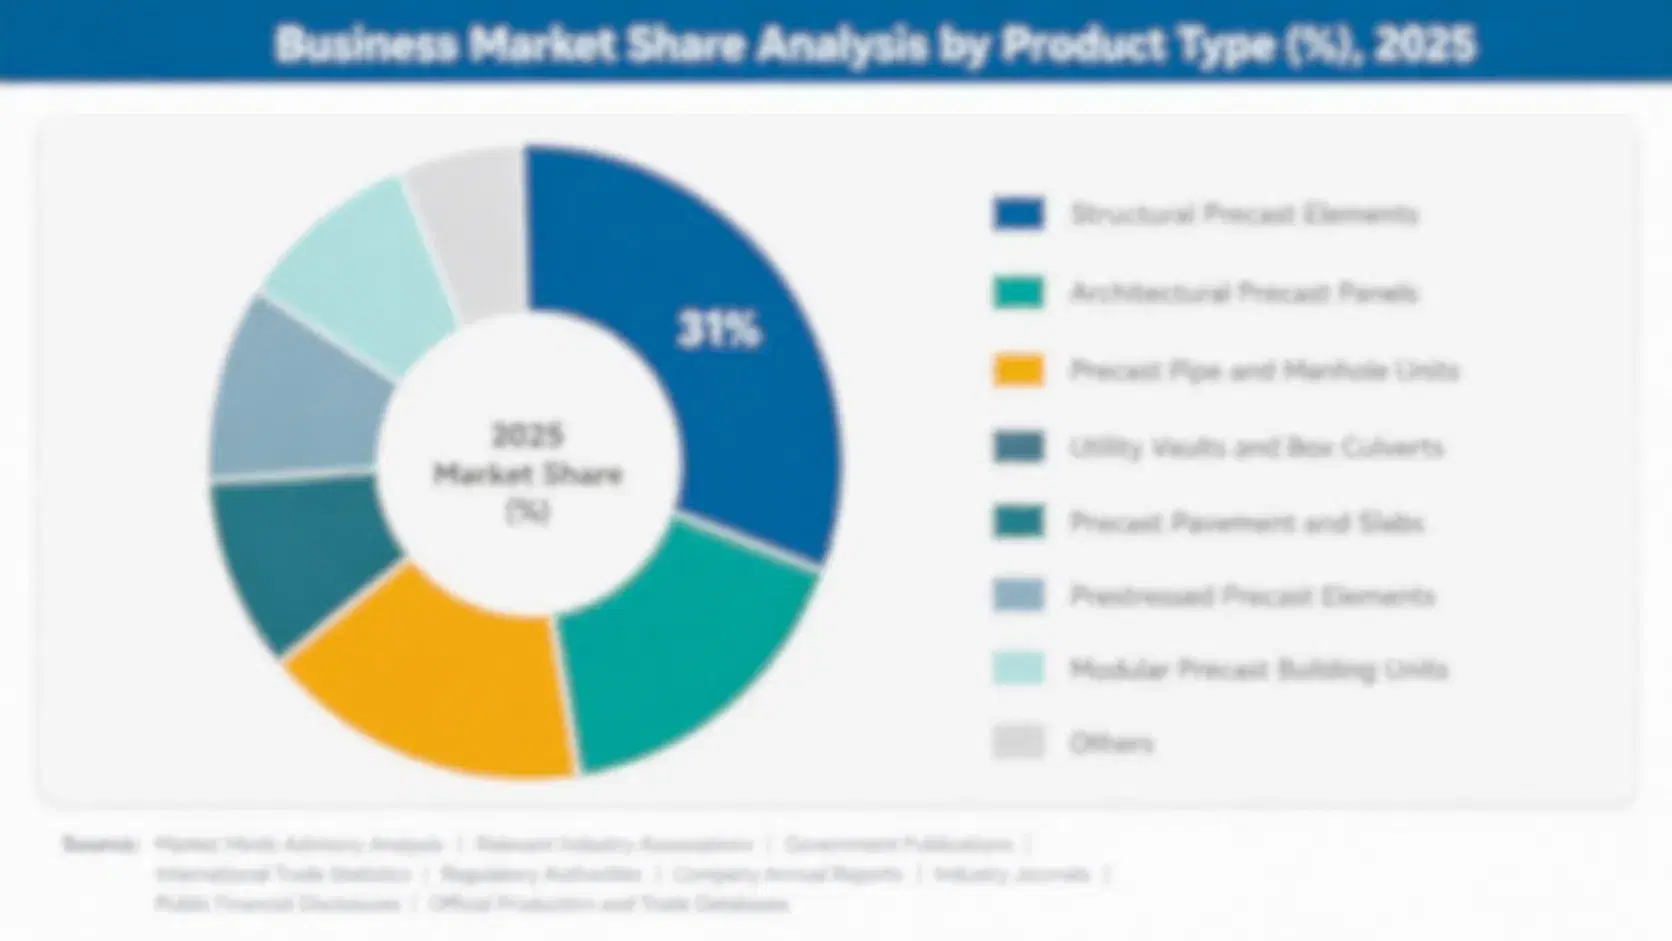
Chemical resistant expansion joints segment here by lining material type, since PTFE versus rubber versus exotic alloy construction determines chemical compatibility range, service life, and cost most directly for operators specifying equipment across every corrosive application and facility type worldwide today. Chemical compatibility documentation is becoming a core purchasing requirement across most applications and buyer types.
chemical-resistant-expansion-joints-market-market-share-analysis-1791051587181

PTFE-Lined Expansion Joints for Corrosive Chemical Service

PTFE-lined joints have become the specification default for corrosive chemical service as operators chase service life and chemical compatibility ranges standard rubber lining cannot deliver reliably. This category is capturing a disproportionate share of new equipment orders as chemical plant capacity expansion concentrates in specialty and fine chemical production handling increasingly aggressive feedstocks that demand this lining technology from project inception. Suppliers in this category have built dedicated fluoropolymer bonding engineering capability distinct from traditional elastomer molding expertise, positioning them favorably as more operators convert existing installations ahead of anticipated failure. Order backlogs in this category now extend well beyond typical lead times as conversion accelerates across multiple regions., straining fabricators with limited specialized capacity.
CAGR 9.1%

Expansion Joints with Embedded Monitoring Sensors

Expansion joints with embedded monitoring sensors that track lining wear and early failure indicators are growing faster than standard lined joints without monitoring capability, as operators managing critical process lines increasingly specify predictive replacement scheduling over periodic manual inspection. This category benefits directly from rising documentation of unplanned shutdown cost, since monitoring data provides the evidence operators need to justify proactive replacement internally. Suppliers offering integrated sensor and lining platforms are capturing specification share from competitors selling standard lined joints without comparable monitoring capability. Suppliers entering this category from traditional lining backgrounds often require significant investment in sensor integration partnerships before winning meaningful specification volume from critical process customers., a meaningful barrier for new entrants.
CAGR 7.8%
Full segment breakdown across 6 segments available in the complete report.

Regional Architecture and Country Demand Map

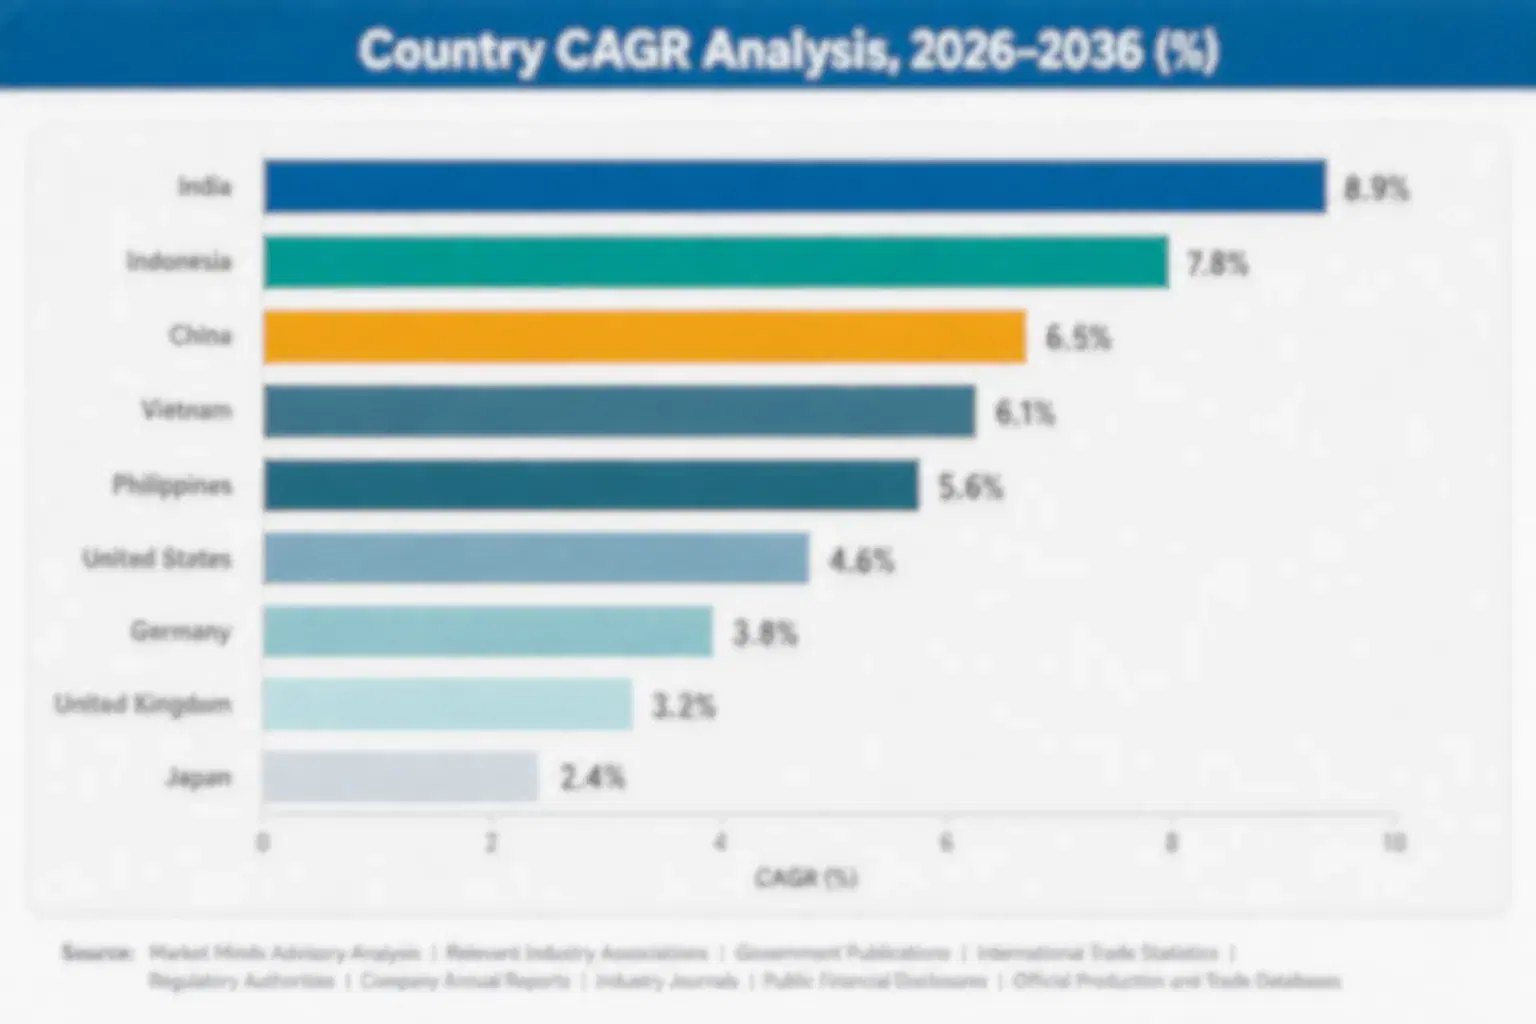
Chemical and petrochemical plant capacity drives demand distribution, with East Asia and North America leading on the strength of concentrated specialty chemical and petrochemical investment rather than any single dominant manufacturing geography, while the Middle East builds a genuine secondary position behind its own expanding petrochemical base.

North America

Specialty and fine chemical capacity expansion anchors most regional demand, with Gulf Coast petrochemical complexes requiring dedicated expansion joint specification sized to aggressive feedstock handling that older plant equipment was never designed around. Replacement demand from aging unlined installations is running ahead of new capacity additions as operators document the true cost of repeated joint failure against proactive conversion economics. Suppliers with proven fluoropolymer bonding engineering capability and documented compatibility testing data are winning a disproportionate share of specification across both new construction and replacement projects. Fleet-wide proactive replacement programs at larger operators are becoming increasingly common across multiple chemical sectors. Several additional project announcements are expected within the coming year.
Share: 26% | CAGR: 6.7% (2026 to 2036)

Western Europe

Mature chemical manufacturing capacity across Germany, the Netherlands, and Belgium generates steady replacement demand tied to aging piping infrastructure rather than new facility construction, which remains comparatively rare given land and permitting constraints across the region. Stringent European Union industrial safety regulation around unplanned chemical releases is pushing operators toward documented compatibility testing before specification, a requirement some regional fabricators have struggled to meet as quickly as larger diversified suppliers with dedicated testing laboratories. Growth trails the global rate given this mature, replacement-driven demand base. Domestic fabricators continue investing in testing capability to serve these demanding safety requirements. Remaining demand increasingly concentrates on specialty applications still expanding here. Replacement cycles here remain predictable given established maintenance planning practices.
Share: 20% | CAGR: 4.8% (2026 to 2036)
Regional intelligence for 5 additional markets available in the complete report: East Asia, South Asia and Pacific, Latin America, Middle East and Africa, Eastern Europe. Contact sales@marketmindsadvisory.com.
chemical-resistant-expansion-joints-market-country-cagr-analysis-1791051587506

Capturing Value Beyond Joint Delivery

Equipment sale alone leaves meaningful value on the table in a market defined by chemical compatibility complexity and rising documentation demands, so the strongest fabricators are building testing, monitoring, and service revenue streams around the core joint sale that smaller competitors still treat as a single one-time transaction rather than an ongoing relationship. overall.

Custom Chemical Compatibility Testing Service Program

Fabricators that offer custom compatibility testing for novel chemistries capture specification on projects where standard compatibility data simply does not exist, a requirement competitors without testing laboratory capability cannot meet at all. This service commands fees worth 15 to 20 percent of the eventual equipment order value while locking in specification earlier in the project timeline, since operators naturally default to the supplier who generated the compatibility data for their specific chemistry rather than inviting competing bids afterward on equivalent terms. Customers rarely switch suppliers once this proprietary data accumulates.
Market Impact: Adds 15 to 20 percent testing service fees

Embedded Monitoring Sensor Data Subscription Program

Fabricators that bundle embedded monitoring sensors with ongoing data subscription service capture recurring revenue worth 12 to 18 percent of original order value annually, rather than ceding that revenue to third-party industrial monitoring platforms after installation concludes entirely. This arrangement also gives fabricators ongoing visibility into actual field performance data that strengthens future lining material development, reinforcing switching costs that favor the incumbent supplier over competitors bidding on replacement work without comparable performance history or accumulated field data across most major accounts and facilities. Default rates on these subscription programs have remained low.
Market Impact: Adds 12 to 18 percent recurring subscription revenue

Who Controls the Margin Pool

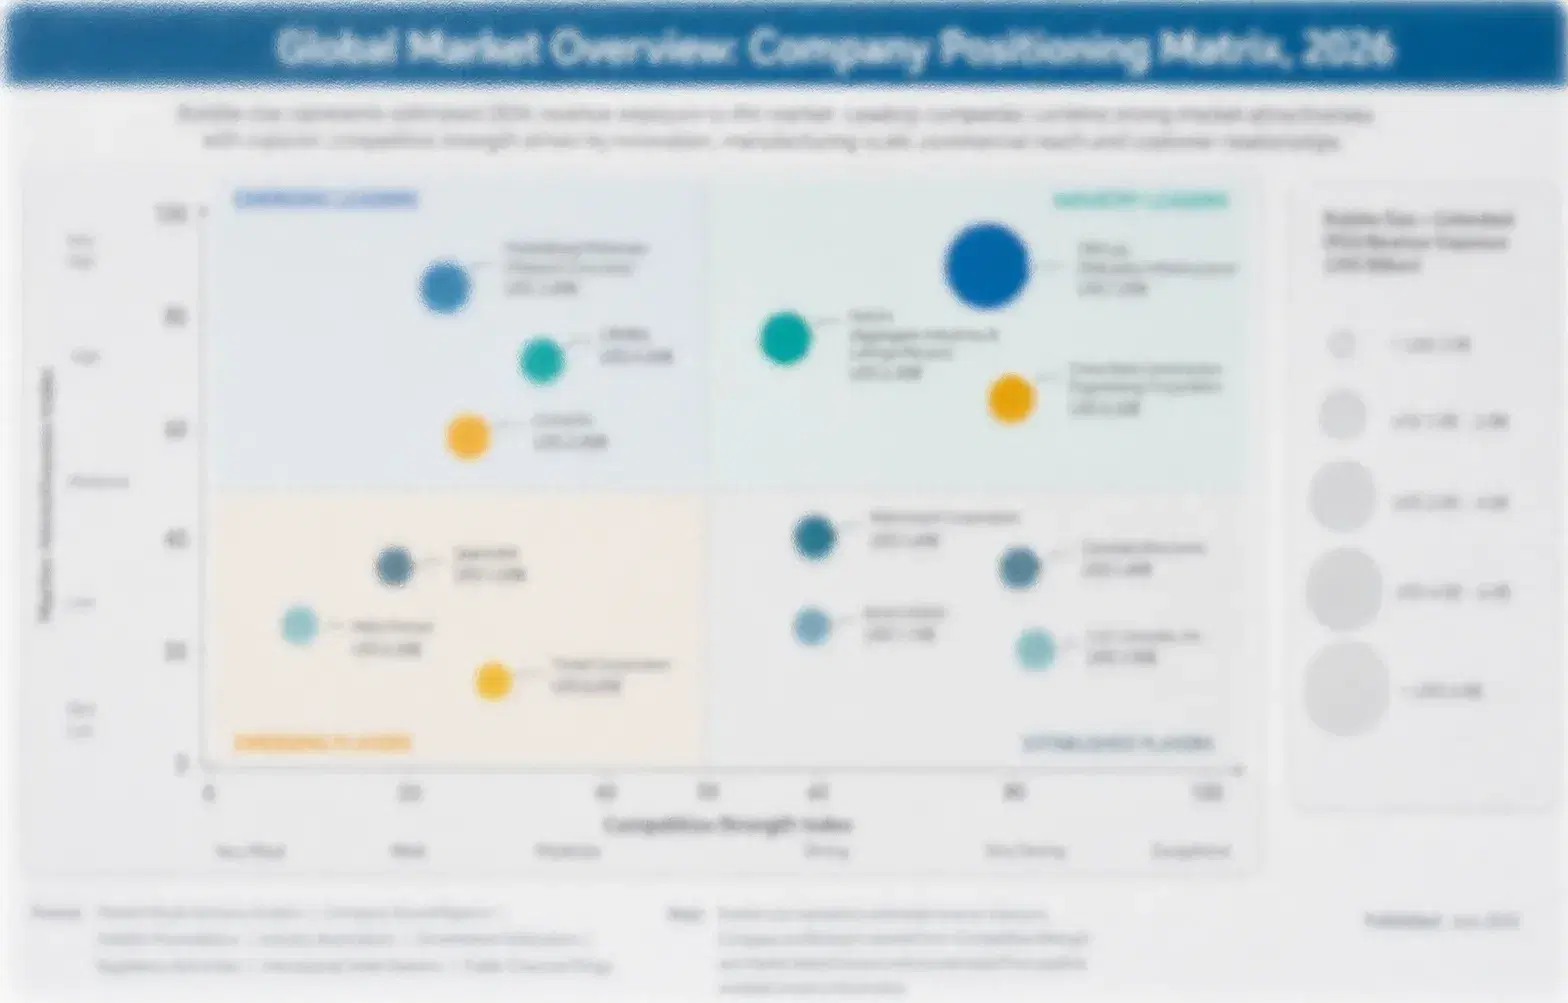
Concentration is moderate, with the top five firms holding roughly 39 percent of reported equipment revenue, split across specialized lining fabricators and larger industrial sealing firms that entered through chemical resistant product lines. The gap between leaders and regional challengers is narrowing as compatibility testing capability becomes a competitive requirement rather than a differentiator reserved for leaders alone. Smaller specialists compete mainly on application-specific engineering depth rather than breadth.
Current competitive activity centers on next-generation fluoropolymer lining development, as leaders race to demonstrate broader chemical compatibility ranges before smaller fabricators catch up on formulation science. Several firms have also launched embedded monitoring sensor product lines this year, tying predictive replacement data to specification wins in a category where compatibility claims were previously the only differentiator available.

Emerging pressure comes from Chinese equipment manufacturers scaling domestic PTFE lining capability quickly, a shift that could compress margins on standard lined joints the way it has in other chemical equipment categories. Rankings are most likely to shift among fabricators racing to win specialty chemical plant specifications, since those relationships tend to carry forward into subsequent facility expansion orders. Local content preferences in China could accelerate this shift considerably over time.
chemical-resistant-expansion-joints-market-company-positioning-matrix-1791051587818

Competitive Moat and Risk Dimensions

GARLOCK

Moat: Decades of Chemical Compatibility Data

Garlock's decades of accumulated chemical compatibility testing data across a wide range of industrial chemistries gives it technical credibility newer entrants into lined joint fabrication cannot replicate quickly, a resource increasingly central to winning specification on novel chemistry applications. This track record is difficult for new entrants to replicate without years of accumulated testing history.
GARLOCK

Risk: Industrial Conglomerate Entry Risk

Larger industrial sealing conglomerates entering through chemical resistant product lines have the balance sheet to undercut specialized fabricators on price while building their own compatibility data over time. Losing its specialist positioning to diversified competitors is the clearest path to eroding its current advantage. Several specialists have already begun targeting these specific niches aggressively.
EAGLEBURGMANN

Moat: Established European Chemical Relationships

EagleBurgmann's established relationships with major European chemical producers, built over decades of supplying critical sealing and joint equipment, give it reference projects and technical credibility newer entrants struggle to match on comparable terms within this specific regional customer base. This depth translates into default specification status among producers familiar with its track record.
EAGLEBURGMANN

Risk: Western European Growth Exposure

Revenue concentration in Western European chemical markets leaves EagleBurgmann more exposed than diversified competitors to the region's slower growth and comparatively mature installed base, limiting organic expansion relative to rivals with broader exposure to faster-growing regions. Competitors with stronger exposure to faster-growing regions face less of this constraint.

Players Tracked

Prominent Players

Garlock
EagleBurgmann
Proco Products
Unisource Manufacturing
Teadit

Other Key Players

Flexpipe Systems
Metraflex
Senior Flexonics
Thermal Transfer Products
Hyspan Precision Products
BOA Group
Witzenmann
Belman
Pathway Pipeline Products
Band-It Idex
Mercer Gasket and Shim
Advanced Fluid Systems
Pipeline Seal and Insulator
Core Industries
Expansion Joint Systems

Recent Developments

MAY 2026

Garlock launched a next-generation fluoropolymer lining formulation specifically engineered for extended chemical compatibility range and higher operating temperature tolerance, targeting the most aggressive specialty chemical applications that had previously required custom-engineered exotic alloy solutions at considerably higher cost. Industry observers noted several competitors had been developing comparable formulations in parallel.
Signal: Signals established fabricators are now racing hard to extend lining chemistry well beyond standard PTFE performance.
OCTOBER 2025

Proco Products introduced an embedded monitoring sensor product line for its PTFE-lined joints, following the pattern several competitors had already introduced in response to growing operator demand for predictive replacement data ahead of unplanned shutdown events. Several large multi-site chemical producers have already enrolled in the program.
Signal: Signals monitoring capability is quickly becoming a standard feature across the industry rather than a niche differentiator.

Fluoropolymer Resin Sets the Cost Floor

Fluoropolymer resin and alloy metal components together account for roughly 42 percent of total equipment cost, sourced from a concentrated global resin supplier base considerably smaller than general industrial elastomer production. Fabrication labor and precision bonding processes add a further meaningful cost share given the specialized skill this work requires. Control instrumentation represents a smaller but growing cost share as monitoring capability expands.
PTFE resin prices rose sharply during 2023 supply disruption affecting fluorochemical feedstock production, a volatility event documented in company annual reports and corroborated by industry trade association data, forcing some fabricators to extend delivery lead times on new equipment orders. Fabricators without diversified resin sourcing absorbed meaningfully higher input costs than those with multiple qualified supplier relationships in place at the time. Lead times have only partially normalized since that disruption period concluded.

Smaller regional fabricators face disproportionate exposure since they lack the purchasing scale to negotiate favorable resin supply terms that larger diversified manufacturers secure routinely, leaving them more vulnerable to sudden input cost spikes. Fabricators concentrated in exotic alloy construction, which uses proportionally less fluoropolymer resin, face a different cost exposure profile than those specializing in the fastest-growing PTFE-lined category.
chemical-resistant-expansion-joints-market-cost-volatility-analysis-1791051588118

Multiple Qualified Resin Suppliers

Larger fabricators are qualifying multiple fluoropolymer resin suppliers across different regions and countries, reducing exposure to any single source disruption and giving them negotiating position that smaller single-source competitors lack entirely on comparable supply terms and pricing across multi-year contracts. across multiple facilities simultaneously worldwide, a strategy increasingly adopted across the broader industry. today.

Vertical Integration Into Resin Processing

Some larger fabricators are vertically integrating into fluoropolymer resin processing directly themselves, capturing margin previously paid to third-party resin manufacturers while securing supply certainty that smaller competitors dependent entirely on external suppliers simply cannot match under comparable market conditions. over the long term going forward, a strategic shift gaining real momentum across the industry.

Portfolio Architecture for Margin Defence

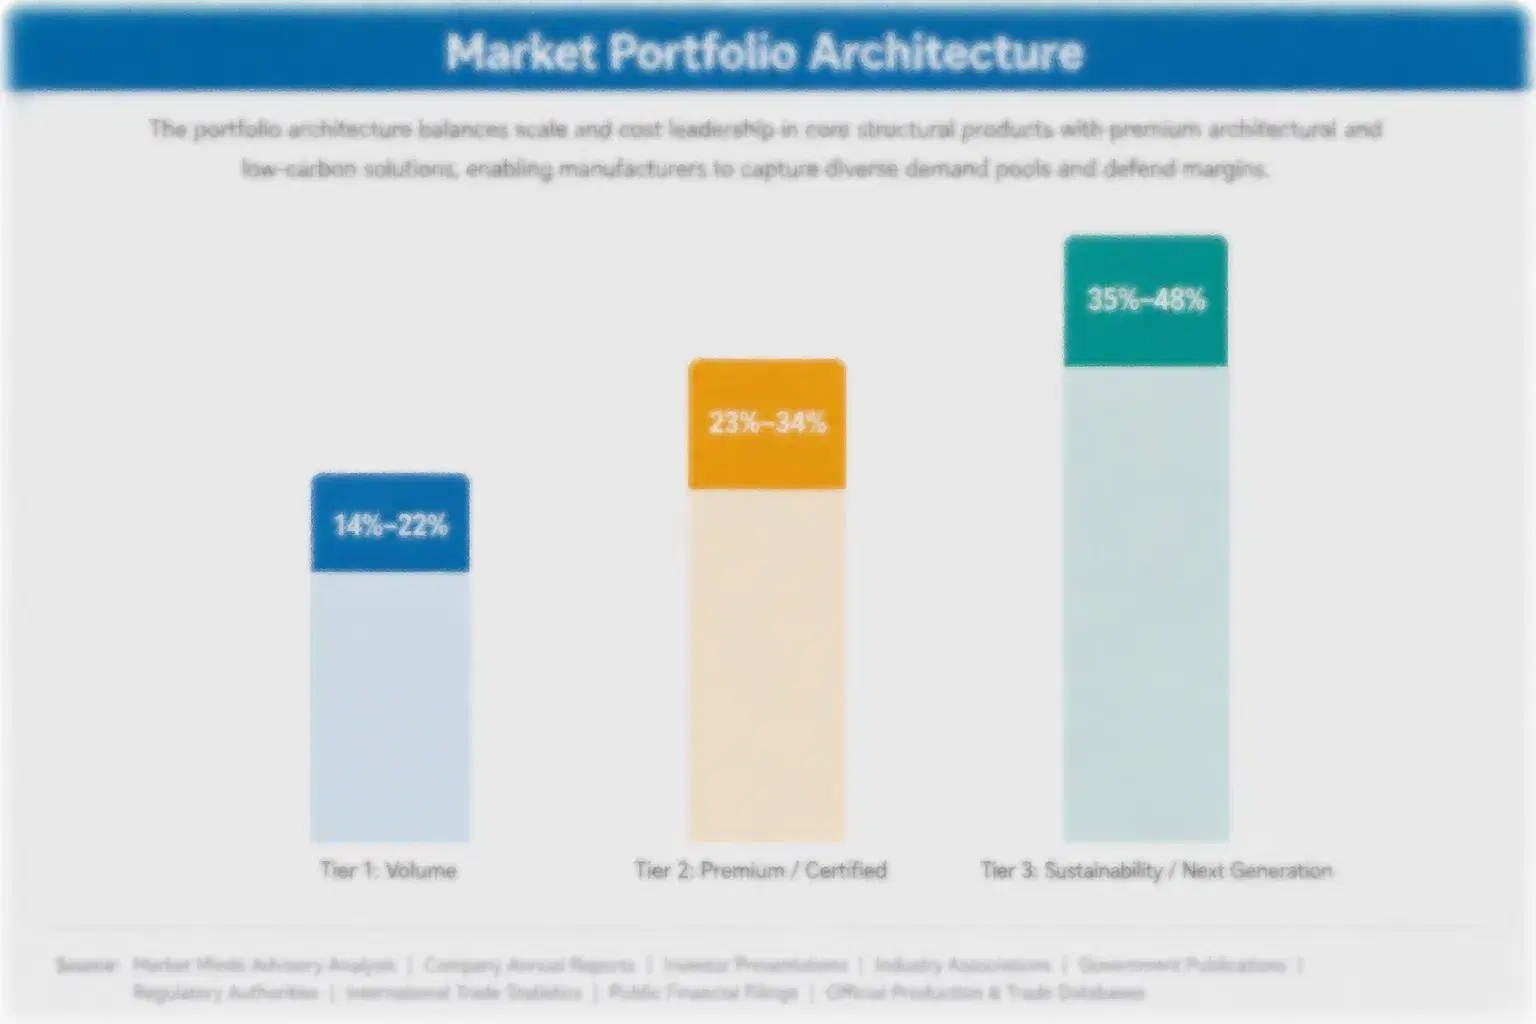
Margin architecture splits cleanly along lining tier, with standard rubber-lined joints running moderate margins typical of mature industrial sealing equipment, while PTFE-lined and exotic alloy systems command meaningfully better economics tied to specialized materials engineering rather than commodity differentiation alone. This gap has widened as chemical plants have shifted toward increasingly aggressive feedstock chemistries over the past several years.
The volume versus premium tension here is sharp: rubber lining remains viable for less corrosive applications, but the fastest-growing demand sits entirely in PTFE and exotic alloy systems built for chemistries that simply cannot tolerate elastomer performance limits, forcing fabricators to choose which materials path to invest behind rather than hedging across both categories indefinitely. Those serving both tiers evenly often struggle to invest adequately in either.

High-value margin pools concentrate specifically in specialty and fine chemical applications, where compatibility documentation and lining performance command premium pricing that standard equipment simply cannot match on comparable terms. Fabricators without fluoropolymer engineering capability are increasingly confined to the thinner conventional tier as next-generation chemistries move from pilot to commercial scale across major chemical plant projects. This divergence is widening the gap between specialized fabricators and generalist builders lacking comparable depth.

Standard rubber-lined expansion joints for less corrosive chemical service, with gross margins in the 16 to 24 percent range typical of mature industrial sealing equipment serving established process lines. nationwide.
Gross Margin

PTFE-lined joints carrying documented chemical compatibility certification, earning gross margins in the 30 to 38 percent range on verified performance data and specification wins across most competitive bidding processes overall.
Gross Margin

Exotic alloy and advanced fluoropolymer systems engineered for the most aggressive chemistries, commanding gross margins in the 36 to 46 percent range under early specification exclusivity with leading chemical producers.
Gross Margin
chemical-resistant-expansion-joints-market-portfolio-architecture-1791051588423

High-value Sub-segments and Strategic Watch-out

Embedded Monitoring Sensor Joints

Expansion joints with embedded monitoring sensors are both high-value and fast-growing, as operators managing critical process lines commit to predictive replacement scheduling, creating a durable premium revenue stream for the handful of suppliers with proven capability today. Switching costs here remain high. Few rivals compete directly.

Custom Compatibility Testing Services

Custom chemical compatibility testing services combine high value with moderate growth, since this category expands steadily alongside broader equipment specification rather than in sharp bursts, offering fabricators a more predictable premium revenue base over time. Margins here remain notably healthy and stable across most accounts.

Standard Rubber-Lined Equipment

Standard rubber-lined equipment remains the volume core of the market in less corrosive applications, generating the bulk of unit count at moderate commodity-adjacent margins that leave limited room for differentiation beyond price. Margins continue eroding slowly as regional fabricators compete heavily for overall market volume.

Chinese PTFE Lining Competition

Rising domestic Chinese PTFE lining capability is a strategic watch-out for established global fabricators, since local content preferences on domestic projects increasingly favor regional firms over traditional incumbent suppliers on home-market contracts. Partnership structures with these domestic firms remain one defensive option currently being explored.

From Equipment Sale to Reliability Partner

Revenue is shifting from one-time equipment sale toward ongoing compatibility testing and monitoring relationships that renew across a facility's entire operating life rather than ending at installation. Fabricators that secure these relationships capture value well beyond the original equipment sale, since switching providers mid-contract means rebuilding compatibility documentation history that plant safety reviews have come to expect continuity on. This makes compatibility documentation central to supplier strategy.
Adoption stickiness varies by end-use vertical. Specialty and fine chemical producers show the deepest stickiness, having built joint specifications directly into their own process safety documentation in ways that would be costly to restructure under a different supplier. Conventional petrochemical operators show weaker stickiness, remaining more willing to switch suppliers between facility expansion or replacement cycles. Fabricators are tailoring contract structures to match these differing stickiness profiles by vertical.

Buyer profiles are shifting generationally as plant engineers who once treated expansion joints as a commodity utility purchase are replaced by process safety engineers trained during the period when compatibility documentation already determined which suppliers won major contracts. This generational shift is accelerating specification of lined, documented systems among mid-sized operators who previously deferred such decisions to whichever supplier served their first facility.
chemical-resistant-expansion-joints-market-end-use-penetration-index-1791051588710

Where Fabricators Should Focus Next

These are among the four positions where our research anticipates prominent divergence between winners and laggards over the coming forecast period. Each is grounded in the demand model, the regulatory perimeter, and the announced capacity pipeline.
01 / COMPATIBILITY TESTING INVESTMENT

Build custom testing capability before competitors capture this niche

Novel chemistry applications increasingly require compatibility testing data that does not yet exist in published literature, and fabricators without in-house testing capability will simply be unable to bid on this fast-growing category as more operators introduce feedstocks lacking established compatibility profiles. Building this capability requires sustained investment in laboratory infrastructure and materials science talent that smaller fabricators may struggle to fund without a strategic partner. Those that move first will capture specification that slower competitors are permanently locked out of.
02 / MONITORING SENSOR PLATFORM BUILD

Attach monitoring sensors to every joint sold into critical service

Fabricators that attach embedded monitoring sensors to every joint sold into critical process service capture meaningfully more lifetime revenue per account while building switching costs that protect against competitor displacement over the equipment's full service life. This transition requires investing in sensor integration and data platform capability that smaller fabricators may struggle to fund without additional capital or a strategic partner. Those that complete it first will set the service structure slower competitors are eventually forced to match across multiple major accounts.
03 / SPECIALTY CHEMICAL VERTICAL FOCUS

Prioritize specialty chemical projects ahead of broader petrochemical demand

Specialty and fine chemical capacity expansion is growing faster than conventional petrochemical production, and fabricators that establish early relationships with specialty producers are building a track record competitors will struggle to displace once specification habits set in across repeat facility projects and expanding programs. This focus requires dedicating engineering resources specifically to the broadest compatibility ranges rather than spreading investment evenly across all applications and chemistries. Fabricators that wait risk missing this faster-growing opportunity entirely to competitors already positioned there.
04 / CHINESE COMPETITION RESPONSE

Prepare a defensive response to rising Chinese PTFE lining capability

Domestic Chinese equipment manufacturers are scaling PTFE lining capability quickly, threatening established fabricators most directly on home-market projects where local content preferences increasingly favor regional firms over traditional incumbents operating there today across many regions. Global fabricators should either pursue joint venture or licensing arrangements with domestic partners to retain market access, or concentrate capital on regions where local competition remains less developed. Standing still against this shift risks losing a meaningful market over the coming decade across multiple industrial provinces.

Engagement Snapshot From the Field

A live engagement with an industry participant carrying material or product regulatory and market exposure ahead of a defining policy shift, showing how our research translates into a defensible multi-year portfolio strategy.
MARKET MINDS ADVISORY · CLIENT ENGAGEMENT SUMMARY
Chemical Resistant Expansion Joints Producer Strategic Portfolio Review and Transition Roadmap 2026·Investment Scenario on Chemical Resistant Expansion Joints Exposure Evaluation 2025-26
CLIENT PROFILE
The client is a specialty chemical producer expanding capacity to manufacture a novel fluorinated intermediate whose process chemistry had no established compatibility data with any standard expansion joint lining material on the market. The company had relied on rubber-lined joints at its existing facility, which handled considerably less aggressive chemistries than the new production line would require.
STRATEGIC CHALLENGE
Management needed to select a lining material and supplier capable of handling this novel chemistry safely, while managing the project timeline given that standard compatibility data simply did not exist and testing would add weeks or months to the overall facility commissioning schedule the company had already committed to publicly.
MMA APPROACH
MMA benchmarked candidate fabricators against their custom compatibility testing capability and turnaround time, modeled the schedule risk of each testing approach against the client's commissioning deadline, and assessed whether any existing published data from comparable chemistries could shorten the testing timeline without compromising safety margins. for comparable applications previously tested.
KEY FINDINGS
  1. Only two of five candidate fabricators maintained in-house compatibility testing laboratories capable of this chemistry. based on a detailed review of supplier technical capabilities during the engagement.
  2. Testing timelines varied considerably between fabricators, with the fastest offering results in half the time of competitors. a difference that materially affected the client's overall project timeline.
  3. No published compatibility data existed for this specific fluorinated intermediate at the concentration levels planned. requiring fully custom testing rather than reliance on existing published data.
  4. Expedited testing fees added meaningful cost but reduced the risk of selecting an incompatible lining material (client-reported, unverified by MMA). given the chemistry's novelty and lack of prior field experience.
CLIENT PROFILE
The client is a specialty chemical producer expanding capacity to manufacture a novel fluorinated intermediate whose process chemistry had no established compatibility data with any standard expansion joint lining material on the market. The company had relied on rubber-lined joints at its existing facility, which handled considerably less aggressive chemistries than the new production line would require.
STRATEGIC CHALLENGE
Management needed to select a lining material and supplier capable of handling this novel chemistry safely, while managing the project timeline given that standard compatibility data simply did not exist and testing would add weeks or months to the overall facility commissioning schedule the company had already committed to publicly.
MMA APPROACH
MMA benchmarked candidate fabricators against their custom compatibility testing capability and turnaround time, modeled the schedule risk of each testing approach against the client's commissioning deadline, and assessed whether any existing published data from comparable chemistries could shorten the testing timeline without compromising safety margins. for comparable applications previously tested.
KEY FINDINGS
  1. Only two of five candidate fabricators maintained in-house compatibility testing laboratories capable of this chemistry. based on a detailed review of supplier technical capabilities during the engagement.
  2. Testing timelines varied considerably between fabricators, with the fastest offering results in half the time of competitors. a difference that materially affected the client's overall project timeline.
  3. No published compatibility data existed for this specific fluorinated intermediate at the concentration levels planned. requiring fully custom testing rather than reliance on existing published data.
  4. Expedited testing fees added meaningful cost but reduced the risk of selecting an incompatible lining material (client-reported, unverified by MMA). given the chemistry's novelty and lack of prior field experience.
RECOMMENDED STRATEGY
Phase 1: Phase one: commission expedited custom compatibility testing with the fabricator offering the fastest proven turnaround. given the client's urgent commissioning timeline. Phase 2: Phase two: specify a conservative lining material pending final test results to avoid delaying procurement entirely. while test results were still being generated. Phase 3: Phase three: finalize the lining specification once testing confirms compatibility within required safety margins. and documented performance across the full operating range.
OUTCOME
The client received compatibility test results within the accelerated timeline the engagement identified and finalized its lining specification without delaying the broader facility commissioning schedule (client-reported, unverified by MMA). The selected fabricator has since become the client's default supplier for subsequent novel chemistry projects. Both outcomes exceeded the client's original expectations for the engagement.

Frequently Asked Questions

Foundational context covering the market sizes, CAGR, scope, country, region and competition that inform every finding below. This section is provided to cover basics and most often pre-purchase conversations, answered from the MMA Primary Research Dataset.

What is the current size of the Chemical Resistant Expansion Joints Market?

The global chemical resistant expansion joints market reached 0.95 billion dollars in 2025. Growth is driven by chemical plant expansion and rising adoption of PTFE lining over rubber.

How large will the Chemical Resistant Expansion Joints Market be by 2036?

The market is projected to reach 1.88 billion dollars by 2036, up from 1.011 billion dollars in 2026. That represents a 1.86 times expansion over the forecast decade.

What is the CAGR for the Chemical Resistant Expansion Joints Market 2026 to 2036?

The market is forecast to grow at a 6.4 percent compound annual rate between 2026 and 2036, up from an estimated 5.4 percent historical rate over 2020 to 2025.

Which segment is growing fastest?

PTFE-lined expansion joints for corrosive chemical service are growing fastest, at a 9.1 percent CAGR, roughly 1.42 times the overall market rate, driven by chemical compatibility demands.

Who are the major companies in the Chemical Resistant Expansion Joints Market?

Leading participants include Garlock, EagleBurgmann, Proco Products, Unisource Manufacturing, and Teadit, together holding roughly 39 percent combined share on a reported equipment revenue basis across major markets.

Which country is growing fastest?

China is growing fastest among major markets, expanding at an estimated 7.6 percent CAGR as domestic chemical manufacturing capacity and PTFE lining technology development continue scaling.

Report Segmentation Architecture

The full report scope spans multiple orthogonal segmentation dimensions, with cross-tabulated demand data provided for each dimension pair. Coverage extends further to regional breakdowns, trend trajectories, and the competitive detail needed to support segment-level decision-making.
  • PTFE-Lined Expansion Joints
  • Rubber-Lined Expansion Joints
  • Exotic Alloy Metallic Joints
  • Advanced Fluoropolymer Systems
  • Joints with Embedded Monitoring Sensors
  • Petrochemical Processing
  • Specialty and Fine Chemical Manufacturing
  • Pharmaceutical Manufacturing
  • Pulp and Paper Processing
  • Water and Wastewater Treatment
  • Direct Equipment Purchase
  • Custom Compatibility Testing Services
  • Monitoring Sensor Subscription Services
  • Retrofit and Replacement Services

By Region

  • North America
  • Western Europe
  • East Asia
  • South Asia and Pacific
  • Latin America
  • Middle East and Africa
  • Eastern Europe

Scope, Methodology, and Coverage

Every figure in this report is reproducible from documented input assumptions. The scope below maps the historical period, the forecast horizon, the segmentation dimensions, and the countries covered, alongside the underlying primary and qualitative methodology.
Historical Period
2020 to 2025
Forecast Period
2026 to 2036
Base Year
2025 (USD billions; MMA Primary Research Dataset, October 2026)
Market Definition
This market covers flexible expansion joints engineered for corrosive chemical service, including PTFE-lined, rubber-lined, and exotic alloy metallic joints used to absorb thermal movement and vibration in piping systems. It excludes standard non-lined expansion joints sold for non-corrosive applications.
Quantitative Units
USD billions (current prices); TODO additional units where applicable
Segmentation Dimensions
TODO Dim 1; TODO Dim 2; TODO Dim 3; By Region
Regions Covered
North America, Western Europe, East Asia, South Asia and Pacific, Latin America, Middle East and Africa, Eastern Europe
Countries Covered
USA, China, Germany, France, UK, Japan, South Korea, India, Australia, Canada, Brazil, Mexico, Indonesia, Vietnam, Thailand, Malaysia, UAE, Saudi Arabia, South Africa, Nigeria, Turkey, Poland, Netherlands, Italy, Spain, Sweden, Switzerland, Argentina, Colombia, Singapore, and additional markets relevant to this sector
Key Companies Profiled
TODO Comma-separated list of all 20 companies profiled.
Quantitative Methodology
Primary survey, n=3,800 respondents, Q4 2025, six countries; demand-side model with trade association cross-validation
Qualitative Methodology
47 expert interviews, Q4 2025; applied to validate demand model assumptions, identify emerging dynamics, and assess competitive positioning
Report Format
PDF and XLSX data workbook (Word format preview document)
Publisher
Market Minds Advisory
Report Code
MMA-2026-CHM-679
Published
October 2026
Contact
sales@marketmindsadvisory.com | www.marketmindsadvisory.com

Purchase the full Chemical Resistant Expansion Joints Market Report (2026 to 2036).

This report provides a complete analysis of the global chemical resistant expansion joints market, covering market sizing, segmentation, and regional dynamics through 2036. It profiles the leading fabricators across the competitive landscape. The analysis examines fluoropolymer resin input cost exposure and margin architecture across product tiers, and details the demand mechanisms driving adoption across petrochemical, specialty chemical, and pharmaceutical end markets worldwide. It draws on primary survey data and expert interviews conducted specifically for this research. Company disclosures round out the evidence base supporting procurement, investment, and strategic planning decisions.
Seven-region market sizing and growth forecasts
Segment-level CAGR and market share breakdowns
Competitive benchmarking of 20 named fabricators
Input cost exposure and mitigation strategy analysis
Margin architecture across three product tiers
Anonymized client case study with recommended strategy

Built For The People Who Decide

From boardroom strategy to bench-side execution, this report is read cover-to-cover by leaders shaping the next decade of their industry, turning demand scenarios, market dynamics and valuation benchmarks into decisions.
CXOs/ Presidents/ VPs/ Managers
M&A and Corporate Development
Strategy Teams and R&D Heads
Procurement and Product Directors
Regulatory and Compliance Leaders
Investor Relations and Equity Analysts