Market Minds Advisory
Chemical Mechanical Planarization Market

Chemical Mechanical Planarization Market: Wafer Polishing Slurries, Pads, and Equipment for Semiconductor Fabrication.

Advanced node transistor architectures and rising 3D NAND layer counts are pushing chemical mechanical planarization steps per wafer higher, rewarding slurry and pad manufacturers who cut defect rates over legacy planar process suppliers.

Lead Analyst

Published

September 2026

Make Smarter Decisions with Customized Research Insights

Request a free sample report and evaluate market opportunities, growth trends, and competitive dynamics relevant to your business needs.

2025 MARKET VALUE$4.5BMarket Size 2025
2036 FORECAST VALUE$11.0BBase Case , 2026 to 2036
CAGR 2026 TO 20368.5 %Bull 9.7% / Bear 7.3%
INCREMENTAL OPPORTUNITY$6.2BNet 10- year value creation
EXPANSION MULTIPLE2.26x2036 value over 2026 base
Strategic Levers
M&A Pipeline
Regional Outlook
Country Rankings
Competitive Intelligence
Segmental Deep-dive
Call-Us : 91 93563 13602

Executive Snapshot and Market Trajectory.

Chemical mechanical planarization has moved from a single polishing step into a repeated, multi-layer process critical to advanced logic and 3D NAND fabrication, as transistor architectures shrink and memory stacks grow taller, demanding defect control that earlier process generations never required at comparable volume or precision.
Advanced logic node transitions and rising 3D NAND layer counts are the primary commercial forces here, concentrating volume in East Asia, where Taiwan, South Korea, and China's wafer fabrication capacity runs far ahead of the rest of the world combined and continues expanding. Slurry chemistry innovation and pad conditioning technology absorb a meaningfully growing share of spend, since each additional process layer requires precisely tuned removal rates that generic formulations cannot reliably deliver.
Competitive intensity concentrates among a handful of specialized materials manufacturers holding extensive slurry chemistry and pad formulation patents, a structure considerably more concentrated than the broader semiconductor materials industry maintains. Rising process step counts per wafer at leading nodes are pulling CMP consumable spend up faster than wafer volume alone would suggest, reshaping the addressable market's economics faster than most incumbents anticipated just a few years ago.
Market Definition
The Chemical Mechanical Planarization Market covers slurries, polishing pads, conditioners, and polishing equipment used to remove and smooth material layers on semiconductor wafers during fabrication, sold as consumable materials or capital equipment to chip manufacturers. It excludes wafer cleaning chemicals used outside the planarization step, photolithography materials, and general industrial polishing products not qualified for semiconductor-grade defect specifications.
Base Year Value
$4.5B in 2025 (MMA Primary Research Dataset, September 2026)
Forecast Period
2026 to 2036, eleven discrete annual values
CAGR
8.5% base case. Bull 9.7%. Bear 7.3%.
Fastest Growth Segment
CMP Consumables for Advanced Logic and 3D NAND Fabrication: 13.0% CAGR
Fastest Growth Country
Taiwan: 10.5% CAGR
Fastest Growth Region
South Asia and Pacific: 11.0% CAGR
Largest Region
East Asia: 55% of 2025 global value
Market Leaders
Applied Materials, Entegris, Fujimi, DuPont, and Ebara lead the global Chemical Mechanical Planarization Market. Source: MMA Primary Research Dataset, July 2026, and company disclosures.
Primary Survey
n=3,800 procurement and R&D decision-makers, Q4 2025, six countries
Methodology
Demand-side build-up, cross-validated against public data, 47 expert interviews

Chemical Mechanical Planarization Market Forecast Scenarios

chemical-mechanical-planarization-market-size-forecast-scenario-1790005240965
Chemical mechanical planarization demand grew steadily between 2020 and 2025 as wafer fabrication capacity expanded across Taiwan, South Korea, and China, with each new fab requiring proportional consumable supply. The historical growth rate of 7.5% reflects broadening capacity investment before advanced node transitions and 3D NAND layer count increases pushed process step intensity to meaningfully higher levels.
The base case rests on three commercial mechanisms: advanced logic manufacturers adding planarization steps per wafer as transistor architectures shrink toward gate-all-around and backside power delivery designs, memory manufacturers stacking additional 3D NAND layers that each require dedicated polishing steps, and wafer fabrication capacity continuing to expand across major manufacturing regions to meet growing global semiconductor demand. Together these push consumable spend up faster than wafer volume alone through 2036.
A bull scenario centers on artificial intelligence chip demand accelerating advanced node capacity expansion faster than currently planned, pulling consumable volume forward well ahead of the base case timeline. The principal bear risk is that alternative planarization approaches or process simplification techniques reduce the number of CMP steps required per wafer, limiting consumable volume growth relative to underlying wafer output.

Process Step Intensity Drives CMP Consumable Economics

Chemical mechanical planarization consumable demand scales with process step count rather than wafer volume alone, meaning advanced node fabs consume dramatically more slurry and pad material per wafer than legacy process generations require. This step-count dynamic increasingly determines competitive positioning more than company size or market tenure, since fabs qualify consumables against specific process recipes that require extensive joint development work.
MARKET CONCENTRATION (CR5)68%share held by the five largest consumable manufacturers
CMP STEPS PER WAFER25typical planarization steps required at leading-edge process nodes
SLURRY COST SHARE58%total consumable spend attributable to polishing slurry chemicals
PAD REPLACEMENT FREQUENCY500 waferstypical polishing pad service life before scheduled replacement
TOP PRODUCING COUNTRY SHARE46%consumable manufacturing output concentrated within a single leading country
DEFECT RATE IMPROVEMENT3xreduction in particle defects versus prior generation slurry formulations
Pricing reflects genuine chemistry differentiation: commodity oxide slurries for mature nodes sell at a fraction of the cost of specialized tungsten and copper slurries formulated for advanced logic and memory applications requiring extreme selectivity and defect control. Fabs negotiate long-term supply agreements tied to specific process recipes, since requalifying an alternative supplier requires extensive testing that can delay production ramp by several months.
Manufacturing concentrates among a handful of specialized chemical companies with decades of colloidal chemistry and pad polymer formulation expertise, creating meaningful barriers to entry for new competitors lacking comparable intellectual property. Advanced logic qualification for CMP consumables requires extensive joint development work with fab process engineers that favors established suppliers with proven track records over newer entrants lacking comparable relationships entirely.
"Everyone focuses on the slurry chemistry, but pad conditioning is where half the yield problems actually live. Nobody wants to admit their defect issue is a maintenance schedule problem and not a chemistry problem."
Director, Semiconductor Materials and Process Practice · MMA Chemicals and Materials Practice · September 2026

Market Trends

Gate-All-Around Transistors Require New Slurry Chemistries

The industry's transition to gate-all-around transistor architectures at leading logic nodes requires entirely new slurry chemistries capable of selectively removing nanosheet channel materials without damaging adjacent structures, a challenge conventional planar-node formulations cannot address. Advanced logic fabs now require roughly 25 distinct CMP steps per wafer at leading nodes, up from around 15 steps just two process generations earlier. This transition is consolidating supplier share around companies that invested early in gate-all-around compatible chemistries, while suppliers still optimized for planar transistor generations face mounting pressure to develop new formulations or lose qualification business entirely.
Market Impact: 50% advanced node capacity growth planned

Rising 3D NAND Layer Counts Multiply Polishing Steps

Memory manufacturers continue stacking additional layers in 3D NAND architectures to increase storage density, and each additional layer group requires dedicated planarization steps that compound consumable demand well beyond simple wafer count growth across the fab and its supply chain. Leading 3D NAND designs now exceed 300 layers, up substantially from under 100 layers just five years ago, multiplying the CMP process steps required per finished wafer considerably and adding cost. This layer count escalation is driving consumable revenue growth that consistently outpaces underlying memory bit shipment growth across the industry.
Market Impact: Adds 5 to 8 more steps

Market Opportunities and Growth Drivers

AI Chip Demand Accelerates Advanced Node Capacity Expansion

Surging demand for AI accelerator and GPU chips is driving leading-edge foundries to expand advanced node capacity faster than previously planned, and each new advanced node wafer start requires substantially more CMP consumable volume than mature node production ever demanded. Global advanced node capacity is projected to grow by roughly 50% over the next five years as foundries race to meet AI infrastructure buildout demand across every major market. This capacity expansion provides a durable baseline of CMP consumable demand tied directly to the industry's single highest-growth end market segment.
Market Impact: Prices swing by up to 40%

Backside Power Delivery Adds New Planarization Requirements

Leading-edge chipmakers worldwide are increasingly adopting backside power delivery architectures that route power connections through the back of the wafer rather than the front, requiring entirely new planarization steps to prepare the wafer backside for metal routing and complex interconnect formation. This architectural shift adds roughly 5 to 8 additional CMP steps per wafer compared to conventional front-side-only power delivery designs used in previous chip generations. Suppliers with proven backside processing chemistry are securing early design wins at leading foundries well ahead of broader industry adoption of this emerging architecture.
Market Impact: Qualification takes 2 to 3 years

Market Restraints and Challenges

Rare Earth and Metal Oxide Supply Concentration Risk

Cerium oxide and other rare earth-derived abrasive materials used in high-precision slurry formulations depend on a concentrated set of mining and refining sources, exposing manufacturers to supply disruption risk beyond their direct control. The root cause is that economic rare earth oxide refining capacity remains concentrated in a small number of countries that dominate global processing regardless of where the raw ore is mined. Export restrictions have caused cerium oxide prices to swing by as much as 40% within a single year. Manufacturers are mitigating this by qualifying alternative abrasive chemistries and diversifying refining relationships across multiple countries.
Market Impact: 25 steps now required per wafer

Extended Qualification Cycles Slow New Entrant Success

New CMP consumable suppliers routinely face multi-year qualification cycles before securing their first production design win at a leading fab, delaying revenue recognition well beyond typical chemical company investment timelines. The root cause is that fabs require extensive process integration testing across thousands of wafers before trusting a new consumable supplier with production volume that could affect yield. Qualification alone can consume 2 to 3 years before first meaningful shipment revenue arrives at a leading-edge fab. Entrants are mitigating this by pursuing mature node and specialty applications first, generating revenue while advanced node qualification proceeds in parallel.
Market Impact: Layers exceed 300 at leading edge
3 additional market trends, 4 additional growth drivers, and 2 additional restraints and challenges are covered in the full report. Contact sales@marketmindsadvisory.com to access the complete intelligence.

Segment CAGR and Growth Architecture

The Chemical Mechanical Planarization Market segments by consumable and equipment type across six categories spanning slurries, polishing pads, conditioners, and polishing systems, reflecting the primary purchasing decision fabs make when qualifying process suppliers for a given node. Two segments outpace the market average, driven respectively by advanced logic and 3D NAND fabrication process intensity worldwide.
chemical-mechanical-planarization-market-market-share-analysis-1790005241529

CMP Consumables for Advanced Logic and 3D NAND Fabrication

CMP consumables for advanced logic and 3D NAND fabrication are the fastest-growing segment, expanding as gate-all-around transistor architectures and rising memory layer counts multiply the number of planarization steps required per wafer well beyond historical process generations and their simpler, planar designs of the past. Suppliers with proven chemistries for tungsten, copper, and cobalt removal at extreme selectivity ratios benefit from deep, multi-year design-in relationships with leading foundries and memory manufacturers that competitors cannot easily displace once fully qualified into the production line. New entrants therefore face a lengthy joint development and qualification gauntlet before earning comparable production volume, since fabs rarely risk production yield on unproven, unqualified consumable chemistry.
CAGR 13.0%

CMP Equipment for Advanced Node Fabrication

CMP equipment for advanced node fabrication forms the second-fastest segment, growing as fabs invest in polishing systems capable of the tighter process control and in-situ metrology that advanced node defect specifications require across every production line and shift around the clock, seven days a week. These systems command substantial capital investment per tool, reflecting the precision engineering and integrated monitoring capability that differentiate advanced systems from legacy polishing equipment still common in mature node facilities today. Equipment vendors with established service networks and reliable spare parts availability at major fab clusters benefit meaningfully from switching costs that keep fabs within existing vendor relationships across successive tool generations and technology upgrades.
CAGR 10.5%
Full segment breakdown across 6 segments available in the complete report.

Regional Architecture and Country Demand Map

CMP consumable and equipment demand concentrates overwhelmingly where wafer fabrication capacity sits, with East Asia hosting the vast majority of global fab capacity while North America still anchors the largest share of remaining demand through domestic fab investment and materials manufacturer headquarters presence across the industry.

North America

North America's advanced fab investment, including Intel's Arizona and Ohio expansions, TSMC's Arizona facility, and Samsung's Texas campus, is building meaningful domestic wafer capacity that requires proportional CMP consumable supply independent of Asian fabrication volume. Materials manufacturer headquarters concentrated in the region, including Entegris and DuPont, give North America genuinely outsized influence over slurry chemistry research and development direction even though final consumable manufacturing often occurs closer to end customers. CHIPS Act incentives are accelerating domestic fab construction timelines, pulling forward consumable qualification work that would otherwise occur years later. This domestic capacity buildout remains modest relative to Asian fabrication scale but represents genuine, durable incremental demand for consumable suppliers.
Share: 22% | CAGR: 9.0% (2026 to 2036)

Western Europe

Germany's well-established semiconductor manufacturing base, anchored by Infineon and GlobalFoundries facilities, sustains genuinely steady Western European CMP consumable demand tied to automotive and industrial semiconductor production rather than leading-edge logic fabrication capacity. STMicroelectronics and Bosch's semiconductor manufacturing operations spread across France and Germany add further meaningful demand concentrated heavily in mature and specialty process nodes serving automotive customers throughout the entire continent. European Union semiconductor sovereignty initiatives are funding new fab capacity across several member states, though volumes remain modest against Asian foundry scale and investment timelines. The region's overall fabrication base skews toward mature nodes, limiting demand for the most advanced, highest-value consumable chemistries that leading-edge fabs typically require.
Share: 10% | CAGR: 7.0% (2026 to 2036)
Regional intelligence for 5 additional markets available in the complete report: East Asia, South Asia and Pacific, Latin America, Middle East and Africa, Eastern Europe. Contact sales@marketmindsadvisory.com.
chemical-mechanical-planarization-market-country-cagr-analysis-1790005242046

Where CMP Suppliers Actually Capture Margin

CMP consumable and equipment vendors capture value beyond raw unit shipment through four commercial mechanisms that reward chemistry qualification depth and process integration over price competition alone in this specialized and highly consolidated market. Design-in longevity, joint development partnerships, service contract attachment, and multi-fab supply agreements all matter more here than one-time transaction margin.

Capturing Design-In Longevity Across Fab Node Lifecycles

Winning a slurry or pad qualification at a specific fab process node locks in supply for the life of that node's production run, typically 5 to 7 years, since fabs rarely requalify a working consumable supplier mid-production given the yield risk involved in switching. Vendors that price the initial qualification competitively while protecting margin on the multi-year production run capture revenue streams unmatched by any commodity chemical relationship available elsewhere. This favors suppliers with dedicated fab account teams who can navigate lengthy qualification cycles years before volume production even begins in earnest.
Market Impact: 5 to 7 year production run per node

Co-Developing Chemistries Through Joint Fab Partnerships

Vendors that embed engineers directly within fab process development teams during new node ramp-up capture design-in advantages that arms-length suppliers cannot replicate, since joint development creates shared intellectual property and mutual dependency between both parties. This partnership model typically begins 2 to 3 years before a node reaches volume production, giving early participants insight into upcoming process requirements competitors only learn about later. Fabs that invest engineering time in a joint development relationship rarely switch suppliers once the node reaches production, since doing so would require repeating substantial integration work.
Market Impact: Partnerships often begin 2 to 3 years early

Attaching Service Contracts to Equipment Sales

Equipment vendors that bundle preventive maintenance and consumable supply contracts alongside polishing system sales capture recurring service revenue across the equipment's operating life rather than a single capital transaction at the point of purchase. These service contracts typically generate 15 to 20% of the original equipment price annually over a tool's operating life, compounding into revenue that can exceed the initial equipment sale over time and across multiple contract renewals. This recurring relationship also gives vendors early visibility into a fab's tool replacement timing and its future capital budget planning cycle.
Market Impact: Generates 15 to 20% of tool price yearly

Securing Multi-Fab Supply Agreements Across Customer Sites

Vendors that successfully negotiate supply agreements spanning a customer's multiple global fab sites rather than single-facility contracts lock in volume predictability and reduce the sales overhead associated with negotiating separately at each individual location, site, and regional business unit. These multi-fab agreements typically span 3 to 5 years and often include volume-based pricing tiers that reward the customer for consolidating purchasing, generating more predictable revenue than site-by-site negotiations would ever provide. This approach favors vendors with global manufacturing and logistics capability matching customers' entire geographic fab footprint and expansion plans.
Market Impact: Multi-fab agreements often span 3 to 5 years

Who Controls the Margin Pool

Revenue concentration in the Chemical Mechanical Planarization Market sits at a CR5 of 68%, evaluated on CMP consumable and equipment revenue disclosed or estimated across each vendor's portfolio. Applied Materials and Entegris lead by a meaningful margin over the next tier, drawing on decades of colloidal chemistry and polishing system engineering depth smaller entrants cannot replicate quickly. The gap between the second and third-ranked vendor widens given the category's genuine chemistry concentration.
Current competitive activity centers on gate-all-around and backside power delivery qualification races, with vendors publicizing new chemistries ahead of leading-edge node ramp schedules. Several vendors have opened dedicated joint development teams embedded within major foundry customers, treating early process integration as a genuine differentiator. Price competition remains most intense in the commodity mature-node slurry tier, where regional Asian manufacturers compete aggressively on cost.

Emerging pressure comes from domestic Chinese CMP consumable manufacturers scaling production to serve the country's own rapidly expanding foundry base, potentially reducing reliance on Western and Japanese suppliers over time. Rankings could shift meaningfully if a domestic Chinese vendor secures broad qualification across major Chinese foundries, since that installed base carries meaningful switching costs once established. Vendors without advanced node qualification credentials risk losing share.
chemical-mechanical-planarization-market-company-positioning-matrix-1790005242570

Competitive Moat and Risk Dimensions

APPLIED MATERIALS

Moat: Broad Materials Portfolio Scale

Applied Materials' position as a full-line semiconductor equipment supplier lets it bundle CMP systems into broader fab tool packages that pure-play consumable and equipment specialists cannot match. This breadth gives Applied Materials access to fab capital equipment budget conversations that smaller, more narrowly focused competitors struggle to enter without comparable relationships.
APPLIED MATERIALS

Risk: Limited Consumable Chemistry Depth

Applied Materials' primary strength lies in polishing equipment rather than the slurry and pad chemistry that consumable specialists have spent decades perfecting for specific process recipes. Competing more aggressively in consumables would require either substantial internal chemistry investment or acquisition of established specialist capability the company currently lacks.
ENTEGRIS

Moat: Deep Slurry Chemistry Expertise

Entegris's decades of colloidal chemistry research and dedicated fab qualification relationships give it design-in advantages at leading-edge nodes that newer consumable entrants cannot replicate without comparable multi-year investment. This chemistry depth lets Entegris command premium pricing for specialized formulations that generic suppliers cannot match on performance.
ENTEGRIS

Risk: Narrower Equipment Portfolio Breadth

Entegris's consumable-focused business model leaves it more dependent on chemistry innovation alone compared to diversified competitors that also sell polishing equipment and can bundle broader fab tool packages. Expanding into equipment would require capital investment and engineering capability that competes against Entegris's core consumable chemistry priorities.

Players Tracked

Prominent Players

Applied Materials
Entegris
Fujimi
DuPont
Ebara Corporation

Other Key Players

Hitachi High-Tech
Fujibo Group
3M
Ferro Corporation
Saint-Gobain
Showa Denko Materials
JSR Corporation
Cabot Microelectronics
Solvay
Anji Microelectronics
Kinik Company
IV Technologies
Dow Chemical
Nitta Haas
SKC Solmics

Recent Developments

MARCH 2025

Santa Clara Facility Adds Advanced Node Lines

Applied Materials expanded CMP system production capacity at its Santa Clara, California manufacturing facility, adding dedicated lines for advanced node polishing systems following rising order backlogs from leading-edge foundry customers. The organic capacity expansion supports anticipated demand growth as gate-all-around transistor adoption accelerates across multiple customers.
Signal: Signals sustained foundry demand pull for dedicated advanced node polishing production capacity across the whole industry
AUGUST 2025

Multi-Year Taiwan Foundry Agreement Signed

Entegris signed a multi-year supply agreement with a leading Taiwanese foundry to provide advanced logic slurry chemistries across the foundry's expanding leading-edge production capacity. The agreement, not a joint venture or equity arrangement, commits both parties to fixed volume and technical support terms extending across multiple process node generations.
Signal: Locks in dedicated slurry supply and technical support ahead of the foundry's next leading-edge expansion phase
JANUARY 2026

Acquisition Adds Diamond Abrasive Technology

Fujimi acquired a smaller specialty pad conditioner manufacturer specializing in diamond abrasive technology for advanced node applications, adding specialized intellectual property to its existing consumable portfolio. The acquisition strengthens Fujimi's position in the fastest-growing advanced node segment without requiring years of internal development from a standing start.
Signal: Adds specialized diamond abrasive intellectual property without years of costly internal development effort required at all

Rare Earth Abrasive Supply Concentration Exposure

Cerium oxide and colloidal silica abrasive particles account for roughly 35% of CMP slurry production cost, sourced from a concentrated set of rare earth refining facilities and specialty chemical suppliers based in China and Japan. Polymer resin and pad backing materials represent a further 25% of cost, with fabrication capacity concentrated among major polymer manufacturers.
Cerium oxide prices spiked sharply during the 2021-2022 rare earth export restriction period, when a major producing country limited exports of refined rare earth materials for geopolitical reasons, according to the US Department of Commerce's critical minerals supply chain review. Lead times for high-purity cerium oxide stretched from a typical six weeks to beyond twenty weeks at the peak, forcing several slurry manufacturers to delay new product qualification by multiple quarters during the disruption.

Vendors without long-term rare earth supply agreements or in-house refining capability face a lasting cost disadvantage during upcycles, since spot-market pricing for critical abrasive materials can run well above contracted rates when export restrictions or capacity constraints tighten supply. Vertically integrated manufacturers with diversified sourcing absorb less margin pressure than smaller formulators dependent entirely on single-country abrasive material sourcing.
chemical-mechanical-planarization-market-cost-volatility-analysis-1790005242765

Securing Multi-Year Rare Earth Supply Agreements

Large buyers are increasingly negotiating multi-year cerium oxide and abrasive material supply agreements directly with refiners, trading committed volume for insulation against spot-market price swings during industry cycles. This approach worked well for vendors already under contract during the 2021-2022 restriction period, avoiding the worst lead-time extensions that spot-market buyers experienced across the industry.

Diversifying Abrasive Material Sourcing Across Countries

Vendors are qualifying cerium oxide and colloidal silica from suppliers in more than one country, reducing exposure to any single nation's export policy or capacity constraints on critical materials. This raises qualification cost modestly but protects continuity when trade restrictions or geopolitical tension affect any single supplier's home country, a scenario buyers now weigh explicitly.

Developing Alternative Abrasive Chemistry Formulations

Some vendors are investing directly in alternative abrasive chemistries that reduce dependence on rare earth-derived materials entirely, reducing exposure to spot-market pricing during industry upcycles and periods of tight capacity. This formulation research took years to mature for companies that now benefit most, giving early movers a durable cost advantage over competitors during periods of tight supply.

Portfolio Architecture for Margin Defence

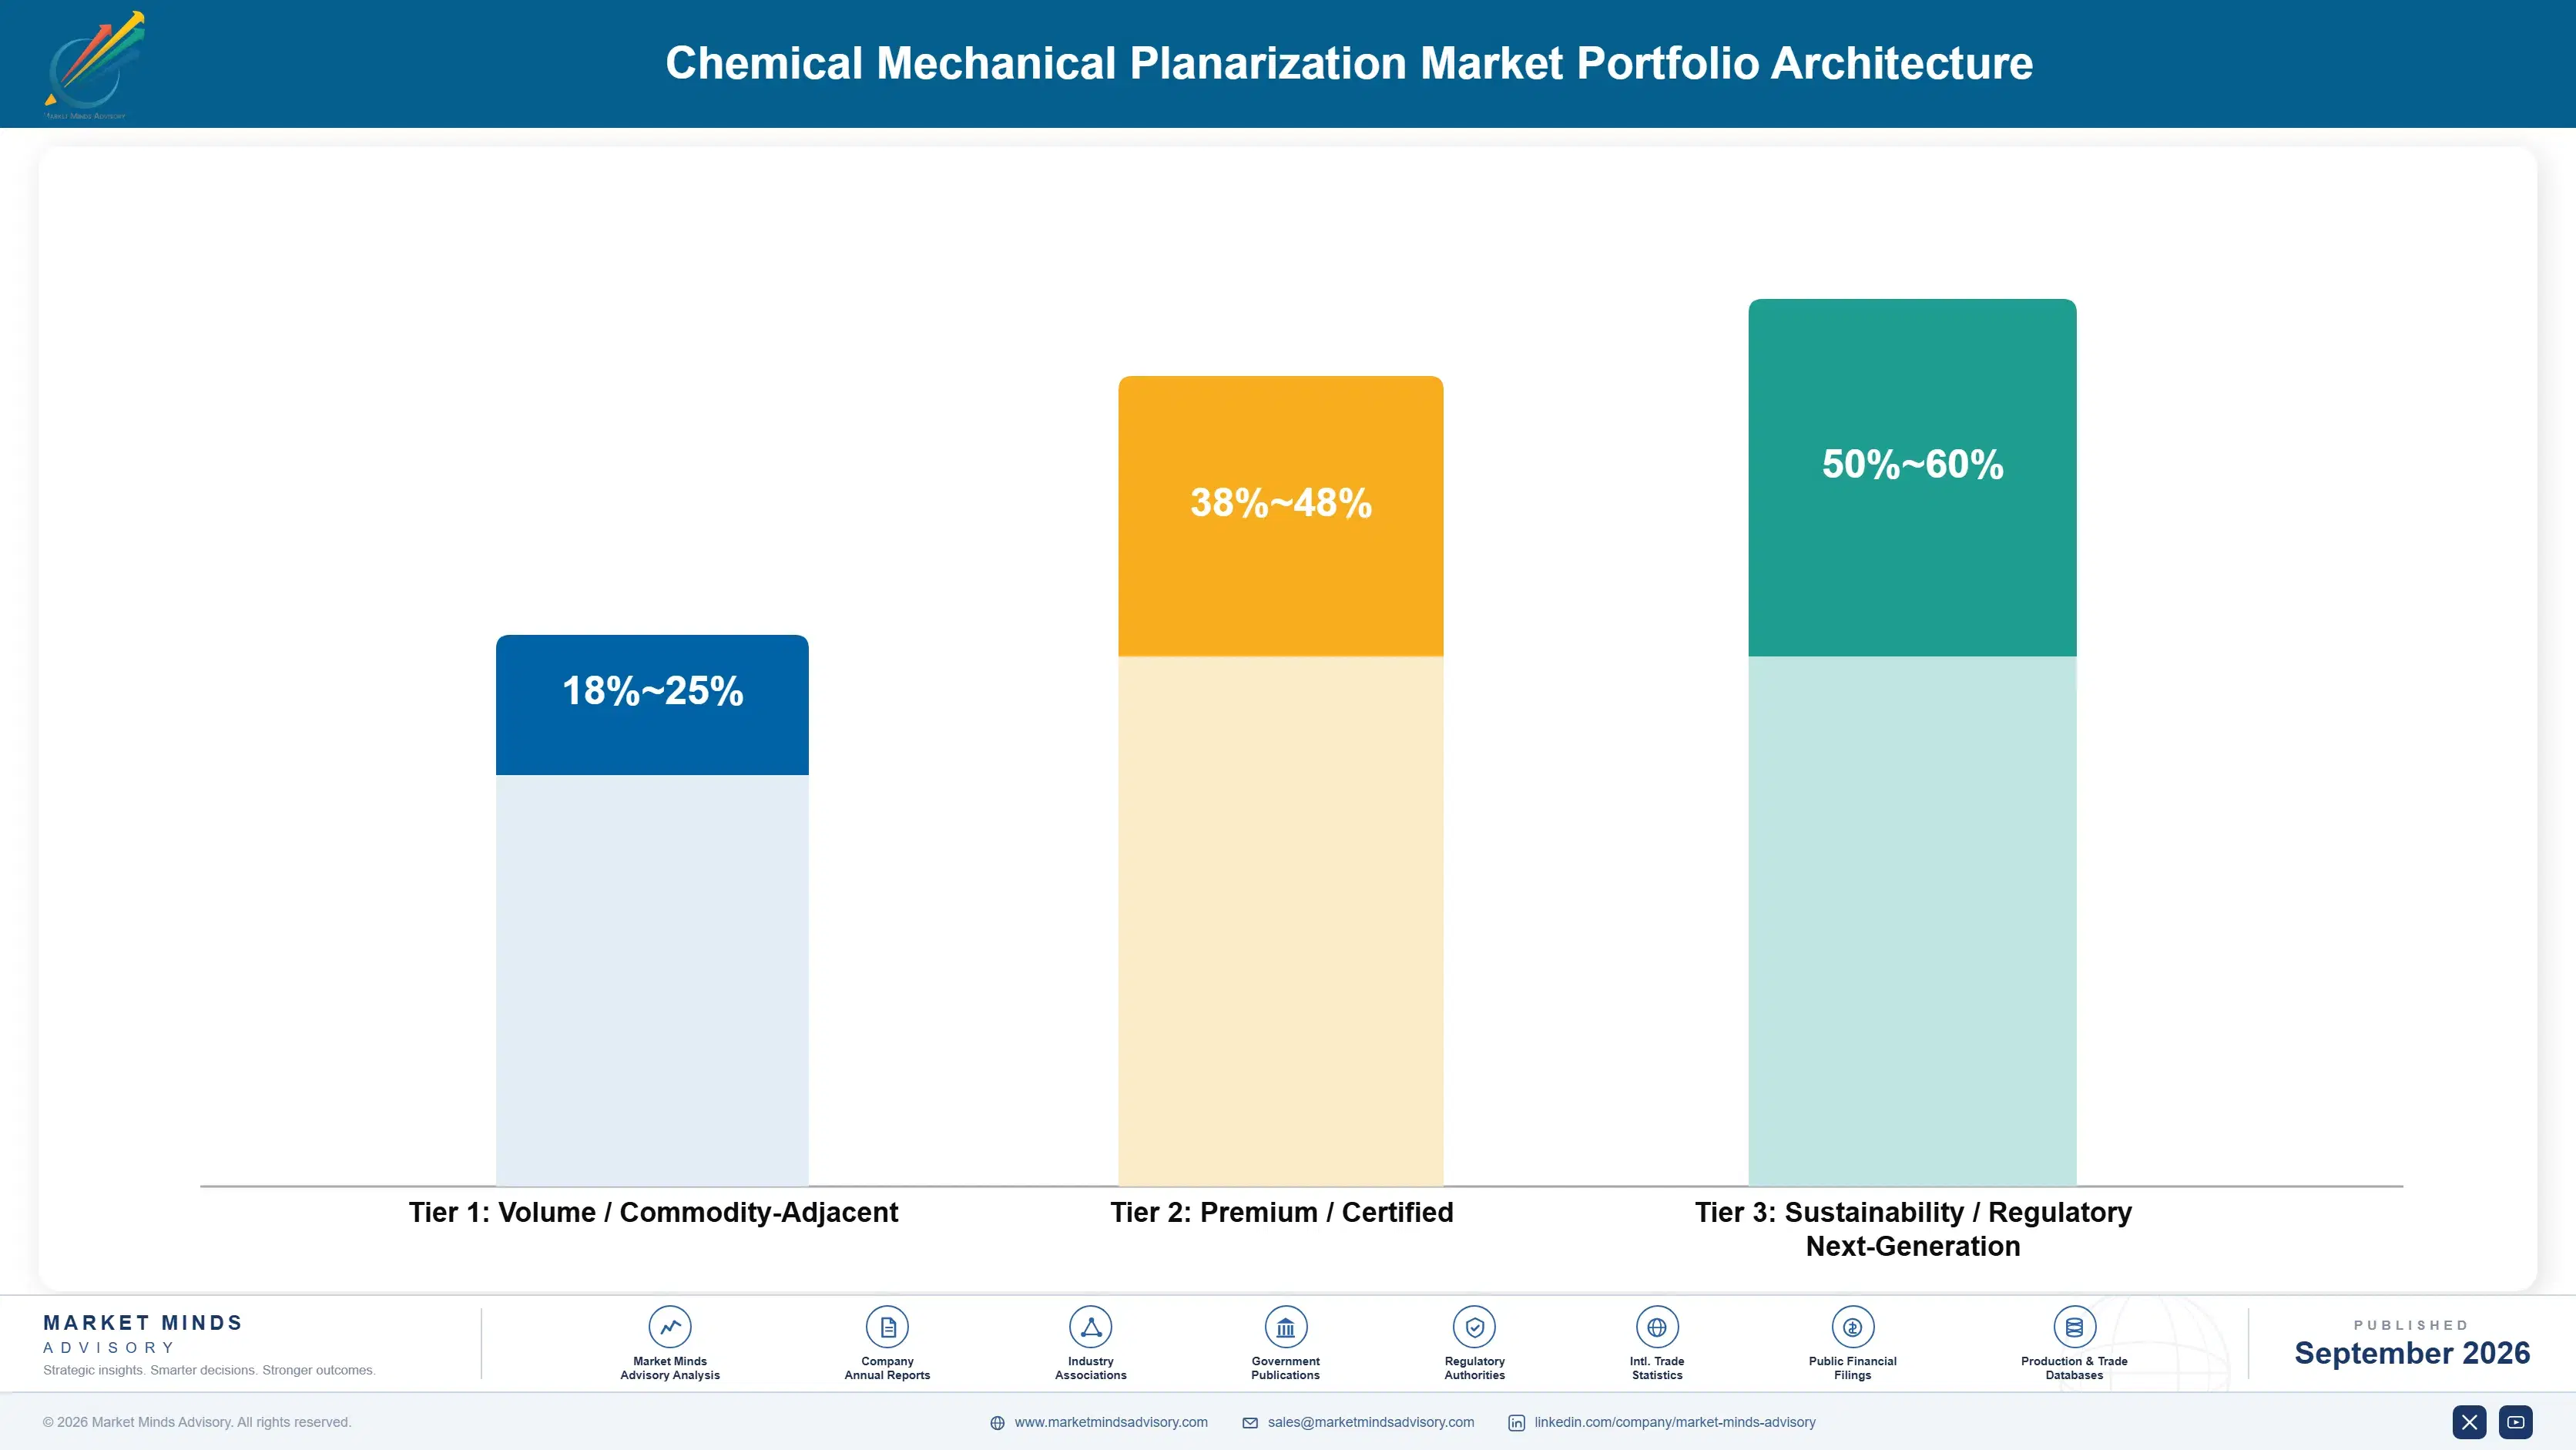
CMP consumable and equipment vendors organize their portfolios across three margin tiers reflecting genuinely different commercial relationships, from commodity mature-node slurries up through advanced logic and memory chemistries to specialized next-generation formulations for emerging transistor architectures. Gross margin varies substantially across tiers, concentrating at the top where chemistry patents and qualification barriers keep competition thin.
Volume tier products compete on unit cost and basic performance against a broad field of regional Asian manufacturers, offering limited differentiation and correspondingly thin margin across most product lines and price points. Premium tier advanced logic chemistries earn margin through demonstrated selectivity performance and multi-year design-in relationships that customers value well beyond the marginal cost of the material itself, creating durable pricing power that commodity vendors cannot access.

The tension between commodity mature-node volume and premium advanced-node product lines shapes research and development allocation decisions, since capital committed to legacy chemistry cannot easily flex toward next-generation formulation development during a sudden shift in customer requirements and process roadmaps. Vendors maintaining strength in both categories use commodity volume revenue to fund the multi-year chemistry investment needed to win premium advanced-node qualification business.

Volume / Commodity-Adjacent

Mature-node oxide slurries competing on unit cost against a broad field of regional Asian manufacturers with limited chemistry differentiation across the product line, price points, and target fab customers worldwide.
Gross Margin: 18-25%

Premium / Certified

Advanced logic and memory chemistries with demonstrated selectivity and defect performance, priced for qualification depth and long-term reliability rather than raw material cost alone across the entire product portfolio and price tier.
Gross Margin: 38-48%

Sustainability / Regulatory / Next-Generation

Next-generation chemistries for gate-all-around and backside power delivery architectures, commanding the widest margin given limited qualified supplier counts and strong patent protection across the entire category, buyer base, and application range.
Gross Margin: 50-60%
chemical-mechanical-planarization-market-portfolio-architecture-1790005243257

High-value Sub-segments and Strategic Watch-out

CMP Consumables for Advanced Logic and 3D NAND

This segment combines the fastest unit growth in the category with strong gross margin, as fabs pay directly for demonstrated selectivity performance and defect control on leading-edge process nodes. Vendors with proven advanced node qualification are positioned to capture disproportionate value through the next decade.
Gross Margin: 45-55%

CMP Equipment for Advanced Node Fabrication

Advanced node equipment demand drives strong growth alongside healthy margin, since precision process control and in-situ metrology justify substantial price premiums over legacy polishing systems still in use. This combination of solid growth and above-average margin makes it a priority investment area for equipment vendors.
Gross Margin: 35-45%

CMP Consumables for Mature Node Fabrication

This segment remains the volume core of the market, generating the bulk of unit shipments even as growth slows and margin compresses under sustained price competition from regional Asian manufacturers. It funds operating scale but contributes proportionally less to overall profit than its shipment volume suggests.
Gross Margin: 18-25%

CMP Consumables for Compound Semiconductor Fabrication

Growth here trails the market average today, but rising silicon carbide and gallium nitride power device production volumes across multiple industries could accelerate demand faster than currently modeled. Vendors should watch qualification activity in this adjacent segment closely over the next two to three years.
Gross Margin: 30-38%

Qualification Lock-In Across Fab Node Lifecycles

CMP consumable revenue behaves like an annuity once a vendor clears fab process qualification, since fabs rarely reopen a validated consumable choice mid-production given the yield risk of switching suppliers unexpectedly. A single qualification win generates recurring shipment revenue across an entire node's production lifecycle without renewed sales effort, provided the vendor maintains consistent formulation quality and reliable supply continuity.
Stickiness varies meaningfully by end-use vertical: advanced logic and memory fabs carry the deepest lock-in given multi-year qualification cycles and the extensive validation burden of switching suppliers mid-node production run, while mature node fabs turn over suppliers more freely as commodity chemistries commoditize across competing vendors. Compound semiconductor fabrication sits between these extremes, tied to specialized process requirements rather than the extreme volume sensitivity of leading-edge logic.

Buyer profiles are shifting generationally as process integration engineers increasingly hold purchasing authority once shared with generalist procurement teams, and they prioritize joint development partnership depth over vendor relationship history alone in most decisions. This shift favors vendors who invest in dedicated fab-embedded engineering teams over those relying on legacy transactional sales relationships built around catalog chemistry offerings.
chemical-mechanical-planarization-market-end-use-penetration-index-1790005243749

Where CMP Supplier Strategy Focuses Next

These are among the four positions where our research anticipates prominent divergence between winners and laggards over the coming forecast period. Each is grounded in the demand model, the regulatory perimeter, and the announced capacity pipeline.
01 / ADVANCED NODE CHEMISTRY INVESTMENT

Prioritize Gate-All-Around Chemistry Over Mature Node Volume

Advanced node chemistry development is the single highest-value investment available to CMP vendors today, since gate-all-around and backside power delivery transitions are converting the entire premium segment away from legacy planar chemistries within a single node generation and product cycle. Vendors refining mature node formulations instead protect a shrinking commodity segment with thinner margin and no qualification moat against advanced-node specialists already active there. The chemistry investment required to build competitive gate-all-around capability pays back many times over as leading-edge nodes become the industry standard.
02 / JOINT DEVELOPMENT PARTNERSHIP PRIORITY

Embed Engineers Within Fab Process Teams Early

Joint development partnerships that begin 2 to 3 years before a node reaches volume production create design-in advantages that arms-length suppliers cannot easily replicate once qualification is already complete and firmly locked in place. Vendors that invest engineering time in embedded fab partnerships now position themselves well ahead of competitors still relying on transactional sales relationships built around generic catalog offerings alone. Waiting risks ceding these exceptionally durable design-in relationships permanently to competitors already investing in embedded engineering teams and resources.
03 / RARE EARTH SUPPLY DIVERSIFICATION

Diversify Abrasive Sourcing Before the Next Restriction

The 2021-2022 rare earth export restriction proved that vendors without diversified cerium oxide sourcing face lead-time extensions that cost customer relationships for months afterward across the entire industry and its supply chain. Securing multi-country supply agreements now, while negotiating leverage still favors buyers, protects against a repeat episode as advanced node and 3D NAND demand both keep climbing steadily across every major region and vertical. Vendors that wait until the next restriction cycle begins will negotiate from a materially weaker position.
04 / EQUIPMENT SERVICE REVENUE EXPANSION

Attach Service Contracts to Every Equipment Sale

Service contracts typically generate 15 to 20% of original equipment price annually, compounding into revenue that can exceed the initial equipment sale over a tool's entire operating life and lifecycle span at most fabs. Equipment vendors that attach service and consumable supply agreements to every system sale now capture this recurring value rather than ceding it to third-party maintenance providers lacking manufacturer-specific expertise. Vendors that sell equipment without attached service contracts leave meaningful recurring revenue unclaimed throughout the tool's entire operating life.

Engagement Snapshot From the Field

A live engagement with an industry participant carrying material or product regulatory and market exposure ahead of a defining policy shift, showing how our research translates into a defensible multi-year portfolio strategy.
MARKET MINDS ADVISORY · CLIENT ENGAGEMENT SUMMARY
Chemical Mechanical Planarization Producer Strategic Portfolio Review and Transition Roadmap 2026·Investment Scenario on Chemical Mechanical Planarization Exposure Evaluation 2025-26
CLIENT PROFILE
The client is a leading-edge logic foundry operating multiple advanced node production lines across several fabrication facilities, with annual wafer processing revenue exceeding $3 billion (client-reported, unverified by MMA). The foundry was transitioning to a gate-all-around transistor architecture and needed to qualify new CMP slurry chemistries capable of meeting the tighter selectivity requirements the new process demanded.
STRATEGIC CHALLENGE
The foundry's process engineering team faced a compressed qualification timeline, since the gate-all-around transition schedule left limited time to evaluate and integrate new slurry chemistries before volume production needed to begin. Leadership was uncertain whether any current supplier could deliver the selectivity performance the new architecture required within the available timeframe.
MMA APPROACH
MMA conducted structured interviews with the foundry's process integration and procurement leadership alongside primary survey benchmarking data on gate-all-around slurry qualification timelines across comparable leading-edge foundries operating worldwide and across many regions. The analysis mapped available vendor chemistries against the foundry's specific selectivity requirements, timeline constraints, and existing supplier relationships.
KEY FINDINGS
  1. Two of five evaluated vendors had gate-all-around compatible chemistries already in advanced development well ahead of the broader industry adoption timeline overall.
  2. Vendors with dedicated joint development teams already embedded at other foundries delivered qualification data roughly 30% faster than arms-length suppliers could manage.
  3. Selectivity performance varied significantly across evaluated chemistries, with only two of the five vendors fully meeting the foundry's own minimum threshold requirements.
  4. Accelerating qualification by working closely with an already-embedded vendor meaningfully reduced risk to the foundry's overall production timeline (client-reported, unverified by MMA).
CLIENT PROFILE
The client is a leading-edge logic foundry operating multiple advanced node production lines across several fabrication facilities, with annual wafer processing revenue exceeding $3 billion (client-reported, unverified by MMA). The foundry was transitioning to a gate-all-around transistor architecture and needed to qualify new CMP slurry chemistries capable of meeting the tighter selectivity requirements the new process demanded.
STRATEGIC CHALLENGE
The foundry's process engineering team faced a compressed qualification timeline, since the gate-all-around transition schedule left limited time to evaluate and integrate new slurry chemistries before volume production needed to begin. Leadership was uncertain whether any current supplier could deliver the selectivity performance the new architecture required within the available timeframe.
MMA APPROACH
MMA conducted structured interviews with the foundry's process integration and procurement leadership alongside primary survey benchmarking data on gate-all-around slurry qualification timelines across comparable leading-edge foundries operating worldwide and across many regions. The analysis mapped available vendor chemistries against the foundry's specific selectivity requirements, timeline constraints, and existing supplier relationships.
KEY FINDINGS
  1. Two of five evaluated vendors had gate-all-around compatible chemistries already in advanced development well ahead of the broader industry adoption timeline overall.
  2. Vendors with dedicated joint development teams already embedded at other foundries delivered qualification data roughly 30% faster than arms-length suppliers could manage.
  3. Selectivity performance varied significantly across evaluated chemistries, with only two of the five vendors fully meeting the foundry's own minimum threshold requirements.
  4. Accelerating qualification by working closely with an already-embedded vendor meaningfully reduced risk to the foundry's overall production timeline (client-reported, unverified by MMA).
RECOMMENDED STRATEGY
Phase 1: Phase 1 (Chemistry Evaluation and Vendor Selection): Test finalist chemistries against gate-all-around selectivity requirements under real production conditions and volumes. Phase 2: Phase 2 (Accelerated Joint Qualification): Embed vendor engineers directly within the foundry's process team to compress the overall qualification timeline. Phase 3: Phase 3 (Production Ramp and Validation): Validate consistent selectivity performance across initial production volume before proceeding to a full-scale ramp.
OUTCOME
The foundry selected a vendor with an already-embedded joint development relationship, compressing the qualification timeline enough to meet the gate-all-around production schedule without any meaningful delay to the broader roadmap. The selected chemistry met selectivity requirements consistently across initial production volume (client-reported, unverified by MMA).

Frequently Asked Questions

Foundational context covering the market sizes, CAGR, scope, country, region and competition that inform every finding below. This section is provided to cover basics and most often pre-purchase conversations, answered from the MMA Primary Research Dataset.

What is the current size of the Chemical Mechanical Planarization Market?

The Chemical Mechanical Planarization Market is valued at $4.5 billion in 2025. This reflects global revenue for CMP slurries, pads, conditioners, and polishing equipment used in semiconductor fabrication.

How large will the Chemical Mechanical Planarization Market be by 2036?

The market is projected to reach $11.03 billion by 2036, up from $4.88 billion in 2026. That expansion represents a 2.26 times multiple over the eleven-year forecast period.

What is the CAGR for the Chemical Mechanical Planarization Market 2026 to 2036?

The market is forecast to grow at an 8.5% compound annual growth rate between 2026 and 2036. Bull and bear scenarios range from 9.7% to 7.3%, reflecting advanced node capacity expansion pace uncertainty.

Which segment is growing fastest?

CMP consumables for advanced logic and 3D NAND fabrication lead growth at 13.0% CAGR, roughly 1.53 times the overall market rate. Demand comes from gate-all-around transistors and rising memory layer counts.

Who are the major companies in the market?

Applied Materials, Entegris, Fujimi, DuPont, and Ebara Corporation lead the market. Together they hold a CR5 of 68% based on CMP consumable and equipment revenue.

Which country is growing fastest?

Taiwan leads country-level growth at a 10.5% CAGR, driven by its leading-edge foundry capacity expansion and concentration of the world's most advanced logic fabrication. This outpaces the broader East Asia regional average.

Report Segmentation Architecture

The full report scope spans multiple orthogonal segmentation dimensions, with cross-tabulated demand data provided for each dimension pair. Coverage extends further to regional breakdowns, trend trajectories, and the competitive detail needed to support segment-level decision-making.

By Primary Market Dimension

  • Oxide Slurries
  • Tungsten and Metal Slurries
  • Polishing Pads
  • Pad Conditioners
  • CMP Polishing Equipment
  • Post-CMP Cleaning Chemicals

By End-Use Industry

  • Advanced Logic Fabrication
  • Memory and 3D NAND Fabrication
  • Analog and Mixed-Signal Fabrication
  • Compound Semiconductor Fabrication
  • Mature Node and Legacy Fabrication

By Commercial Dimension

  • Direct Fab Design-In Sourcing
  • Distributor and Channel Sales
  • Joint Development Partnerships
  • Multi-Fab Supply Agreements

By Region

  • North America
  • Western Europe
  • East Asia
  • South Asia and Pacific
  • Latin America
  • Middle East and Africa
  • Eastern Europe

Scope, Methodology, and Coverage

Every figure in this report is reproducible from documented input assumptions. The scope below maps the historical period, the forecast horizon, the segmentation dimensions, and the countries covered, alongside the underlying primary and qualitative methodology.
Historical Period
2020 to 2025
Forecast Period
2026 to 2036
Base Year
2025 (USD billions; MMA Primary Research Dataset, September 2026)
Market Definition
The Chemical Mechanical Planarization Market covers slurries, polishing pads, conditioners, and polishing equipment used to remove and smooth material layers on semiconductor wafers during fabrication, sold as consumable materials or capital equipment to chip manufacturers. It excludes wafer cleaning chemicals used outside the planarization step, photolithography materials, and general industrial polishing products not qualified for semiconductor-grade defect specifications.
Quantitative Units
USD billions (current prices); unit shipment volume where applicable
Segmentation Dimensions
By Primary Market Dimension; By End-Use Industry; By Commercial Dimension; By Region
Regions Covered
North America, Western Europe, East Asia, South Asia and Pacific, Latin America, Middle East and Africa, Eastern Europe
Countries Covered
USA, China, Germany, France, UK, Japan, South Korea, India, Australia, Canada, Brazil, Mexico, Indonesia, Vietnam, Thailand, Malaysia, UAE, Saudi Arabia, South Africa, Nigeria, Turkey, Poland, Netherlands, Italy, Spain, Sweden, Switzerland, Argentina, Colombia, Singapore, and additional markets relevant to this sector
Key Companies Profiled
Applied Materials, Entegris, Fujimi, DuPont, Ebara Corporation, Hitachi High-Tech, Fujibo Group, 3M, Ferro Corporation, Saint-Gobain, Showa Denko Materials, JSR Corporation, Cabot Microelectronics, Solvay, Anji Microelectronics, Kinik Company, IV Technologies, Dow Chemical, Nitta Haas, SKC Solmics
Quantitative Methodology
Primary survey, n=3,800 respondents, Q4 2025, six countries; demand-side model with trade association cross-validation
Qualitative Methodology
47 expert interviews, Q4 2025; applied to validate demand model assumptions, identify emerging dynamics, and assess competitive positioning
Report Format
PDF and XLSX data workbook (Word format preview document)
Publisher
Market Minds Advisory
Report Code
MMA-2026-CHM-217
Published
September 2026
Contact
sales@marketmindsadvisory.com | www.marketmindsadvisory.com

Purchase the full Chemical Mechanical Planarization Market Report (2026 to 2036).

This report delivers a comprehensive assessment of the global Chemical Mechanical Planarization Market, covering sizing, segmentation, competitive dynamics, and regional demand patterns through 2036. It profiles twenty leading vendors across consumable specialists, equipment manufacturers, and diversified chemical companies, examining how advanced node transitions and 3D NAND layer growth are reshaping consumable economics. The analysis draws on primary survey data from 3,800 respondents and 47 expert interviews conducted in the fourth quarter of 2025. Readers gain a structured view of where qualification value concentrates and how sourcing strategy should evolve.
Detailed twenty-vendor competitive profiles and positioning
Full seven-region demand share and CAGR breakdown
Six-segment product growth and margin tier analysis
In-depth rare earth supply chain risk assessment
Advanced node qualification and chemistry strategy guidance
Anonymized client slurry qualification engagement case study

Built For The People Who Decide

From boardroom strategy to bench-side execution, this report is read cover-to-cover by leaders shaping the next decade of their industry, turning demand scenarios, market dynamics and valuation benchmarks into decisions.
CXOs/ Presidents/ VPs/ Managers
M&A and Corporate Development
Strategy Teams and R&D Heads
Procurement and Product Directors
Regulatory and Compliance Leaders
Investor Relations and Equity Analysts