Market Minds Advisory
Centrifugal Pumps Market

Centrifugal Pumps Market: The Machine Is Cheap, The Twenty Years After It Are Not

A commercial reading of centrifugal pumping equipment, where the purchase price is a fraction of lifetime cost, and the specifying engineer who writes the datasheet decides where the aftermarket revenue goes.

Lead Analyst

David Horsley

Published

September 2026

Make Smarter Decisions with Customized Research Insights

Request a free sample report and evaluate market opportunities, growth trends, and competitive dynamics relevant to your business needs.

2025 MARKET VALUE$48.2BMarket Size 2025
2036 FORECAST VALUE$82.4BBase Case , 2026 to 2036
CAGR 2026 TO 20365.0 %Bull 6.2% / Bear 3.8%
INCREMENTAL OPPORTUNITY$31.8BNet 10- year value creation
EXPANSION MULTIPLE1.63x2036 value over 2026 base
Strategic Levers
M&A Pipeline
Regional Outlook
Country Rankings
Competitive Intelligence
Segmental Deep-dive
Call-Us : 91 93563 13602

Executive Snapshot and Market Trajectory

A centrifugal pump costs a few thousand dollars and then consumes electricity, seals, bearings, and engineering attention for twenty years. Energy alone is usually the largest number. Anyone selling on purchase price is competing for the smallest part of what the customer actually spends. That is the whole problem.
The market stands at USD 48.2 billion in 2025 and reaches USD 82.44 billion by 2036 at a 5.0% CAGR. Sealless and magnetic drive pumps grow fastest at 8.6%, about 1.72 times the overall rate, as emissions rules and hazardous duty requirements push users away from mechanical seals entirely. East Asia holds 29% of value on process industry capacity, while India posts the quickest national growth at 9.4%.
Concentration is moderate, with the top five holding roughly 31% of pump revenue and aftermarket position separating them far more than hydraulic design does. Two forces pull against each other. Energy efficiency regulation and water infrastructure investment keep pulling demand toward better engineered equipment, while procurement in most industries still awards on delivered price against a datasheet somebody else wrote years earlier. Nobody sitting in the tender owns the energy line at all.
Market Definition
The centrifugal pumps market covers rotodynamic pumping equipment that moves fluid through impeller rotation, spanning single-stage overhung process pumps, multistage and between-bearings pumps, submersible and vertical turbine pumps, sealless and magnetic drive pumps, and slurry and solids-handling pumps. Positive displacement pumps of every type, vacuum pumps and compressors, pump-driven systems sold as packaged plant, mechanical seals and bearings sold as separate components, variable speed drives sold independently, and installation, commissioning, and maintenance services billed separately are excluded.
Base Year Value
$48.2B in 2025 (MMA Primary Research Dataset, August 2026)
Forecast Period
2026 to 2036, eleven discrete annual values
CAGR
5.0% base case. Bull 6.2%. Bear 3.8%.
Fastest Growth Segment
Sealless and Magnetic Drive Pumps: 8.6% CAGR
Fastest Growth Country
India: 9.4% CAGR
Fastest Growth Region
South Asia and Pacific: 7.2% CAGR
Largest Region
East Asia: 29% of 2025 global value
Market Leaders
Grundfos, Xylem, KSB, Flowserve, Sulzer. Source: MMA Analysis based on company annual reports.
Primary Survey
n=3,800 procurement and R&D decision-makers, Q4 2025, six countries
Methodology
Demand-side build-up, cross-validated against public data, 47 expert interviews

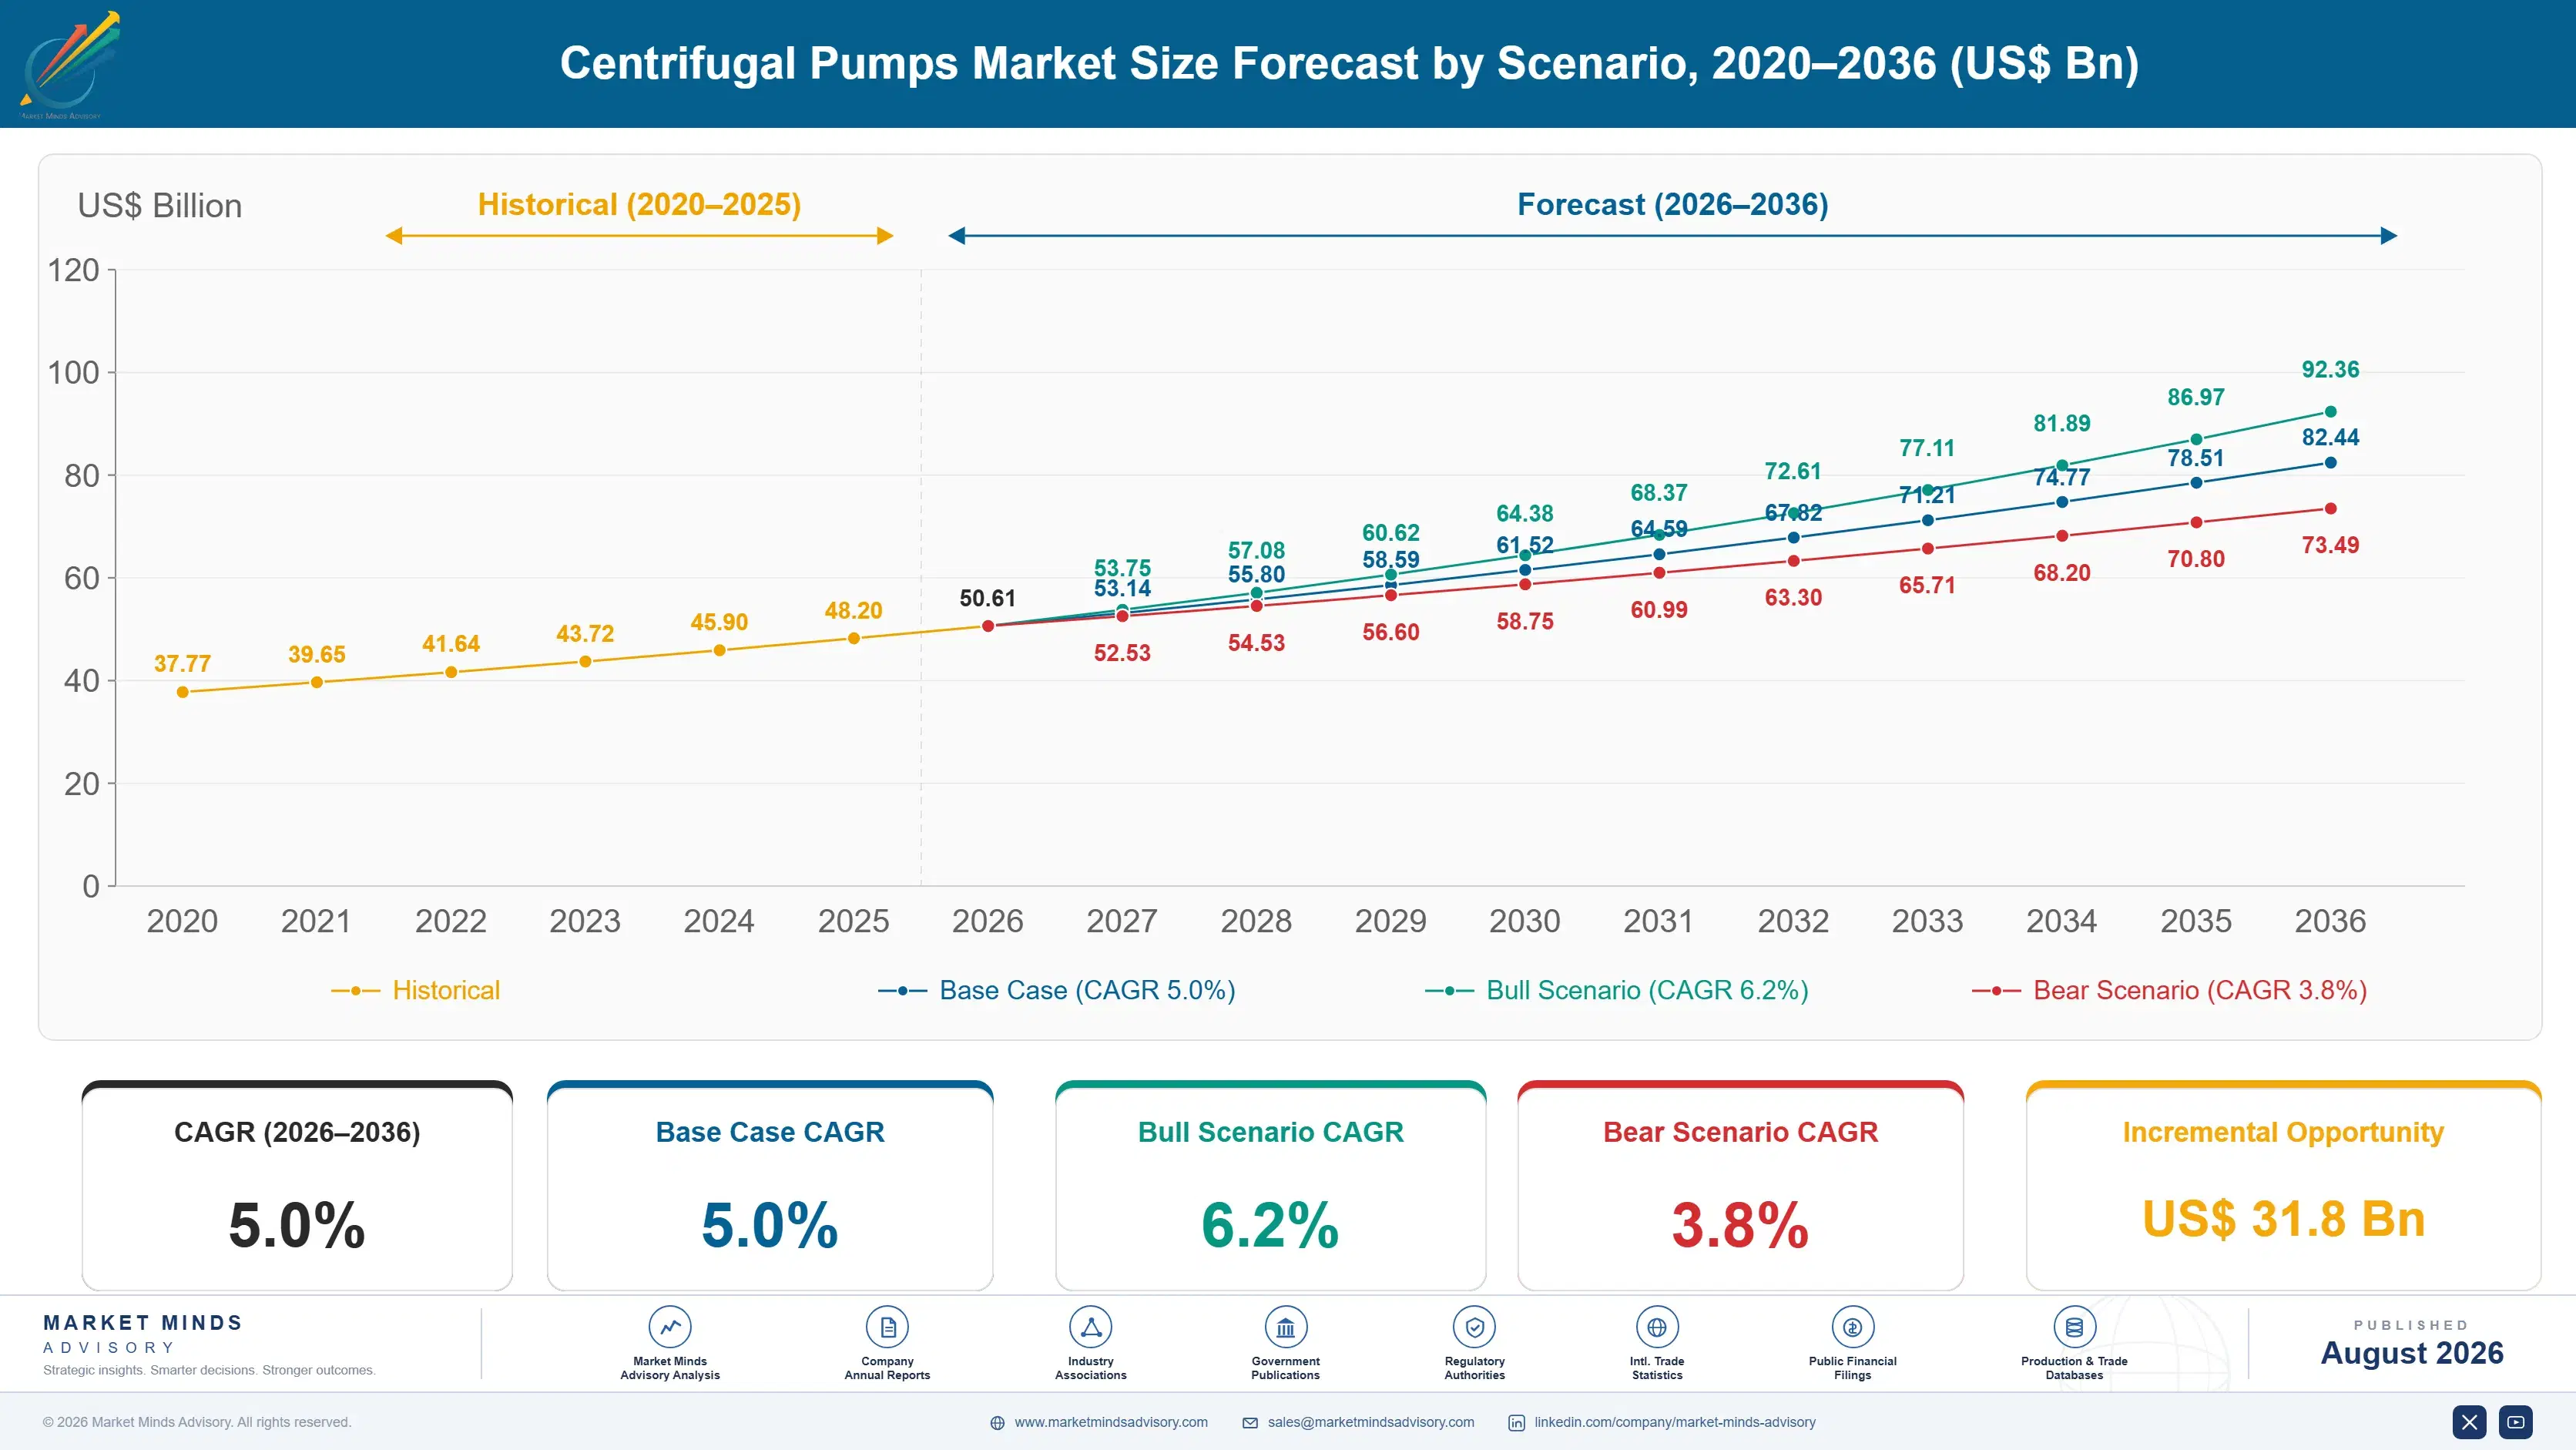
Centrifugal Pumps Market Forecast Scenarios

centrifugal-pumps-market-size-forecast-scenario-1787332035028
Growth from 2020 to 2025 compounded near 4.0%, and capital cycles rather than technology shaped it. Process industry project work stalled through 2020 and 2021, then recovered as delayed refinery, chemical, and water investment released. Aftermarket revenue held up far better than original equipment, which is what the installed base is supposed to do. Efficiency regulation tightened across the same window and quietly changed what could be sold.
Three mechanisms carry the base case to 5.0%. First, water and wastewater infrastructure investment, where ageing developed networks and new developing capacity both consume pumps in volume. Second, efficiency regulation, which removes lower-efficiency hydraulic designs from sale and forces replacement earlier than mechanical failure would. Third, sealless conversion in hazardous and emissions-regulated duties, where mechanical seal leakage is no longer commercially or legally acceptable in a widening set of applications.
The bull case at 6.2% assumes water infrastructure funding converts into orders on announced timetables and efficiency rules tighten further, both of which pull replacement forward. The bear case at 3.8% assumes process industry capital spending stays cautious, water projects slip as they habitually do, and procurement keeps awarding on delivered price in ways that favour lower-cost regional manufacturers over efficiency arguments.

Twenty Years Of Cost Decided In One Datasheet

Demand rests on three foundations. Process and water capacity provides the volume, since pumps go wherever fluid must move, which tracks industrial and municipal investment directly. Efficiency regulation provides the replacement, because rules removing lower-efficiency designs from sale force renewal earlier than failure would. And the installed base provides the earnings, since parts and service are roughly 42% of supplier revenue at margins original equipment never reaches.
MARKET CONCENTRATIONCR5: 31%Moderately fragmented across process, water, and industrial applications
ENERGY COST SHAREAbout 44%Electricity against total ownership cost over service life
PURCHASE PRICE SHARE8% to 15%Original equipment cost as a portion of lifetime spend
AFTERMARKET REVENUE SHAREAbout 42%Parts and service against original equipment in supplier revenue
PUMP SERVICE LIFE15 to 25 yearsWorking life before replacement rather than overhaul becomes necessary
OVERSIZING PREVALENCEAbout 60%Installed pumps running away from their best efficiency point
Commercially the decisive number is not the price. Purchase price is 8% to 15% of lifetime cost and energy alone is about 44%, so the engineer choosing a duty point commits far more money than the buyer negotiating the invoice does. Roughly 60% of installed pumps run away from their best efficiency point, which is the single largest avoidable cost in industrial fluid handling anywhere.
The next decade turns on whether efficiency arguments reach the people who decide. Regulation is removing the worst designs from sale, which helps, but oversizing persists because datasheets are copied forward and nobody is accountable for the energy line. Sealless designs at 8.6% growth are the clearest genuine gain, driven by emissions rules rather than efficiency. Aftermarket position remains the asset worth defending.
"Pump companies have been explaining lifecycle cost to customers for thirty years and roughly six in ten installed pumps still run in the wrong place on the curve. That is not a communication failure. It is what happens when the engineer who sizes the pump never sees the electricity bill."
Director, Rotating Equipment and Industrial Flow Practice · MMA Industrial Equip

Market Trends

Emissions Rules Push Duties Away From Mechanical Seals

A mechanical seal leaks by design, and fugitive emission rules in refining, chemicals, and pharmaceutical manufacturing have made that increasingly difficult to defend on hazardous or volatile duties. Sealless and magnetic drive designs remove the leak path entirely and grow at 8.6% against a market at 5.0% for that reason alone. They cost considerably more, run less efficiently on some duties, and cannot handle solids, so the conversion is regulatory rather than economic. Users who have made the switch rarely go back, because the compliance argument does not weaken. The compliance argument only tightens.
Market Impact: Networks average 50 years old
Efficiency Regulation Removes Designs From Sale Entirely

Minimum efficiency index requirements across Europe and comparable rules elsewhere no longer merely rate hydraulic performance, they prohibit the sale of designs below a threshold, which forces manufacturers to redesign or withdraw product families. That pulls replacement forward ahead of mechanical failure and changes what a specifying engineer can legally repeat from an old datasheet. It also disadvantages regional manufacturers who cannot fund hydraulic redesign programmes. The commercial effect is a quiet consolidation nobody announced, running through the catalogue rather than through acquisitions. Redesign or withdraw is the only choice available.
Market Impact: Aftermarket is 42% of revenue

Market Opportunities and Growth Drivers

Water Infrastructure Replacement Drives Volume Everywhere

Municipal water and wastewater networks in developed markets were largely built in the mid twentieth century and are now being renewed on funded programmes, while developing markets are installing capacity for the first time. Both consume pumps in quantity rather than in technical sophistication. Public funding cycles decide timing, which makes the demand lumpy and frequently delayed, but the underlying replacement need does not go away and grows with network age. This is the steadiest volume in the pump market and the least sensitive to industrial capital cycles. Ageing networks guarantee the volume.
Market Impact: Purchase price is 8% of lifetime

Installed Base Generates Most Of The Actual Earnings

Parts and service are roughly 42% of supplier revenue at margins original equipment never approaches, because a pump running a critical duty cannot wait for a competitive tender when an impeller wears. Service life of 15 to 25 years means every unit sold today is an annuity for two decades, provided the supplier holds the relationship and the spares position. That is why original equipment is frequently priced to win the installation rather than the order, and why losing an installed base hurts far longer than losing a project. Installed base loss compounds quietly.
Market Impact: Regional pricing runs 30% below

Market Restraints and Challenges

Procurement Awards On Price Against Copied Datasheets

Most pump purchases are awarded on delivered price against a specification an engineer wrote years earlier and has since copied forward without revisiting the duty. The root cause is organisational: the engineer sizing the pump is not accountable for the electricity it consumes, and the buyer negotiating the invoice cannot evaluate a duty point. Commercially this rewards the lowest quote on a wrong specification. Suppliers mitigate by auditing installed duty points, reaching operations and energy managers directly, and quoting lifecycle cost with measured rather than catalogue data. Nobody is accountable for the energy line.
Market Impact: Sealless designs grow at 8.6%

Regional Manufacturers Undercut On Standard Hydraulic Duties

Chinese, Indian, and Turkish manufacturers supply competent standard process and water pumps at prices Western producers cannot approach, and on straightforward duties the hydraulic difference is genuinely small. The root cause is that centrifugal pump design is mature and well documented, so the technology barrier is low outside demanding applications. Commercially this compresses original equipment pricing on the highest-volume duties. Suppliers mitigate by shifting mix toward sealless and severe-duty work, defending aftermarket position with genuine parts, and competing on efficiency where regulation makes it enforceable. The technology barrier here is genuinely low.
Market Impact: Rules bar designs below 40 index
4 additional market trends, 3 additional growth drivers, and 2 additional restraints and challenges are covered in the full report. Contact sales@marketmindsadvisory.com to access the complete intelligence.

Segment CAGR and Growth Architecture

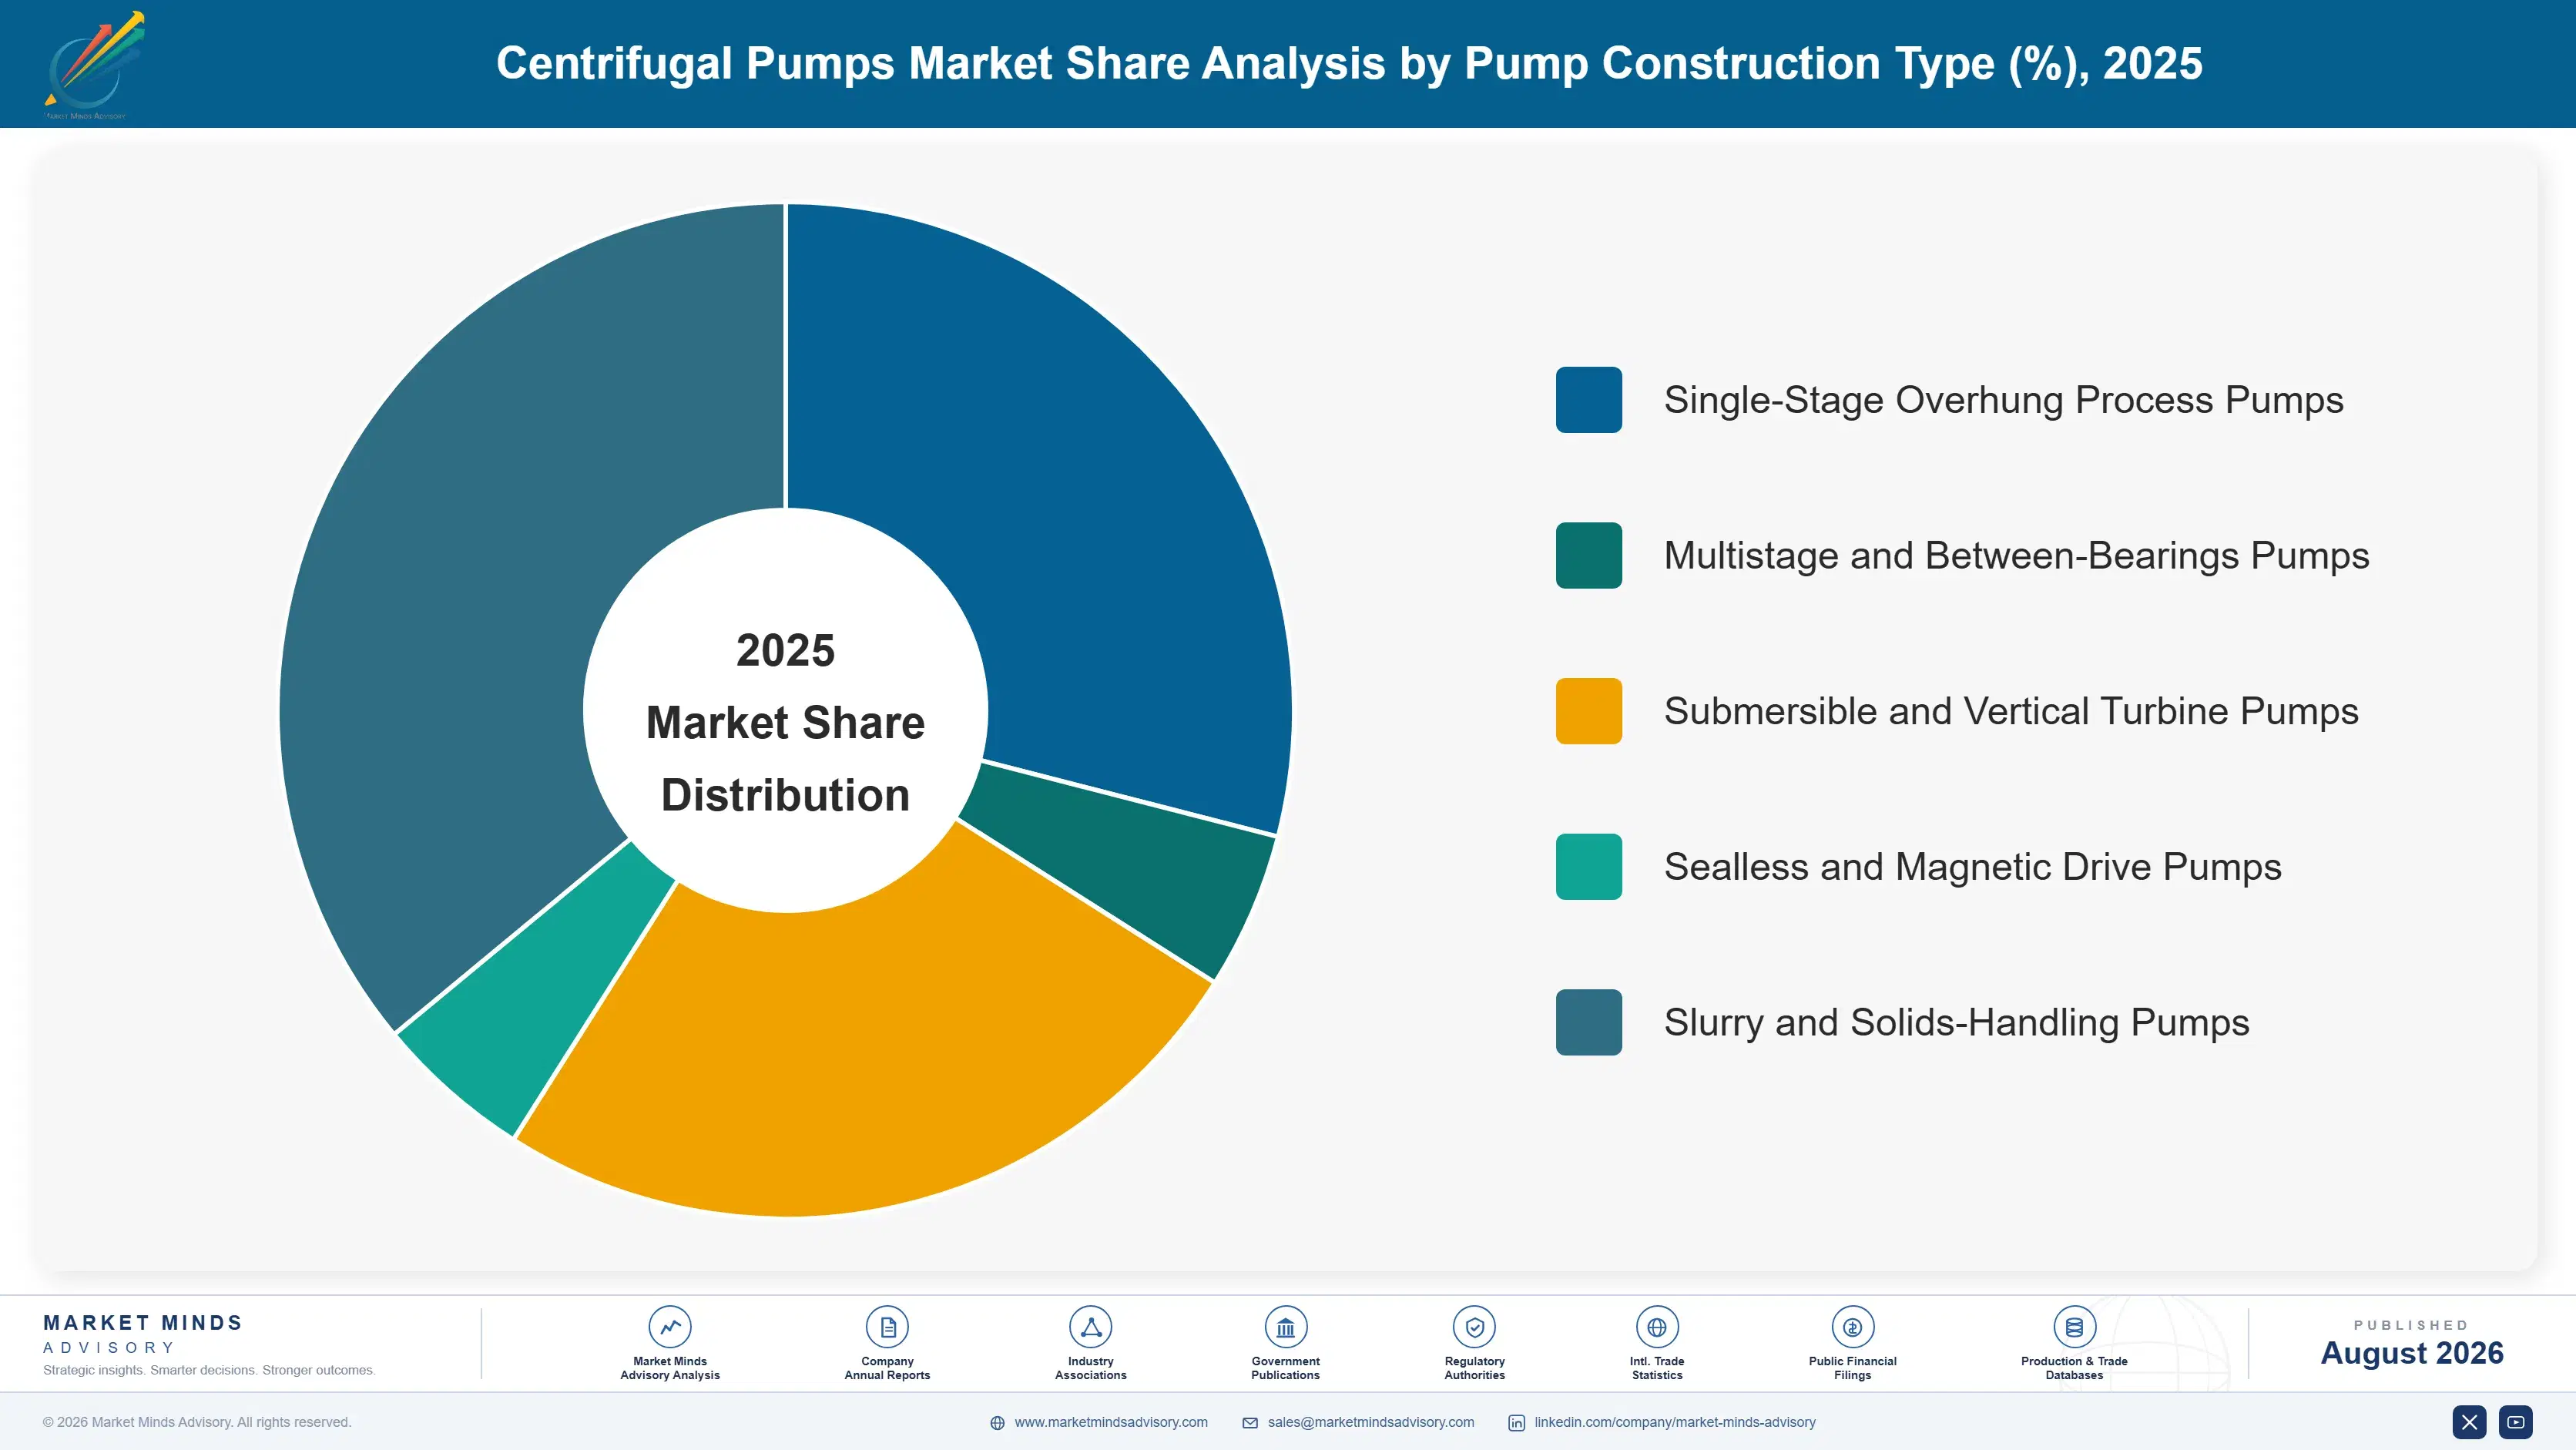
Segmentation follows pump construction type, a single classification describing the mechanical arrangement of the machine. Each type carries its own hydraulic range, sealing arrangement, service regime, and competitive field, so commercial economics track the construction rather than the fluid being pumped. End-use industry and sales channel appear separately within the framework as their own distinct dimensions.
centrifugal-pumps-market-market-share-analysis-1787332035562

Sealless and Magnetic Drive Pumps

Sealless and magnetic drive pumps grow fastest at 8.6%, about 1.72 times the overall 5.0% rate, and emissions regulation rather than performance explains all of it. Removing the mechanical seal removes the leak path, which is what fugitive emission rules in refining, chemicals, and pharmaceutical manufacturing increasingly require on volatile and hazardous duties. The trade-offs are real: higher purchase cost, lower efficiency on some duties, no tolerance for solids, and containment shell losses that add to the energy bill. Users who convert rarely revert, because the compliance requirement does not soften. The qualified supplier list here is considerably shorter than for standard process pumps. Conversion is regulatory rather than economic throughout.
CAGR 8.6%

Slurry and Solids-Handling Pumps

Slurry and solids-handling pumps grow at 6.4%, the second-fastest construction, driven by mining volumes, tailings handling, and the abrasive duties that mineral processing generates in enormous quantity. Wear is the entire commercial story: liners, impellers, and throat bushes are consumed rather than maintained, which makes the aftermarket attachment rate the highest in the pump market by a wide margin. Material selection between rubber and hard metal linings is application-specific and genuinely difficult to get right. Mining capital cycles make original equipment demand volatile, while the wear parts revenue underneath it continues regardless of whether anybody is building a new mine. Wear parts revenue rather than machine sales is the real asset.
CAGR 6.4%
Full segment breakdown across 5 segments available in the complete report.

Regional Architecture and Country Demand Map

Process industry capacity and water infrastructure investment together set this distribution rather than population. East Asia leads on installed process and municipal capacity, while South Asia and Pacific grows quickest as water networks and industrial plant are built for the first time. Water funding timing dominates the short term.

North America

North America holds 24% of value on refining, chemical, and municipal water capacity that is large, ageing, and steadily being renewed. Aftermarket attachment is the highest of any region, because operators run critical duties and pay for genuine parts rather than risk an unplanned outage. Federal water infrastructure funding has released steadily if slower than announced, and municipal procurement remains firmly price-led on standard duties. Sealless conversion in Gulf Coast petrochemical duties is well advanced under emissions rules. Growth of 4.6% reflects replacement and efficiency-driven renewal rather than new plant capacity being added. Local machine shops nonetheless take pattern parts business wherever service contracts are absent, which erodes aftermarket capture quietly.
Share: 24% | CAGR: 4.6% (2026 to 2036)

Western Europe

Efficiency regulation shaped this market before it reached anywhere else. Western Europe holds 22% of value, with minimum efficiency requirements that prohibit sale of lower-performing hydraulic designs rather than merely rating them, which forced manufacturers to redesign catalogues and quietly removed weaker competitors. Energy costs since 2022 gave the efficiency argument commercial weight it had lacked for decades. German, Italian, and Nordic manufacturers hold strong positions in engineered and severe-duty work. Growth of 3.6% is the slowest of the seven regions, reflecting mature installed capacity and industrial output that has not grown. The efficiency argument finally has commercial weight here, though municipal procurement still awards on price whenever it can.
Share: 22% | CAGR: 3.6% (2026 to 2036)
Regional intelligence for 5 additional markets available in the complete report: East Asia, South Asia and Pacific, Latin America, Middle East and Africa, Eastern Europe. Contact sales@marketmindsadvisory.com.
centrifugal-pumps-market-country-cagr-analysis-1787332036085

Where Pump Suppliers Actually Earn Money

Winning the order on delivered price means competing for 8% to 15% of what the customer will spend. The four moves below reach the rest of it: auditing installed duty points, defending the aftermarket, holding sealless capability where regulation mandates it, and getting into the specification before the datasheet is copied forward again. None is a price argument.

Audit Installed Duty Points Rather Than Quote Replacements

Roughly 60% of installed pumps run away from their best efficiency point, and energy is about 44% of lifetime cost, which means a measured audit routinely finds savings larger than the entire purchase price of a replacement machine. That converts a price conversation into an engineering one and reaches operations and energy managers rather than procurement. The audit costs field engineering time and frequently recommends trimming an impeller instead of selling a pump. Suppliers unwilling to make that recommendation never get invited to do the audit. Honesty is what earns the second audit.
Market Impact: About 60% of installed pumps run of

Defend The Aftermarket Before Somebody Else Takes It

Parts and service are roughly 42% of supplier revenue at margins original equipment never reaches, and a pump on a critical duty cannot wait for a tender when an impeller wears. That position erodes quietly through local machine shops and pattern parts unless the supplier holds service contracts, condition monitoring, and genuine spares availability. Service life of 15 to 25 years means each installation is a two-decade annuity or a two-decade leak. Original equipment priced to win the installation only pays if the aftermarket actually follows. Annuity or leak, and the choice compounds.
Market Impact: Aftermarket delivers roughly 42% of

Hold Sealless Capability Where Regulation Demands It

Sealless and magnetic drive pumps grow at 8.6% against a market at 5.0%, and emissions rules rather than economics drive every bit of that. The qualified supplier list is considerably shorter than for standard process pumps because containment shell design, secondary containment, and bearing arrangements are genuinely demanding. Users who convert do not revert, since the compliance requirement never softens. Building capability before a customer's duty falls under a tightened rule is what makes you the answer rather than a late alternative. Arriving after the rule tightens means arriving as an alternative.
Market Impact: Sealless grows at 8.6% against a 5.

Reach The Specification Before The Datasheet Repeats

Most pump purchases are awarded against a specification written years earlier and copied forward without anybody revisiting the duty, which means the engineer who wrote it originally chose the supplier for a decade. Getting into that document at the design stage of a plant or a network renewal decides far more volume than any tender response. Contractors and consulting engineers are the route, not the end operator. Suppliers organised only around distributor and procurement relationships never see the specification being written at all. A datasheet written once can govern 10 years of orders.
Market Impact: A specification repeats for 10 year

Who Controls the Margin Pool

Concentration is moderate: the top five hold roughly 31% of pump revenue, across process equipment specialists, water-focused manufacturers, and diversified industrial groups. The gap between leaders and challengers is aftermarket network density and engineered application capability rather than hydraulic design, which is mature and widely understood. All participants here are assessed on one basis, revenue from centrifugal pump equipment and associated parts, excluding positive displacement pum
Competition runs along four lines. First, aftermarket network density, since parts and service carry the margin and proximity decides who supplies them. Second, engineered application capability in severe, hazardous, and high-pressure duties. Third, sealless and magnetic drive capability where emissions rules mandate it. Fourth, specification access through consulting engineers and contractors, who write the datasheets that repeat for a decade.

Pressure is building from two directions. Chinese, Indian, and Turkish manufacturers undercut consistently on standard duties where hydraulic differences are small, and they are moving upward. Meanwhile efficiency regulation is removing weaker designs from sale and quietly consolidating the catalogue. Rankings should favour suppliers with dense aftermarket networks and sealless capability over those defending standard-duty volume on price.
centrifugal-pumps-market-company-positioning-matrix-1787332036600

Competitive Moat and Risk Dimensions

GRUNDFOS

Moat: Efficiency position and water depth

Grundfos built hydraulic efficiency leadership before regulation made it enforceable, which now positions it well as minimum efficiency requirements remove weaker designs from sale entirely. Its depth in water, wastewater, and building services covers the steadiest volume in the market. Distribution and service density in those channels is genuinely hard for competitors to replicate at comparable cost.
GRUNDFOS

Risk: Standard duty price competition

A large share of volume sits in standard water and building duties where Chinese, Indian, and Turkish manufacturers compete effectively and hydraulic differences are small. Municipal procurement remains firmly price-led despite the efficiency argument. Water project timing also slips habitually, which makes order intake lumpier than the underlying replacement need would suggest.
FLOWSERVE

Moat: Engineered duty and aftermarket network

Flowserve holds strong positions in engineered process pumps for refining, chemical, and power duties where hydraulic and metallurgical specification genuinely matters, and its service network density supports the aftermarket attachment those installations generate. Sealless and severe-duty capability covers the applications emissions rules are pushing toward. Contractor and consulting engineer relationships give it specification access competitors reach late.
FLOWSERVE

Risk: Capital cycle and pattern parts

Original equipment demand tracks refining and chemical capital spending, which is cyclical and currently cautious in most regions. Local machine shops supply pattern parts into the installed base and erode aftermarket capture quietly wherever service contracts are absent. Water and building services exposure is thinner than competitors hold, which removes the steadiest volume from the portfolio.

Players Tracked

Prominent Players

Grundfos
Xylem
KSB
Flowserve
Sulzer

Other Key Players

Ebara
ITT Goulds Pumps
Wilo
Pentair
Andritz
SPX Flow
Weir Minerals
Metso
Kirloskar Brothers
Torishima
Shin Nippon Machinery
Ruhrpumpen
Nikkiso
Netzsch Pumps
CIRCOR International

Recent Developments

FEBRUARY 2025

European efficiency requirements extend to further pump categories

Minimum efficiency index requirements widened to additional centrifugal pump categories, prohibiting sale of designs below defined thresholds rather than simply rating their performance. This was European regulation taking effect rather than a commercial transaction, and it obliged manufacturers to redesign or withdraw affected product families entirely.
Signal: Regulation removing designs from sale cons
AUGUST 2024

Sealless pump conversions accelerate under fugitive emission rules

Refining and chemical operators extended sealless and magnetic drive conversion programmes across volatile and hazardous duties as fugitive emission requirements tightened in several jurisdictions. These were operator equipment decisions rather than corporate transactions, and they shortened the list of suppliers technically able to compete for the work.
Signal: Compliance-driven conversion never reverse
APRIL 2024

Water infrastructure funding releases into municipal pump orders

Municipal water and wastewater renewal programmes released tranches of funded work into orders across several developed markets, after delays that had pushed timelines well beyond original announcements. These were public funding decisions rather than corporate events, and procurement remained firmly price-led on standard duties throughout.
Signal: Funded water work arrives late and still a

Castings, Stainless Steel, Motors, Machining

Metal and purchased components dominate this cost sheet. Iron and stainless castings run 26% to 36% of pump cost, sourced from foundries whose capacity has contracted steadily across Europe and North America. Purchased electric motors add 14% to 22%, mechanical seals and bearings 8% to 14% where fitted, and machining and assembly labour a further 18% to 26% depending on duty complexity and batch size.
Foundry closures across Europe tightened casting supply through 2021 and 2022 as stainless alloy surcharges rose on nickel pricing, and lead times on engineered castings extended by months. KSB and Sulzer both disclosed material cost and supply chain pressure across those reporting periods. Energy-intensive foundry operations then absorbed the European gas price rise, with IEA analysis recording industrial gas at several times prior-year levels. Recovery lagged badly.

Exposure separates by foundry position and vertical integration rather than by scale. A manufacturer with owned or contracted foundry capacity controls cost and lead time, while one buying castings on the open market pays whatever the shrinking supplier base charges and waits. Geography compounds it, since European and North American foundry capacity has contracted while Asian and Turkish capacity has not, which shifts sourcing regardless of preference.
centrifugal-pumps-market-cost-volatility-analysis-1787332036796

Secure foundry capacity under long-term agreement

Engineered castings come from a shrinking base of qualified foundries, and lead time rather than price is usually the binding problem when capacity tightens. Long-term volume agreements cost commitment and occasionally leave a manufacturer carrying volume it does not need. They also mean production continues when competitors quote six-month deliveries, which wins work no pricing argument reaches in a shortage.

Standardise hydraulic families to cut pattern and machining cost

Every distinct casting pattern carries tooling, inventory, and machining setup cost that a rationalised hydraulic family avoids entirely. Consolidating overlapping ranges reduces foundry pattern count, simplifies machining, and shortens lead times, all without changing what the customer receives. The work is unglamorous, slow, and frequently resisted internally by engineers who designed the ranges being retired.

Qualify alternative motor suppliers across efficiency classes

Purchased motors are up to a fifth of pump cost and their efficiency class determines whether the packaged unit meets regulation. Qualifying two or three suppliers across the required classes costs testing once and provides pricing position and continuity. Regulation changes motor requirements faster than hydraulics change, so a single-sourced motor is a compliance exposure too.

Portfolio Architecture for Margin Defence

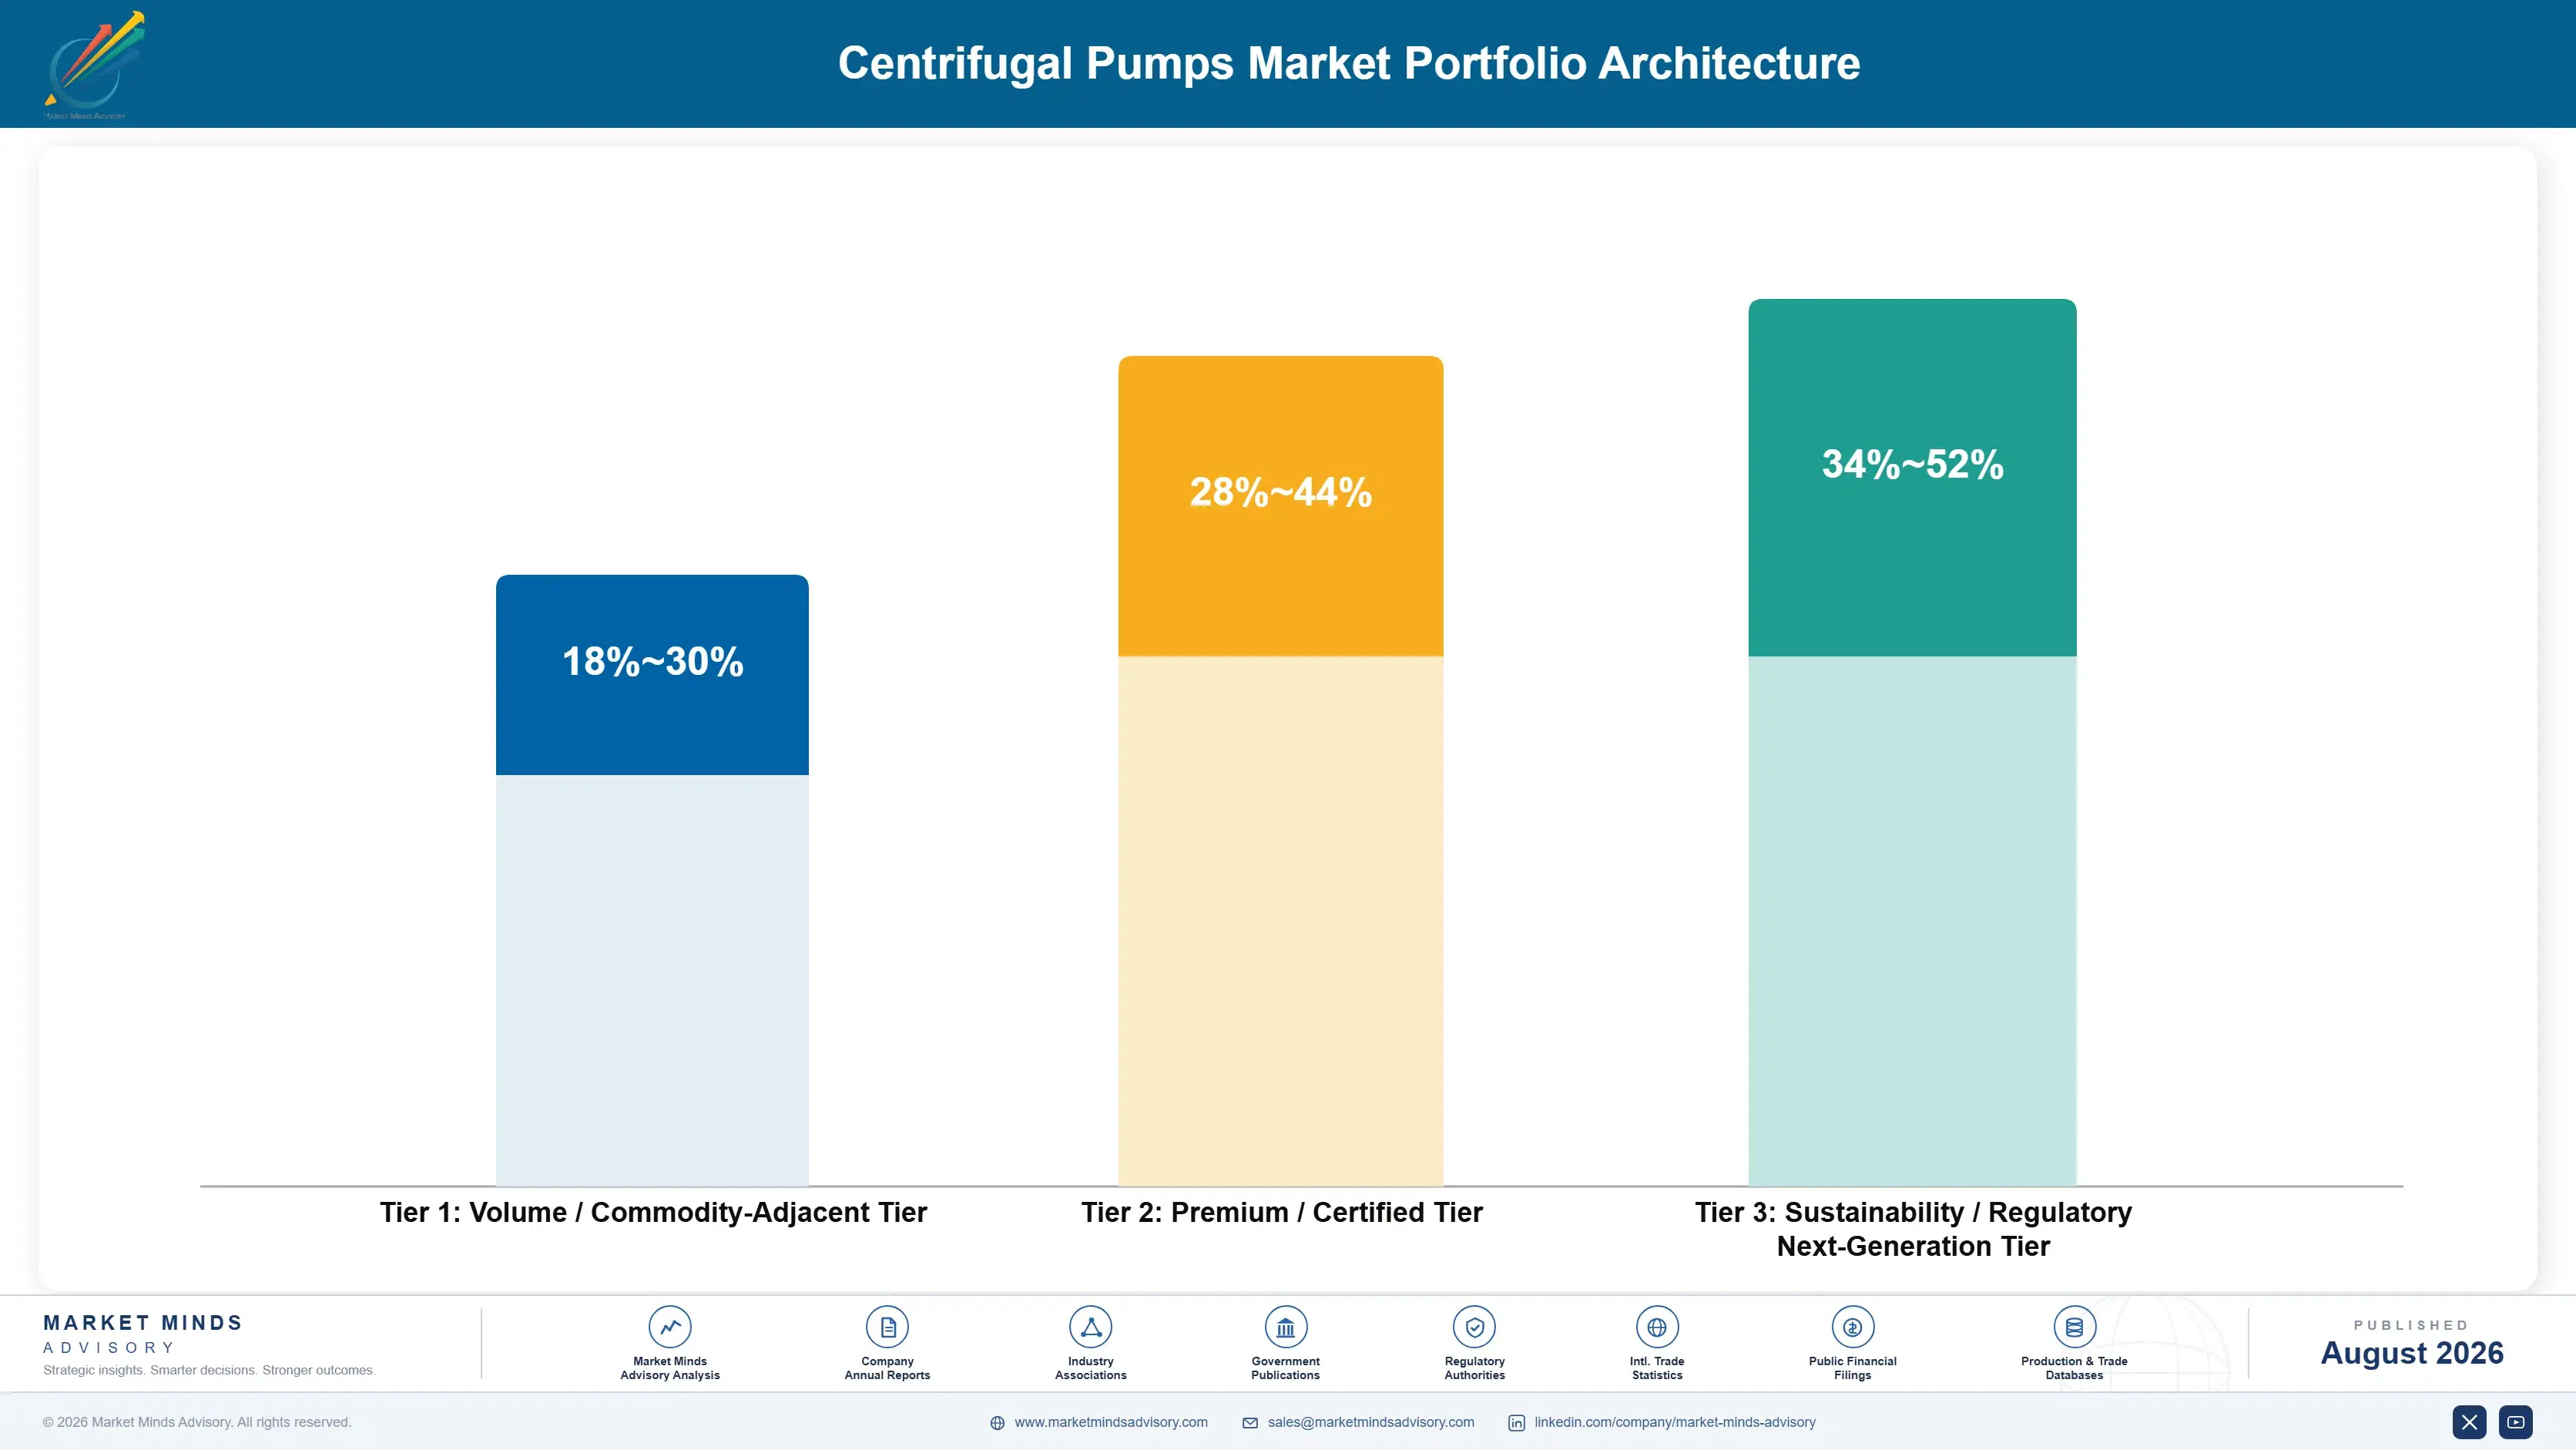
The portfolio splits into three tiers with different economics. Standard water and general process pumps form the volume tier, where hydraulic design is mature, regional manufacturers compete well, and delivered price decides awards. Engineered severe-duty and high-pressure pumps earn more because metallurgy and application knowledge narrow the field. Sealless designs and the wear parts aftermarket price against regulation and criticality rather than against a competing quotation.
The tension runs between standard volume that fills the machine shop and engineered work that earns the return. Standard water and process pumps keep foundry commitments loaded, cover machining capacity cost, and build the installed base aftermarket revenue comes from. Yet they compete against Chinese, Indian, and Turkish manufacturers on price. Suppliers handling this well accept thin standard-duty margin for the installed base while directing engineering toward sealless and severe-duty capability.

High-value pools concentrate where regulation, metallurgy, or criticality limits competition: sealless pumps on emissions-regulated duties, slurry wear parts consumed predictably, engineered pumps for high-pressure and corrosive service, and any duty under a service contract with condition monitoring. All four escape delivered price comparison. Standard municipal water pumps sit at the other end, where a dozen manufacturers meet the specification and price decides.

Volume / Commodity-Adjacent Tier

Standard water, building services, and general process pumps sold on delivered price against many capable manufacturers. The range is wide because foundry position and machining automation separate producers considerably at identical selling prices.
Gross Margin: 18-30%

Premium / Certified Tier

Engineered process pumps for severe, corrosive, and high-pressure duty, including API-compliant construction. The range is wide because metallurgical specification varies enormously and aftermarket attachment differs sharply between operators. Utilisation separates them further.
Gross Margin: 28-44%

Sustainability / Regulatory / Next-Generation Tier

Sealless and magnetic drive pumps, high-efficiency hydraulic families meeting tightened index requirements, and condition-monitored service arrangements. The range is wide because regulation mandates some of it while efficiency arguments still struggle to reach procurement.
Gross Margin: 34-52%
centrifugal-pumps-market-portfolio-architecture-1787332037293

High-value Sub-segments and Strategic Watch-out

Sealless and Magnetic Drive Pumps

High value and high growth at 8.6%, the fastest construction, driven entirely by fugitive emission rules rather than by any efficiency or cost case. The qualified supplier list is short, containment design is demanding, and converted duties effectively never revert to mechanical seals. Compliance never softens afterwards.
Gross Margin: 34-52%

Slurry and Solids-Handling Pumps

High value with strong growth at 6.4%, carrying the highest aftermarket attachment in the market because liners and impellers are consumed rather than maintained. Mining capital cycles make original equipment lumpy while wear parts revenue continues regardless of new projects. Application knowledge is genuinely hard to copy.
Gross Margin: 30-48%

Single-Stage Overhung Process Pumps

The volume core by a wide margin, growing at 4.4% across chemical, refining, and general industry duties. Hydraulic design is mature and regional manufacturers compete hard, so aftermarket capture rather than original equipment margin decides whether the installation was worth winning. Aftermarket capture decides the whole return.
Gross Margin: 22-36%

Submersible and Vertical Turbine Pumps

The strategic watch-out, growing at 5.2% on municipal water, irrigation, and dewatering duties funded through public programmes that slip habitually. Volume is genuinely large and price sensitivity severe, with efficiency regulation the only force lifting specification at all. Public funding timing rather than need sets the pace.
Gross Margin: 20-34%

How Pump Positions Actually Hold

Demand commits at specification and repeats as parts orders for fifteen to twenty-five years. A pump written into a plant datasheet or municipal standard has passed hydraulic selection, materials review, and often contractor approval, and that document gets copied forward without anybody revisiting the duty. That protects incumbents more completely than performance could. The genuine competitive moments are a new plant design, a renewal programme, and any regulation invalidating the specificatio
Stickiness varies by criticality and parts availability. Sealless duties stick hardest, since requalifying containment on a hazardous service is a safety case nobody reopens casually. Slurry duties stick through wear part availability and know-how. Engineered process pumps stick through the specification document itself. Standard water pumps stick least, moving at every tender because a dozen manufacturers meet the duty and pattern parts are available.

Buyer profiles have shifted from plant engineers selecting on application knowledge toward procurement awarding on delivered price, with energy managers now a third voice. Efficiency regulation has finally given that voice real authority, since a non-compliant design cannot be bought at any price. That change rewards suppliers bringing measured duty point data and compliance evidence, and penalises those still presenting catalogue curves to purchasing.
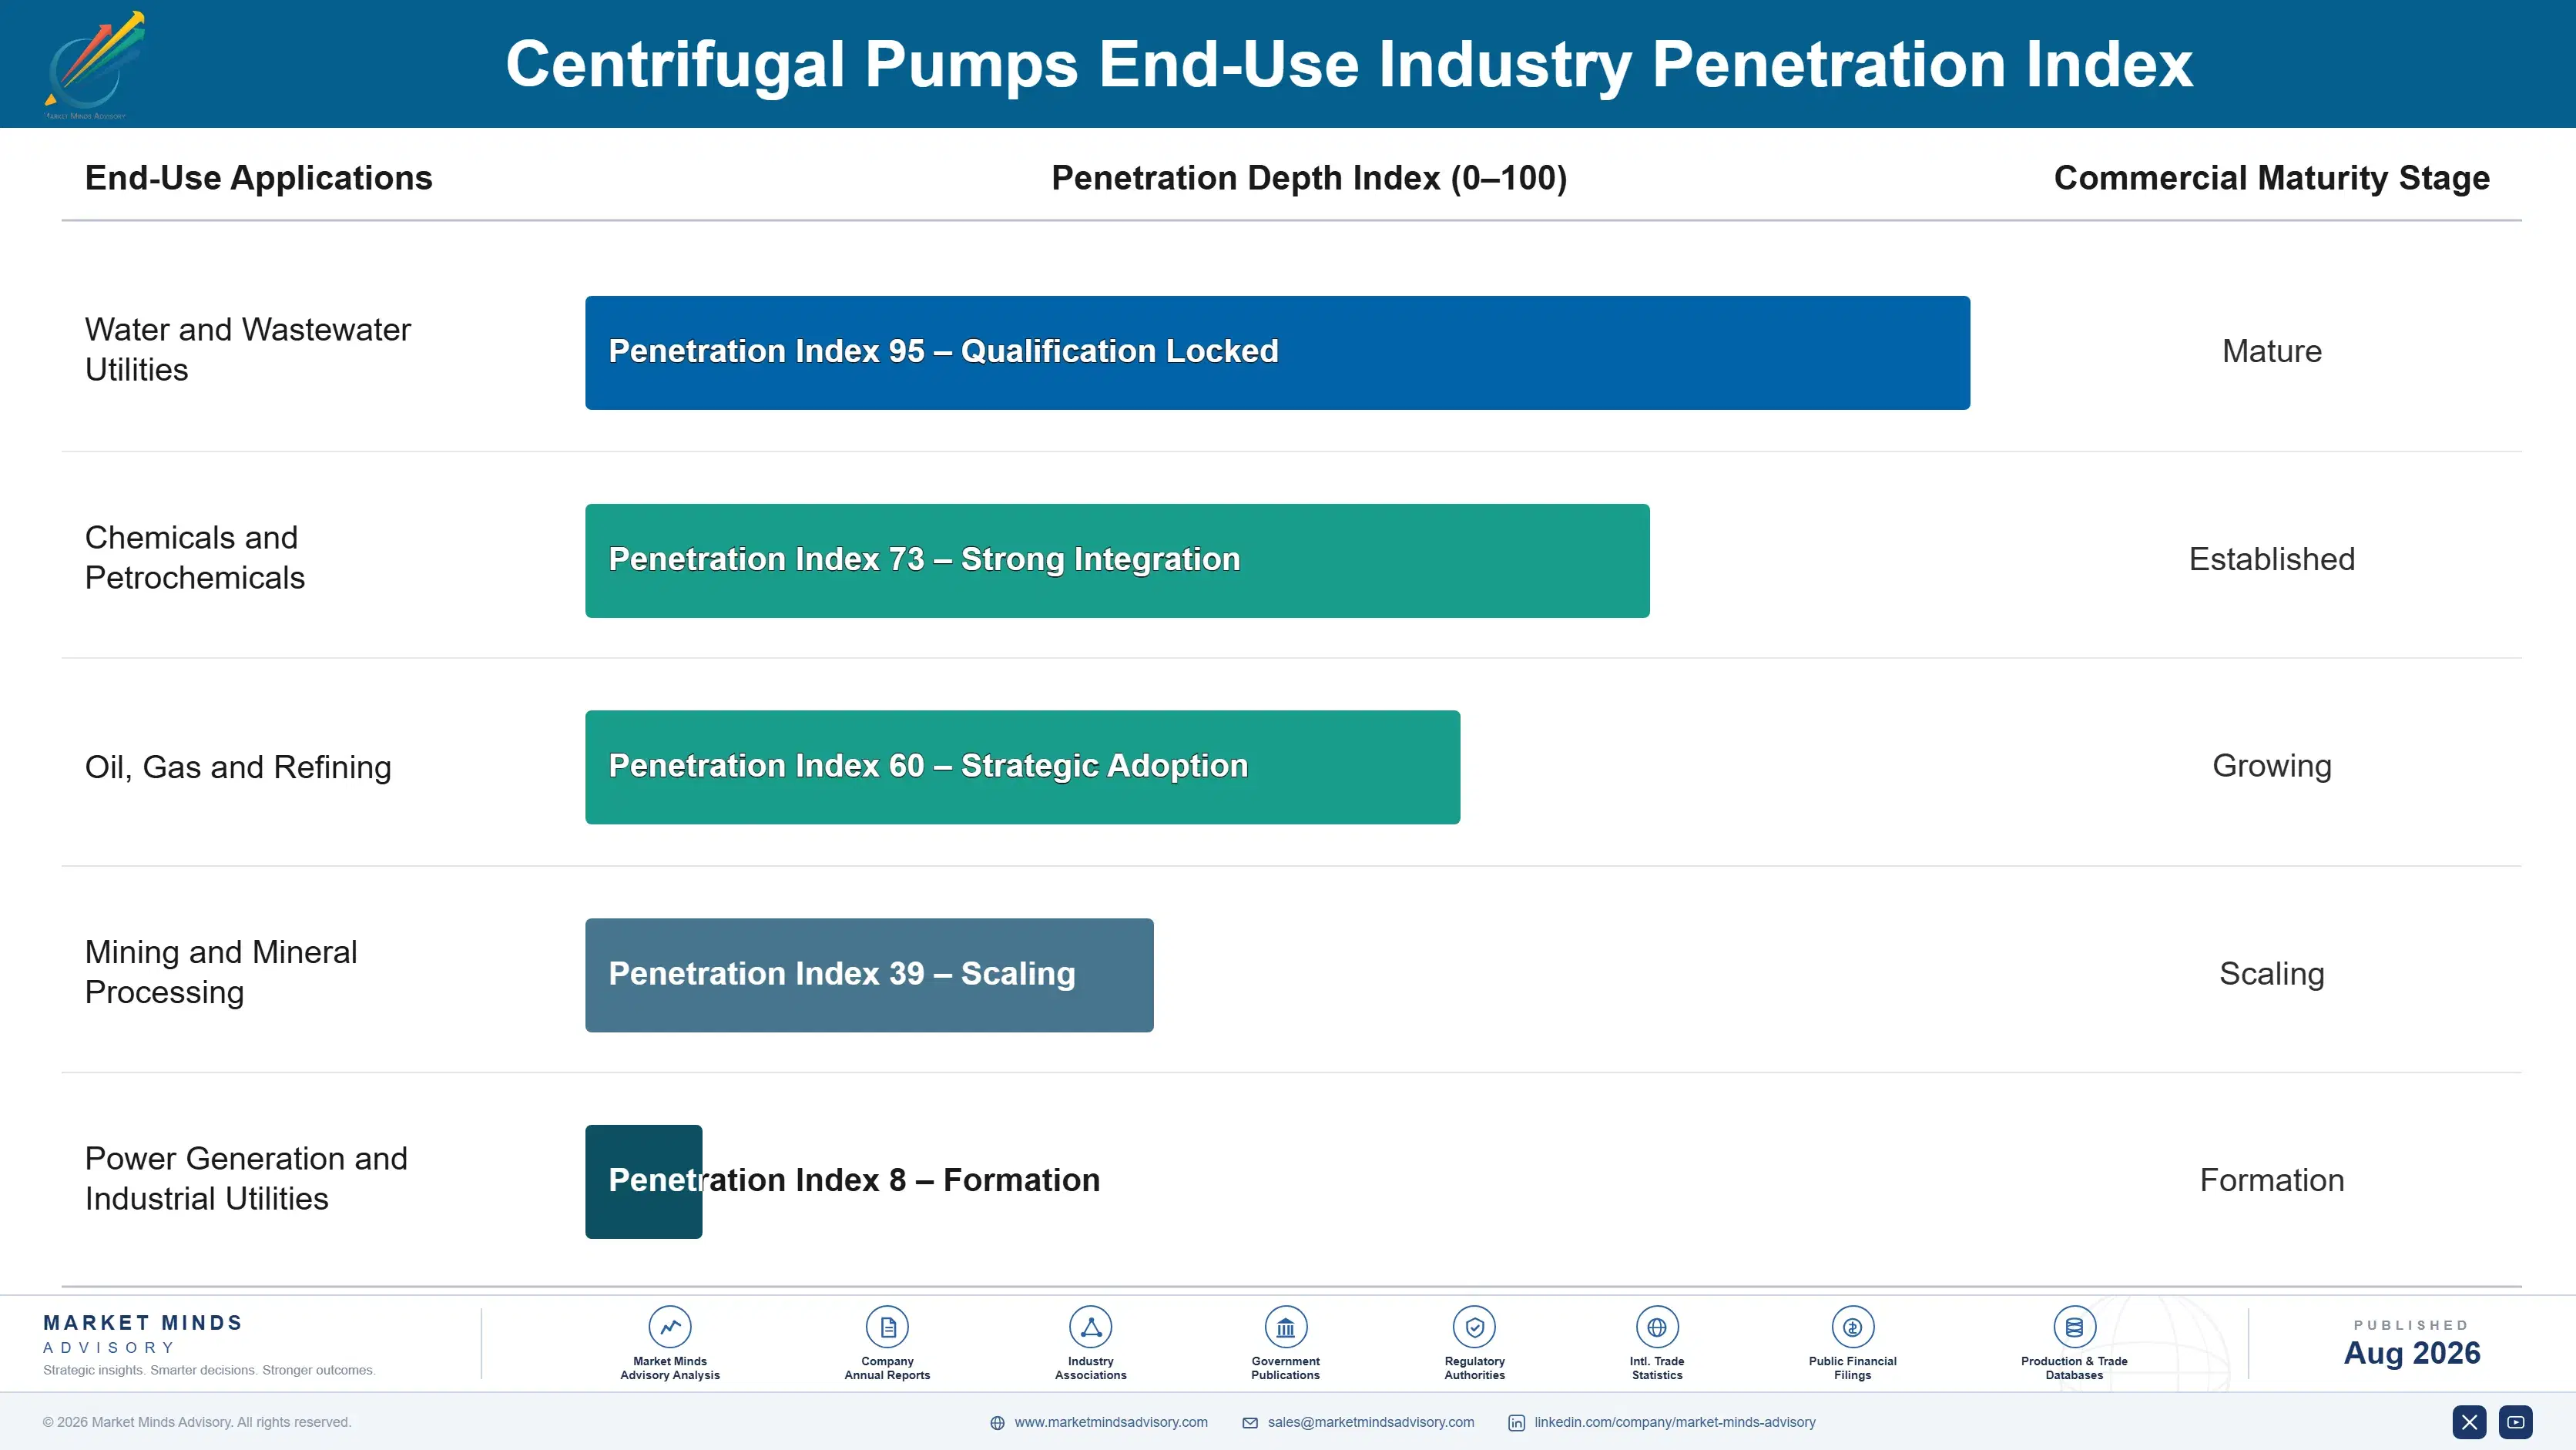
centrifugal-pumps-market-end-use-penetration-index-1787332037782

Our Call On Centrifugal Pumps

These are among the four positions where our research anticipates prominent divergence between winners and laggards over the coming forecast period. Each is grounded in the demand model, the regulatory perimeter, and the announced capacity pipeline.
01 / DUTY POINT AUDITING

The saving is larger than the pump you want to sell

Roughly 60% of installed pumps run away from their best efficiency point and energy is about 44% of lifetime cost, so a measured audit routinely finds annual savings exceeding the purchase price of a replacement machine entirely. That converts a price conversation into an engineering one and reaches operations and energy managers rather than procurement. The audit costs field engineering time and frequently recommends trimming an impeller instead of selling anything, and suppliers unwilling to say so never get asked back.
02 / AFTERMARKET POSITION DEFENCE

Every installation is a two-decade annuity or leak

Parts and service are roughly 42% of supplier revenue at margins original equipment never reaches, and service life of 15 to 25 years makes each installed pump a very long revenue stream. That position erodes quietly through local machine shops and pattern parts wherever service contracts, condition monitoring, and genuine spares availability are absent. Pricing original equipment to win the installation only works if the aftermarket actually follows, and a great deal of it currently does not follow at all.
03 / SEALLESS CAPABILITY BUILD

Emissions rules create positions that never reverse

Sealless and magnetic drive pumps grow at 8.6% against a market at 5.0%, and fugitive emission regulation rather than any efficiency or cost argument drives every bit of that growth. Containment shell design, secondary containment, and bearing arrangement are all demanding enough that the qualified supplier list stays considerably shorter than for standard process pumps. Operators who convert a duty do not revert, because the compliance requirement never softens, which makes each conversion a permanent commercial position for whoever won it.
04 / SPECIFICATION STAGE ACCESS

The datasheet chooses the supplier for a decade

Most pump awards run against a specification an engineer wrote years earlier and has since copied forward without revisiting the duty at all, which means the original author effectively selected the supplier for ten years. Reaching that document during plant design or network renewal decides far more volume than any tender response ever will. Consulting engineers and contractors are the route to it, not the eventual operator, and suppliers organised only around distributors never see the document being written at all.

Engagement Snapshot From the Field

A live engagement with an industry participant carrying material or product regulatory and market exposure ahead of a defining policy shift, showing how our research translates into a defensible multi-year portfolio strategy.
MARKET MINDS ADVISORY · CLIENT ENGAGEMENT SUMMARY
Centrifugal Pumps Producer Strategic Portfolio Review and Transition Roadmap 2026·Investment Scenario on Centrifugal Pumps Exposure Evaluation 2025-26
CLIENT PROFILE
A chemical manufacturer operating six sites engaged MMA after energy costs rose and two pumps failed on critical duties within a quarter. The client reported roughly 1,400 installed centrifugal pumps, no central record of duty points against original selection, and annual pump-related energy spend of about USD 19 million (client-reported, unverified by MMA). Nobody owned the energy number.
STRATEGIC CHALLENGE
Replacing 1,400 pumps was neither affordable nor necessary, and the maintenance function wanted spares standardisation while the energy team wanted efficiency upgrades. Neither had data on which pumps were actually running badly. The board needed to know where the money genuinely was before approving either programme, and before the next capital cycle closed.
MMA APPROACH
MMA measured actual duty points on a stratified sample rather than accepting original datasheet selections, which nobody had verified since installation. We ranked pumps by annual energy cost rather than by size or age, since a small pump running continuously costs more than a large one running occasionally. We then separated efficiency opportunities from reliability problems, because the two require different interventions and budgets entirely.
KEY FINDINGS
  1. About 63% of sampled pumps were running away from best efficiency point, and roughly 11% were oversized enough that impeller trimming alone would pay back inside a year (client-reported, unverified by MMA).
  2. Energy cost concentrated severely, with 8% of the fleet accounting for around 41% of pump-related electricity consumption across the six sites every year.
  3. The two critical failures were both on duties running far off curve, which meant the reliability problem and the energy problem shared a single root cause.
  4. Spares standardisation was worth considerably less than expected, because pattern parts were already being sourced locally on most non-critical duties (client-reported, unverified by MMA).
CLIENT PROFILE
A chemical manufacturer operating six sites engaged MMA after energy costs rose and two pumps failed on critical duties within a quarter. The client reported roughly 1,400 installed centrifugal pumps, no central record of duty points against original selection, and annual pump-related energy spend of about USD 19 million (client-reported, unverified by MMA). Nobody owned the energy number.
STRATEGIC CHALLENGE
Replacing 1,400 pumps was neither affordable nor necessary, and the maintenance function wanted spares standardisation while the energy team wanted efficiency upgrades. Neither had data on which pumps were actually running badly. The board needed to know where the money genuinely was before approving either programme, and before the next capital cycle closed.
MMA APPROACH
MMA measured actual duty points on a stratified sample rather than accepting original datasheet selections, which nobody had verified since installation. We ranked pumps by annual energy cost rather than by size or age, since a small pump running continuously costs more than a large one running occasionally. We then separated efficiency opportunities from reliability problems, because the two require different interventions and budgets entirely.
KEY FINDINGS
  1. About 63% of sampled pumps were running away from best efficiency point, and roughly 11% were oversized enough that impeller trimming alone would pay back inside a year (client-reported, unverified by MMA).
  2. Energy cost concentrated severely, with 8% of the fleet accounting for around 41% of pump-related electricity consumption across the six sites every year.
  3. The two critical failures were both on duties running far off curve, which meant the reliability problem and the energy problem shared a single root cause.
  4. Spares standardisation was worth considerably less than expected, because pattern parts were already being sourced locally on most non-critical duties (client-reported, unverified by MMA).
RECOMMENDED STRATEGY
Phase 1: Phase 1 (0 to 6 months): Trim impellers on the oversized pumps identified in the audit rather than replacing any equipment at all. Phase 2: Phase 2 (6 to 18 months): Address the eight percent of the fleet carrying most of the energy cost, replacing only where trimming cannot reach the duty. Phase 3: Phase 3 (18 to 30 months): Put duty point verification into the specification process so new selections are measured rather than copied forward.
OUTCOME
The client cut pump-related energy consumption by roughly 17% within two years, mostly through impeller trimming rather than replacement, at a fraction of the capital the efficiency programme had originally requested. Correcting off-curve operation on the critical duties also ended the failure pattern, and duty point verification is now written into new specifications (client-reported, unverified by MMA).

Frequently Asked Questions

Foundational context covering the market sizes, CAGR, scope, country, region and competition that inform every finding below. This section is provided to cover basics and most often pre-purchase conversations, answered from the MMA Primary Research Dataset.

What is the current size of the Centrifugal Pumps Market?

The global centrifugal pumps market is valued at USD 48.2 billion in 2025, covering overhung process, multistage, submersible, sealless, and slurry pump constructions. Positive displacement pumps and separately sold seals and drives are excluded.

How large will the Centrifugal Pumps Market be by 2036?

The market is forecast to reach USD 82.44 billion by 2036 in the base case, about 1.63 times the 2026 level. That represents incremental value of roughly USD 31.83 billion across the decade.

What is the CAGR for the Centrifugal Pumps Market 2026 to 2036?

The market grows at a 5.0% CAGR in the base case, with bull and bear scenarios at 6.2% and 3.8%. The spread turns mainly on water infrastructure timing and process industry capital spending.

Which segment is growing fastest?

Sealless and magnetic drive pumps grow fastest at 8.6%, about 1.72 times the overall rate, driven by fugitive emission rules. Slurry and solids-handling pumps follow at 6.4% on mining volumes.

Who are the major companies in the Centrifugal Pumps Market?

Leading manufacturers include Grundfos, Xylem, KSB, Flowserve, and Sulzer. Concentration is moderate, with the top five holding roughly 31% of pump revenue across process, water, and industrial applications.

Which country is growing fastest?

India grows fastest at a 9.4% CAGR, as municipal water schemes, irrigation, and industrial capacity expand together. China and Indonesia follow on process and municipal investment.

Report Segmentation Architecture

The full report scope spans multiple orthogonal segmentation dimensions, with cross-tabulated demand data provided for each dimension pair. Coverage extends further to regional breakdowns, trend trajectories, and the competitive detail needed to support segment-level decision-making.

By Pump Construction Type

  • Single-Stage Overhung Process Pumps
  • Multistage and Between-Bearings Pumps
  • Submersible and Vertical Turbine Pumps
  • Sealless and Magnetic Drive Pumps
  • Slurry and Solids-Handling Pumps

By End-Use Industry

  • Water and Wastewater Utilities
  • Chemicals and Petrochemicals
  • Oil, Gas and Refining
  • Mining and Mineral Processing
  • Power Generation and Industrial Utilities

By Sales Channel

  • Direct Contract To End User
  • Engineering Contractor and Project Supply
  • Distributor and Dealer Network
  • Aftermarket Parts and Service Contract

By Region

  • North America
  • Western Europe
  • East Asia
  • South Asia and Pacific
  • Latin America
  • Middle East and Africa
  • Eastern Europe

Scope, Methodology, and Coverage

Every figure in this report is reproducible from documented input assumptions. The scope below maps the historical period, the forecast horizon, the segmentation dimensions, and the countries covered, alongside the underlying primary and qualitative methodology.
Historical Period
2020 to 2025
Forecast Period
2026 to 2036
Base Year
2025 (USD billions; MMA Primary Research Dataset, August 2026)
Market Definition
The centrifugal pumps market comprises the manufacture and sale of rotodynamic pumping equipment that moves fluid through impeller rotation, valued at manufacturer selling prices to end users, engineering contractors, and distributors, and including the genuine replacement parts supplied for that equipment. It spans single-stage overhung process pumps, multistage and between-bearings pumps, submersible and vertical turbine pumps, sealless and magnetic drive pumps, and slurry and solids-handling pumps, together with the hydraulic selection, materials specification, and performance documentation supplied with them. Positive displacement pumps of every type including reciprocating, diaphragm, gear, and progressing cavity designs, vacuum pumps and compressors, pump-driven systems sold as packaged plant or skid, mechanical seals, bearings and couplings sold as separate components, variable speed drives and motors sold independently of a pump, and installation, commissioning, and field maintenance services billed separately are excluded.
Quantitative Units
USD billions (current prices); unit volume in millions of pumps and installed base in millions of units
Segmentation Dimensions
By Pump Construction Type; By End-Use Industry; By Sales Channel; By Region
Regions Covered
North America, Western Europe, East Asia, South Asia and Pacific, Latin America, Middle East and Africa, Eastern Europe
Countries Covered
USA, Canada, Mexico, Germany, France, UK, Italy, Spain, Netherlands, Sweden, Switzerland, Poland, Czech Republic, Romania, Japan, China, South Korea, India, Australia, Indonesia, Vietnam, Thailand, Brazil, Chile, Peru, Argentina, UAE, Saudi Arabia, South Africa, Turkey, and additional markets relevant to this sector
Key Companies Profiled
Grundfos, Xylem, KSB, Flowserve, Sulzer, Ebara, ITT Goulds Pumps, Wilo, Pentair, Andritz, SPX Flow, Weir Minerals, Metso, Kirloskar Brothers, Torishima, Shin Nippon Machinery, Ruhrpumpen, Nikkiso, Netzsch Pumps, CIRCOR International
Quantitative Methodology
Primary survey, n=3,800 respondents, Q4 2025, six countries; demand-side model with trade association cross-validation
Qualitative Methodology
47 expert interviews, Q4 2025; applied to validate demand model assumptions, identify emerging dynamics, and assess competitive positioning
Report Format
PDF and XLSX data workbook (Word format preview document)
Publisher
Market Minds Advisory
Report Code
MMA-2026-CON-330
Published
August 2026
Contact
sales@marketmindsadvisory.com | www.marketmindsadvisory.com

Purchase the full Centrifugal Pumps Market Report (2026 to 2036).

The full MMA Centrifugal Pumps report sizes the market across five construction types, five end-use industries, four sales channels, and seven regions through 2036. It profiles 20 manufacturers on a consistent basis of centrifugal pump equipment and parts revenue, scoring each on aftermarket network density, engineered application capability, sealless capability, and specification access. Scenario models quantify how efficiency regulation, water infrastructure funding, and process capital cycles move both volume and achievable margin by construction. The report also includes lifetime cost decomposition against purchase price, installed base oversizing estimates by industry, aftermarket attachment rate benchmarking, and efficiency compliance mapping across regulatory jurisdictions.
Five-construction and four-channel market sizing to 2036
Twenty-manufacturer benchmark on pump equipment and parts revenue
Lifetime cost decomposition against original purchase price
Installed base oversizing estimates by end-use industry
Aftermarket attachment rate benchmarking across construction types
Efficiency compliance mapping across major regulatory jurisdictions

Built For The People Who Decide

From boardroom strategy to bench-side execution, this report is read cover-to-cover by leaders shaping the next decade of their industry, turning demand scenarios, market dynamics and valuation benchmarks into decisions.
CXOs/ Presidents/ VPs/ Managers
M&A and Corporate Development
Strategy Teams and R&D Heads
Procurement and Product Directors
Regulatory and Compliance Leaders
Investor Relations and Equity Analysts