Market Minds Advisory
Cellular Reprogramming Tools Market

Cellular Reprogramming Tools Market: Stubborn Inefficiency, Clinical Grade Premiums, and Automation Pressure

Roughly two cells in every ten thousand actually reprogram, and nearly twenty years of effort has not improved that, so this entire tools industry exists to manage one stubborn inefficiency.

Lead Analyst

Alice Ballenger

Published

August 2026

Make Smarter Decisions with Customized Research Insights

Request a free sample report and evaluate market opportunities, growth trends, and competitive dynamics relevant to your business needs.

2025 MARKET VALUE$1.3BMarket Size 2025
2036 FORECAST VALUE$4.9BBase Case , 2026 to 2036
CAGR 2026 TO 203612.8 %Bull 14.1% / Bear 11.5%
INCREMENTAL OPPORTUNITY$3.4BNet 10- year value creation
EXPANSION MULTIPLE3.33x2036 value over 2026 base
Strategic Levers
M&A Pipeline
Regional Outlook
Country Rankings
Competitive Intelligence
Segmental Deep-dive
Call-Us : 91 93563 13602

Executive Snapshot and Market Trajectory

Reprogramming converts roughly 0.02% of treated cells into pluripotent ones, and that figure has barely moved in nearly two decades of work. Every tool sold in this market exists to manage that inefficiency rather than to remove it. Nobody in the field now expects that number to change materially.
Automation instruments and consumables compound at 19.2%, a full 1.50x the market rate, because manual open handling neither passes a manufacturing inspection at clinical scale nor reproduces reliably between operators. East Asia holds the largest share at 30%, led by Japan, where a national induced pluripotent stem cell stock programme and a purpose-built regenerative medicine framework created the deepest concentration of reprogramming activity anywhere. No other country built comparable infrastructure.
Concentration is moderate at 58%, and the commercial divide runs between research and clinical grade rather than between technologies. A research line costs around USD 32,000 to generate while a clinical-grade equivalent costs roughly USD 580,000, and almost all of that difference is documentation, donor consent and release testing rather than biology. That gap has pulled suppliers toward manufacturing credentials rather than reagent science. Several suppliers acquired those credentials rather than build inspection history internally.
Market Definition
This market covers products and services used to reprogram somatic cells to pluripotency or to directly convert cell identity, spanning reprogramming vectors and delivery reagents, culture media and growth supplements, substrates and coating reagents, characterisation and quality control reagents, automation instruments and consumables, and line generation and banking services, measured at supplier revenue. Differentiation-specific reagents for downstream lineages, gene editing tools sold independently, cell therapy manufacturing beyond line generation, primary cell isolation products, and therapeutic products themselves are excluded.
Base Year Value
$1.3B in 2025 (MMA Primary Research Dataset, August 2026)
Forecast Period
2026 to 2036, eleven discrete annual values
CAGR
12.8% base case. Bull 14.1%. Bear 11.5%.
Fastest Growth Segment
Automation Instruments and Consumables: 19.2% CAGR
Fastest Growth Country
Japan: 20.4% CAGR
Fastest Growth Region
South Asia and Pacific: 14.8% CAGR
Largest Region
East Asia: 30% of 2025 global value
Market Leaders
Thermo Fisher Scientific, STEMCELL Technologies, Merck KGaA, Lonza, and Fujifilm Cellular Dynamics. Source: MMA Primary Research Dataset, July 2026.
Primary Survey
n=3,800 procurement and R&D decision-makers, Q4 2025, six countries
Methodology
Demand-side build-up, cross-validated against public data, 47 expert interviews

Cellular Reprogramming Tools Market Forecast Scenarios

cellular-reprogramming-tools-market-size-forecast-scenario-1787304868256
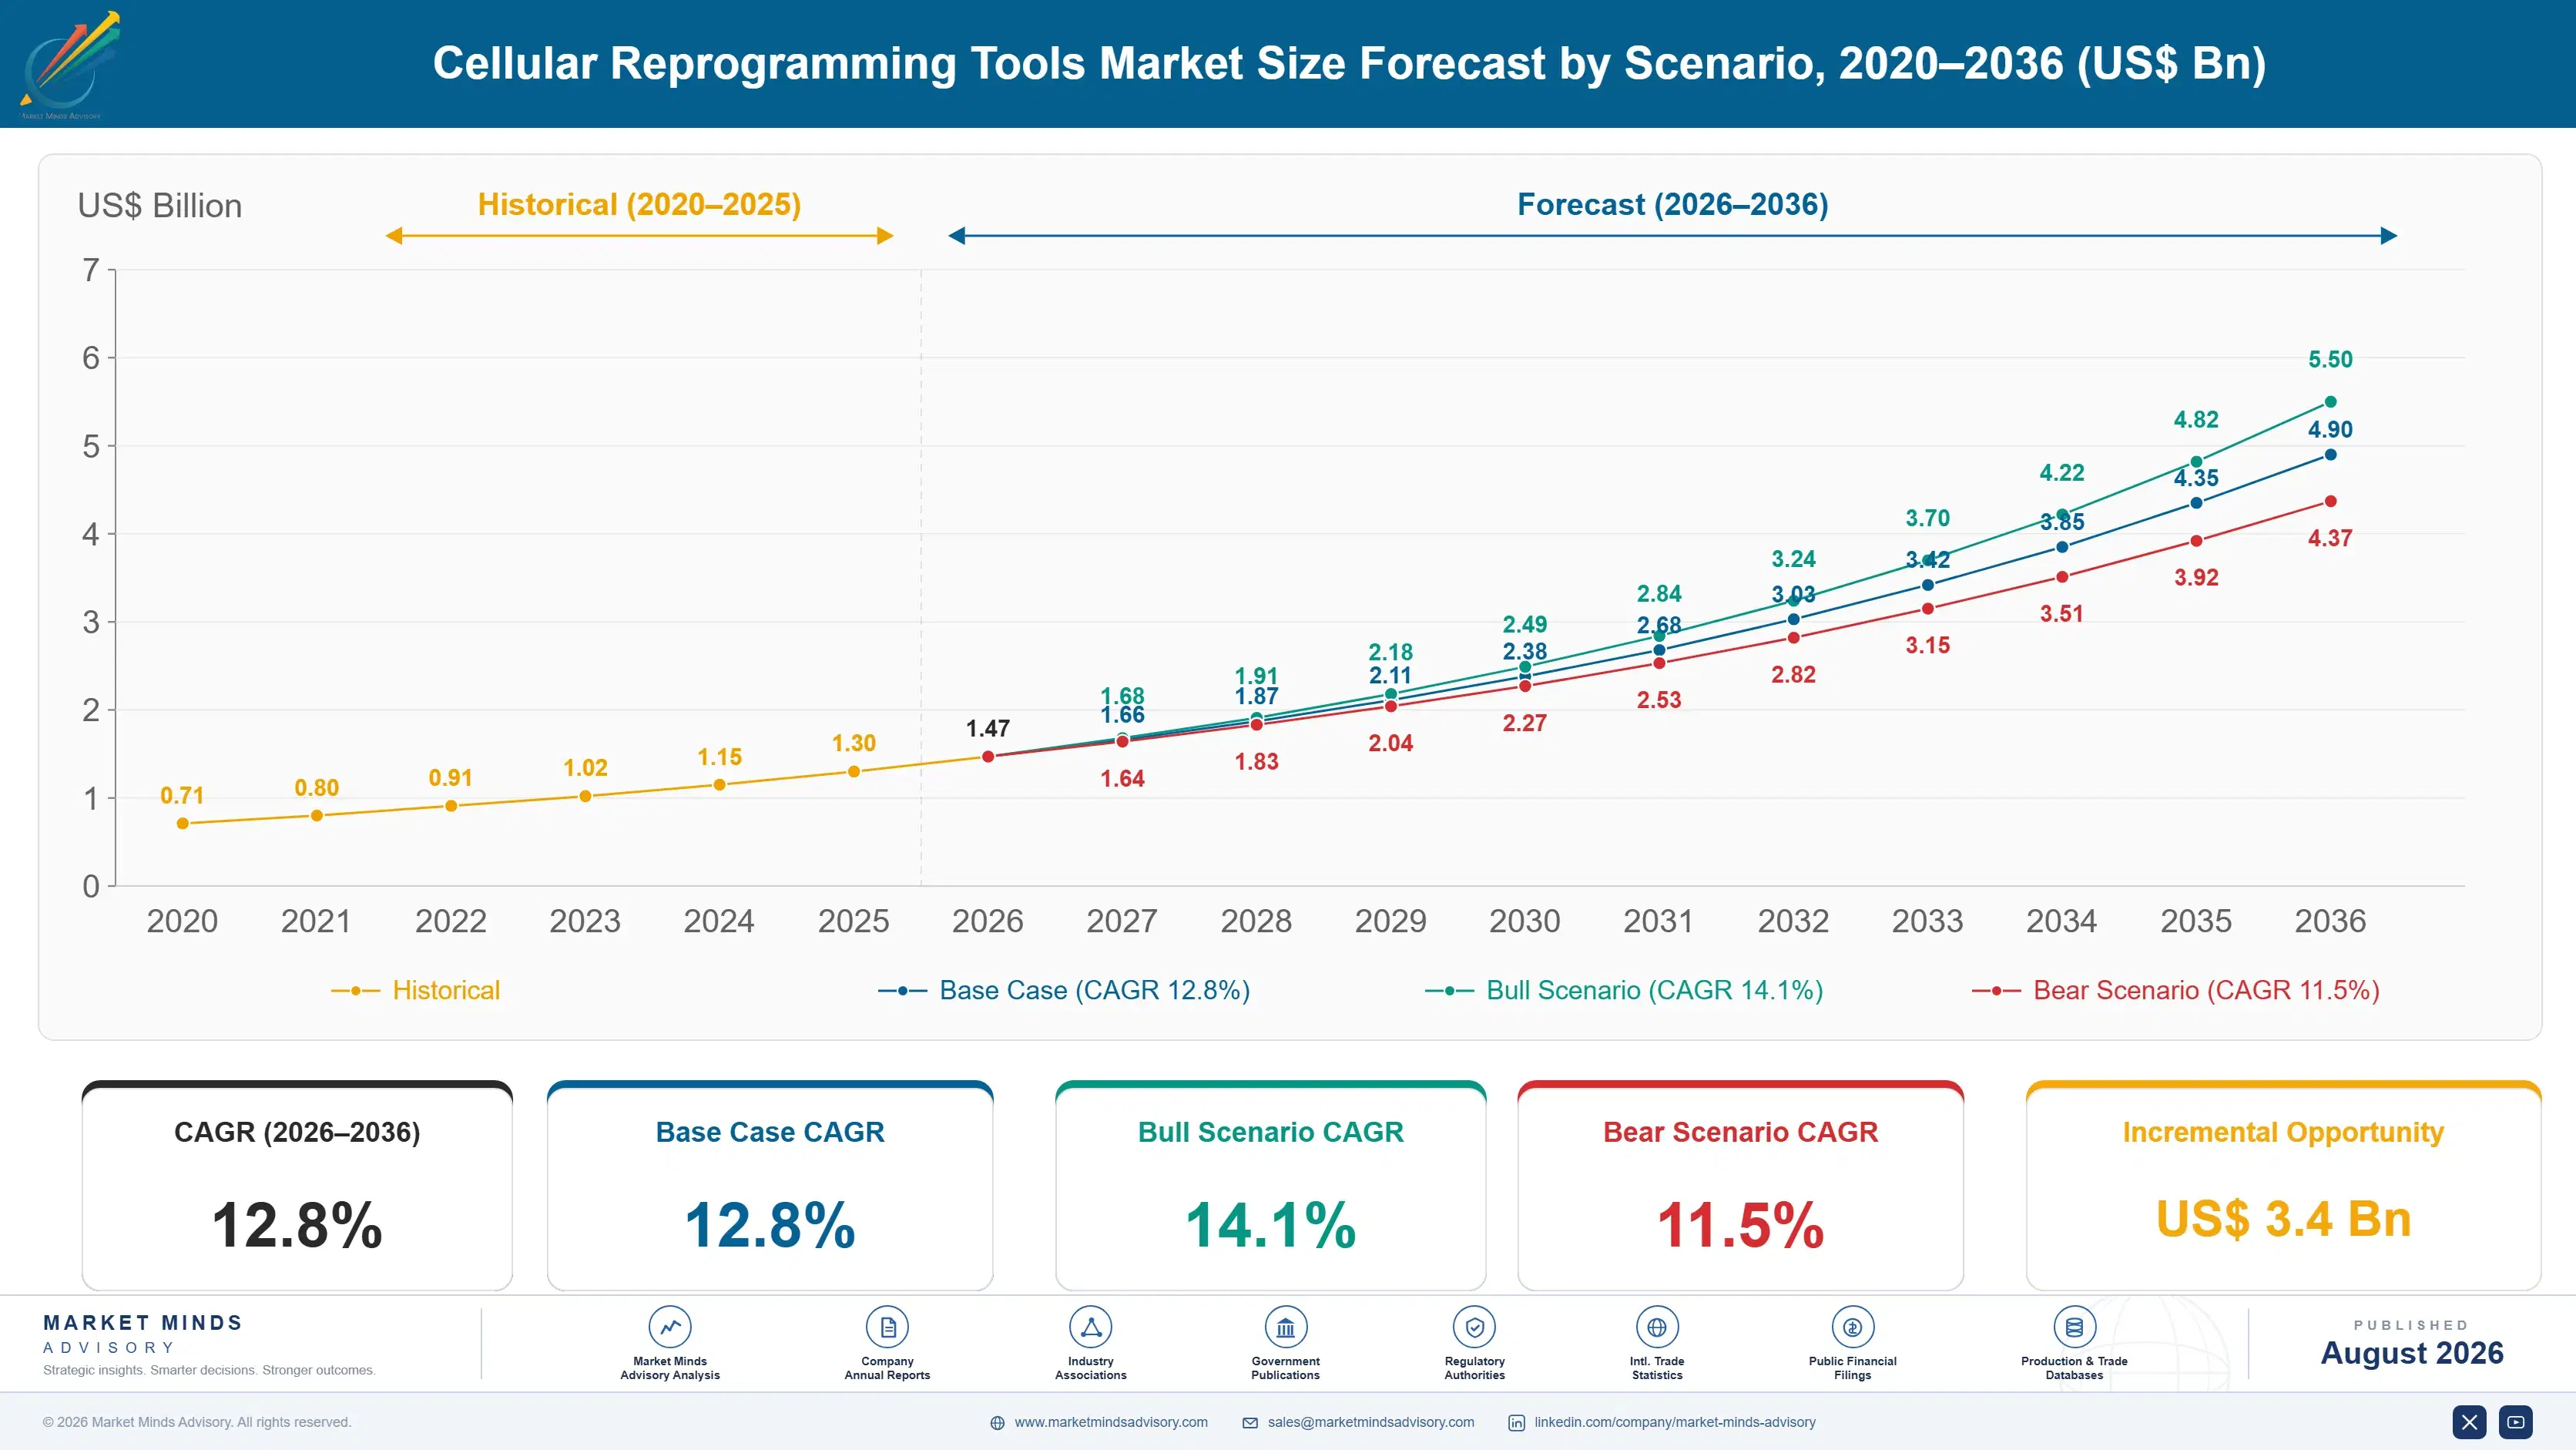
Growth ran near 11.4% from 2020 to 2025 as the field moved from academic curiosity toward manufacturing input. Integration-free vector methods displaced retroviral approaches almost entirely, removing a genomic safety objection that had blocked clinical translation. Allogeneic cell therapy programmes derived from induced pluripotent lines advanced into trials, which converted demand from per-experiment reagent purchases into sustained clinical-grade manufacturing campaigns for the first time.
Base case growth of 12.8% rests on three mechanisms. Clinical-grade line generation and banking expands as allogeneic programmes progress, and each of those lines costs roughly eighteen times a research equivalent. Automation adoption accelerates because manual handling cannot satisfy manufacturing inspection at scale. And characterisation demand grows faster than reprogramming itself, since genomic integrity monitoring is required repeatedly throughout culture rather than once at derivation. None of the three depends on the others arriving first.
The bull case at 14.1% assumes an induced pluripotent derived allogeneic therapy reaches approval, which would convert a research tools market into a manufacturing supply chain with entirely different volumes. The bear case at 11.5% is clinical disappointment: allogeneic programmes encounter persistent immune rejection or tumourigenicity concerns, funding contracts sharply, and demand reverts to academic research purchasing at far smaller scale.

Reprogramming Tools: Inefficiency, Grade and Scale

The defining technical fact here has not changed since the method was published. Reprogramming succeeds in roughly 0.02% of treated cells, meaning the overwhelming majority simply fail to convert, and nearly two decades of vector engineering, small molecule cocktails and media optimisation have improved that figure only marginally. The tools industry accordingly sells efficiency management rather than efficiency itself.
TOP FIVE CONCENTRATION58%Concentrated across broad catalogue suppliers and specialist media houses
REPROGRAMMING EFFICIENCY RATE0.02%Treated somatic cells that successfully reach a pluripotent state
RESEARCH LINE GENERATION COSTUSD 32,000Typical cost of deriving and characterising a research grade line
CLINICAL GRADE LINE COSTUSD 580,000Manufacturing grade line with full traceability and release testing
LINE GENERATION TIMELINE5 monthsTypical interval from donor sample to fully characterised working line
MEDIA CONSUMABLE SHARE44%Proportion of recurring consumable spend represented by culture media
The commercially important split is not between technologies but between grades. A research line costs around USD 32,000 and five months to derive and characterise. A clinical-grade equivalent, with documented donor consent, full chain of custody, animal-component-free reagents and complete release testing, costs roughly USD 580,000. The biology is identical. The eighteenfold difference is documentation, traceability and quality systems, which is where suppliers with manufacturing credentials earn their position.
That grade distinction is now driving the category, because allogeneic cell therapy changes the arithmetic entirely. One master line can in principle supply doses for thousands of patients, which turns a per-experiment reagent purchase into a manufacturing campaign with volumes no research market ever generated. Whether that thesis holds depends on clinical results nobody yet has, and the tools industry is investing against it regardless.
"Two cells in ten thousand reprogram, and everybody has quietly stopped trying to fix that. The industry decided it was cheaper to automate around the inefficiency than to solve it, which tells you something about how hard the underlying biology actually is."
Principal Analyst, Cell Therapy Tools and Bioprocessing Practice · MMA Healthcar

Market Trends

Automation replaces manual handling under manufacturing inspection

Open manual culture cannot satisfy manufacturing inspection at clinical scale and cannot reproduce results reliably between operators, which becomes a genuine problem the moment a line is intended for a patient rather than a paper. Closed automated platforms handling reprogramming, colony selection and expansion address both objections at once. The segment compounds at 19.2%, and its adoption is driven by quality systems requirements rather than by any throughput argument that laboratory managers would make on their own. Instrument sales are lumpy while closed consumables recur with every campaign, so architecture decided at design stage determines a placement's eventual value.
Market Impact: One line serving 1000s of doses
Clinical grade generation commands an eighteenfold cost premium

A research line costs roughly USD 32,000 to derive while a manufacturing grade equivalent costs about USD 580,000, and the biology behind both is identical. Documented donor consent, chain of custody, animal-component-free reagents, sterility and release testing account for essentially the whole difference. That premium has pulled suppliers toward manufacturing credentials rather than catalogue breadth, and it favours organisations with quality systems experience over those with the strongest reagent science. Several reagent companies acquired credentialed suppliers rather than build inspection history internally, which indicates how difficult that has proved. Research positions convert poorly.
Market Impact: Japan compounding at 20.4% annually

Market Opportunities and Growth Drivers

Allogeneic cell therapy converts research demand into manufacturing supply

A single induced pluripotent master line can in principle supply therapeutic doses for thousands of patients, which is the argument that moved this field from academic tool to industrial input. Programmes in oncology, ophthalmology, cardiology and neurology have all advanced into clinical study on that basis. Demand accordingly shifts from per-experiment reagent purchasing to sustained manufacturing campaigns, and campaign volumes exceed anything the research market generated by a considerable margin. Campaign volumes exceed anything academic purchasing ever generated, though they arrive episodically and disappear entirely when a trial pauses or a developer runs short of funding.
Market Impact: Efficiency stuck near 0.02%

Japanese infrastructure and regulation concentrate reprogramming activity

Japan compounds at 20.4%, faster than any other country, on infrastructure that no other nation built. A national stock programme derives lines from donors homozygous at key immune loci so that relatively few lines match a large share of the population, and a purpose-built regenerative medicine framework permits conditional approval on safety data with efficacy confirmed afterwards. That combination produced the deepest concentration of clinical reprogramming activity anywhere in the world. Other governments have studied that framework closely without replicating it, largely because conditional approval on safety data alone requires a regulatory risk appetite few possess.
Market Impact: Abnormalities in 12% of lines

Market Restraints and Challenges

Reprogramming efficiency has resisted twenty years of improvement

Only about 0.02% of treated somatic cells reach pluripotency, and vector engineering, small molecule cocktails and media optimisation have moved that figure very little across nearly two decades. The root cause is that reprogramming requires a stochastic sequence of epigenetic events that resists deterministic control. Commercial impact is high cost per line and long timelines. Participants manage rather than solve it, through improved selection, better survival chemistry and automation that absorbs the labour the inefficiency creates. The field has broadly accepted this rather than continuing to fight it. Selling a promised breakthrough here has repeatedly disappointed.
Market Impact: Compounding at 19.2% each year

Genomic instability accumulates through derivation and extended culture

Reprogramming itself and prolonged culture both introduce chromosomal abnormalities and point mutations, and lines that pass characterisation at derivation can acquire them later. The root cause is selective pressure favouring variants that grow faster in culture. Commercial impact is repeated characterisation cost throughout a line's working life rather than a single test at derivation. Participants respond with routine karyotyping, sequencing panels and passage limits written into manufacturing protocols and quality agreements. Characterisation demand therefore grows faster than reprogramming itself does, which suppliers pricing it as a derivation checkpoint consistently underestimate.
Market Impact: Premium reaching USD 580,000 per li
3 additional market trends, 4 additional growth drivers, and 2 additional restraints and challenges are covered in the full report. Contact sales@marketmindsadvisory.com to access the complete intelligence.

Segment CAGR and Growth Architecture

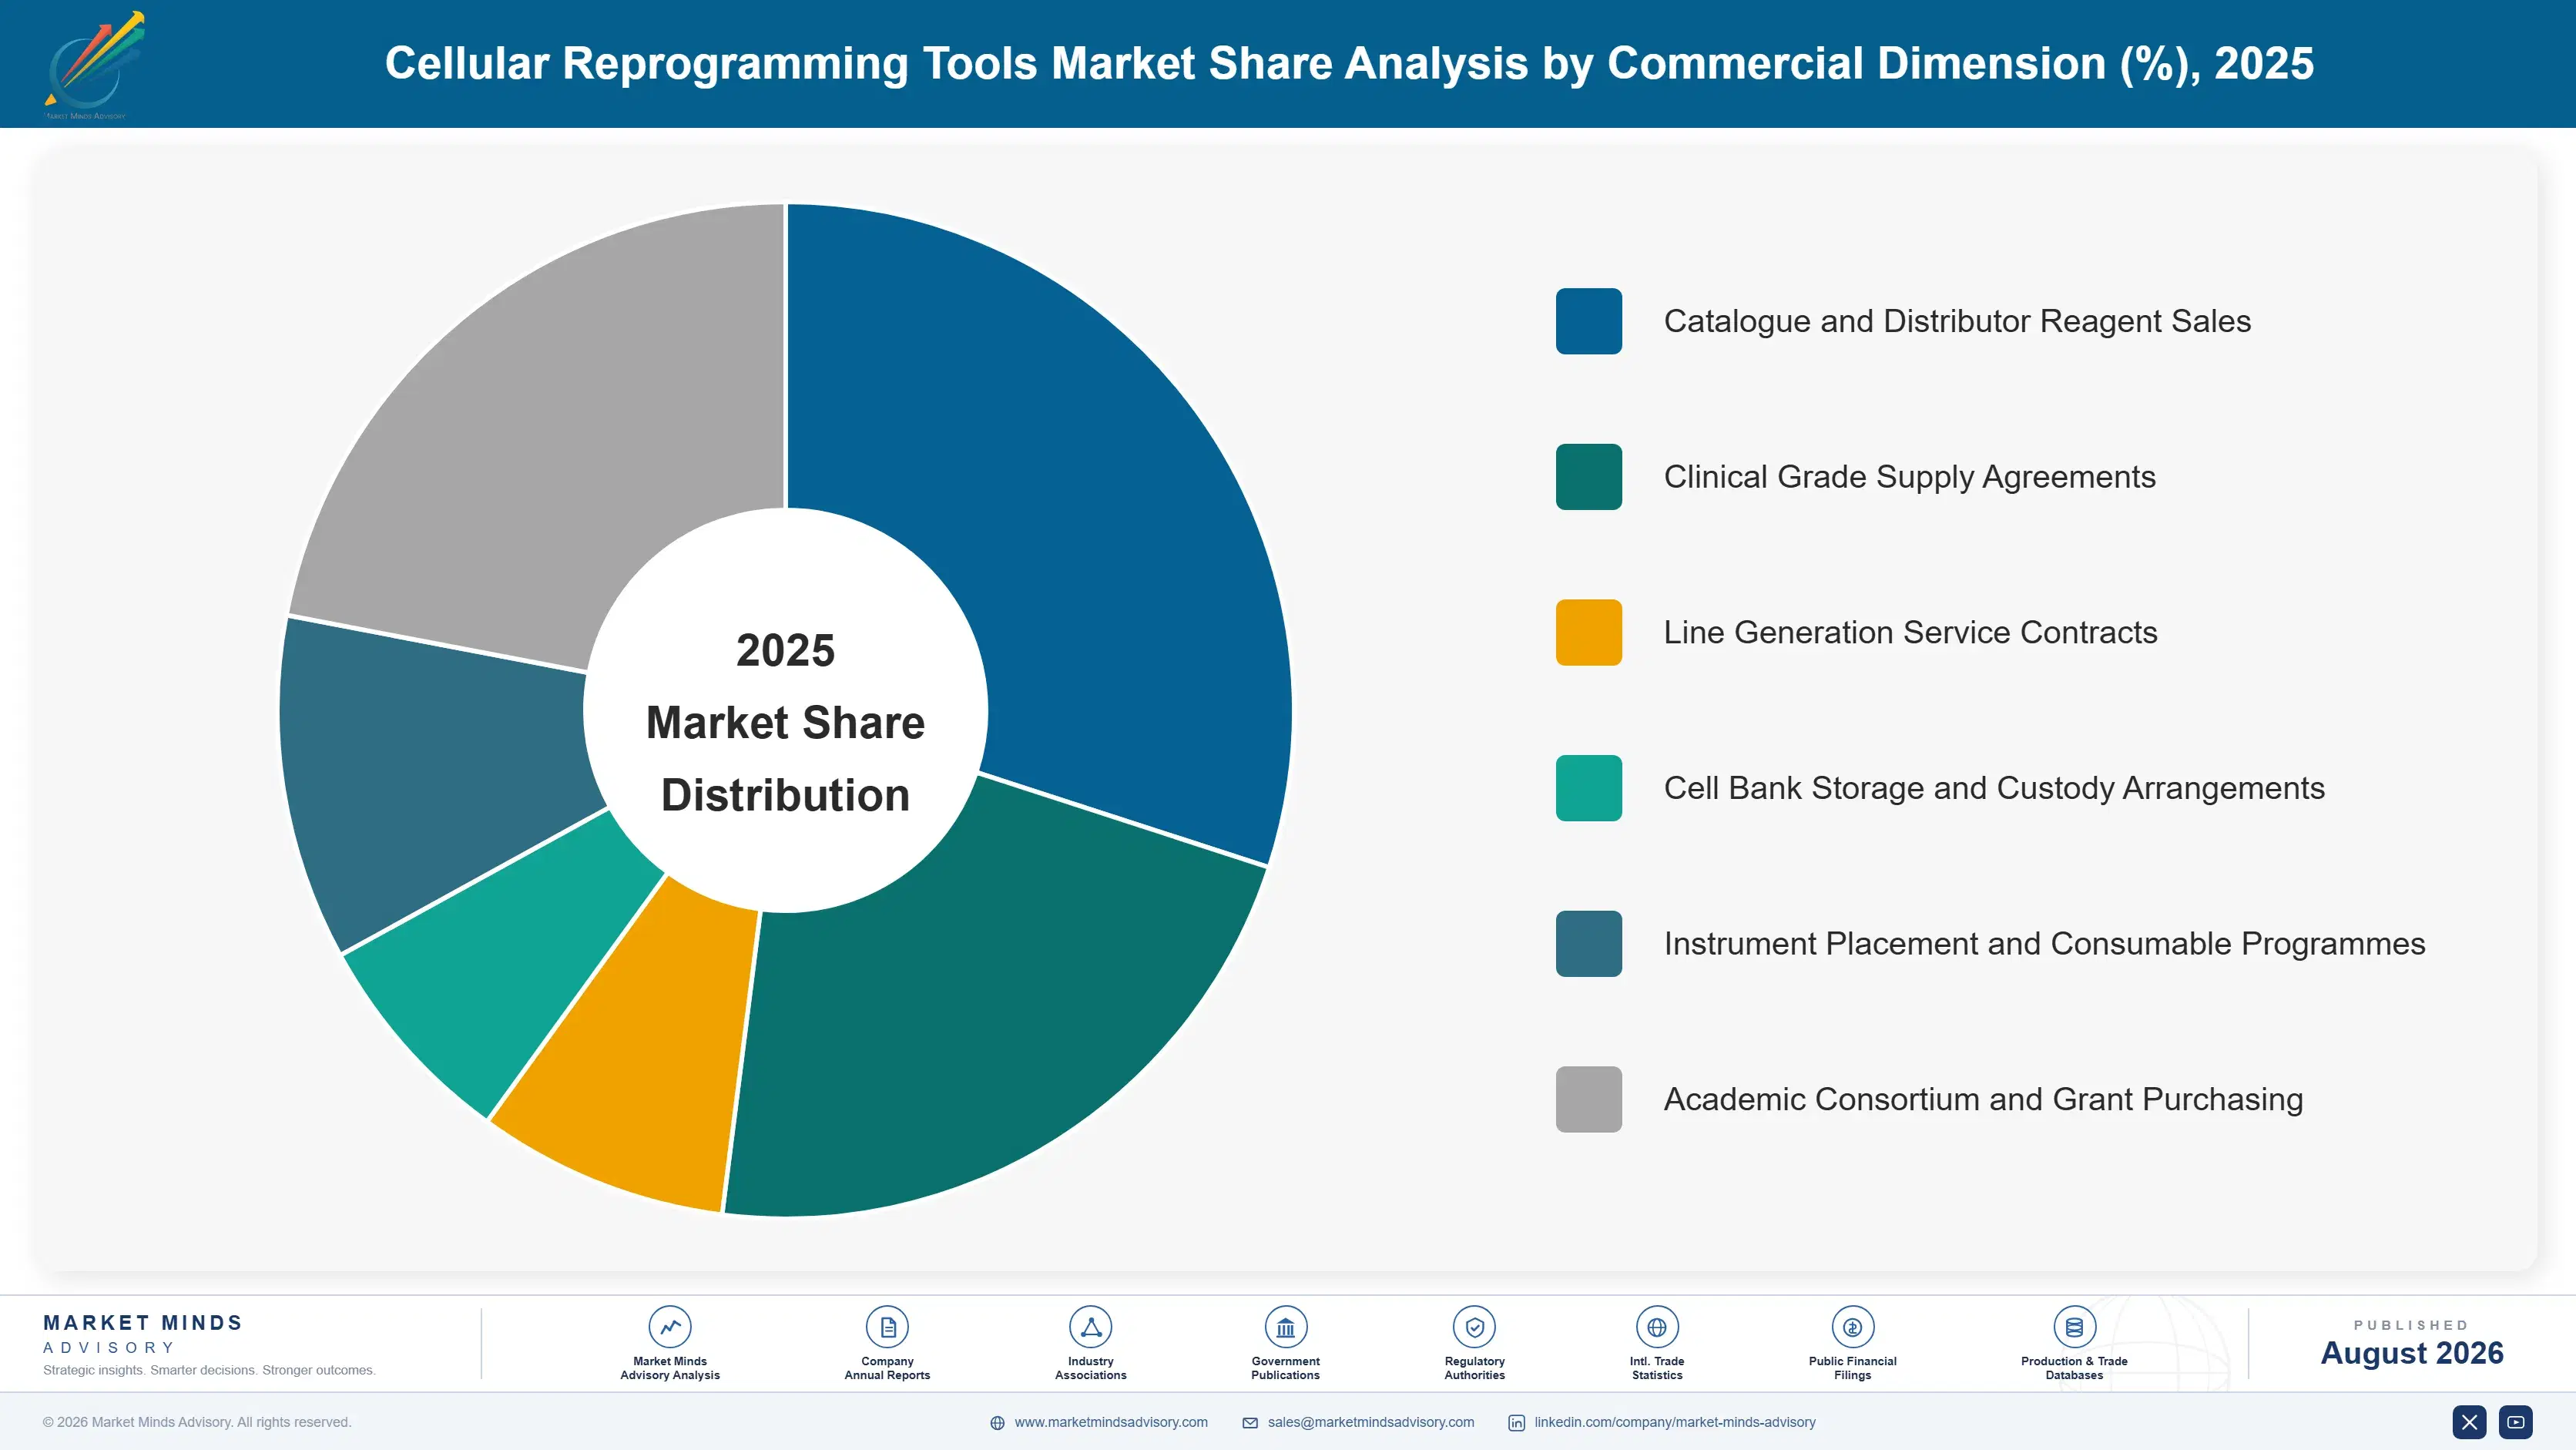
Segmentation follows product and service class, because class determines the manufacturing base, the regulatory grade achievable, the purchasing route and whether revenue recurs with every experiment or arrives once per line. Six classes cover reprogramming tool supply without overlap. Cell source and downstream application cut across every class at once and are treated here as use attributes.
cellular-reprogramming-tools-market-market-share-analysis-1787304868793

Automation Instruments and Consumables

Growing at 19.2%, a full 1.50x the market rate, closed automated platforms handle reprogramming, colony picking, expansion and passaging without open manual intervention, addressing two objections at once. Manual handling cannot satisfy manufacturing inspection at clinical scale, and it cannot reproduce results reliably between operators even in research settings. Adoption is therefore driven by quality systems requirements rather than by throughput arguments laboratory managers would otherwise make. Instrument sales are lumpy while the associated closed consumables recur with every run, and that consumable attach determines whether a placement becomes an annuity or a single transaction. Open systems accepting third-party consumables surrender that position permanently and irreversibly. Placement economics should be modelled on campaign consumption.
CAGR 19.2%

Line Generation and Banking Services

Outsourced line generation and banking grows at 16.4% because clinical-grade derivation requires quality systems, donor consent documentation and release testing that most therapeutic developers have no reason to build internally. A manufacturing grade line costs roughly USD 580,000 against USD 32,000 for a research equivalent, and almost the entire difference is process and documentation. Service providers holding regulatory inspection history and established donor recruitment pipelines carry advantages that reagent expertise alone cannot produce. Master and working cell bank storage then generates recurring revenue long after the derivation itself is complete. Contract development organisations have begun bundling derivation into broader manufacturing offers, which reduces the addressable opportunity for standalone providers considerably over the forecast period.
CAGR 16.4%
Full segment breakdown across 6 segments available in the complete report.

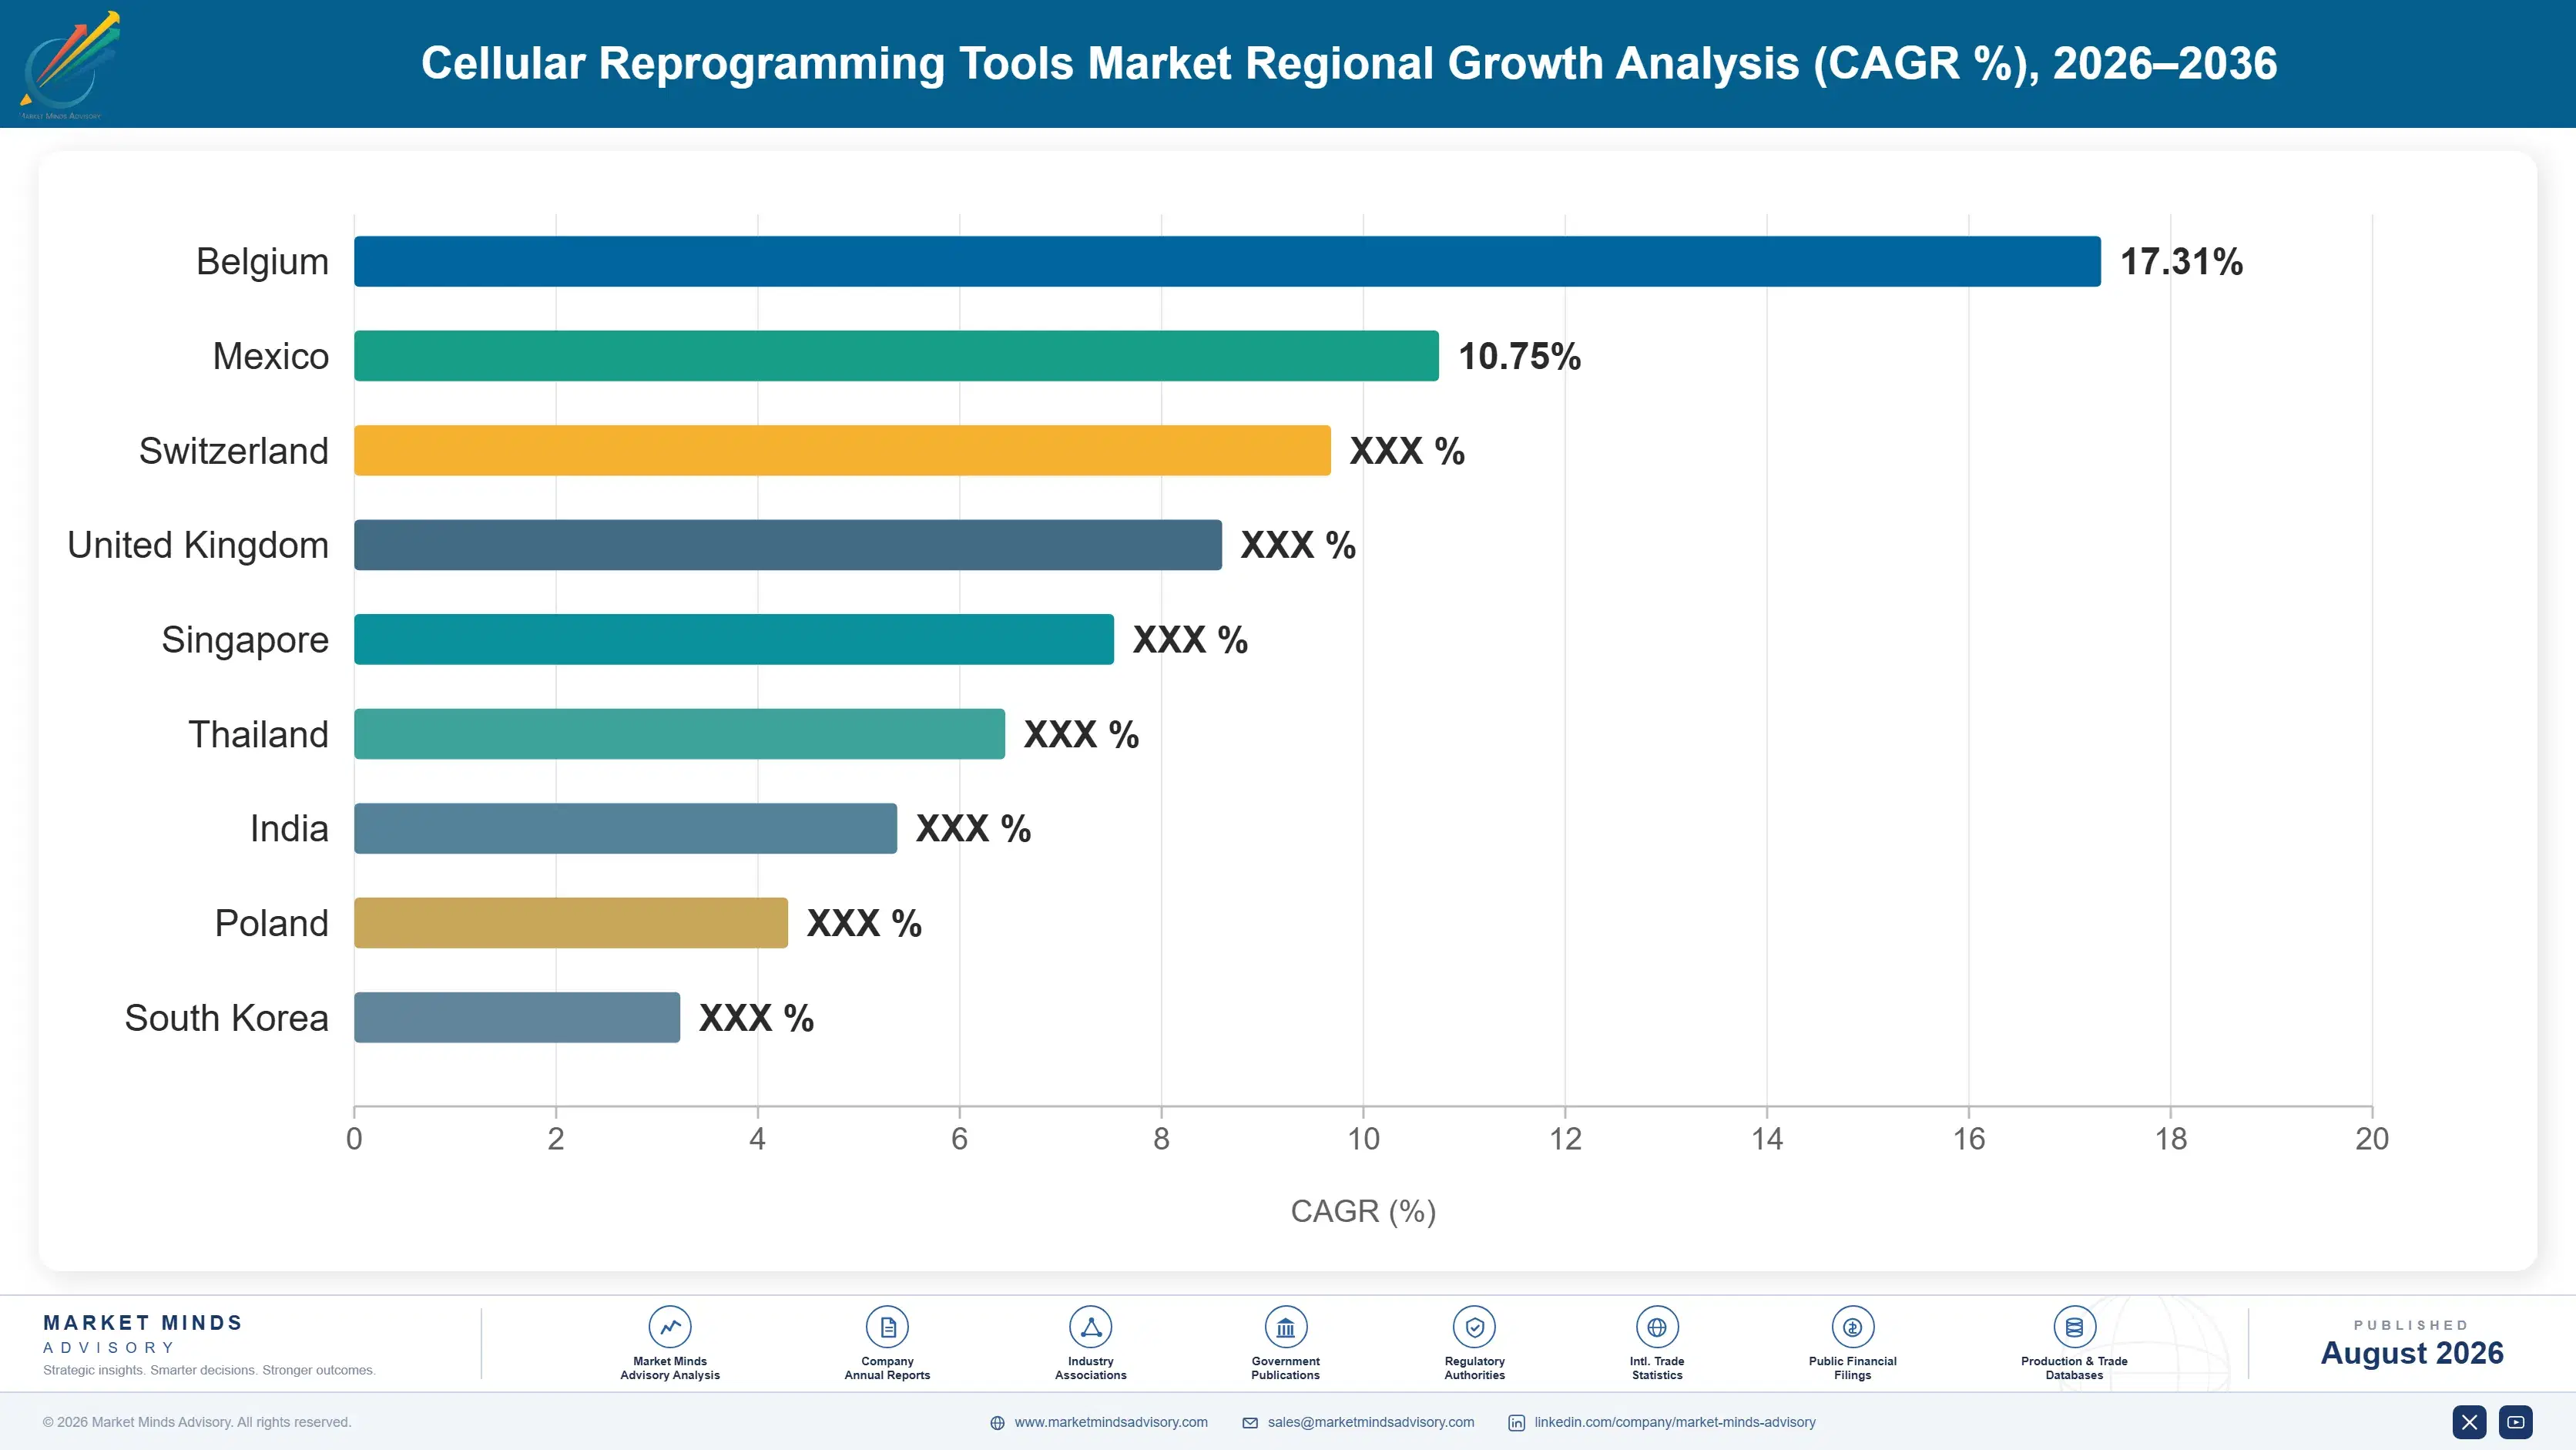
Regional Architecture and Country Demand Map

Regional value here follows clinical translation activity and research funding together, and Japan's position reflects deliberate national infrastructure investment rather than the size of its research base alone. Research base size alone would place this market somewhere quite different. Funding statistics mislead badly on where clinical activity actually sits.

East Asia

East Asia holds the largest share at 30%, led by Japan rather than by China. Japan compounds at 20.4% on infrastructure no other country built: a national stock programme deriving lines from donors homozygous at key immune loci so that relatively few lines match much of the population, and a regenerative medicine framework permitting conditional approval on safety data. Chinese cell therapy manufacturing capacity adds substantial volume at lower price points, with domestic reagent suppliers competing aggressively. South Korean investment in regenerative medicine has accelerated considerably over recent years. Regional clinical translation activity exceeds anywhere else relative to research base size. Domestic Chinese reagent suppliers compete aggressively on research grade pricing.
Share: 30% | CAGR: 14.0% (2026 to 2036)

North America

Twenty-eight per cent of value, growing at 12.0%. The largest concentration of clinical-stage allogeneic developers sits here, and their manufacturing grade demand carries far higher value per line than research purchasing does. Academic research volume remains substantial though federal funding growth has been uneven. Suppliers with manufacturing quality systems and regulatory inspection history hold clear advantages over catalogue-led competitors, and that distinction has driven several acquisitions as reagent companies bought the credentials rather than building them. Core facility managers have become the effective purchasing decision makers across many institutions, standardising reagents for multiple research groups at once rather than leaving choices to individual principal investigators. Academic protocol positions seed the clinical supply relationships that follow.
Share: 28% | CAGR: 12.0% (2026 to 2036)
Regional intelligence for 5 additional markets available in the complete report: Western Europe, South Asia and Pacific, Latin America, Middle East and Africa, Eastern Europe. Contact sales@marketmindsadvisory.com.
cellular-reprogramming-tools-market-country-cagr-analysis-1787304869312

Where Reprogramming Tool Margin Concentrates

Efficiency has resisted improvement for twenty years, so nobody is buying a breakthrough. Value accrues instead to whoever holds the quality credentials that clinical grade work demands, whose media a validated protocol depends upon, and whose closed consumables recur with every automated run. Reagent performance is not the variable customers actually compare. Credentials decide it instead.

Build manufacturing credentials rather than catalogue breadth

A clinical grade line costs roughly USD 580,000 against USD 32,000 for a research equivalent, and essentially the whole difference is documentation, donor consent, animal-component-free sourcing and release testing rather than biology. Suppliers holding quality systems and regulatory inspection history capture that premium, while catalogue-led competitors compete on reagent performance nobody is actually comparing. Several reagent companies have acquired the credentials rather than build them, which indicates how difficult building them internally has proved. Inspection history cannot be manufactured on any useful commercial timescale, which is why acquisition has repeatedly proved faster than building.
Market Impact: Premium reaching USD 580,000 for ev

Lock media into validated differentiation protocols early

Media represents roughly 44% of recurring consumable spend, and a laboratory that has validated a differentiation protocol on one formulation will not switch, because revalidation costs months of work and risks results that no longer compare with published data. Winning the formulation at protocol development stage therefore secures years of recurring revenue. Competing on price after a protocol is established almost never succeeds, which makes early technical support considerably more valuable than discounting later. Core facility managers standardising across many groups are increasingly the decisive audience. They standardise reagents across many groups at once.
Market Impact: Media covering 44% of the total con

Attach closed consumables to every automation placement

Automation compounds at 19.2% because quality systems require closed handling rather than because laboratories want throughput, and instrument sales are lumpy while the consumables they run on recur with every campaign. Closed architecture decided at design stage determines whether a placement becomes an annuity or a single transaction, and open systems accepting third-party consumables surrender that permanently. The decision cannot be revisited after installation, which makes it a product design question rather than a commercial one. Placement economics should therefore be modelled on campaign consumption rather than on instrument margin.
Market Impact: Automation segment now growing at 1

Sell characterisation as recurring rather than one-time testing

Genomic abnormalities appear in roughly 12% of lines during extended culture rather than only at derivation, because selective pressure favours variants growing faster. Karyotyping, sequencing panels and identity testing are therefore required repeatedly through a line's working life, and manufacturing protocols increasingly write passage-linked testing into quality agreements directly. Suppliers positioning characterisation as a derivation checkpoint are pricing a recurring requirement as a single event, and undercharging accordingly. Passage-linked testing is increasingly written directly into manufacturing quality agreements, which formalises the recurrence rather than leaving it to laboratory discretion. Pricing should follow that structure.
Market Impact: Abnormalities appearing across 12%

Who Controls the Margin Pool

Concentration is moderate at 58% across the top five, measured on annual revenue from reprogramming reagents, instruments, consumables and line generation services, the single basis applied throughout. Thermo Fisher Scientific and STEMCELL Technologies lead through quite different positions, one on catalogue breadth and an established vector franchise, the other on media formulations that laboratories have written into validated protocols worldwide.
Competition runs on three dimensions with limited overlap. Reagent competition turns on protocol lock-in, since a validated formulation is extraordinarily difficult to displace regardless of price or performance. Service competition turns on quality systems, regulatory inspection history and donor recruitment pipelines rather than on laboratory science. Automation competition is an early instrument placement contest where closed consumable architecture determines the eventual value of every unit installed.

Pressure builds from two directions. Chinese reagent suppliers compete on price against premium catalogue products, particularly in research grade work where protocol lock-in has not yet formed. Separately, contract development organisations are integrating line generation into broader cell therapy manufacturing offers, which threatens standalone service providers. Rankings shift most where a supplier converts research protocol positions into clinical grade supply as programmes advance toward manufacturing.
cellular-reprogramming-tools-market-company-positioning-matrix-1787304869843

Competitive Moat and Risk Dimensions

THERMO FISHER SCIENTIFIC

Moat: Catalogue breadth and vectors

An established integration-free vector franchise combined with reagent, media and characterisation catalogue depth lets Thermo Fisher supply an entire workflow from a single validated source, which laboratories value more than the performance of any individual component. Manufacturing quality systems and inspection history across the wider business support clinical grade supply that pure reagent competitors cannot readily match.
THERMO FISHER SCIENTIFIC

Risk: Protocol lock by competitors

Media formulations from specialist competitors are written into validated differentiation protocols across a great many laboratories, and those positions resist displacement regardless of catalogue breadth or pricing. Chinese suppliers compete effectively in research grade reagents where lock-in has not formed. Automation platforms from focused entrants are establishing closed consumable positions early.
STEMCELL TECHNOLOGIES

Moat: Media formulation protocol authority

Media formulations embedded in published differentiation protocols worldwide give STEMCELL a position that revalidation cost protects far more effectively than any patent could, since a laboratory changing medium risks results that no longer compare with the literature. Deep technical support at protocol development stage keeps winning new formulations into the next generation of published methods.
STEMCELL TECHNOLOGIES

Risk: Clinical grade credential gap

Manufacturing grade supply demands quality systems, regulatory inspection history and animal-component-free sourcing at a scale that reagent-focused organisations find genuinely difficult to build. Larger competitors hold those credentials through unrelated businesses. Research grade positions do not automatically convert into clinical supply as customer programmes advance toward manufacturing.

Players Tracked

Prominent Players

Thermo Fisher Scientific
STEMCELL Technologies
Merck KGaA
Lonza
Fujifilm Cellular Dynamics

Other Key Players

Sartorius
Bio-Techne
Takara Bio
Corning
Miltenyi Biotec
Charles River Laboratories
Ncardia
Axol Bioscience
Cellino Biotech
BICO Group
Repligen
PromoCell
Sumitomo Pharma
Healios
Cellular Origins

Recent Developments

FEBRUARY 2025

Closed automated platforms enter clinical grade line derivation

Automated closed platforms handling reprogramming, colony selection and expansion moved into clinical grade derivation work at several manufacturing sites, addressing inspection requirements that open manual culture had never been able to satisfy at scale. Operator variability had been a persistent obstacle in manual workflows. Adoption followed inspection requirements.
Signal: Quality systems rather than any throughput
JULY 2025

Japanese haplobank programme extends population matching coverage

Japan's national induced pluripotent stem cell stock programme extended its bank of lines derived from donors homozygous at key immune loci, an organic public infrastructure expansion widening the share of the population that a small number of lines can match immunologically. No other country has replicated the approach.
Signal: One country built the public infrastructur
DECEMBER 2025

Contract organisations integrate line generation into manufacturing offers

Contract development and manufacturing organisations bundled induced pluripotent line generation into broader cell therapy manufacturing services, an organic commercial extension that reduced the addressable opportunity for standalone line generation service providers considerably. Standalone providers face absorption into the manufacturing chains they had been feeding independently.
Signal: Standalone derivation services now face ou

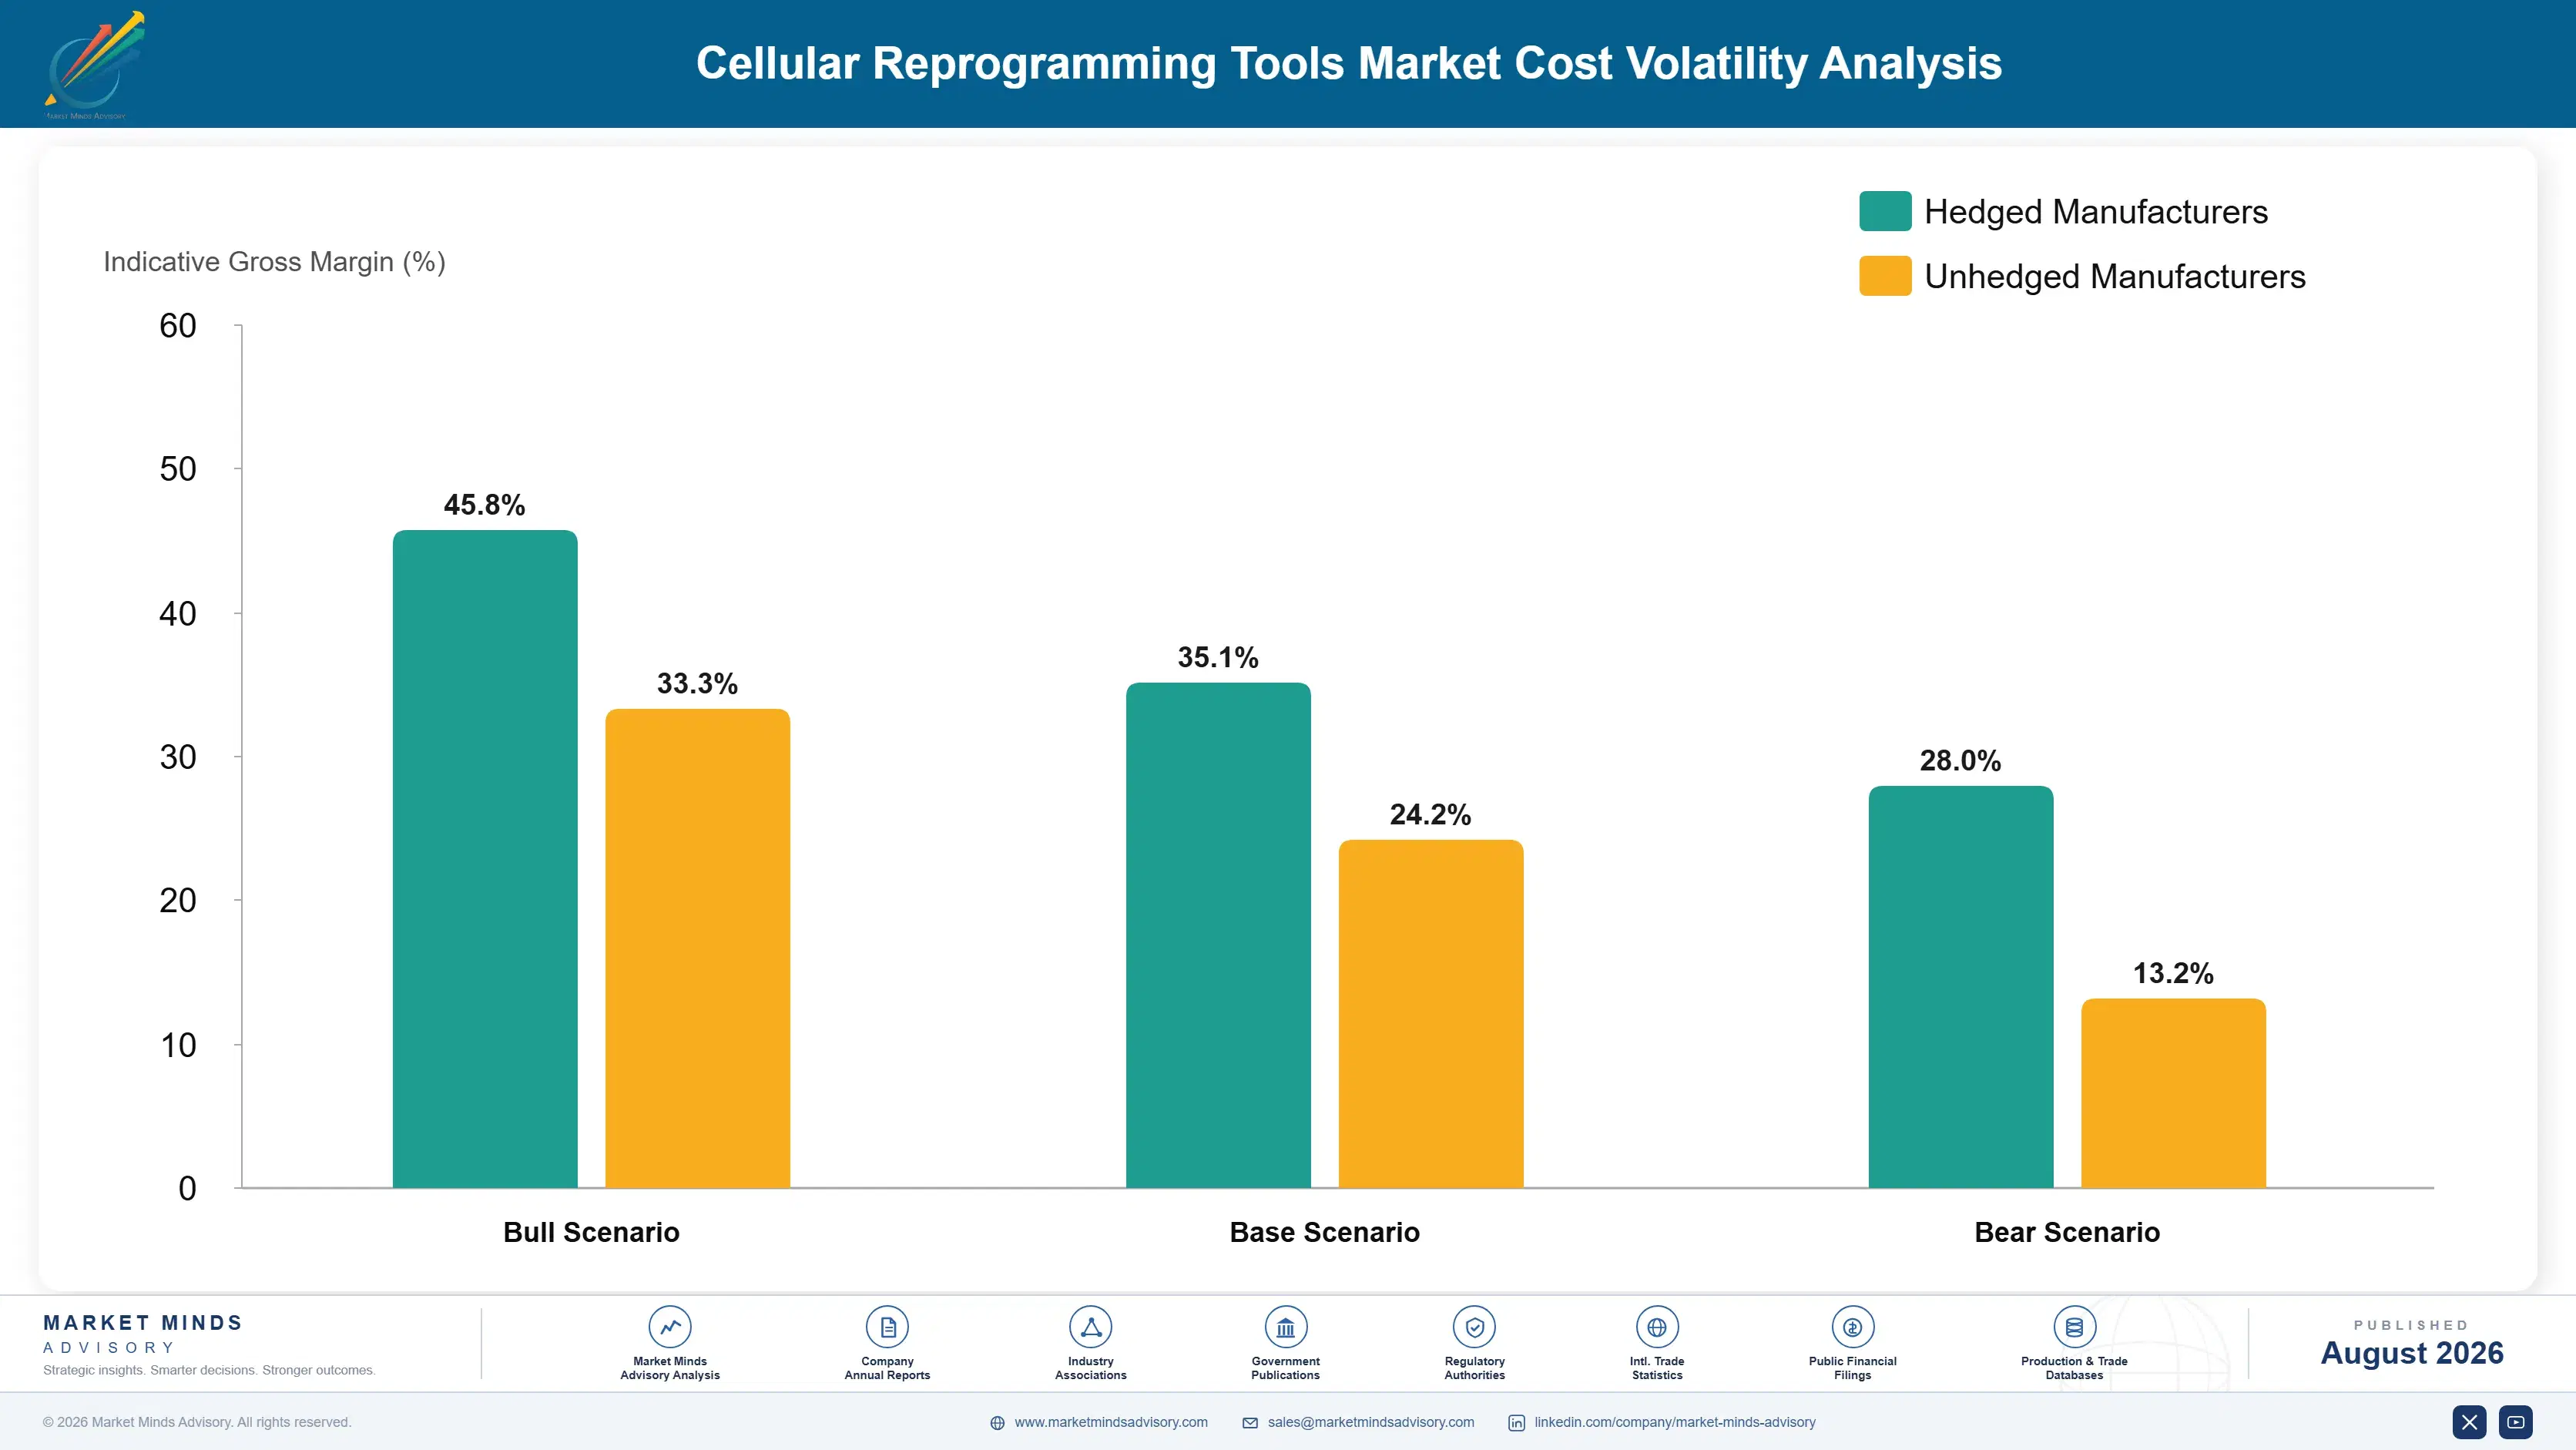
Growth Factor, Serum and Quality System Costs

Recombinant growth factors dominate reagent economics here. Basic fibroblast growth factor, transforming growth factor beta and related proteins account for roughly 47% of media cost of goods, produced through microbial and mammalian expression systems concentrated among a small number of specialist manufacturers. Substrate proteins including recombinant laminin and vitronectin carry comparable cost intensity. Quality system overhead sits outside cost of goods entirely and frequently exceeds it
Recombinant protein and single-use bioprocessing consumable supply tightened materially through 2021 and 2022 as vaccine and biologic manufacturing absorbed capacity that research reagent applications normally rely upon. Supplier annual reports across the period documented extended lead times and allocation decisions that favoured therapeutic over research customers. Several producers subsequently invested in dedicated expression capacity to avoid competing for the same fermentation slots again. Therapeutic customers were favoured throughout.

Exposure varies by grade rather than scale. Research grade suppliers face ordinary input cost movement, while clinical grade producers carry animal-component-free sourcing requirements, full traceability documentation and release testing that together cost multiples of the underlying materials. Geography compounds it: Chinese recombinant protein producers supply research grade reagents at prices Western manufacturers cannot approach, while clinical grade credentials remain concentrated elsewhere.
cellular-reprogramming-tools-market-cost-volatility-analysis-1787304870156

Secure dedicated recombinant protein expression capacity

Growth factors at roughly 47% of media cost of goods come from specialist expression capacity that therapeutic manufacturing outbids research applications for whenever demand tightens. Dedicated or contracted capacity removes that competition entirely, and several suppliers invested in exactly this after recent allocation experience. The capital requirement is modest relative to the revenue a supply interruption would put at risk.

Qualify animal-component-free sourcing before clinical demand arrives

Clinical grade supply requires animal-component-free reagents with full traceability, and converting an established research formulation afterwards means revalidating every downstream protocol that depends on it. Building the sourcing at formulation stage costs qualification work rather than reformulation, and it lets a research position convert into clinical supply as customer programmes advance rather than losing it.

Design characterisation panels for repeated rather than single use

Genomic abnormalities accumulate through extended culture, so karyotyping and sequencing are required repeatedly across a line's working life rather than once at derivation. Panels and pricing structured around recurring passage-linked testing match how the requirement actually arises. Suppliers treating characterisation as a one-time derivation checkpoint consistently underprice a recurring quality obligation. Manufacturing quality agreements increasingly formalise that schedule directly.

Portfolio Architecture for Margin Defence

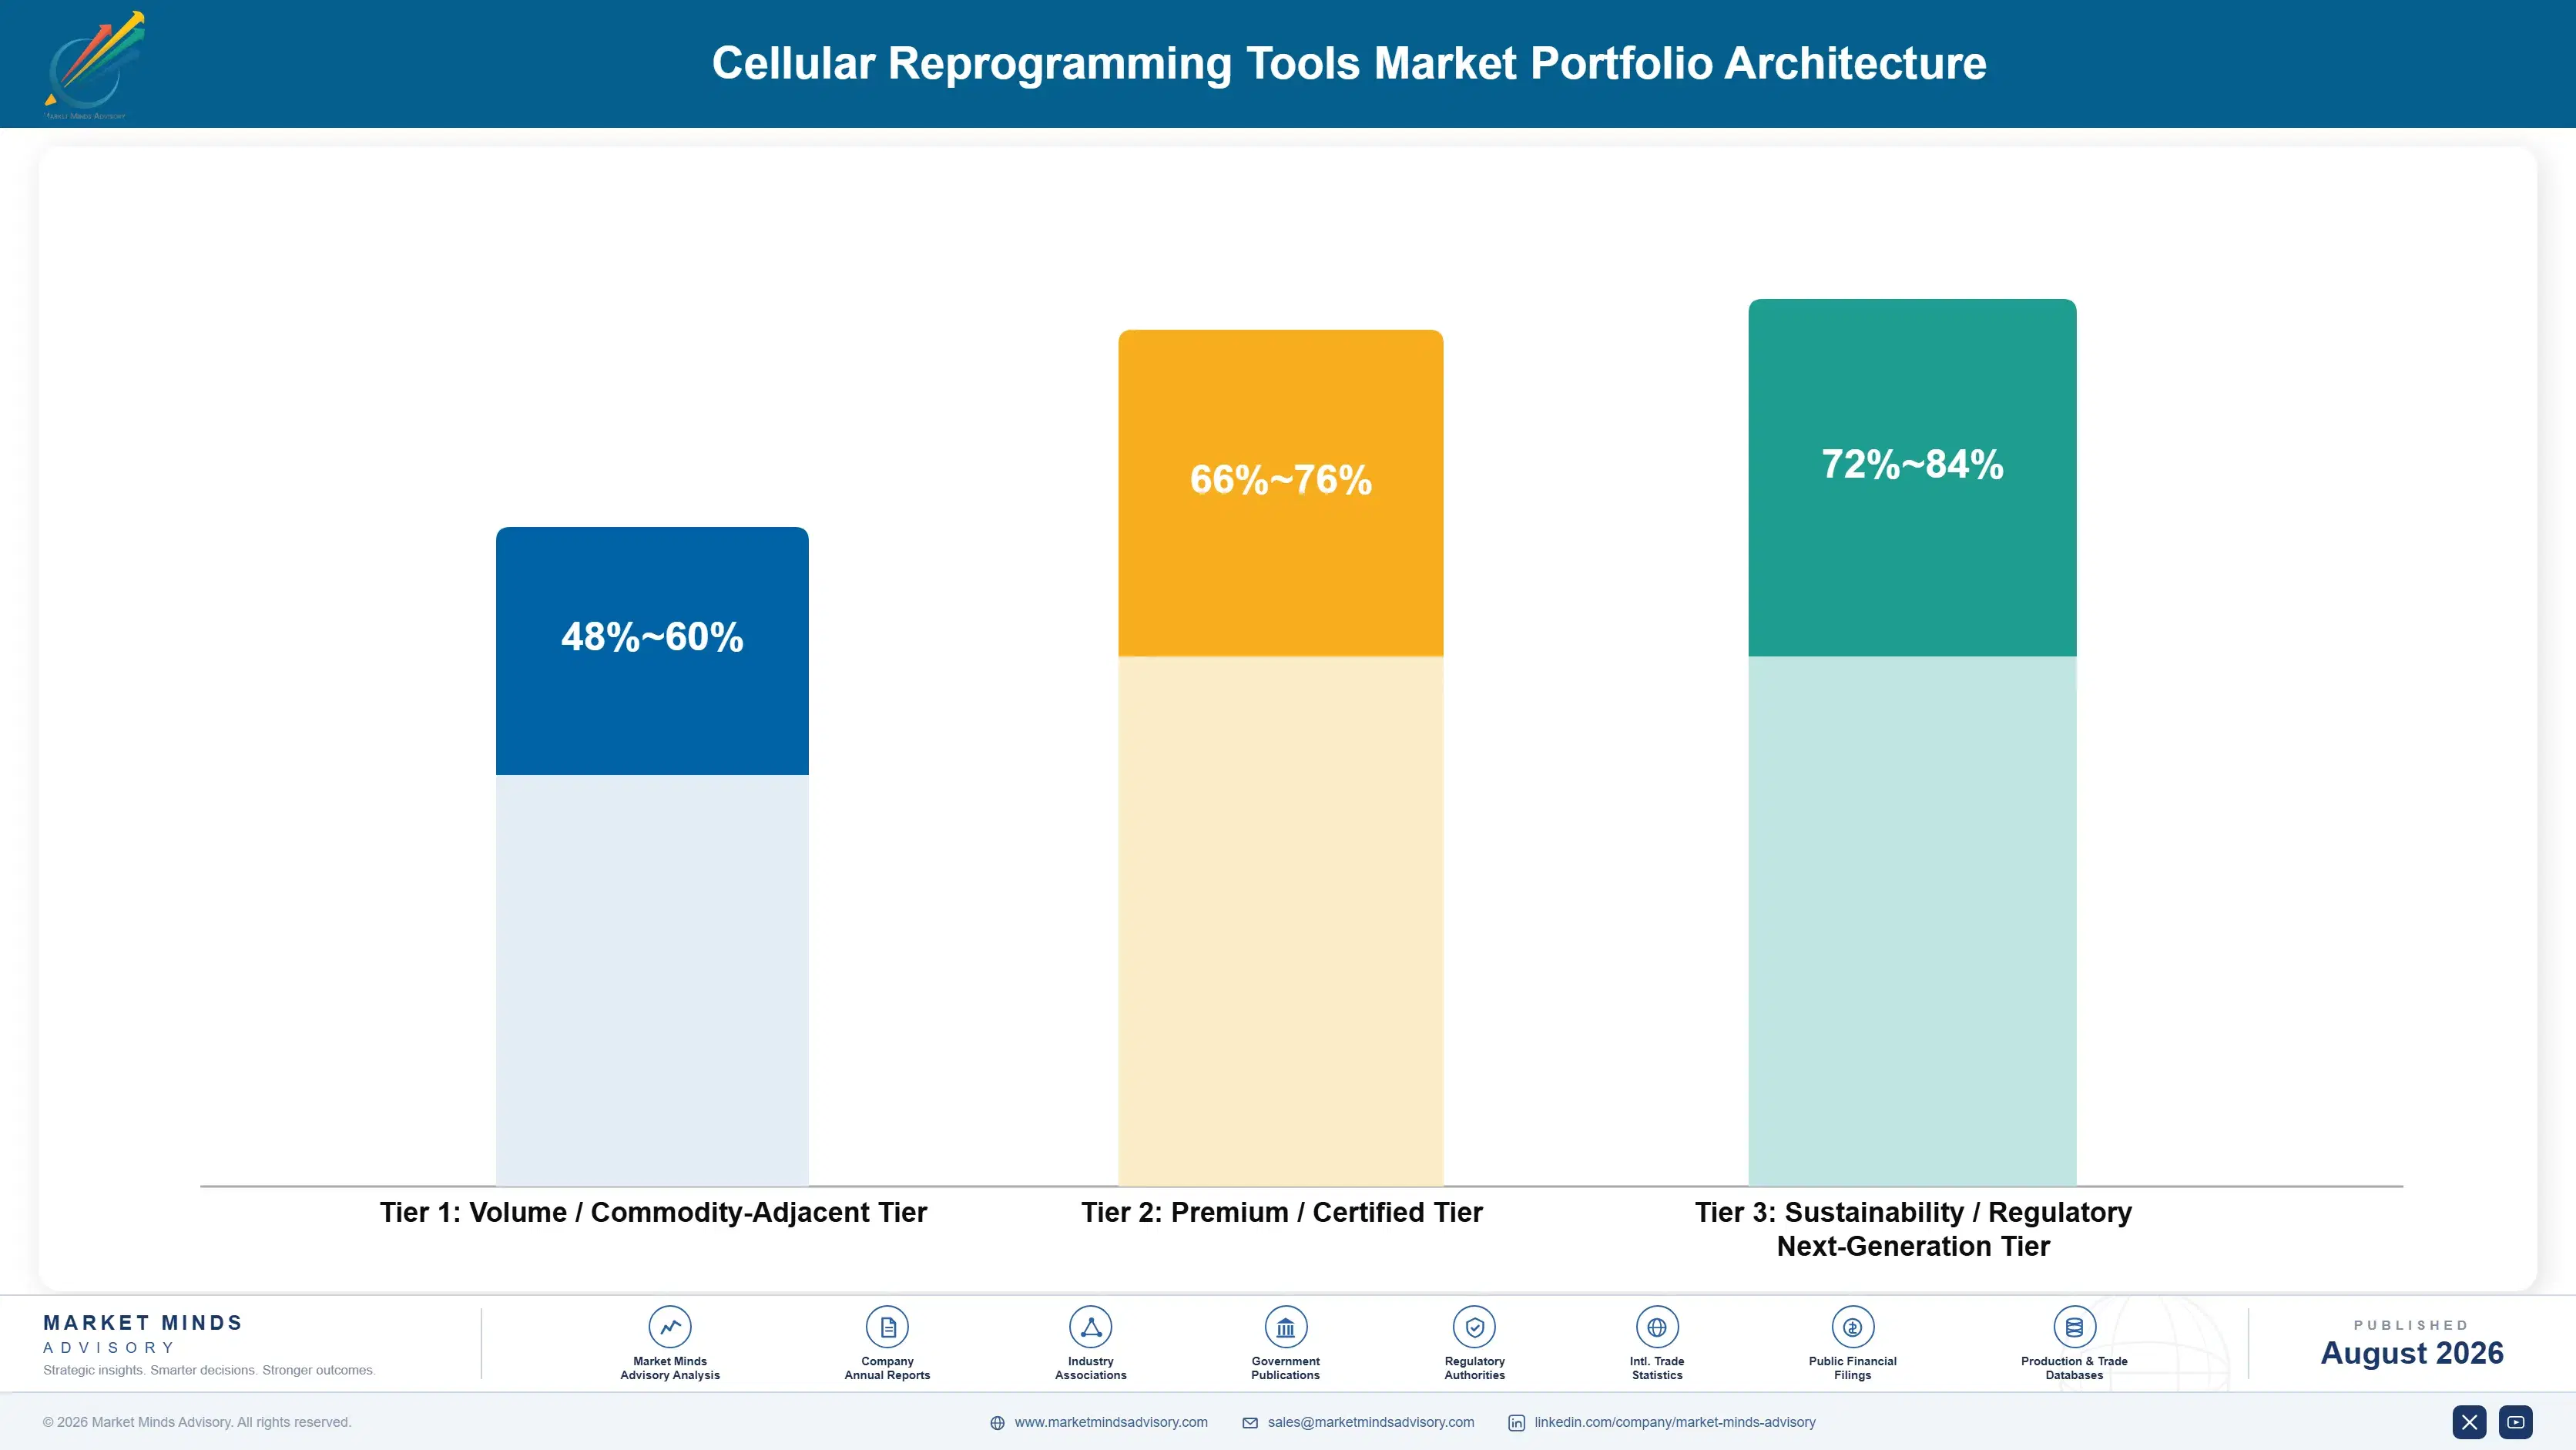
Margin architecture separates on grade and on lock-in rather than on technology. Research grade reagents sold through catalogues and distributors compete against Chinese suppliers on price wherever a protocol has not yet formed around a specific formulation. Media written into validated protocols earn considerably better, protected by revalidation cost rather than by any patent. Clinical grade supply and services earn best, because the quality credentials behind them take years to establish.
The volume against premium tension runs along the research and clinical divide. Academic purchasing generates steady catalogue volume at modest prices across thousands of laboratories, and it seeds the protocol positions that later become valuable. Clinical grade manufacturing generates far higher value from a small number of programmes whose survival depends on trial outcomes nobody controls. Serving only one side leaves a supplier either without growth or without a foundation.

High-value pools concentrate around credentials and recurrence. Clinical grade line generation and banking, closed automation consumables, protocol-locked media and passage-linked characterisation testing all command pricing that catalogue reagents do not. Research grade reagents without protocol positions, whatever their technical merit, compete against suppliers with cost structures that Western manufacturers have no realistic route to matching.

Volume / Commodity-Adjacent Tier

Research grade reagents, basic substrates and general consumables sold through catalogues and distributors, competing on price against Chinese suppliers wherever no validated protocol position has yet formed around a formulation.
Gross Margin: 48-60%

Premium / Certified Tier

Media and reagents embedded in validated differentiation protocols, protected by revalidation cost and comparability with published literature rather than by patents, which laboratories will not readily jeopardise. Technical support at protocol stage wins these positions.
Gross Margin: 66-76%

Sustainability / Regulatory / Next-Generation Tier

Clinical grade line generation, banking services and closed automation consumables, commanding premium because quality systems, inspection history and donor pipelines take years rather than months to establish. Several suppliers acquired those credentials rather than build them.
Gross Margin: 72-84%
cellular-reprogramming-tools-market-portfolio-architecture-1787304870961

Protocol Lock and Campaign Consumption

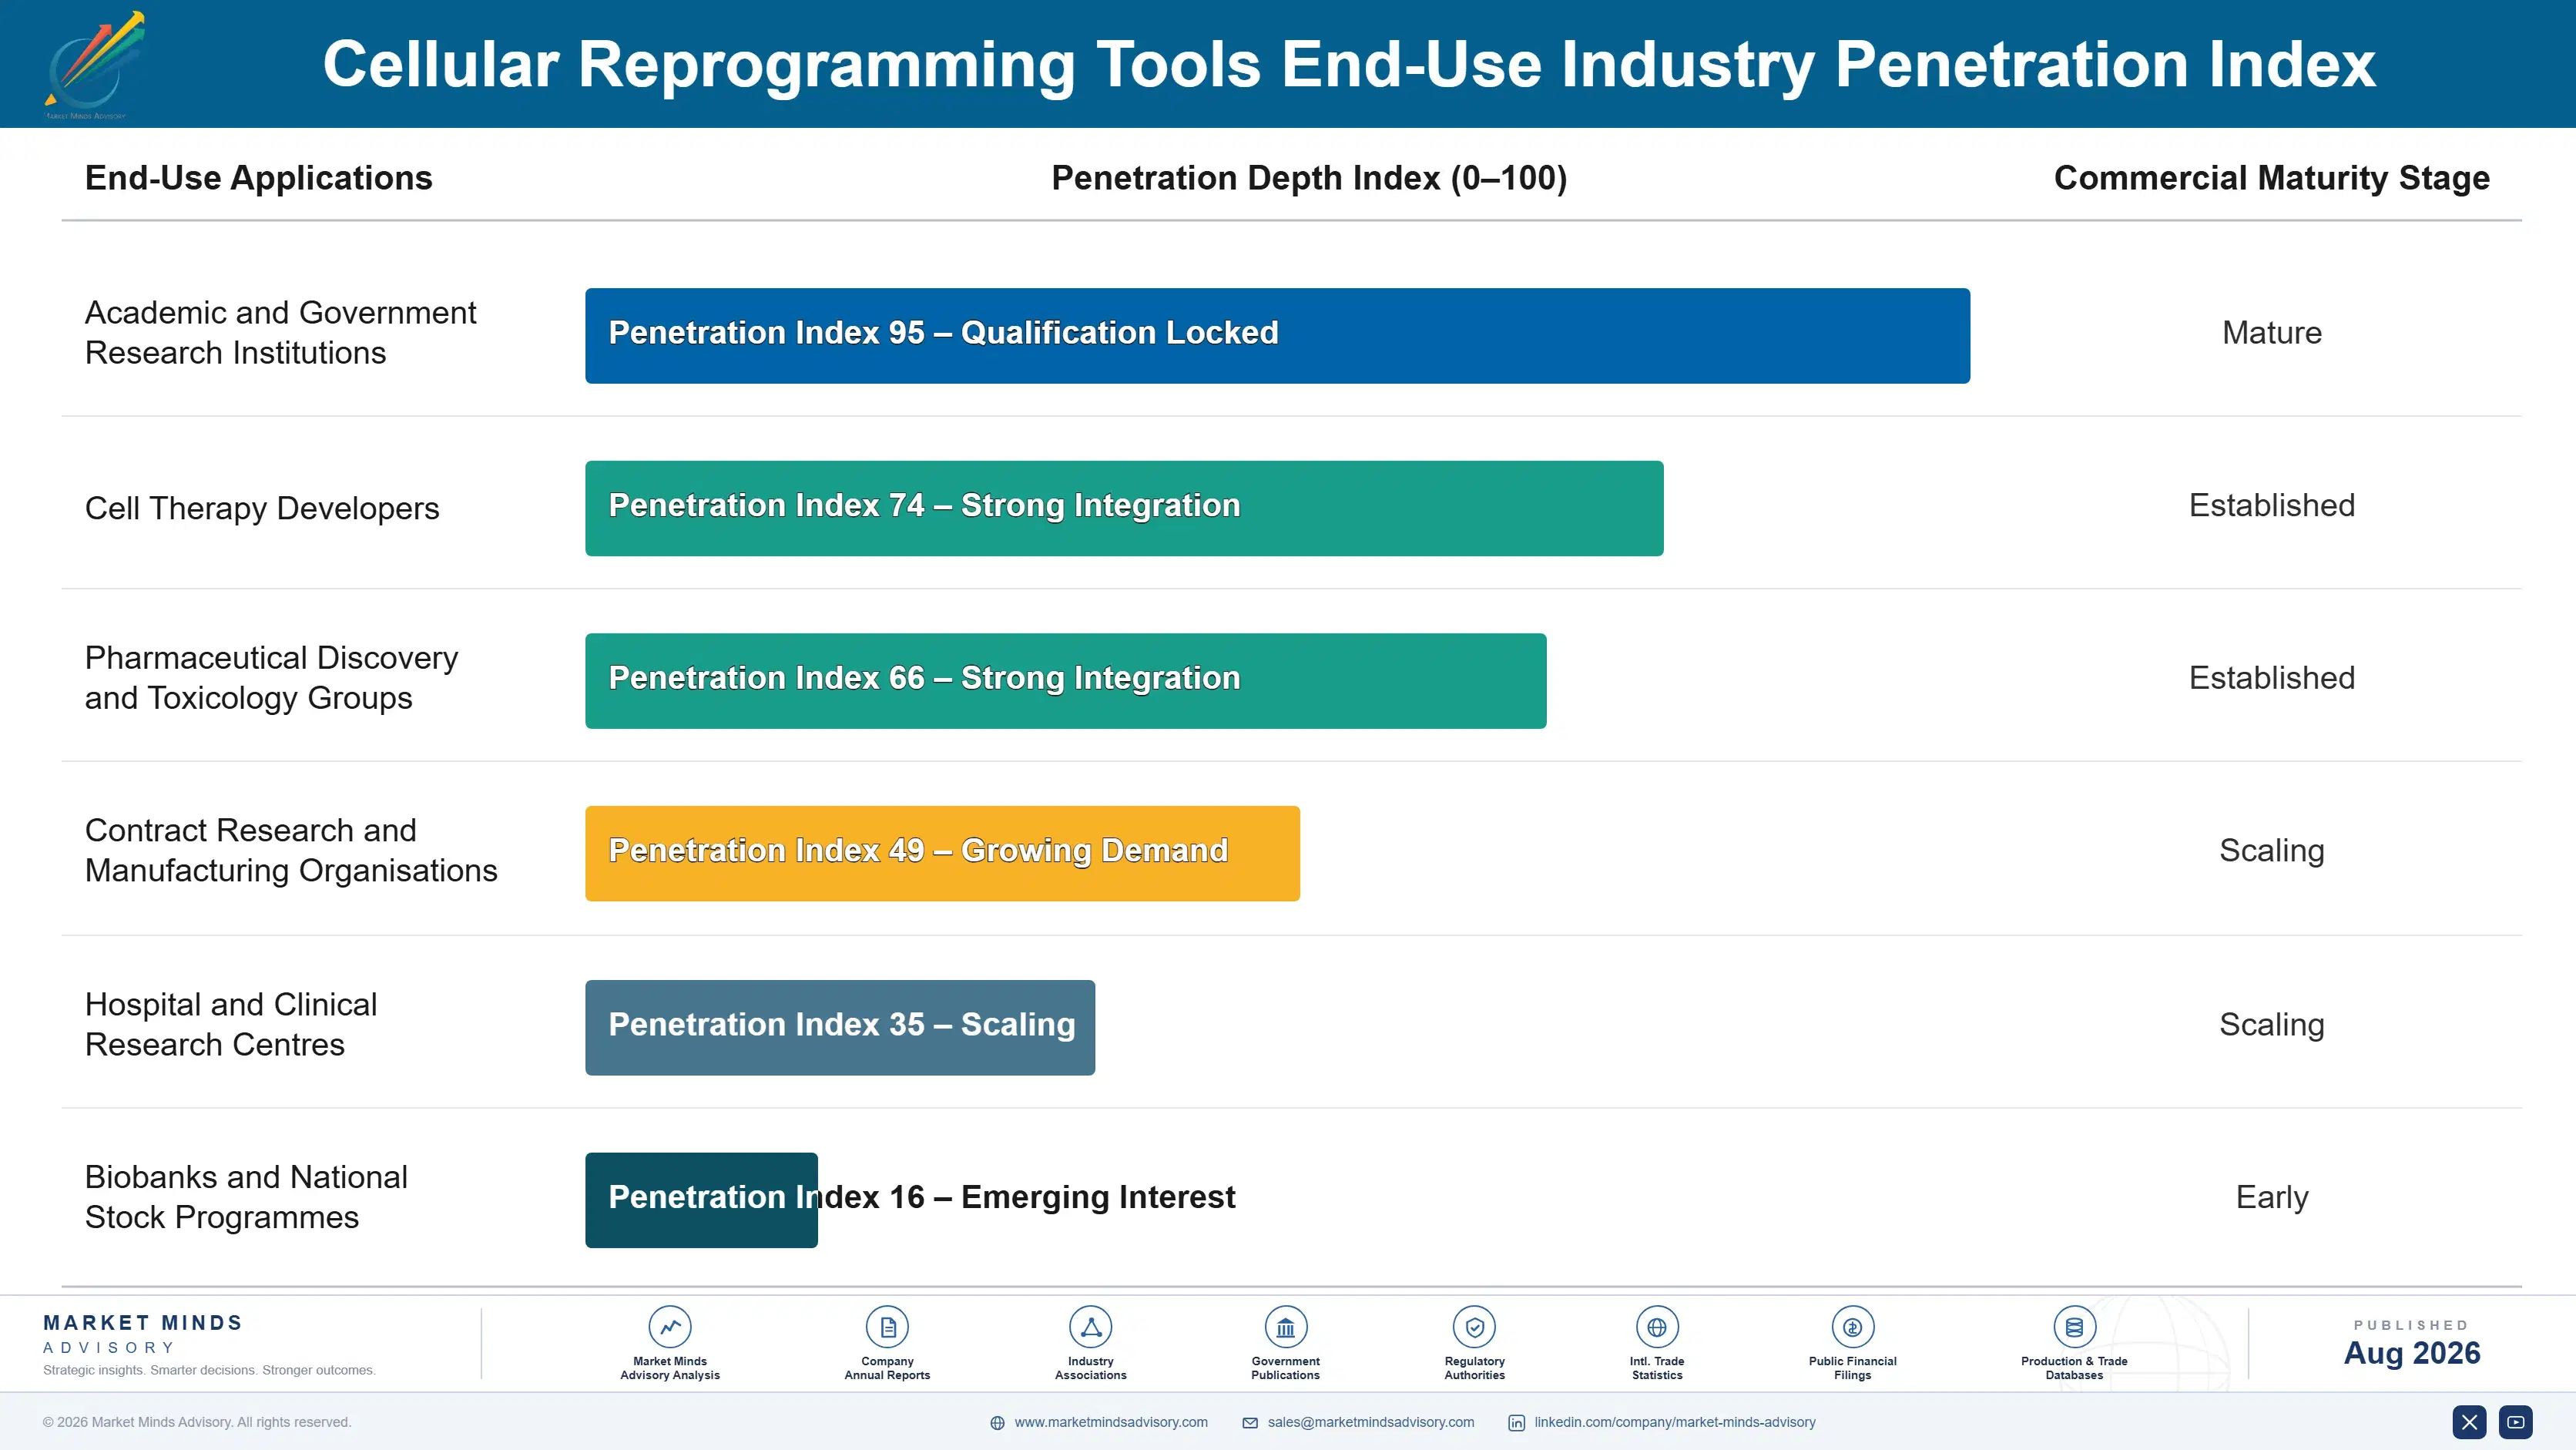
Two consumption patterns operate here and they behave nothing alike. Research purchasing is continuous, distributed across thousands of laboratories and tied to grant funding rather than to any production schedule, generating modest but highly predictable catalogue volume. Manufacturing campaign consumption is concentrated, large and episodic, arriving when a clinical programme runs a batch and disappearing entirely when a trial pauses or a company runs out of funding.
Stickiness depends almost entirely on protocol validation. A laboratory that has established a differentiation protocol on one medium will not change formulation, because revalidation costs months and risks results that no longer compare with the published literature the protocol was built against. Media accounts for roughly 44% of consumable spend and is the stickiest category by a wide margin. General plasticware and basic substrates requalify immediately and are bought on price.

Buyer profiles have shifted substantially as the field industrialised. Principal investigators once made essentially every purchasing decision from grant budgets, and manufacturing quality and procurement functions now specify clinical grade supply against documentation criteria that no academic buyer would recognise. Core facility managers represent a third profile, standardising reagents across many research groups at once.
cellular-reprogramming-tools-market-end-use-penetration-index-1787304871767

Where Reprogramming Tool Strategy Lands

These are among the four positions where our research anticipates prominent divergence between winners and laggards over the coming forecast period. Each is grounded in the demand model, the regulatory perimeter, and the announced capacity pipeline.
01 / GRADE CREDENTIAL PRIORITY

Documentation, not biology, creates the price premium

A clinical grade line costs roughly USD 580,000 to generate against about USD 32,000 for a research equivalent, and the underlying biology behind both of them is genuinely identical in every respect. Documented donor consent, full chain of custody, animal-component-free sourcing and complete release testing together account for essentially the entire eighteenfold difference in the price charged. Suppliers still competing on reagent performance alone are contesting a variable that nobody purchasing clinical grade material is actually comparing between competing vendors.
02 / PROTOCOL POSITION TIMING

Win the formulation before the protocol is validated

A laboratory that has validated a differentiation protocol on one medium will not switch formulation afterwards, because revalidation costs months of work and risks producing results that no longer compare against the published literature. Media represents roughly 44% of all recurring consumable spend and is by a considerable margin the stickiest single category in the entire tool stack. Technical support offered at protocol development stage is therefore worth considerably more commercially than any discounting applied once a position has already formed.
03 / CLOSED ARCHITECTURE DECISION

Consumable attach is settled at instrument design stage

Automation compounds at 19.2% because manufacturing quality systems now require closed handling, rather than because any laboratory manager wants additional throughput from their existing staff. Instrument sales themselves are lumpy and unpredictable, while the closed consumables that those instruments actually run on recur with every single manufacturing campaign performed. Open architectures that accept third-party consumables surrender all of that recurring revenue permanently, and the decision cannot be revisited afterwards once the systems have been installed and validated by a customer.
04 / EFFICIENCY ACCEPTANCE REALISM

Nobody is going to fix the underlying conversion rate

Reprogramming succeeds in only roughly 0.02% of treated cells, and vector engineering, small molecule cocktails and media optimisation have between them moved that figure remarkably little across nearly two full decades of concerted effort. The stochastic epigenetic sequence involved appears to resist deterministic control in ways that the field itself has now broadly stopped contesting. Commercial strategy should therefore target managing that inefficiency through better selection, survival chemistry and automation rather than promising customers a breakthrough which has repeatedly failed to arrive.

Engagement Snapshot From the Field

A live engagement with an industry participant carrying material or product regulatory and market exposure ahead of a defining policy shift, showing how our research translates into a defensible multi-year portfolio strategy.
MARKET MINDS ADVISORY · CLIENT ENGAGEMENT SUMMARY
Cellular Reprogramming Tools Producer Strategic Portfolio Review and Transition Roadmap 2026·Investment Scenario on Cellular Reprogramming Tools Exposure Evaluation 2025-26
CLIENT PROFILE
A specialist cell culture reagent supplier with established media formulations used across academic reprogramming laboratories worldwide, a modest substrate line and no clinical grade manufacturing capability. Annual revenue was approximately USD 140 million (client-reported, unverified by MMA), concentrated in research grade catalogue sales through distributors across North America, Europe and Japan. Distributor margins consumed a substantial share of realised pricing.
STRATEGIC CHALLENGE
Research grade pricing was eroding against Chinese suppliers in categories where no protocol position existed, while the client's strongest academic customers were advancing programmes toward clinical manufacturing and buying clinical grade material from competitors instead. The board needed to decide whether to build quality systems internally, acquire a credentialed supplier, or concentrate on defending research grade positions.
MMA APPROACH
MMA conducted 47 expert interviews spanning principal investigators, core facility managers, cell therapy manufacturing quality directors, regulatory affairs specialists, contract manufacturing organisation leads and procurement staff across six countries. A quantitative survey of 3,800 respondents established formulation switching behaviour, protocol validation practice and clinical grade purchasing criteria. We then modelled revenue outcomes under build, acquire and defend strategies against observed programme progression timelines.
KEY FINDINGS
  1. Laboratories in five of six markets reported they would not change a validated protocol medium at any realistic price difference, citing comparability with published literature above cost.
  2. Manufacturing quality directors selected clinical grade suppliers on documentation, inspection history and traceability, and none rated reagent performance among their top three criteria.
  3. Research positions did not convert automatically into clinical supply, and most programmes surveyed had changed supplier entirely when moving to manufacturing grade material.
  4. Core facility managers had become the effective purchasing decision makers across many institutions, standardising reagents for multiple groups rather than individual investigators.
CLIENT PROFILE
A specialist cell culture reagent supplier with established media formulations used across academic reprogramming laboratories worldwide, a modest substrate line and no clinical grade manufacturing capability. Annual revenue was approximately USD 140 million (client-reported, unverified by MMA), concentrated in research grade catalogue sales through distributors across North America, Europe and Japan. Distributor margins consumed a substantial share of realised pricing.
STRATEGIC CHALLENGE
Research grade pricing was eroding against Chinese suppliers in categories where no protocol position existed, while the client's strongest academic customers were advancing programmes toward clinical manufacturing and buying clinical grade material from competitors instead. The board needed to decide whether to build quality systems internally, acquire a credentialed supplier, or concentrate on defending research grade positions.
MMA APPROACH
MMA conducted 47 expert interviews spanning principal investigators, core facility managers, cell therapy manufacturing quality directors, regulatory affairs specialists, contract manufacturing organisation leads and procurement staff across six countries. A quantitative survey of 3,800 respondents established formulation switching behaviour, protocol validation practice and clinical grade purchasing criteria. We then modelled revenue outcomes under build, acquire and defend strategies against observed programme progression timelines.
KEY FINDINGS
  1. Laboratories in five of six markets reported they would not change a validated protocol medium at any realistic price difference, citing comparability with published literature above cost.
  2. Manufacturing quality directors selected clinical grade suppliers on documentation, inspection history and traceability, and none rated reagent performance among their top three criteria.
  3. Research positions did not convert automatically into clinical supply, and most programmes surveyed had changed supplier entirely when moving to manufacturing grade material.
  4. Core facility managers had become the effective purchasing decision makers across many institutions, standardising reagents for multiple groups rather than individual investigators.
RECOMMENDED STRATEGY
Phase 1: Phase one: acquire a credentialed clinical grade supplier rather than building quality systems internally, since inspection history cannot be created on any useful timescale. Phase 2: Phase two: redirect technical support toward protocol development stage and core facilities, where formulation positions are actually won for the following decade. Phase 3: Phase three: concede research grade commodity categories where no protocol lock exists rather than defending them against permanently lower cost competitors.
OUTCOME
The client acquired a clinical grade reagent supplier with existing inspection history, redirected roughly USD 24 million from catalogue expansion into protocol development support (client-reported, unverified by MMA), and withdrew from three commodity reagent categories. Clinical grade revenue reached a meaningful share within eighteen months, and two major academic customers retained the client through their transition to manufacturing.

Frequently Asked Questions

Foundational context covering the market sizes, CAGR, scope, country, region and competition that inform every finding below. This section is provided to cover basics and most often pre-purchase conversations, answered from the MMA Primary Research Dataset.

What is the current size of the Cellular Reprogramming Tools Market?

The global cellular reprogramming tools market was valued at USD 1.3 billion in 2025, spanning vectors, media, substrates, characterisation reagents, automation and line generation services. Reprogramming succeeds in roughly 0.02% of treated cells.

How large will the Cellular Reprogramming Tools Market be by 2036?

MMA forecasts the market at USD 4.89 billion by 2036, expanding 3.33 times from the 2026 base of USD 1.47 billion. That represents roughly USD 3.42 billion of incremental value across the forecast decade.

What is the CAGR for the Cellular Reprogramming Tools Market 2026 to 2036?

The base case compound annual growth rate is 12.8%, with a bull case of 14.1% and a bear case of 11.5%. The bull case assumes an induced pluripotent derived allogeneic therapy reaches approval.

Which segment is growing fastest?

Automation instruments and consumables grow at 19.2%, a full 1.50x the overall market rate. Manual open handling cannot satisfy manufacturing inspection at clinical scale or reproduce reliably between operators.

Who are the major companies in the Cellular Reprogramming Tools Market?

Thermo Fisher Scientific, STEMCELL Technologies, Merck KGaA, Lonza and Fujifilm Cellular Dynamics together hold 58% of revenue. They lead on quite different positions, from catalogue breadth to media protocol authority.

Which country is growing fastest?

Japan grows fastest at 20.4%, on a national stem cell stock programme and a regenerative medicine framework no other country built. East Asia is the largest region at 30% of value.

Report Segmentation Architecture

The full report scope spans multiple orthogonal segmentation dimensions, with cross-tabulated demand data provided for each dimension pair. Coverage extends further to regional breakdowns, trend trajectories, and the competitive detail needed to support segment-level decision-making.

By Product and Service Class

  • Reprogramming Vectors and Delivery Reagents
  • Culture Media and Growth Supplements
  • Substrates, Matrices and Coating Reagents
  • Characterisation and Quality Control Reagents
  • Automation Instruments and Consumables
  • Line Generation and Banking Services

By End-Use Industry

  • Academic and Government Research Institutions
  • Cell Therapy Developers
  • Pharmaceutical Discovery and Toxicology Groups
  • Contract Research and Manufacturing Organisations
  • Hospital and Clinical Research Centres
  • Biobanks and National Stock Programmes

By Commercial Dimension

  • Catalogue and Distributor Reagent Sales
  • Clinical Grade Supply Agreements
  • Line Generation Service Contracts
  • Cell Bank Storage and Custody Arrangements
  • Instrument Placement and Consumable Programmes
  • Academic Consortium and Grant Purchasing

By Region

  • East Asia
  • North America
  • Western Europe
  • South Asia and Pacific
  • Latin America
  • Middle East and Africa
  • Eastern Europe

Scope, Methodology, and Coverage

Every figure in this report is reproducible from documented input assumptions. The scope below maps the historical period, the forecast horizon, the segmentation dimensions, and the countries covered, alongside the underlying primary and qualitative methodology.
Historical Period
2020 to 2025
Forecast Period
2026 to 2036
Base Year
2025 (USD billions; MMA Primary Research Dataset, August 2026)
Market Definition
This market comprises products and services used to reprogram somatic cells to induced pluripotency or to directly convert cell identity between lineages, measured at supplier revenue across catalogue and distributor reagent sales, clinical grade supply agreements, line generation service contracts, cell bank storage arrangements, instrument placement and consumable programmes, and academic consortium purchasing. Coverage spans integration-free and integrating reprogramming vectors, messenger RNA, episomal, protein and small molecule delivery reagents, pluripotency culture media and growth supplements, recombinant substrates, matrices and coating reagents, pluripotency, karyotype, identity and genomic characterisation reagents, closed automation instruments with their dedicated consumables, and line derivation, characterisation and banking services. Lineage-specific differentiation reagents for downstream cell types, gene editing tools sold independently of reprogramming, cell therapy manufacturing beyond line generation and banking, primary cell isolation and tissue dissociation products, adult and embryonic stem cell products not involving reprogramming, and therapeutic products themselves fall outside scope.
Quantitative Units
USD millions (current prices); lines generated by grade; reagent volume consumed; average cost per line; instrument placements; consumable spend per campaign; banking storage volumes
Segmentation Dimensions
By Product and Service Class; By End-Use Industry; By Commercial Dimension; By Region
Regions Covered
East Asia, North America, Western Europe, South Asia and Pacific, Latin America, Middle East and Africa, Eastern Europe
Countries Covered
Japan, China, South Korea, Taiwan, United States, Canada, Germany, United Kingdom, France, Netherlands, Sweden, Switzerland, Spain, Italy, Australia, Singapore, India, New Zealand, Thailand, Brazil, Mexico, Argentina, Chile, Israel, Saudi Arabia, United Arab Emirates, South Africa, Poland, Czechia, Hungary, and additional markets relevant to regenerative medicine analysis
Key Companies Profiled
Thermo Fisher Scientific, STEMCELL Technologies, Merck KGaA, Lonza, Fujifilm Cellular Dynamics, Sartorius, Bio-Techne, Takara Bio, Corning, Miltenyi Biotec, Charles River Laboratories, Ncardia, Axol Bioscience, Cellino Biotech, BICO Group, Repligen, PromoCell, Sumitomo Pharma, Healios, Cellular Origins
Quantitative Methodology
Primary survey, n=3,800 respondents, Q4 2025, six countries; demand-side model with trade association cross-validation
Qualitative Methodology
47 expert interviews, Q4 2025; applied to validate demand model assumptions, identify emerging dynamics, and assess competitive positioning
Report Format
PDF and XLSX data workbook (Word format preview document)
Publisher
Market Minds Advisory
Report Code
MMA-2026-HLT-318
Published
August 2026
Contact
sales@marketmindsadvisory.com | www.marketmindsadvisory.com

Purchase the full Cellular Reprogramming Tools Market Report (2026 to 2036).

The full MMA report separates research grade purchasing from clinical grade supply, quantifying an eighteenfold cost difference that documentation rather than biology creates. It sizes six product and service classes and seven regions to 2036, modelling lines generated by grade, reagent consumption, instrument placements, consumable attach and banking volumes separately so that recurring revenue can be assessed on its own terms. Competitive assessment covers twenty suppliers on one consistent revenue basis. Cost exposure is traced through growth factor, substrate and quality system inputs. Four commercial levers and a strategic verdict close the report, grounded in 47 expert interviews and a 3,800-respondent survey.
Six product and service classes sized separately through 2036
Research and clinical grade demand modelled entirely separately
Protocol lock-in mapped against media formulation switching behaviour
Twenty suppliers assessed on one consistent revenue basis
Automation consumable attach quantified against instrument placement volumes
Anonymised client engagement with tested strategic recommendations

Built For The People Who Decide

From boardroom strategy to bench-side execution, this report is read cover-to-cover by leaders shaping the next decade of their industry, turning demand scenarios, market dynamics and valuation benchmarks into decisions.
CXOs/ Presidents/ VPs/ Managers
M&A and Corporate Development
Strategy Teams and R&D Heads
Procurement and Product Directors
Regulatory and Compliance Leaders
Investor Relations and Equity Analysts