Market Minds Advisory
Cell Line Development Market

Cell Line Development Market: The Decision You Cannot Undo

The clone chosen in month three fixes yield, product quality and manufacturing cost for the drug's entire commercial life, which makes a cheap early step the most consequential decision in biologics manufacturing.

Lead Analyst

Published

September 2026

Make Smarter Decisions with Customized Research Insights

Request a free sample report and evaluate market opportunities, growth trends, and competitive dynamics relevant to your business needs.

2025 MARKET VALUE$5.6BMarket Size 2025
2036 FORECAST VALUE$16.3BBase Case , 2026 to 2036
CAGR 2026 TO 203610.2 %Bull 11.4% / Bear 9.0%
INCREMENTAL OPPORTUNITY$10.1BNet 10- year value creation
EXPANSION MULTIPLE2.63x2036 value over 2026 base
Strategic Levers
M&A Pipeline
Regional Outlook
Country Rankings
Competitive Intelligence
Segmental Deep-dive
Call-Us : 91 93563 13602

Executive Snapshot and Market Trajectory

A cell line is chosen once and lived with forever. The clone selected early in development determines titre, glycosylation, impurity profile and cost of goods for as long as the product is manufactured. Changing it later means a comparability package costing more than the original programme did.
East Asia holds 31% of value because Chinese and Korean contract manufacturers now originate a large share of the world's biologics programmes and cell line work sits at the very front of each one. Automated clone screening and selection grows at 15.3%, half again the market rate of 10.2%, because screening thousands of clones instead of hundreds finds better ones. Speed is what buyers are actually paying for. Price enters those conversations remarkably late.
Concentration is moderate at 44% and splits between contract developers and technology suppliers who rarely compete directly. Expression system royalties on eventual product sales remain the most contested commercial term in the market, since biotech companies dislike a cost that arrives precisely when revenue finally does. Regulators requiring documented evidence of single-cell origin turned a technical detail into an instrument category almost by accident.
Market Definition
The market covers the technologies, reagents and services used to create stable, well-characterised, high-producing cell lines for biologics manufacturing, including host cell line and expression system licensing, transfection and selection, single-cell cloning and clonality assurance, automated clone screening, cell banking and characterisation, and outsourced development programmes. Cell and gene therapy manufacturing, upstream bioreactor equipment, downstream purification and analytical instruments sold for other purposes are excluded. Drug substance manufacture falls outside scope.
Base Year Value
$5.6B in 2025 (MMA Primary Research Dataset, August 2026)
Forecast Period
2026 to 2036, eleven discrete annual values
CAGR
10.2% base case. Bull 11.4%. Bear 9.0%.
Fastest Growth Segment
Automated Clone Screening and Selection: 15.3% CAGR
Fastest Growth Country
China: 13.4% CAGR
Fastest Growth Region
South Asia and Pacific: 12.4% CAGR
Largest Region
East Asia: 31% of 2025 global value
Market Leaders
Lonza, WuXi Biologics, Samsung Biologics, Thermo Fisher Scientific, Sartorius. Source: MMA Analysis based on disclosed bioprocessing and biologics services revenue, company annual reports 2025.
Primary Survey
n=3,800 procurement and R&D decision-makers, Q4 2025, six countries
Methodology
Demand-side build-up, cross-validated against public data, 47 expert interviews

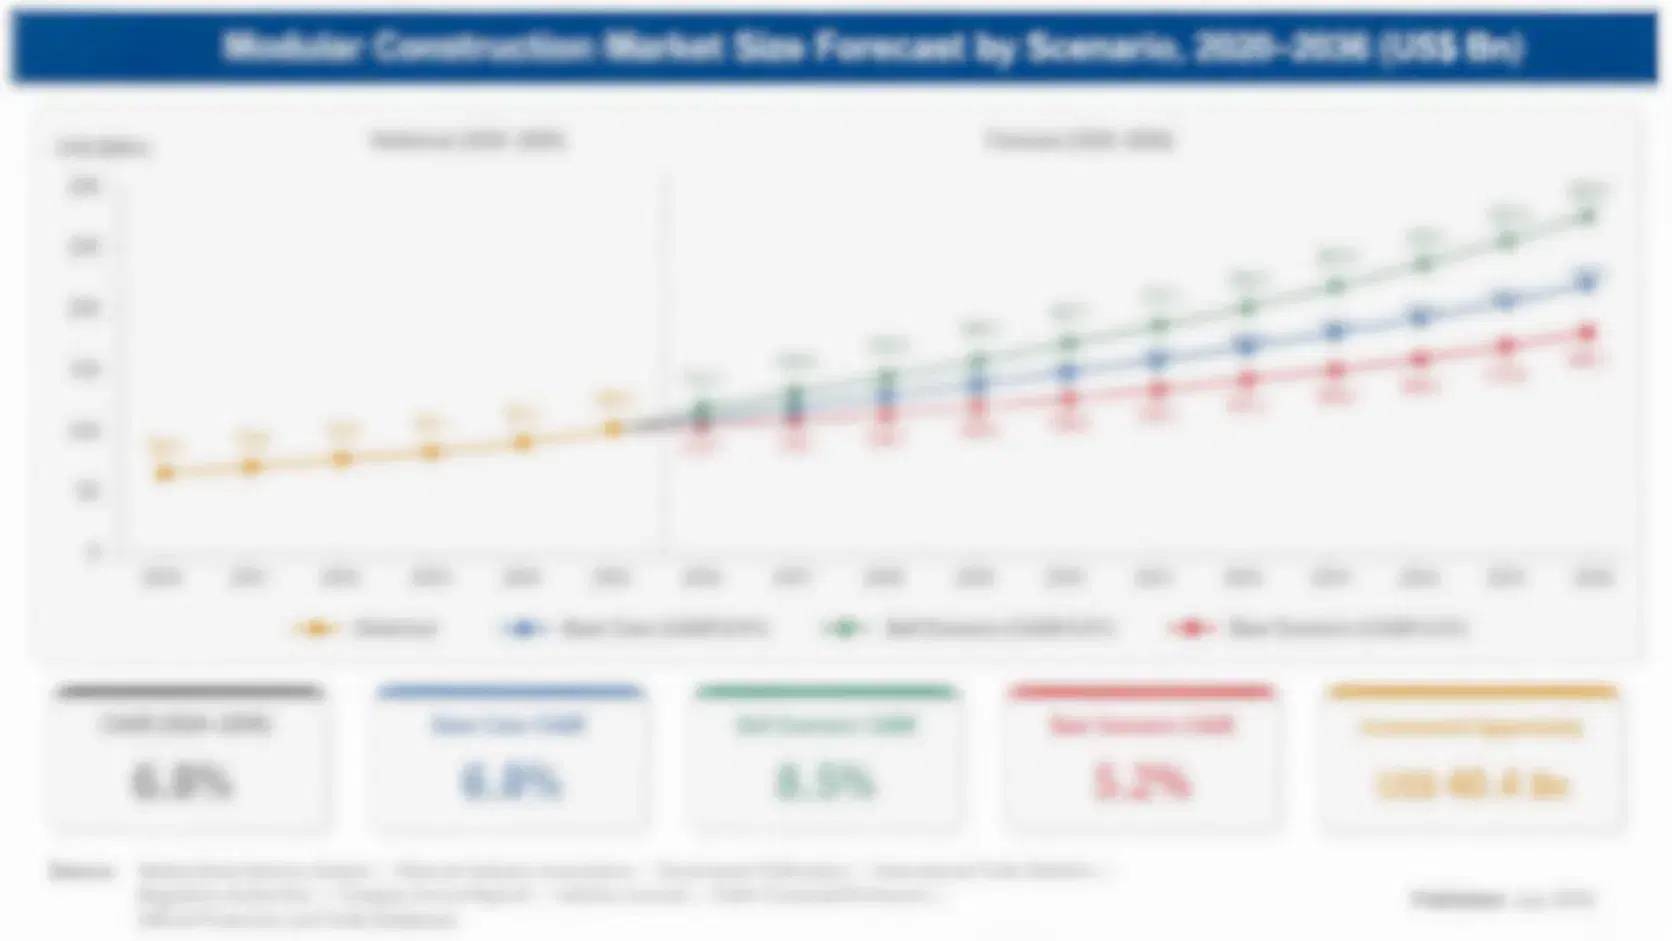
Cell Line Development Market Forecast Scenarios

cell-line-development-market-size-forecast-scenario-1787683785818
Growth from 2020 to 2025 ran at 8.8% and the shape of it was distorted badly by one event. Vaccine and antibody programmes consumed development capacity through 2021 at rates nobody had planned for, then biotech funding contracted sharply and early stage programme starts fell with it. Cell line development sits at the very front of the pipeline, so it felt that contraction before anybody downstream did.
The 10.2% base case rests on three mechanisms. Biologics programme starts are recovering as funding conditions normalise, and every programme needs a cell line before it needs anything else. Automated screening platforms are replacing manual clone picking, which raises both the equipment spend and the quality of the clone eventually selected. And Asian contract developers keep taking a larger share of global programme origination, which shifts where the work is performed rather than how much exists.
The bull case at 11.4% turns on biosimilar programme volume expanding as more originator biologics lose exclusivity, since each biosimilar requires an independent cell line built from nothing. The bear case at 9.0% is a prolonged biotech funding drought, which stops programme starts at source and reaches this market faster than any other part of bioprocessing.

Why Month Three Decides Everything

Everything expensive in biologics manufacturing was decided by a clone somebody picked years earlier. Titre determines how many batches a plant produces. Glycosylation determines whether the product matches its own clinical material. Impurity profile determines how hard purification has to work. All of it is fixed at cell line selection, and none of it can be changed afterward without a comparability exercise that costs more than most development programmes.
FIVE-FIRM CONCENTRATION44%Share of bioprocessing services revenue held by leading suppliers
PROGRAMME DEVELOPMENT COST$1.2 millionTypical cost of a single outsourced development programme
TOP PRODUCING COUNTRYChina 27%Chinese share of global development programmes performed annually
GENE TO BANK TIMELINE14 weeksMedian interval from sequence to master cell bank
CLONE SCREENING DEPTH4,800 clonesCandidates evaluated during one automated screening campaign run
COMPARABILITY PACKAGE COST$14 millionTypical expense of changing a cell line after clinical entry
That permanence explains why speed sells better than price. A biotech burning cash values reaching clinic three months earlier far above any reagent saving, and timelines have compressed from roughly a year to around fourteen weeks through automation and parallel processing. Suppliers who competed on cost per programme lost accounts to suppliers who competed on weeks.
The contested commercial term is not price at all. Expression system licences have historically carried royalties on eventual product sales, and biotech companies dislike a charge that arrives exactly when they finally have revenue to charge against. Royalty-free host cell lines have become a competitive weapon, which forces licensors to choose between capturing long-term value and winning programmes in the first place.
"Everybody negotiates the development fee, which is the smallest number in the whole arrangement. Nobody negotiates the clone, which decides the cost of every batch for twenty years."
Director, Bioprocessing and Cell Line Practice · MMA Medical Devices Practice · August 2026

Market Trends

Automated Screening Replaces Manual Clone Selection Entirely

Manual clone picking evaluated a few hundred candidates because that was what a technician could physically handle, and the best clone in that population was rarely the best clone available. Automated platforms screen several thousand, which finds higher producers with better quality attributes simply by looking at more of them. The equipment is expensive and the return arrives in manufacturing cost across a product's whole life rather than in the development budget that paid for it. That mismatch between who pays and who benefits slowed adoption for years and is now resolving as programmes are costed across their full lifetime.
Market Impact: Adds 240 biosimilar programmes annually
Royalty-Free Expression Systems Become Competitive Weapons

Expression system licensing traditionally carried a royalty on commercial product sales, which meant the technology provider participated in success and the biotech paid most at the point of maximum value. Companies hated that arrangement and increasingly refuse it. Royalty-free host cell lines, licensed for a fixed fee, have become the way newer entrants win programmes against established systems with better performance histories. The established licensors face an uncomfortable choice between defending a lucrative back end and losing the programmes that would have generated it, and several have already begun offering both structures.
Market Impact: Performs 27% of global programmes

Market Opportunities and Growth Drivers

Biosimilar Programmes Each Require An Independent Cell Line

A biosimilar developer cannot use the originator's cell line and must build one from nothing that produces a molecule matching the reference product closely enough to satisfy regulators. That is harder than developing an original biologic, because the target is somebody else's existing product rather than a specification the developer chose. As more high-volume biologics lose exclusivity, each attracts multiple biosimilar developers and each of those runs a full cell line programme. The work is technically demanding, well funded and entirely additive to originator development activity happening in parallel. Nobody counts these programmes properly.
Market Impact: Costs 14 million dollars to change

Asian Contract Developers Take Global Programme Origination

Chinese and Korean contract manufacturers built biologics development capacity faster than anywhere else and now perform cell line work for sponsors on every continent. Cost matters less in this decision than capacity and speed, since a Western biotech waiting nine months for a development slot will go wherever one is available. Regulatory acceptance of Asian-developed cell lines is well established for Western filings. What sponsors weigh instead is intellectual property comfort and geopolitical exposure, which several have started pricing explicitly into supplier selection decisions. Sponsors now price that exposure explicitly, which is new. Capacity availability still decides most awards.
Market Impact: Leads industry cycles by 9 months

Market Restraints and Challenges

Cell Line Changes After Clinical Entry Cost Fortunes

Changing a cell line once clinical material exists requires a comparability package demonstrating the new product matches the old one, which typically costs around 14 million dollars and delays a programme substantially. Root cause is patient safety rather than bureaucracy: a different clone makes a subtly different molecule and regulators require proof it behaves identically. The commercial impact is that mistakes made early cannot be corrected economically, which makes sponsors conservative about suppliers and slow to adopt anything unproven. Mitigation is doing more development work upfront, which extends timelines nobody wants extended.
Market Impact: Screens 4,800 clones per campaign

Biotech Funding Cycles Reach This Market First

Cell line development sits at the very front of the biologics pipeline, which means a funding contraction stops programme starts here before it reaches manufacturing, analytics or anything downstream. Root cause is sequencing rather than sensitivity: nothing else can begin until a cell line exists. The commercial impact is revenue volatility disproportionate to the underlying industry, since suppliers see the downturn early and the recovery late. Mitigation runs through biosimilar and government-funded programme exposure, both of which follow different funding cycles from venture-backed biotech entirely. Suppliers here see everything before anybody else does.
Market Impact: Removes 2% downstream sales royalty
3 additional market trends, 4 additional growth drivers, and 2 additional restraints and challenges are covered in the full report. Contact sales@marketmindsadvisory.com to access the complete intelligence.

Segment CAGR and Growth Architecture

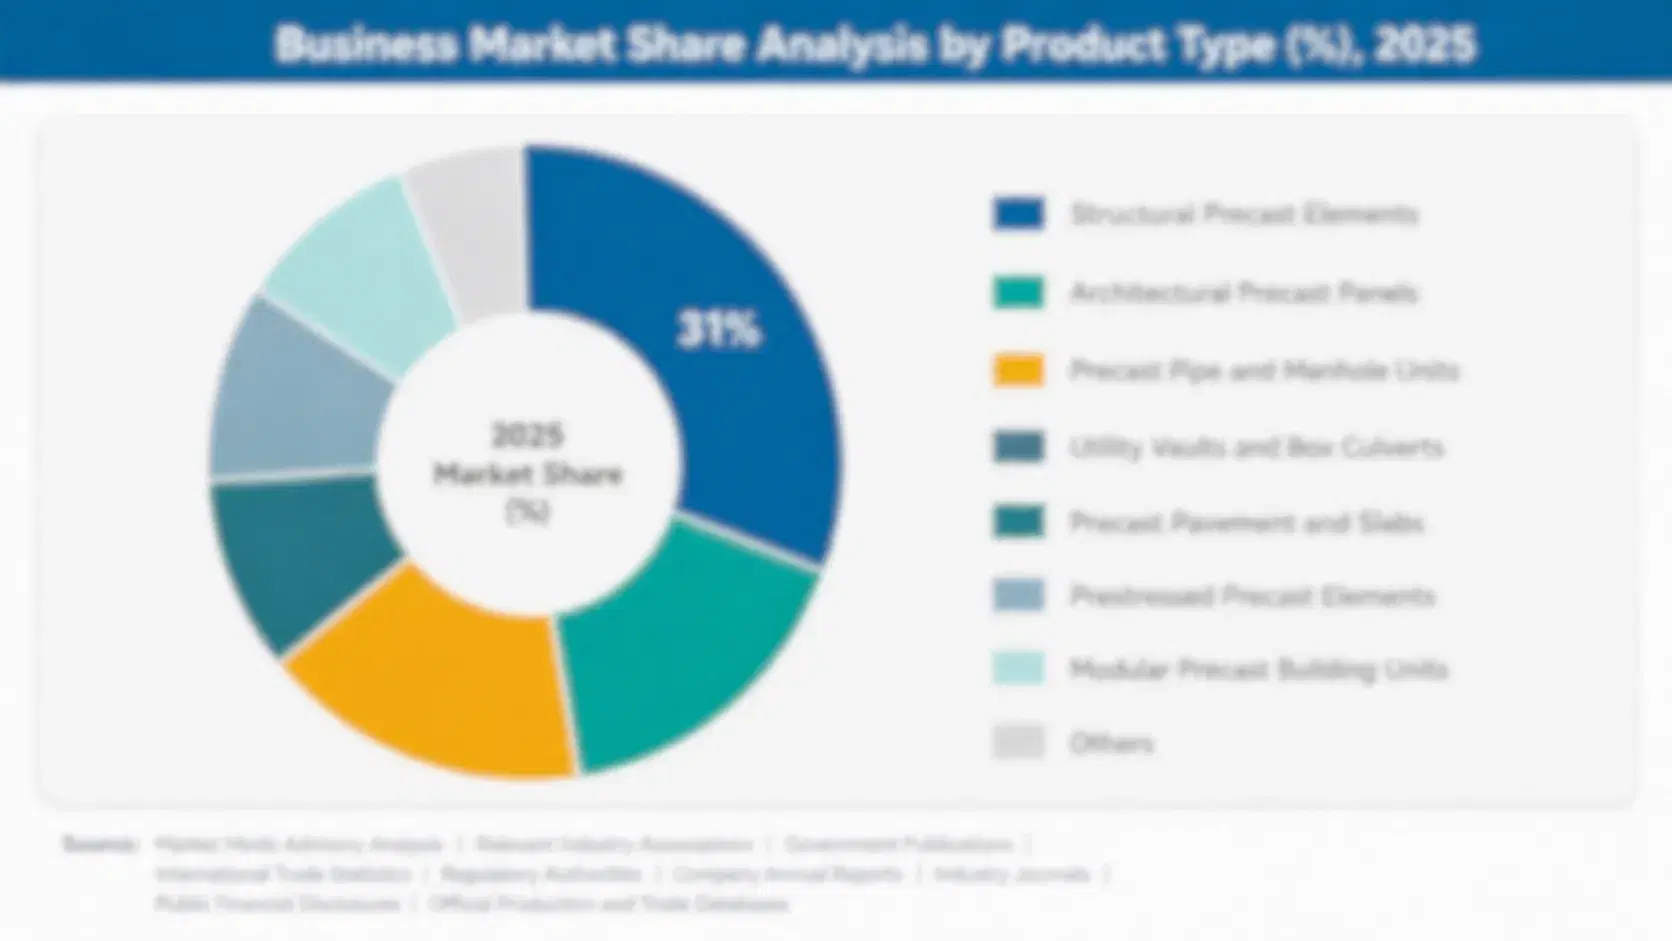
Segmentation follows the development workflow: what a sponsor buys at each step from gene sequence to characterised cell bank, rather than which molecule is being produced or who performs the work. Six offerings cover the market without overlap, from expression system licensing through to outsourced programmes. Molecule type and sponsor category are treated separately.
cell-line-development-market-market-share-analysis-1787683786142

Automated Clone Screening and Selection

Automated platforms evaluate several thousand clones where a technician evaluated a few hundred, and the improvement is straightforward: examining more candidates finds better ones. Growth at 15.3%, half again the market rate of 10.2%, reflects adoption catching up with an argument that was always sound. The commercial obstacle was never technical. Screening equipment is charged to a development budget while the benefit arrives as lower manufacturing cost across a product's entire commercial life, and organisations that budget those separately took years to approve the purchase. Programmes now costed across their full lifetime approve it immediately, which is why the segment finally moved. The equipment was never the difficult part of the argument.
CAGR 15.3%

Outsourced Development Programmes

A sponsor without internal capability buys the whole thing as a programme, from gene sequence to characterised master cell bank, typically for around 1.2 million dollars and fourteen weeks. Growth at 11.4% follows both biotech companies that never intended to build the capability and larger organisations that have decided capacity is cheaper rented than owned. Asian contract developers have taken a substantial share of this work on capacity and speed rather than on price. What sponsors actually evaluate is timeline reliability and the quality of the resulting clone, since a poor cell line costs far more downstream than any development fee saved upfront. A poor clone is discovered years later and cannot be undone.
CAGR 11.4%
Full segment breakdown across 6 segments available in the complete report.

Regional Architecture and Country Demand Map

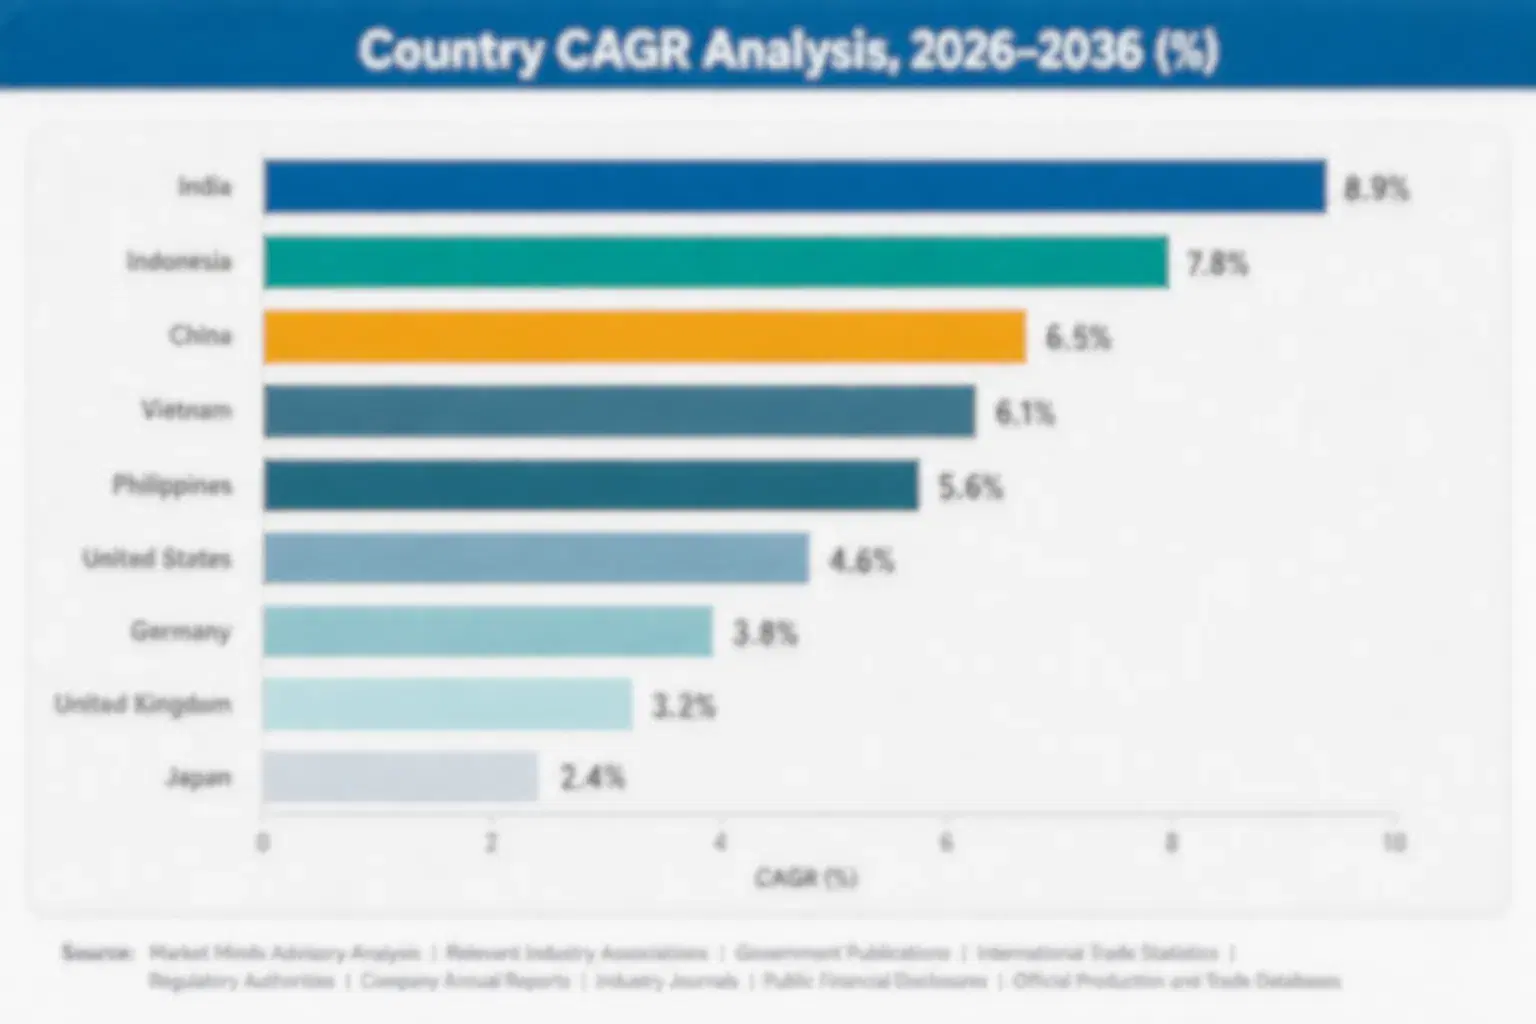
Geography follows where biologics programmes originate and where development capacity was built, and those have separated considerably. East Asia leads on contract development capacity serving sponsors everywhere. North America originates the most programmes, while South Asia grows fastest on domestic biosimilar activity. Programme origination and execution have separated.

North America

American biotechnology originates more biologics programmes than anywhere else and much of the resulting cell line work is performed elsewhere, which separates origination from execution in a way the value figures partly obscure. Boston, San Francisco and the North Carolina corridor concentrate sponsor activity. Large pharmaceutical companies retain internal cell line capability and outsource selectively, while venture-funded biotechs outsource almost everything because building the capability makes no sense at their scale. Technology suppliers headquartered here sell instruments and reagents worldwide regardless of where programmes run. Canadian activity is modest and concentrated around a handful of research institutions with commercial spinouts attached. Origination and execution have separated considerably here. Location follows capacity rather than headquarters.
Share: 29% | CAGR: 9.4% (2026 to 2036)

Western Europe

European demand splits between large pharmaceutical companies with substantial internal capability and a biotech sector that outsources comprehensively, which produces two entirely different buying behaviours in one region. Swiss and German contract developers hold strong positions built on decades of manufacturing credibility and command premium pricing accordingly. Irish and Belgian capacity serves both domestic and export programmes. British biotechnology originates well above its size and increasingly sends development work to Asia on cost and capacity grounds. Nordic activity is small and technically sophisticated. European technology suppliers in instruments and reagents export considerably more than the region itself consumes each year. Export value exceeds domestic consumption by a wide margin. Two buying behaviours, one region.
Share: 22% | CAGR: 8.6% (2026 to 2036)
Regional intelligence for 5 additional markets available in the complete report: East Asia, South Asia and Pacific, Latin America, Middle East and Africa, Eastern Europe. Contact sales@marketmindsadvisory.com.
cell-line-development-market-country-cagr-analysis-1787683786432

Selling Weeks Rather Than Programmes

A sponsor burning venture capital values reaching clinic sooner far above any development fee saved, which makes timeline the product and price close to irrelevant. Four levers work on speed, on licensing terms or on lifetime cost rather than on programme pricing, and each requires a supplier to understand how the sponsor is actually funded.

Compete On Timeline Rather Than On Development Fee

A venture-funded biotech reaching clinic three months earlier reaches its next financing milestone three months earlier, which is worth vastly more than the entire development fee. Median gene to bank timelines have compressed to around 14 weeks through automation and parallel processing, and suppliers who invested in that compression win programmes at prices competitors describe as unreasonable. The sponsor is not being irrational. Selling this requires a commercial organisation that understands biotech financing rather than one that quotes cost per programme, which most technical suppliers have never built. Financing milestones are the currency here.
Market Impact: Compresses each programme timeline down to 14 weeks

Offer Royalty-Free Licensing To Win Programme Volume

Expression system royalties on eventual product sales are the most disliked commercial term in this market, because the charge arrives precisely when a biotech finally has revenue. Offering a fixed-fee royalty-free licence wins programmes from established systems with better performance histories, which is how several newer entrants built position. The trade is explicit and uncomfortable: a licensor gives up participation in commercial success worth perhaps 2% of eventual product sales to win work that would otherwise go elsewhere entirely. Most established licensors now offer both structures rather than choosing. Choosing one structure was always the error.
Market Impact: Trades a 2% royalty for greater programme volume

Sell Screening Depth As Manufacturing Cost Reduction

Automated platforms screening 4,800 clones find higher producers than manual picking evaluating a few hundred, and a higher titre reduces manufacturing cost for every batch across a product's commercial life. The obstacle has always been budgetary: screening equipment charges to development while the benefit lands in manufacturing years later. Suppliers who learned to build the lifetime cost argument, and to present it to whoever owns both budgets, convert purchases that stalled for years in organisations evaluating them as equipment. The argument is straightforward and almost nobody was making it properly.
Market Impact: Screens some 4,800 clones in a single campaign

Build Biosimilar Characterisation Capability Deliberately Now

Each biosimilar requires an independent cell line producing a molecule that matches somebody else's existing product, which is technically harder than original development and pays accordingly. Roughly 240 such programmes start annually and the number rises as more biologics lose exclusivity. The capability required is analytical rather than simply productive: matching glycosylation and charge variants to a reference product demands characterisation depth that ordinary development does not. Suppliers who built that capability serve a customer base funded quite differently from venture-backed biotech, which smooths the cycle considerably. That cycle independence is worth real money.
Market Impact: Serves roughly 240 biosimilar programmes in each year

Who Controls the Margin Pool

Measured on disclosed bioprocessing and biologics services revenue, the five leading suppliers hold a CR5 of 44%. That figure spans two groups who rarely bid against each other: contract developers performing programmes, and technology companies selling the instruments and reagents those programmes consume. Lonza and WuXi Biologics lead the services side, with Thermo Fisher and Sartorius holding the strongest technology positions across most workflow steps.
Three contests run and share almost nothing. Contract development competes on timeline reliability and available capacity, with price entering late and deciding little. Expression system licensing competes on commercial terms as much as on performance, since royalty structure has become the deciding factor for many sponsors. Instrument competition runs on screening throughput and on regulatory documentation, where clonality evidence requirements created a category that barely existed a decade ago.

Pressure comes from Asian contract developers taking programme origination from Western suppliers on capacity and speed, and from sponsors increasingly weighing intellectual property and geopolitical exposure explicitly. Rankings shift wherever those concerns outweigh timeline advantage, which is happening more often and remains a minority of decisions rather than a majority. That shift is worth tracking closely.
cell-line-development-market-company-positioning-matrix-1787683786706

Competitive Moat and Risk Dimensions

LONZA

Moat: Development And Manufacturing Continuity

Lonza develops cell lines and then manufactures the product they produce, which lets a sponsor keep one supplier from sequence through commercial supply without a technology transfer in between. Transfers are expensive, risky and slow, so avoiding them carries real value. Competitors offering development alone must hand the cell line onward, and sponsors price that handover in.
LONZA

Risk: Capacity Cycle Revenue Exposure

Revenue concentrated in biologics services moves with a capital and funding cycle that proved far more volatile than the sector expected, and cell line development sits at the front of the pipeline where contractions arrive earliest. Diversified technology suppliers absorb such cycles across product portfolios. A services business absorbs it across a single order book with fixed capacity behind it.
THERMO FISHER SCIENTIFIC

Moat: Workflow Breadth And Installed Base

Thermo Fisher supplies expression systems, transfection reagents, screening instruments, media and characterisation services across the entire workflow, which lets a customer standardise on one supplier and one set of documentation. Regulatory filings referencing a single supplier's materials are simpler to assemble and defend. Assembling equivalent breadth would take a competitor many acquisitions and many years to complete.
THERMO FISHER SCIENTIFIC

Risk: Services Competition From Customers

Contract developers buying Thermo Fisher instruments and reagents also compete with its own services offering, which makes several of its largest customers direct competitors in the same programmes. That tension limits how aggressively the services business can be pushed without damaging technology relationships that are considerably larger and more profitable than the services revenue at stake.

Players Tracked

Prominent Players

Lonza
WuXi Biologics
Samsung Biologics
Thermo Fisher Scientific
Sartorius

Other Key Players

Danaher
Merck KGaA
Catalent
Fujifilm Diosynth Biotechnologies
Charles River Laboratories
ProBioGen
Revvity
Bruker
Molecular Devices
Advanced Instruments
Agilent Technologies
Boehringer Ingelheim
AGC Biologics
JSR Life Sciences
Bio-Techne

Recent Developments

MARCH 2025

Samsung Biologics expands cell line development capacity in Korea

Samsung Biologics commissioned additional cell line development capacity at its Korean campus, an organic investment rather than an acquisition or joint venture. The company cited sponsor demand for available development slots and shorter timelines rather than pricing. Contract developers describe slot availability rather than pricing as the deciding factor.
Signal: Capacity availability rather than cost is what sponsors are genuinely selecting on in contract development today.
JUNE 2025

Sartorius launches automated clone screening platform with expanded throughput

Sartorius introduced an automated clone screening platform evaluating substantially more candidates per campaign, developed internally rather than acquired. The company positioned it on manufacturing cost reduction across a product lifetime rather than on development efficiency, which addresses the budget mismatch that has slowed adoption of screening automation for years.
Signal: Suppliers are finally arguing lifetime cost rather than development efficiency, which is the argument that actually works.
OCTOBER 2025

Technology provider offers royalty-free expression system licensing terms

An expression system provider introduced royalty-free fixed-fee licensing alongside its existing royalty-bearing terms, a commercial policy decision rather than any technology change. The move responds to sponsor resistance to downstream royalties, which biotech companies have consistently identified as the least acceptable term in cell line development agreements.
Signal: Licensing structure has become a competitive weapon, which suggests performance differences between systems have narrowed considerably.

What A Development Programme Costs

Skilled labour dominates the services side completely. Scientist and technician time, plus the analytical characterisation work that accompanies it, runs 46 to 49% of programme cost, delivered by people who take years to train and are recruited from a pool that pharmaceutical manufacturers also draw on. Reagents, media and consumables account for roughly 18%. Instrument depreciation and facility overhead carry most of what remains after that.
Specialist scientist availability rather than any material constraint is the recurring problem. Cell line development scientists are scarce, and wage inflation through 2022 and 2023 raised programme cost across every supplier simultaneously. Lonza and Sartorius annual reports for those years describe staffing cost pressure and the automation investment made in response. Nobody solved it by recruiting, because the people simply were not available at the numbers the industry needed them.

Exposure divides by how much of the workflow a supplier has automated. Operators running automated screening and handling carry lower scientist hours per programme and absorb wage pressure without repricing. Those relying on manual clone picking and hand characterisation carry the full labour base. Technology suppliers selling instruments avoid the exposure entirely and capture correspondingly less of the value each programme creates overall.
cell-line-development-market-cost-volatility-analysis-1787683786992

Automate handling before scientist wages rise again

Programme cost is scientist hours and nothing else matters much beside it. Suppliers who automated clone handling, imaging and early screening during favourable periods absorbed the wage inflation that followed without raising prices. Those who did not found themselves competing on timeline against operators with lower cost bases, which is a losing position that no commercial effort corrects afterward.

Recruit and train scientists ahead of programme demand

A cell line development scientist takes years to become genuinely productive and cannot be hired at short notice at any price. Suppliers who trained ahead of demand had capacity available when sponsors were queueing elsewhere, which is how several won accounts they would never have reached on technical merit alone. Training costs money against programmes that have not yet arrived.

Standardise workflows to reduce characterisation rework

A substantial share of programme hours goes into repeating characterisation work because something upstream was not documented adequately the first time. Standardised workflows with automated data capture remove most of that rework without any new equipment. It is unglamorous, cheap and delivers more margin improvement than most capital investment does. Standardisation is the cheapest margin available in this business.

Portfolio Architecture for Margin Defence

Margin follows what cannot be replicated quickly. A transfection reagent sold from a catalogue earns consumable margins because several suppliers make an equivalent product. A cell line development programme delivered on a fourteen week timeline earns considerably more, because timeline reliability rests on automation and trained scientists that competitors cannot assemble in a hurry. Expression system royalties earn most of all and are increasingly refused by sponsors.
The tension is that the highest margin term is the one customers most resent. Royalty-bearing licences capture value across a product's commercial life and cost the licensor programmes it never wins. Fixed-fee licensing wins the work and forfeits the upside. Suppliers offering both structures let the sponsor choose, which is commercially sensible and means the profitable version is selected only by sponsors who lacked alternatives at the time.

High-value pools sit in three places. Automated screening platforms, where lifetime manufacturing savings justify equipment prices that development budgets resist. Integrated development and manufacturing, which removes a technology transfer sponsors would rather avoid entirely. And biosimilar characterisation capability, which is analytically demanding, well funded and follows a different cycle from venture-backed biotech.

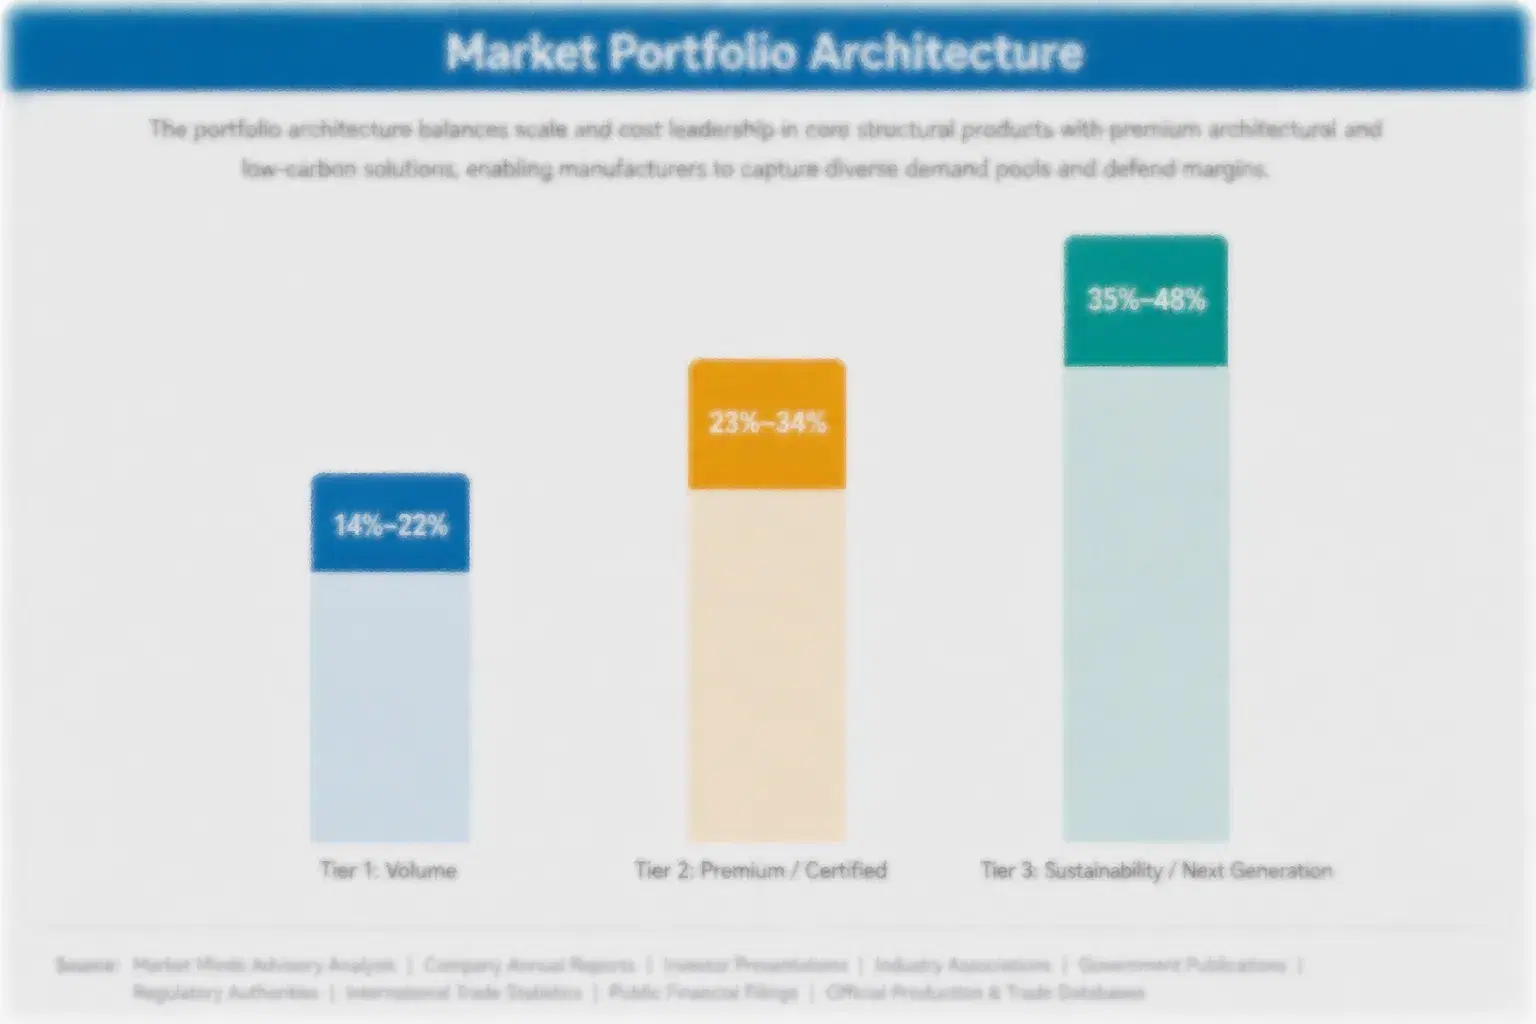
Volume / Commodity-Adjacent

Transfection reagents, selection agents, standard media and general laboratory consumables sold from catalogues. The 7-point range separates suppliers manufacturing their own formulations from those reselling. Several suppliers make equivalent products and purchasing departments know it.
Gross Margin: 34-41%

Premium / Certified

Outsourced development programmes, cell banking and characterisation services delivered under quality agreements supporting regulatory filings. The 7-point spread separates suppliers with proven timeline reliability from those competing on programme price. Delivery record rather than technical claim holds this pricing in place.
Gross Margin: 52-59%

Sustainability / Regulatory / Next-Generation

Automated screening platforms, clonality assurance instruments and royalty-bearing expression system licences. The 13-point range is unusually wide because instrument sales price on capital equipment logic while licences price on participation in commercial product revenue, and the two share no economic basis at all.
Gross Margin: 62-75%
cell-line-development-market-portfolio-architecture-1787683787314

High-value Sub-segments and Strategic Watch-out

Royalty-Bearing Expression Licences

Highest value by a wide margin and increasingly refused by sponsors who dislike a charge arriving when revenue finally does. Newer entrants win programmes on royalty-free terms against systems with better performance histories. The risk is losing the programme entirely, which forfeits both the fee and the royalty at once.
Gross Margin: 72-75%

Automated Screening Platforms

High value with the fastest growth in the market, justified by manufacturing savings across a product lifetime rather than by development efficiency. The constraint is budgetary rather than technical, since development budgets resist equipment whose benefit arrives in manufacturing several years afterward. Whoever owns both budgets has to be reached.
Gross Margin: 65-68%

Standard Reagents And Media

The volume core, purchased continuously by every programme and differentiated by almost nothing. Several suppliers make equivalent formulations and procurement functions tender them annually without much ceremony. Most technology suppliers keep the line to hold account relationships carrying better products alongside. Nobody defends this line seriously.
Gross Margin: 35-38%

Venture-Funded Programme Exposure

The strategic watch-out. Most contract development revenue depends on biotech companies whose funding arrives in cycles this market feels roughly nine months before anybody downstream does. The risk is capacity and scientist headcount committed against programme starts that stop at source without warning. Recovery arrives correspondingly late.
Gross Margin: 54-57%

Why The Clone Keeps Paying

A cell line delivered once generates revenue for as long as the product it makes remains on the market, provided the supplier holds a royalty or a manufacturing position attached to it. Where neither exists, the programme is a single transaction and the relationship ends at delivery. That distinction explains most of the margin difference across this market.
Stickiness varies by what follows the development work. A sponsor whose cell line was developed by the same organisation that will manufacture the product essentially never changes, because a technology transfer costs more than any commercial dispute is worth. A sponsor who took development alone reassesses at every subsequent stage. Reagent and instrument relationships persist through documentation inertia rather than loyalty, since changing a validated material means updating a regulatory filing.

The buyer is changing in a way that matters. Development decisions once sat with process science teams who evaluated technical merit carefully. Increasingly a programme manager under financing pressure decides on timeline alone, and procurement negotiates terms afterward. Suppliers whose commercial argument rests on technical superiority are presenting to somebody who has already chosen on weeks and is not reopening it.
cell-line-development-market-end-use-penetration-index-1787683787610

Where The Programme Value Sits

These are among the four positions where our research anticipates prominent divergence between winners and laggards over the coming forecast period. Each is grounded in the demand model, the regulatory perimeter, and the announced capacity pipeline.
01 / TIMELINE COMPRESSION INVESTMENT

Sell weeks to clinic, not cost per programme

A venture-funded biotech that reaches clinic three months earlier reaches its next financing milestone three months earlier, which is worth many multiples of the entire development fee under negotiation. Median timelines have compressed to roughly 14 weeks through automation and parallel processing, and suppliers who funded that compression win programmes at prices competitors call unreasonable without understanding why sponsors accept them. Making that argument requires a commercial organisation that understands biotech financing rather than one quoting cost per programme, which most technical suppliers have simply never built.
02 / LICENSING STRUCTURE CHOICE

Offer both royalty terms and let sponsors choose

Royalties on eventual product sales capture value across a commercial lifetime and cost licensors the programmes that would have generated them, because biotech companies resent a charge arriving exactly when revenue finally does. Royalty-free fixed-fee terms win work from systems with better performance histories, which is how several newer entrants built their positions from nothing. Offering both structures lets the sponsor decide, which concedes roughly 2% of eventual product sales on programmes that would otherwise have gone to a competitor entirely.
03 / LIFETIME COST ARGUMENT

Present screening depth to whoever owns manufacturing

Automated platforms screening 4,800 clones find higher producers than manual picking across a few hundred, and higher titre reduces manufacturing cost on every batch for the product's entire commercial life. The obstacle has never been technical: equipment charges to a development budget while the benefit lands in manufacturing years later, and organisations budgeting those separately stall the decision indefinitely. Suppliers who learned to build the lifetime argument and present it to whoever owns both budgets convert purchases that had been stalled for years.
04 / CYCLE EXPOSURE BALANCING

Add biosimilar work to smooth the funding cycle

Cell line development sits at the front of the biologics pipeline, which means a biotech funding contraction stops programme starts here roughly nine months before it reaches anything downstream and recovery arrives correspondingly late. Biosimilar development follows a completely different funding logic, driven by patent expiry calendars rather than by venture appetite, and roughly 240 such programmes begin annually. Building the analytical characterisation capability biosimilars demand serves a customer base whose cycle does not correlate with venture-backed biotech at all.

Engagement Snapshot From the Field

A live engagement with an industry participant carrying material or product regulatory and market exposure ahead of a defining policy shift, showing how our research translates into a defensible multi-year portfolio strategy.
MARKET MINDS ADVISORY · CLIENT ENGAGEMENT SUMMARY
Cell Line Development Producer Strategic Portfolio Review and Transition Roadmap 2026·Investment Scenario on Cell Line Development Exposure Evaluation 2025-26
CLIENT PROFILE
A European contract development organisation delivering cell line programmes and early process development from 2 sites, with revenue reported at 180 million euros (client-reported, unverified by MMA). Roughly 74% of revenue came from venture-funded biotechnology sponsors. Its commercial organisation quoted programmes on scope and price, and its median gene to master cell bank timeline stood at 22 weeks against Asian competitors quoting considerably less.
STRATEGIC CHALLENGE
Programme wins had declined for five consecutive quarters and the commercial team attributed it to Asian price competition. Scientific leadership believed the work was better and the market had stopped valuing quality. Nobody had asked losing sponsors why they had chosen elsewhere, so both explanations had survived a year without any evidence supporting either one.
MMA APPROACH
MMA interviewed sponsors who had selected competitors, asking specifically what decided each award rather than what they generally valued, which the company had never done systematically. Sixteen expert interviews across biotech and larger pharmaceutical sponsors established how programme decisions are actually made. The analysis treated timeline rather than price as the likely deciding variable in these awards.
KEY FINDINGS
  1. Timeline decided 71% of lost awards and price was named as decisive in under a tenth of them, which reversed the commercial team's entire explanation.
  2. The company's 22 week median compared against competitors quoting 14, and sponsors described that gap in financing milestones rather than in scientific terms.
  3. Manual clone handling accounted for most of the timeline difference, and the capital required to automate it was smaller than a single quarter of lost revenue.
  4. Venture-funded sponsors at 74% of revenue left the company fully exposed to a funding cycle it had no other business to offset (client-reported, unverified by MMA).
CLIENT PROFILE
A European contract development organisation delivering cell line programmes and early process development from 2 sites, with revenue reported at 180 million euros (client-reported, unverified by MMA). Roughly 74% of revenue came from venture-funded biotechnology sponsors. Its commercial organisation quoted programmes on scope and price, and its median gene to master cell bank timeline stood at 22 weeks against Asian competitors quoting considerably less.
STRATEGIC CHALLENGE
Programme wins had declined for five consecutive quarters and the commercial team attributed it to Asian price competition. Scientific leadership believed the work was better and the market had stopped valuing quality. Nobody had asked losing sponsors why they had chosen elsewhere, so both explanations had survived a year without any evidence supporting either one.
MMA APPROACH
MMA interviewed sponsors who had selected competitors, asking specifically what decided each award rather than what they generally valued, which the company had never done systematically. Sixteen expert interviews across biotech and larger pharmaceutical sponsors established how programme decisions are actually made. The analysis treated timeline rather than price as the likely deciding variable in these awards.
KEY FINDINGS
  1. Timeline decided 71% of lost awards and price was named as decisive in under a tenth of them, which reversed the commercial team's entire explanation.
  2. The company's 22 week median compared against competitors quoting 14, and sponsors described that gap in financing milestones rather than in scientific terms.
  3. Manual clone handling accounted for most of the timeline difference, and the capital required to automate it was smaller than a single quarter of lost revenue.
  4. Venture-funded sponsors at 74% of revenue left the company fully exposed to a funding cycle it had no other business to offset (client-reported, unverified by MMA).
RECOMMENDED STRATEGY
Phase 1: Phase one: automate clone handling and imaging immediately, targeting the timeline gap rather than any reduction in programme cost or headcount. Phase 2: Phase two: rebuild commercial messaging around weeks to clinic and financing milestones, and retrain the team to make that argument properly. Phase 3: Phase three: build biosimilar characterisation capability to add a customer base that follows patent calendars rather than venture funding cycles.
OUTCOME
Automation cut the median timeline from 22 weeks to 15 within a year and programme wins recovered above the previous peak. Sponsors accepted higher pricing once the argument moved to timeline (client-reported, unverified by MMA). Biosimilar capability is being built and now represents a growing minority of the order book.

Frequently Asked Questions

Foundational context covering the market sizes, CAGR, scope, country, region and competition that inform every finding below. This section is provided to cover basics and most often pre-purchase conversations, answered from the MMA Primary Research Dataset.

What is the current size of the Cell Line Development Market?

The market was worth 5.6 billion dollars in 2025, covering expression systems, transfection, cloning, screening, banking and outsourced development programmes. It reaches 6.2 billion dollars in 2026 on current forecasts.

How large will the Cell Line Development Market be by 2036?

MMA forecasts 16.3 billion dollars by 2036, an increase of 10.1 billion dollars over the 2026 base. That represents an expansion multiple of 2.63 times across the forecast period.

What is the CAGR for the Cell Line Development Market 2026 to 2036?

The base case compounds at 10.2% annually. MMA's bull case reaches 11.4% if biosimilar programme volume expands quickly, while the bear case sits at 9.0% on a prolonged biotech funding drought.

Which segment is growing fastest?

Automated clone screening and selection, at 15.3%, half again the market rate of 10.2%. Screening several thousand candidates rather than a few hundred simply finds better clones.

Who are the major companies in the Cell Line Development Market?

Lonza, WuXi Biologics, Samsung Biologics, Thermo Fisher Scientific and Sartorius lead on disclosed bioprocessing and biologics services revenue. Danaher, Merck KGaA, Catalent, ProBioGen and Charles River compete within specific workflow steps.

Which country is growing fastest?

China at 13.4%, driven by contract development capacity built faster than anywhere else and by a domestic biologics pipeline expanding quickly. India follows on biosimilar programme volume.

Report Segmentation Architecture

The full report scope spans multiple orthogonal segmentation dimensions, with cross-tabulated demand data provided for each dimension pair. Coverage extends further to regional breakdowns, trend trajectories, and the competitive detail needed to support segment-level decision-making.

By Development Workflow Step

  • Host Cell Line and Expression System Licensing
  • Transfection and Selection
  • Single-Cell Cloning and Clonality Assurance
  • Automated Clone Screening and Selection
  • Cell Banking and Characterisation
  • Outsourced Development Programmes

By End-Use Industry

  • Venture-Funded Biotechnology
  • Large Pharmaceutical Companies
  • Biosimilar Developers
  • Contract Development Organisations
  • Academic and Institutional Research
  • Government and Public Health Programmes

By Commercial Dimension

  • Fixed-Fee Programme Contract
  • Royalty-Bearing Licence
  • Royalty-Free Licence
  • Instrument Capital Purchase
  • Reagent Supply Agreement
  • Integrated Development and Manufacturing

By Region

  • North America
  • Western Europe
  • East Asia
  • South Asia and Pacific
  • Latin America
  • Middle East and Africa
  • Eastern Europe

Scope, Methodology, and Coverage

Every figure in this report is reproducible from documented input assumptions. The scope below maps the historical period, the forecast horizon, the segmentation dimensions, and the countries covered, alongside the underlying primary and qualitative methodology.
Historical Period
2020 to 2025
Forecast Period
2026 to 2036
Base Year
2025 (USD billions; MMA Primary Research Dataset, August 2026)
Market Definition
Scope covers the technologies, reagents, instruments and services used to generate stable, clonally derived, well-characterised production cell lines for biologics manufacturing, spanning host cell line and expression system licensing, transfection and selection, single-cell cloning and clonality assurance, automated clone screening and selection, cell banking and characterisation, and fully outsourced development programmes. Cell and gene therapy manufacturing, upstream bioreactor hardware, downstream purification and drug substance manufacture are excluded. Analytical instruments sold for purposes unrelated to cell line development fall outside the boundary.
Quantitative Units
USD billions (current prices); development programmes completed; cell banks generated; clones screened; weeks from gene to bank
Segmentation Dimensions
By Development Workflow Step; By End-Use Industry; By Commercial Dimension; By Region
Regions Covered
North America, Western Europe, East Asia, South Asia and Pacific, Latin America, Middle East and Africa, Eastern Europe
Countries Covered
USA, China, Germany, France, UK, Japan, South Korea, India, Brazil, Mexico, Italy, Spain, Poland, Saudi Arabia, South Africa
Key Companies Profiled
Lonza, WuXi Biologics, Samsung Biologics, Thermo Fisher Scientific, Sartorius, Danaher, Merck KGaA, Catalent, Fujifilm Diosynth Biotechnologies, Charles River Laboratories, ProBioGen, Revvity, Bruker, Molecular Devices, Advanced Instruments, Agilent Technologies, Boehringer Ingelheim, AGC Biologics, JSR Life Sciences, Bio-Techne
Quantitative Methodology
Primary survey, n=3,800 respondents, Q4 2025, six countries; demand-side model with trade association cross-validation
Qualitative Methodology
47 expert interviews, Q4 2025; applied to validate demand model assumptions, identify emerging dynamics, and assess competitive positioning
Report Format
PDF and XLSX data workbook (Word format preview document)
Publisher
Market Minds Advisory
Report Code
MMA-2026-MED-144
Published
August 2026
Contact
sales@marketmindsadvisory.com | www.marketmindsadvisory.com

Purchase the full Cell Line Development Market Report (2026 to 2036).

The full report runs to 190 pages and covers all six workflow step segments, seven regions and 20 profiled companies in detail. It includes the complete segment CAGR set, regional programme volume and capacity data, and timeline benchmarking across contract development suppliers. Company profiles carry evaluation on disclosed bioprocessing and biologics services revenue, with moat and risk assessment for the top five participants. The competitive section extends to 16 tracked corporate developments across 2024 and 2025, each with commercial interpretation. Primary research inputs include a quantitative survey of 3,800 respondents and 47 expert interviews conducted in Q4 2025.
Six workflow step segments with individual CAGR forecasts
Seven regional markets with programme volume and capacity data
Twenty company profiles on consistent revenue evaluation basis
Sixteen tracked corporate developments with commercial interpretation notes
Timeline benchmarking across competing contract development suppliers
Licensing structure comparison by expression system and provider

Built For The People Who Decide

From boardroom strategy to bench-side execution, this report is read cover-to-cover by leaders shaping the next decade of their industry, turning demand scenarios, market dynamics and valuation benchmarks into decisions.
CXOs/ Presidents/ VPs/ Managers
M&A and Corporate Development
Strategy Teams and R&D Heads
Procurement and Product Directors
Regulatory and Compliance Leaders
Investor Relations and Equity Analysts