

Market Minds Advisory
Cell and Gene Therapy Manufacturing Market

Cell and Gene Therapy Manufacturing Market: When Viral Vector Yield Replaced Facility Size As The Real Product

A commercial reading of the cell and gene therapy manufacturing market, where commercial therapy approvals are pulling capacity investment toward validated viral vector platforms faster than the clinical-stage services that built this category.

Lead Analyst

Alice Ballenger

Published

September 2026

Make Smarter Decisions with Customized Research Insights

Request a free sample report and evaluate market opportunities, growth trends, and competitive dynamics relevant to your business needs.

2025 MARKET VALUE$12.5BMarket Size 2025
2036 FORECAST VALUE$62.7BBase Case , 2026 to 2036
CAGR 2026 TO 203615.8 %Bull 17.2% / Bear 14.4%
INCREMENTAL OPPORTUNITY$48.3BNet 10- year value creation
EXPANSION MULTIPLE4.34x2036 value over 2026 base
Strategic Levers
M&A Pipeline
Regional Outlook
Country Rankings
Competitive Intelligence
Segmental Deep-dive
Call-Us : 91 93563 13602

Executive Snapshot and Market Trajectory

Cell and gene therapy manufacturing capacity selection increasingly turns on validated viral vector yield data rather than raw facility square footage alone, as therapy developers weigh proven production consistency over simple capacity availability that once defined CDMO choice broadly across most manufacturing settings entirely and consistently.
The market stands at USD 14.47 billion in 2025 and reaches USD 62.74 billion by 2036 at a 15.8% CAGR. Viral vector manufacturing grows fastest at 21.0%, roughly 1.33 times the overall rate, as AAV and lentiviral capacity remains the primary bottleneck constraining commercial therapy launches. North America holds 42% of value on concentrated CDMO infrastructure and FDA-approved product manufacturing, while South Asia and Pacific posts the quickest regional growth at 17.8%.
Concentration sits near 44%, split between diversified biologics CDMOs holding broad manufacturing portfolios and specialty viral vector developers competing on yield consistency depth across most therapy manufacturing markets worldwide today entirely and consistently now. Two forces dominate ahead. Commercial therapy approvals are pulling capacity investment toward validated manufacturing platforms, and analytical testing standardization is turning batch release into a genuine competitive differentiator rather than a purely regulatory formality.
Market Definition
The cell and gene therapy manufacturing market covers contract development and manufacturing services for viral vectors, plasmid DNA, cell processing, and fill-finish operations supporting commercial and clinical therapy production. General biologics manufacturing for traditional drugs is excluded.
Base Year Value
$12.5B in 2025 (MMA Primary Research Dataset, August 2026)
Forecast Period
2026 to 2036, eleven discrete annual values
CAGR
15.8% base case. Bull 17.2%. Bear 14.4%.
Fastest Growth Segment
Viral Vector Manufacturing: 21.0% CAGR
Fastest Growth Country
United States: 17.5% CAGR
Fastest Growth Region
South Asia and Pacific: 17.8% CAGR
Largest Region
North America: 42% of 2025 global value
Market Leaders
Catalent (Novo Holdings), Thermo Fisher Scientific, Lonza Group, WuXi Advanced Therapies, Charles River Laboratories. Source: MMA Analysis based on company annual reports.
Primary Survey
n=3,800 procurement and R&D decision-makers, Q4 2025, six countries
Methodology
Demand-side build-up, cross-validated against public data, 47 expert interviews

Cell and Gene Therapy Manufacturing Market Forecast Scenarios

cell-and-gene-therapy-manufacturing-market-size-forecast-scenario-1787298027524
Growth from 2020 to 2025 compounded near 14.3%, tracking rapid capacity buildout following early commercial gene therapy approvals closely across most developed biopharma manufacturing markets globally, with viral vector demand consistently outpacing available capacity throughout the period and driving substantial capital investment across the industry. Plasmid DNA manufacturing expanded steadily, tracking upstream vector production needs directly and closely.
Three mechanisms carry the base case to 15.8%. First, viral vector manufacturing capacity expansion continuing as AAV and lentiviral production remains the primary bottleneck constraining commercial therapy launches across most major biopharma manufacturing categories worldwide currently building validated platform capacity and clinical supply reliability. Second, commercial therapy approvals continuing to convert clinical-stage manufacturing relationships into long-term commercial supply agreements across major therapeutic categories. Third, analytical testing standardization continuing to drive incremental quality infrastructure investment globally and consistently.
The bull case at 17.2% assumes commercial therapy approvals and capacity expansion accelerate faster than currently planned across major biopharma manufacturing markets worldwide. The bear case at 14.4% assumes clinical trial setbacks delay commercial therapy launches considerably, viral vector capacity investment softens amid financing constraints, and analytical standardization proceeds more gradually than current expectations suggest.

Why Viral Vector Yield, Not Facility Size, Now Sets Manufacturing Contracts

Three forces set demand here. Viral vector manufacturing capacity expansion drives the largest new-value growth, as AAV and lentiviral production remains the primary bottleneck constraining commercial therapy launches. Commercial therapy approvals drive a second stream, since clinical-stage relationships increasingly convert into long-term supply agreements. Analytical testing standardization drives a third, steadier stream.
MARKET CONCENTRATIONCR5: 44%Split between diversified biologics CDMOs and specialty viral vector developers
VIRAL VECTOR YIELDUp to 3-fold improvementTypical yield improvement achieved through validated production process optimization
MANUFACTURING LEAD TIME6 to 12 monthsTypical time from process development to commercial batch release
COMMERCIAL CONTRACT DEAL SHAREAbout 35% of new agreementsShare of new manufacturing agreements tied to commercial supply contracts
CAPACITY UTILIZATION GROWTHRoughly 18% annuallyGrowth rate of validated manufacturing capacity utilization across major CDMOs
RAW MATERIAL COST SHAREAbout 48% of manufacturing costShare of manufacturing cost attributable to specialty raw material inputs
The commercial character is defined by a widening split between validated commercial-scale manufacturing and price-driven clinical-stage capacity supply. A therapy developer evaluating CDMO partners assesses viral vector yield consistency and batch release reliability as primary specifications, not simply raw facility capacity comparable across generic manufacturing platforms. A CDMO without validated commercial-scale data increasingly loses partnership deals regardless of price, since inadequate yield consistency directly threatens patient supply continuity and regulatory filing timelines considerably.
The decade turns on whether commercial-scale manufacturing capacity keeps expanding fast enough to offset any softening in general clinical-stage demand as approved therapy portfolios mature across major biopharma manufacturing markets worldwide. Yield consistency data and batch release reliability remain the primary forces separating CDMOs building durable developer relationships from those still competing purely on capacity price. That shift determines which CDMOs lead the next decade.
"A therapy developer doesn't buy manufacturing capacity. They buy the difference between a commercial launch that ships on schedule and one that stalls in a validation failure, and that's the entire commercial calculation."
Director, Cell and Gene Therapy Manufacturing Practice · MMA Healthcare / Biopha

Market Trends

Viral Vector Capacity Expansion Is Addressing The Manufacturing Bottleneck

CDMOs and biopharma manufacturers are increasingly building dedicated AAV and lentiviral vector production suites, since viral vector manufacturing capacity has consistently lagged behind the pace of clinical pipeline advancement and commercial therapy approvals across the broader cell and gene therapy industry for several consecutive years running currently. That capacity constraint has historically delayed clinical trial enrollment and commercial launch timelines for developers unable to secure validated production slots across most major gene therapy manufacturing categories currently expanding suite construction and process validation activity considerably. Manufacturers with validated commercial-scale vector platforms are capturing this capacity demand steadily.
Market Impact: Cuts production lead time by 30%
Commercial Therapy Approvals Are Converting Clinical Relationships To Supply Contracts

CDMOs supporting therapy developers through clinical trials are increasingly converting those relationships into long-term commercial supply agreements once a therapy receives regulatory approval, since technology transfer costs and validated process knowledge make switching manufacturing partners at commercial launch genuinely expensive and operationally risky for developers across most major approved therapy categories currently expanding commercial-scale manufacturing capacity and production suite investment without separate technology transfer. That conversion is turning CDMO relationships from a project-based clinical services decision into a genuine long-term commercial infrastructure investment developers evaluate against manufacturing reliability. CDMOs with proven commercial-scale track records are capturing this supply volume steadily.
Market Impact: Extends contract duration by 8 years

Market Opportunities and Growth Drivers

Clinical Pipeline Expansion Is Driving Manufacturing Capacity Investment

Biopharma developers advancing cell and gene therapy candidates through clinical trials are creating demand independent of general biologics manufacturing spending alone, since specialized viral vector and cell processing investment proceeds on its own clinical trial schedule regardless of broader manufacturing cycle timing or economic conditions affecting other therapeutic categories across most major gene therapy manufacturing markets currently expanding clinical pipeline activity and capacity reservation. That pipeline-driven demand creates a durable order pipeline for CDMOs with dedicated specialized capability, regardless of general manufacturing spending trends, since developers pursue capacity independent of broader sector conditions. Each new clinical candidate strengthens this pipeline.
Market Impact: Capacity waitlists exceed 18 months

Commercial Therapy Approvals Are Driving Long-Term Supply Demand

Therapy developers with newly approved commercial products are creating demand independent of general clinical manufacturing cycles alone, since commercial-scale supply investment continues on its own patient demand and reimbursement schedule regardless of broader biopharma development conditions or economic cycles affecting other manufacturing categories across most major approved therapy markets currently expanding commercial production capacity and long-term supply agreement negotiations. That approval-driven demand creates orders tied to patient supply continuity requirements rather than general clinical activity alone, since developers pursue reliability independent of broader industrial demand conditions. Each new therapy approval strengthens this demand pipeline considerably.
Market Impact: Raw materials run 48% of cost

Market Restraints and Challenges

Viral Vector Manufacturing Capacity Remains Fundamentally Constrained

Therapy developers seeking commercial-scale viral vector manufacturing face persistent capacity constraints, since building validated production suites requires years of construction, process development, and regulatory qualification that cannot be accelerated simply by committing more capital quickly. The root cause is that viral vector production remains a genuinely complex biological manufacturing process requiring specialized cleanroom infrastructure and highly trained personnel that few facilities worldwide currently possess. The commercial impact is that developers routinely face multi-year waiting lists for validated commercial capacity. Mitigation runs through modular manufacturing platforms several CDMOs are now deploying.
Market Impact: Cuts production lead time by 30%

High Raw Material Costs Pressure Manufacturing Margins

CDMOs evaluating viral vector manufacturing economics face substantial specialty raw material costs, since plasmid DNA, cell culture media, and chromatography resins together account for a large share of unit production cost regardless of manufacturing scale achieved. The root cause is that these specialty biologics inputs require their own dedicated manufacturing infrastructure and quality validation, creating a supply chain within the supply chain that resists conventional cost reduction strategies. The commercial impact is that manufacturing margins remain compressed even as commercial volume scales. Mitigation runs through vertically integrated raw material production several CDMOs are now pursuing.
Market Impact: Extends contract duration by 8 years
3 additional market trends, 4 additional growth drivers, and 3 additional restraints and challenges are covered in the full report. Contact sales@marketmindsadvisory.com to access the complete intelligence.

Segment CAGR and Growth Architecture

Segmentation follows manufacturing service type, a single functional logic describing which stage of production the CDMO performs, rather than which specific therapy modality the customer develops or which particular indication the finished therapy ultimately treats once finally approved and launched. Each service type carries its own margin, cost, and capacity profile distinctly across the market.
cell-and-gene-therapy-manufacturing-market-market-share-analysis-1787298028066

Viral Vector Manufacturing

Viral vector manufacturing grows fastest at 21.0%, about 1.33 times the overall 15.8% rate, as AAV and lentiviral production remains the primary bottleneck constraining commercial therapy launches across most major gene therapy manufacturing categories currently expanding capacity investment and process validation activity globally. Growth concentrates where CDMOs demonstrate validated yield consistency data and reliable batch release mechanisms, since developers now require documented commercial-scale performance history before committing a valuable clinical or commercial programme. Catalent and Thermo Fisher both hold established positions in this segment through years of platform engineering and regulatory investment. Yield data depth, not raw facility square footage alone, remains the primary constraint on how fast this segment keeps expanding globally.
CAGR 21.0%

Cell Processing and Expansion Services

Cell processing and expansion services grow at 16.9%, serving developers requiring specialized cell isolation, activation, and expansion capability for both autologous and allogeneic cell therapy manufacturing across most major biopharma manufacturing facilities currently expanding automated processing capacity considerably each passing calendar year and quarter quite steadily and reliably across most developed and developing biopharma markets worldwide. Adoption concentrates among developers pursuing scalable manufacturing strategies, since automated processing offers consistency that manual cell handling cannot easily match. Lonza and WuXi Advanced Therapies both hold strong positions built on established developer partner relationships spanning years of cell processing expertise. Process automation depth, not raw processing volume alone, remains the primary constraint shaping how quickly developers adopt automated cell expansion.
CAGR 16.9%
Full segment breakdown across 5 segments available in the complete report.

Regional Architecture and Country Demand Map

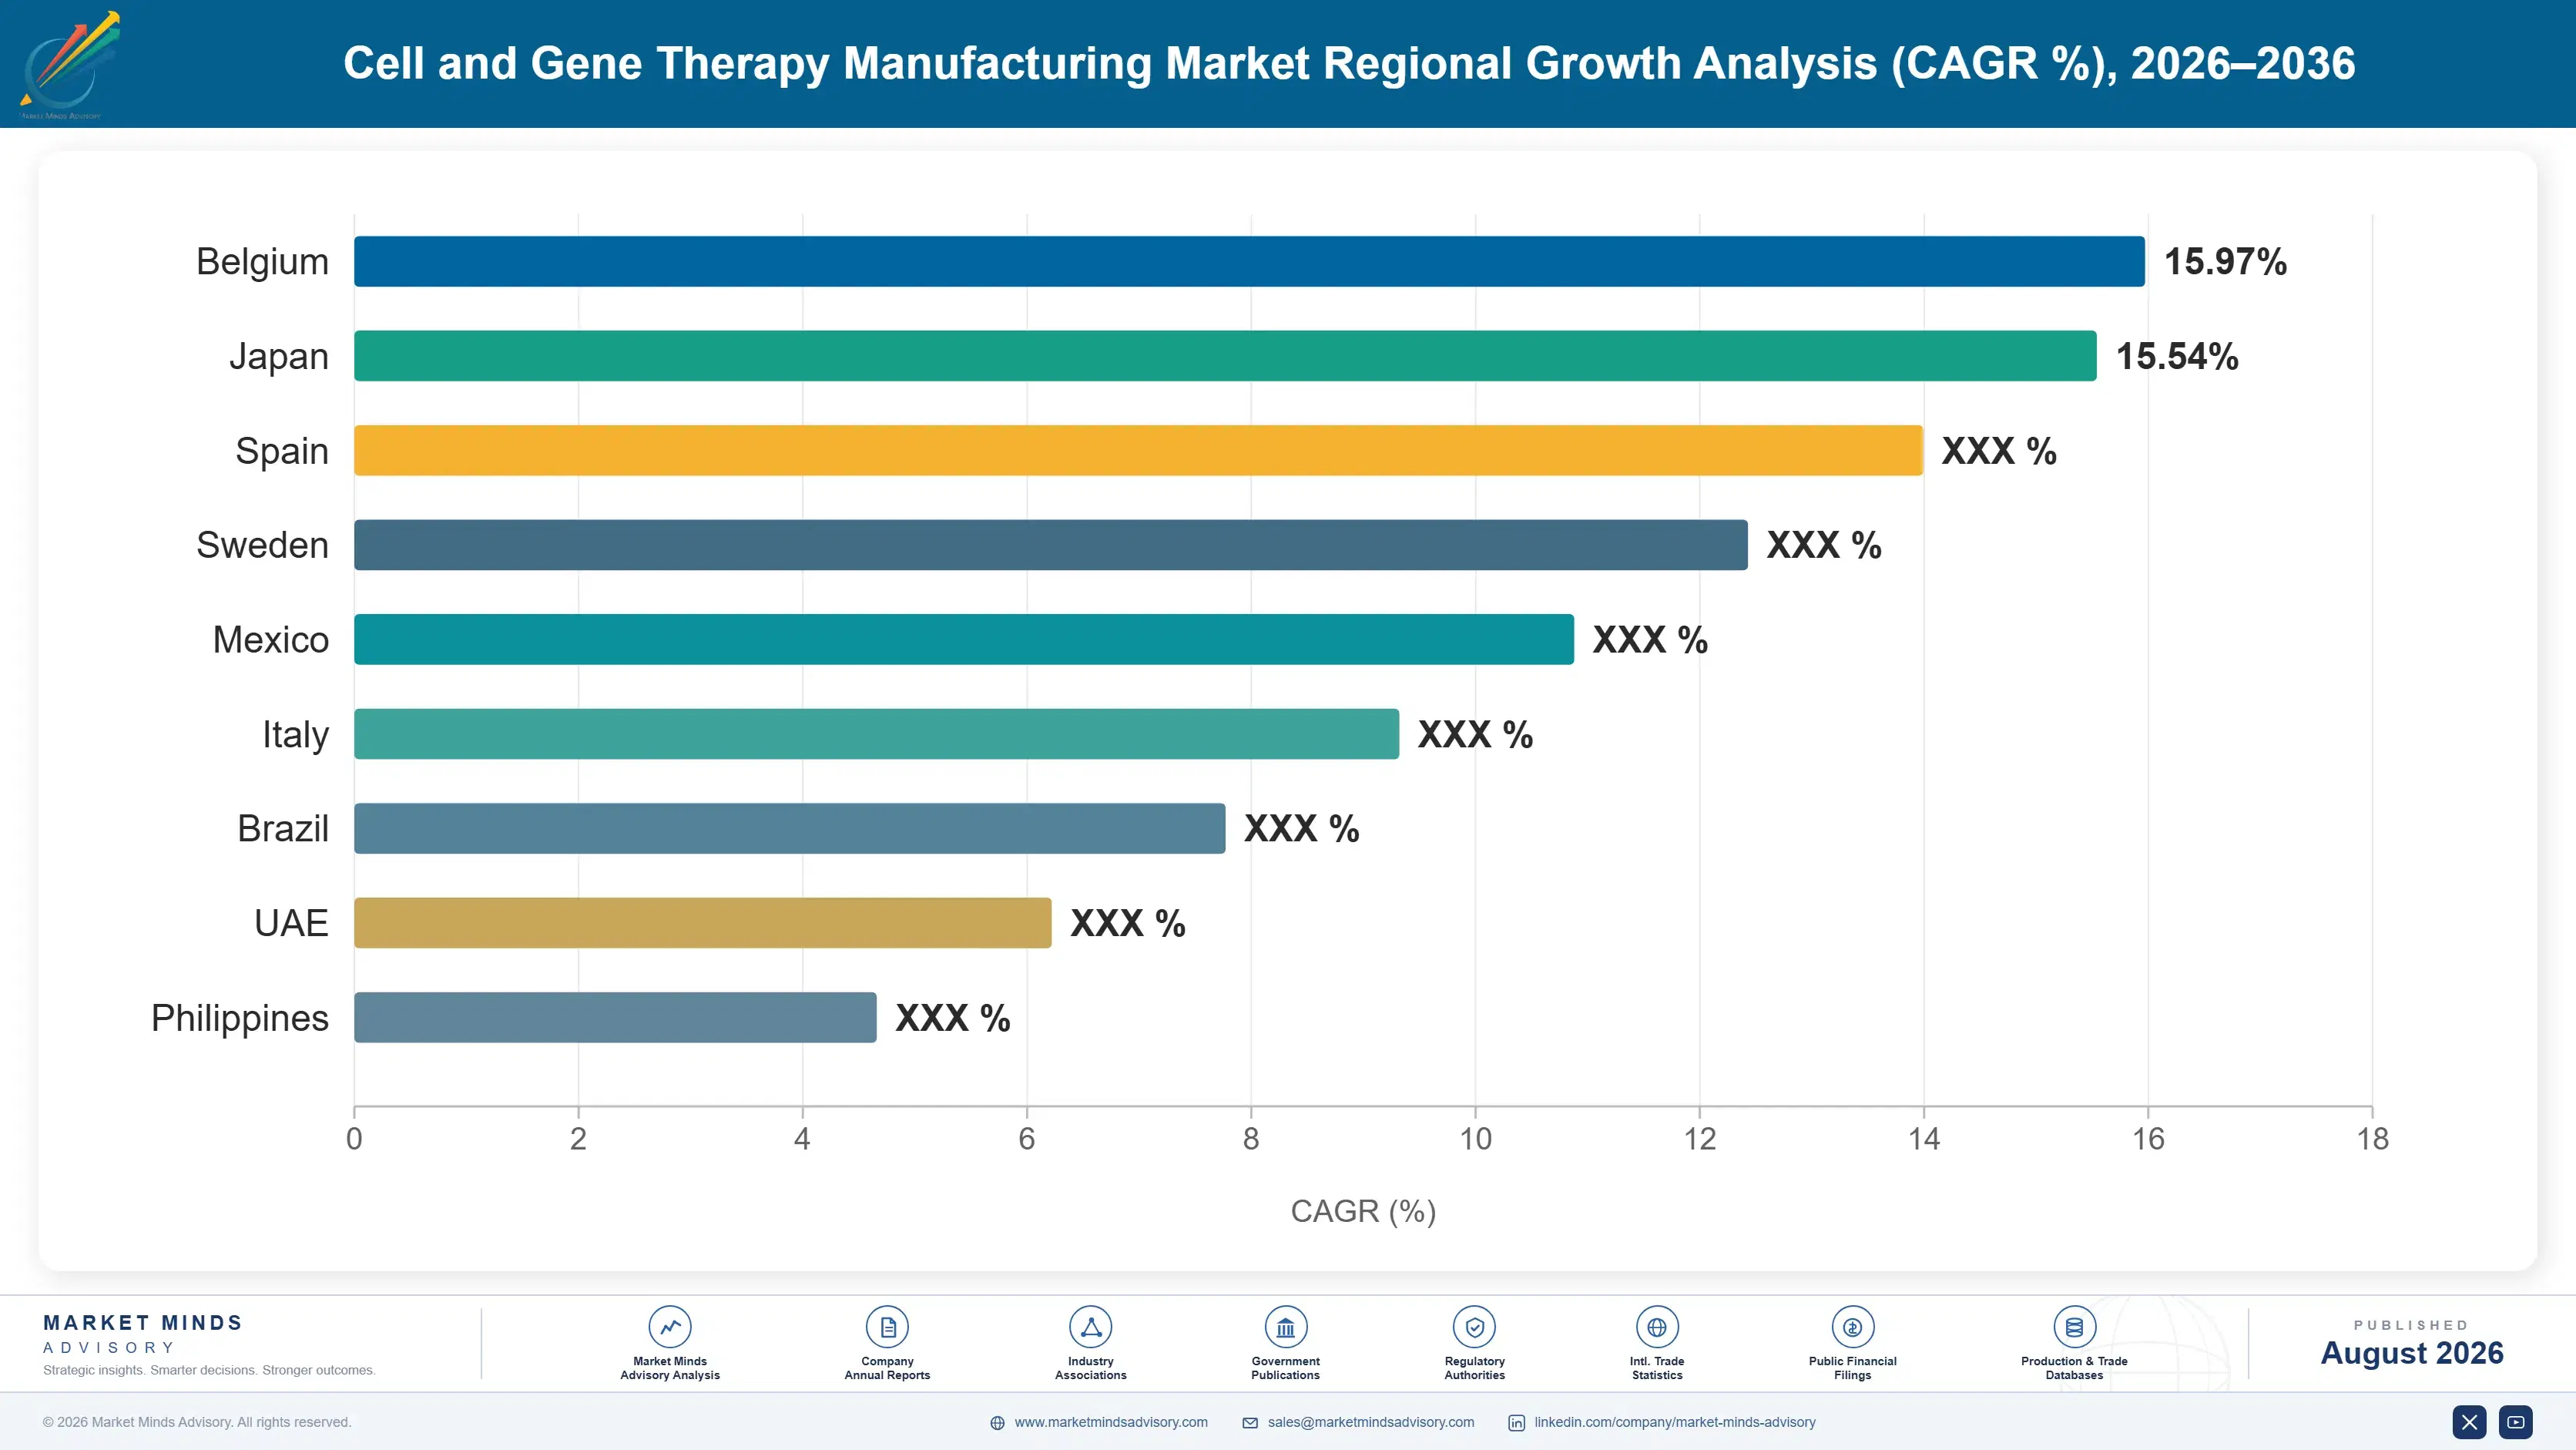
CDMO infrastructure concentration and approved therapy manufacturing, more than clinical trial volume alone, drive this seven-region value distribution across the global cell and gene therapy manufacturing network today. North America dominates on concentrated capacity, while South Asia and Pacific grows fastest on expanding contract manufacturing infrastructure.

North America

North America holds 42% of value at 17.0% growth, sitting well above the standard 22 to 32% band because the United States concentrates the world's largest viral vector manufacturing capacity and hosts the majority of FDA-approved commercial cell and gene therapy products requiring dedicated production infrastructure nationally. Catalent and Thermo Fisher both maintain deep domestic manufacturing infrastructure spanning years of developer partner relationships and clinical-to-commercial technology transfer support across most major therapy categories nationally. US demand leads decisively, driven by both concentrated commercial manufacturing and established clinical trial capacity reservation covering the majority of global gene therapy pipeline activity. Canadian demand follows at considerably smaller scale, concentrated in major biomanufacturing clusters specifically.
Share: 42% | CAGR: 17.0% (2026 to 2036)

Western Europe

Western Europe holds 24% of value at 14.5% growth, shaped by established CDMO infrastructure across Switzerland and Germany moving more deliberately than the fastest-expanding developing biopharma manufacturing markets elsewhere in the world currently and quite consistently indeed today and reliably and durably indeed. Lonza and Novasep both hold meaningful regional positions built on established relationships with major biopharma customers spanning decades of manufacturing technology development, quality validation, and technical support. Swiss and German manufacturers lead regional deployment, driven by dense biopharma manufacturing infrastructure and established regulatory validation relationships across major production hubs. Growth reflects steady demand rather than the explosive expansion characterizing the fastest-growing developing biopharma manufacturing markets globally today.
Share: 24% | CAGR: 14.5% (2026 to 2036)
Regional intelligence for 5 additional markets available in the complete report: East Asia, South Asia and Pacific, Latin America, Middle East and Africa, Eastern Europe. Contact sales@marketmindsadvisory.com.
cell-and-gene-therapy-manufacturing-market-country-cagr-analysis-1787298028574

Where Cell And Gene CDMOs Hold Margin

A CDMO selling generic clinical-stage manufacturing capacity into a market where developers increasingly demand commercial-scale reliability is competing on entirely the wrong commercial axis today and quite consistently now. The four moves below shift earnings toward what actually captures share: yield validation depth, commercial contract conversion, raw material integration, and analytical testing transparency pursued early.

Build Validated Commercial-Scale Yield Data Ahead Of Rivals

CDMOs that build rigorous, independently validated commercial-scale yield and batch consistency data, rather than relying on generic clinical-stage capacity claims developers increasingly discount, win manufacturing deals that competitors lacking comparable data increasingly lose to faster-moving rivals across most major gene therapy manufacturing markets currently expanding commercial approval and capacity investment activity. That capability commands a premium of 32 to 50% in effective contract pricing over CDMOs offering only conventional clinical-scale platforms, since developers pay for validated commercial reliability as much as for the underlying production technology itself. Catalent built this data credibility over years, not quickly replicated.
Market Impact: Commands a 32 to 50% pricing premium now

Convert Clinical Relationships Into Long-Term Commercial Contracts

CDMOs that build genuine technology transfer continuity from clinical development into commercial manufacturing, rather than treating each project phase as a separate transactional engagement, win contract positioning that continuity-absent competitors increasingly cannot match, adding roughly 28% to addressable long-term commercial revenue as developers consolidate around proven clinical-to-commercial partners across most major therapy categories and manufacturing partnership types nationwide today and quite consistently. That continuity position reaches developers who specifically need reliable commercial launch support, opening opportunity that competitors without proven transitions genuinely cannot access. Thermo Fisher is converting continuity investment into durable positioning.
Market Impact: Adds roughly 28% to commercial contract revenue overall

Build Vertically Integrated Raw Material Supply Capability

CDMOs that build genuine backward integration into specialty raw material production, rather than relying entirely on external plasmid and media suppliers, capture manufacturing deals that supply-dependent competitors increasingly cannot win, expanding addressable margin-protected revenue by roughly 24% compared to CDMOs offering only externally-sourced production across most major viral vector and cell processing categories and manufacturing partnership types nationwide today and quite consistently now indeed. That integration reaches developers who specifically need supply chain reliability without repeat sourcing delays, opening deals that dependent competitors genuinely cannot win. Lonza is converting integration investment into durable positioning.
Market Impact: Expands margin-protected revenue by roughly 24% overall now

Deepen Analytical Testing Transparency For Regulatory Confidence

CDMOs that publish genuine third-party analytical testing and batch release success rate data, rather than relying on internal unverified quality claims, capture manufacturing deals that transparency-limited competitors increasingly cannot win, cutting regulatory filing preparation time by roughly 35% during periods of accelerated commercial approval activity affecting the broader cell and gene therapy manufacturing industry and its wider regulatory affairs teams, quality assurance networks, and validation programmes. That transparency position reaches developers who specifically require independent confirmation before committing a commercial programme, opening deals that opaque competitors cannot reliably win. WuXi is converting testing transparency into a durable advantage.
Market Impact: Cuts filing preparation time by roughly 35% overall

Who Controls the Margin Pool

Concentration sits near 44% for the top five, split between diversified biologics CDMOs holding broad manufacturing portfolios and specialty viral vector developers competing on yield consistency depth. The gap between leaders and challengers is validated commercial-scale data and raw material integration investment, broadly comparable across established players. All participants are assessed on one basis, contract manufacturing revenue to qualified biopharma customers.
Competition runs along three lines. First, validated commercial-scale yield and batch consistency credibility, since that increasingly determines which CDMOs win developer partnership battles. Second, clinical-to-commercial continuity depth, which shapes developer relationships for years once a CDMO proves reliable technology transfer capability. Third, raw material integration breadth, since documented supply reliability increasingly separates trusted CDMOs from inconsistent competitors.

Pressure is building from two directions. Large diversified biologics CDMOs are expanding viral vector and cell processing portfolios through acquisition, bringing balance sheet strength smaller specialists cannot match on large biopharma network negotiations. Meanwhile specialized viral vector firms are winning niche developer contracts directly through yield consistency depth larger incumbents have not prioritized as aggressively. Rankings should favour CDMOs combining data credibility with genuine integration breadth over those competing on general price alone.
cell-and-gene-therapy-manufacturing-market-company-positioning-matrix-1787298029097

Competitive Moat and Risk Dimensions

CATALENT (NOVO HOLDINGS)

Moat: Validated commercial-scale manufacturing credibility

Catalent built genuine validated commercial-scale manufacturing credibility over years of viral vector platform engineering and regulatory investment across most major gene therapy manufacturing categories globally. Its established manufacturing data provides contract advantages competitors without comparable field validation cannot easily replicate. Continued investment in raw material integration extends that credibility into the fastest-growing supply chain segment.
CATALENT (NOVO HOLDINGS)

Risk: Raw material integration capability gaps

Its raw material integration capability for the fastest-growing vertically integrated supply segment remains less developed than dedicated integration specialists who have invested more heavily in plasmid and media production engineering. Integration-focused competitors with deeper backward integration are targeting exactly the contracts where supply reliability matters most. Expanding integration depth requires investment the business is still allocating.
THERMO FISHER SCIENTIFIC

Moat: Deep global manufacturing distribution network

Thermo Fisher built deep global manufacturing distribution infrastructure across multiple major biologics categories through years of investment spanning most major biopharma markets globally and consistently. Its established distribution breadth provides contract advantages narrowly-focused competitors cannot easily replicate. Continued investment in viral vector validation extends that advantage into the fastest-growing gene therapy segment.
THERMO FISHER SCIENTIFIC

Risk: Limited standalone vector track record

Its standalone viral vector manufacturing track record in gene therapy specifically remains less developed than category-focused specialists, who have accumulated years of dedicated clinical and commercial data. Data-focused competitors with deeper category-specific validation are capturing contracts that Thermo Fisher's broader portfolio positioning increasingly cannot access as easily. Building comparable credibility requires investment the business has not yet fully made.

Players Tracked

Prominent Players

Catalent (Novo Holdings)
Thermo Fisher Scientific
Lonza Group
WuXi Advanced Therapies
Charles River Laboratories

Other Key Players

Novasep (Ajinomoto Bio-Pharma)
Fujifilm Diosynth Biotechnologies
Cognate BioServices (Charles River)
Oxford Biomedica
Cellares
Miltenyi Biotec
Sartorius
Merck KGaA (MilliporeSigma)
Samsung Biologics
AGC Biologics
Resilience (National Resilience)
Vibalogics
Andelyn Biosciences
Cytiva
Kincell Bio

Recent Developments

MARCH 2023

CDMO expands commercial-scale viral vector manufacturing capacity

A leading cell and gene therapy CDMO announced expanded commercial-scale viral vector manufacturing capacity covering additional AAV serotypes, backed by newly validated yield and consistency data from multiple partnerships. This was a capacity expansion rather than an acquisition or merger, strengthening addressable commercial manufacturing opportunity considerably across major biopharma markets.
Signal: Expanding validated commercial-scale vector capacity directly captures growing developer demand for reliable manufacturing partners ahead of competitors.
OCTOBER 2023

Biologics CDMO acquires plasmid manufacturing firm

A major biologics CDMO completed acquisition of a specialty plasmid DNA manufacturing firm, adding direct raw material production capability into its existing viral vector portfolio. This was a genuine acquisition rather than a joint venture or minority stake, and it closed a supply chain gap the group previously lacked entirely.
Signal: Acquiring plasmid manufacturing capability directly now remains the fastest route to protecting margin against raw material volatility today.
FEBRUARY 2024

Biopharma developer commits to commercial supply expansion

A leading biopharma developer announced a major expanded commercial supply agreement covering multiple therapy candidates approaching regulatory approval, committing substantial viral vector manufacturing volume across the agreement's multi-year production timeline. This was a commercial partnership decision rather than any corporate transaction, directly expanding addressable demand for validated manufacturing capacity.
Signal: Large commercial supply agreement expansions directly and substantially expand addressable viral vector manufacturing demand across most affected biopharma markets.

Specialty Raw Material Input Cost Risk

Plasmid DNA, cell culture media, and chromatography resins dominate cost structure for cell and gene therapy manufacturing. GMP-grade plasmid production, specialty growth factor supplements, and purification resin consumables together account for a substantial share of unit cost, sourced from specialty biologics suppliers concentrated in a handful of countries. Quality control testing completes the cost structure for most manufacturing categories.
Plasmid DNA and chromatography resin pricing moved considerably through 2021 and 2022 as global specialty biologics supply chains tightened following disruptions that affected raw material and consumable availability across most major producing regions simultaneously and quite considerably during that period. The FDA recorded meaningfully longer specialty material procurement lead times through that window, and several CDMOs disclosed resulting margin pressure across their annual reporting through the period.

Exposure divides sharply by CDMO scale rather than by service category specifically across the industry. Larger CDMOs with negotiated long-term raw material supply agreements or backward integration held cost considerably better than smaller specialists relying on spot market purchasing during the tightening cycle. The disadvantage compounds, because a CDMO unable to deliver committed manufacturing volume during a shortage loses developer partner relationships that larger, better-capitalized competitors retain.
cell-and-gene-therapy-manufacturing-market-cost-volatility-analysis-1787298029293

Negotiate long-term raw material supply agreements early

CDMOs relying on spot market raw material purchasing absorb the full impact of periodic price spikes directly, which the recent tightening cycle demonstrated quite expensively across the entire cell and gene therapy manufacturing industry today. Negotiating long-term supply agreements with specialty biologics producers, even at modest committed volume, provides delivery priority and cost stability during any future shortage.

Pursue backward integration into plasmid production

CDMOs entirely dependent on external plasmid DNA supply cannot control allocation priority when a shortage hits, leaving no real alternative but to absorb delay and cost increases directly and pass them downstream to biopharma customers immediately and consistently today. Pursuing backward integration into plasmid production preserves margin stability that externally-sourced competitors simply cannot access.

Diversify raw material sourcing across multiple regions

CDMOs entirely dependent on a single raw material source region cannot control allocation priority when a shortage or export restriction hits, leaving no real alternative but to absorb delay and cost increases directly and pass them downstream to biopharma customers directly. Diversifying sourcing across multiple qualified regions preserves supply continuity single-region competitors simply cannot access.

Portfolio Architecture for Margin Defence

The portfolio splits into three tiers with genuinely different economics across the industry. Standard analytical and quality control testing services form the volume tier, where service commoditization and price-driven contracting drive competition directly. Cell processing and expansion services earn considerably more, because automation expertise and process validation narrow the field. Viral vector and commercial-scale manufacturing sit differently again, priced against the capacity and reli
The tension runs between standard testing volume that fills service capacity and premium viral vector work that earns the return. Conventional analytical testing generates the transaction volume that keeps laboratory lines loaded and maintains developer relationships through which higher-value manufacturing conversations happen. Yet this segment competes on price against every qualified regional testing lab. CDMOs managing this well treat standard volume as distribution relationship capital.

High-value pools concentrate where capacity or reliability genuinely limits competition: viral vector systems solving the manufacturing bottleneck problem, commercial-scale platforms meeting regulatory approval requirements, and validated batch release data resolving the developer trust constraint directly. All three resist the price competition defining standard testing services, since the customer is purchasing a solved capacity or reliability problem rather than comparing interchangeable manufacturing services.

Volume / Commodity-Adjacent Tier

Standard analytical and quality control testing services sold at commodity pricing against qualified regional testing labs competing on standard specifications and price. The range is wide because process-efficient CDMOs earn respectably while those competing purely on price frequently do not.
Gross Margin: 18-30%

Premium / Certified Tier

Cell processing and expansion services carrying automation expertise and process validation depth in the most demanding autologous and allogeneic manufacturing categories. The range is wide because process breadth and automation maturity vary considerably by CDMO.
Gross Margin: 30-44%

Sustainability / Regulatory / Next-Generation Tier

Viral vector and commercial-scale manufacturing platforms with validated yield and reliability credentials addressing the capacity bottleneck and regulatory approval problem directly across CDMOs requiring genuine clinical performance assurance and documented outcome data.
Gross Margin: 42-58%
cell-and-gene-therapy-manufacturing-market-portfolio-architecture-1787298029794

High-value Sub-segments and Strategic Watch-out

Viral Vector Manufacturing

High value and the fastest growth at 21.0%, from a small base as AAV and lentiviral production remains the primary bottleneck constraining commercial therapy launches across most major gene therapy categories. Yield and validation data increasingly determines which CDMOs capture this volume, limiting near-term opportunity to those with proven credentials.
Gross Margin: 42-58%

Cell Processing and Expansion Services

High value with strong growth, protected by automation expertise and developer partner relationships that create a durable barrier newer specialist entrants find genuinely difficult to replicate quickly. Cell therapy manufacturing demand compounds steadily as developers expand commercial-scale programmes supporting broader patient access goals across most major markets.
Gross Margin: 30-44%

Plasmid DNA Manufacturing

The volume core across standard upstream plasmid production worldwide, and the category with the longest commercial history of the segments listed here in this framework. Growth is steady but competition on price is direct, holding margin below the cell processing and viral vector tiers above it.
Gross Margin: 18-30%

Analytical and Quality Control Testing

The strategic watch-out, growing slowest as basic testing service volume increasingly loses ground to more targeted integrated manufacturing offerings bundling testing directly into production contracts across most demanding categories today. Declining standalone preference limits addressable volume exactly where growth elsewhere is fastest, threatening this segment position considerably.
Gross Margin: 14-24%

How Manufacturing Contract Revenue Compounds

Revenue commits differently depending on which mechanism drives the manufacturing decision. Commercial-scale contracts lock in tightly once a developer commits to a validated CDMO partner, since technology transfer requirements and regulatory filing documentation create genuine switching cost. Clinical-stage project orders stay more transactional, tied directly to trial phase rather than long-term commitment. Raw material supply orders persist on committed production schedules regardless of near
Adoption depth varies sharply by developer scale and pipeline ambition. Large pharmaceutical companies go deepest, standardizing CDMO relationships across an entire gene therapy portfolio once a single programme proves the manufacturing partnership case. Mid-sized biotechs adopt more selectively, often piloting one candidate before broader conversion. Smaller developers weigh manufacturing cost most heavily, since budget constraints make premium capacity harder to justify.

Buyer profiles have shifted from general process development scientists toward manufacturing strategy specialists and commercial supply chain directors with genuinely distinct priorities now. A process scientist once compared capacity price and availability directly; a manufacturing specialist now tracks yield consistency data and multi-year commercial reliability, and a supply chain director drives partner choice against patient supply continuity risk a purely price-focused evaluation would never have prioritised.
cell-and-gene-therapy-manufacturing-market-end-use-penetration-index-1787298030285

Our Call On Cell Manufacturing

These are among the four positions where our research anticipates prominent divergence between winners and laggards over the coming forecast period. Each is grounded in the demand model, the regulatory perimeter, and the announced capacity pipeline.
01 / YIELD DATA STRATEGY

Build validated commercial-scale yield data ahead of rivals

CDMOs that build rigorous, independently validated commercial-scale yield and batch consistency data, rather than relying on generic clinical-stage capacity claims developers increasingly discount, win manufacturing deals that competitors lacking comparable data increasingly lose to faster-moving rivals across most major gene therapy manufacturing markets and biopharma networks worldwide currently pursuing commercial approval and capacity investment expansion aggressively and deliberately. That capability commands a premium of 32 to 50% in effective contract pricing over CDMOs offering only conventional clinical-scale platforms. CDMOs should prioritise this now, because it is not quickly replicated.
02 / COMMERCIAL CONVERSION STRATEGY

Convert clinical relationships into long-term commercial contracts

CDMOs that build genuine technology transfer continuity from clinical development into commercial manufacturing, rather than treating each project phase as a separate transactional engagement, win contract positioning that continuity-absent competitors increasingly cannot match, adding roughly 28% to addressable long-term commercial revenue as developers consolidate around proven clinical-to-commercial partners across most major therapy categories and manufacturing partnership types nationwide today and quite consistently. That continuity position reaches developers who specifically need reliable commercial launch support. CDMOs should invest in this now, before rivals establish comparable continuity.
03 / RAW MATERIAL STRATEGY

Build vertically integrated raw material supply capability

CDMOs that build genuine backward integration into specialty raw material production, rather than relying entirely on external plasmid and media suppliers, capture manufacturing deals that supply-dependent competitors increasingly cannot win, expanding addressable margin-protected revenue by roughly 24% compared to CDMOs offering only externally-sourced production across most major viral vector and cell processing categories and manufacturing partnership types nationwide today and quite genuinely consistently now indeed. That integration reaches developers who specifically need supply chain reliability. CDMOs should build this now, before rivals establish it first.
04 / TESTING TRANSPARENCY STRATEGY

Deepen analytical testing transparency for regulatory confidence

CDMOs that publish genuine third-party analytical testing and batch release success rate data, rather than relying on internal unverified quality claims, capture manufacturing deals that transparency-limited competitors increasingly cannot win, cutting regulatory filing preparation time by roughly 35% during periods of accelerated commercial approval activity affecting the broader cell and gene therapy manufacturing industry and its wider regulatory affairs teams, quality assurance networks, and validation programmes globally and consistently. That transparency position reaches developers who specifically require independent confirmation. CDMOs should build this now, before the next approval cycle hits.

Engagement Snapshot From the Field

A live engagement with an industry participant carrying material or product regulatory and market exposure ahead of a defining policy shift, showing how our research translates into a defensible multi-year portfolio strategy.
MARKET MINDS ADVISORY · CLIENT ENGAGEMENT SUMMARY
Cell and Gene Therapy Manufacturing Producer Strategic Portfolio Review and Transition Roadmap 2026·Investment Scenario on Cell and Gene Therapy Manufacturing Exposure Evaluation 2025-26
CLIENT PROFILE
A regional biotech developer engaged MMA while evaluating commercial-scale CDMO partners ahead of an anticipated regulatory approval for its lead gene therapy candidate program. The developer reported a pipeline of one late-stage candidate and two earlier programmes and faced pressure to finalize manufacturing partner selection before its projected commercial launch timeline (client-reported, unverified by MMA).
STRATEGIC CHALLENGE
Selecting a CDMO without proven commercial-scale yield data risked launch delay if batch consistency failed to meet the threshold required for reliable patient supply during the critical post-approval period. Leadership needed a CDMO combining validated manufacturing performance with a credible technology transfer track record suited to the developer's launch timeline and budget.
MMA APPROACH
MMA evaluated three candidate CDMOs against documented commercial-scale yield data, technology transfer track record, and total manufacturing cost across the developer's projected five-year commercial supply horizon. We modelled launch delay risk under each CDMO's actual field performance data rather than accepting vendor-provided assurances alone. We then assessed each CDMO's raw material supply chain resilience.
KEY FINDINGS
  1. Only one of the three candidate CDMOs had validated commercial-scale yield data across gene therapy products comparable to the developer's own candidate.
  2. The recommended CDMO achieved a modeled batch success rate exceeding 96% across comparable commercial manufacturing runs over time (client-reported, unverified by MMA).
  3. Technology transfer track record varied considerably across the three CDMOs evaluated, with the recommended CDMO offering the fastest documented transition pathway available.
  4. Selecting a CDMO without proven commercial-scale data, based purely on manufacturing cost, would have risked meaningful launch delay and lasting reputational exposure.
CLIENT PROFILE
A regional biotech developer engaged MMA while evaluating commercial-scale CDMO partners ahead of an anticipated regulatory approval for its lead gene therapy candidate program. The developer reported a pipeline of one late-stage candidate and two earlier programmes and faced pressure to finalize manufacturing partner selection before its projected commercial launch timeline (client-reported, unverified by MMA).
STRATEGIC CHALLENGE
Selecting a CDMO without proven commercial-scale yield data risked launch delay if batch consistency failed to meet the threshold required for reliable patient supply during the critical post-approval period. Leadership needed a CDMO combining validated manufacturing performance with a credible technology transfer track record suited to the developer's launch timeline and budget.
MMA APPROACH
MMA evaluated three candidate CDMOs against documented commercial-scale yield data, technology transfer track record, and total manufacturing cost across the developer's projected five-year commercial supply horizon. We modelled launch delay risk under each CDMO's actual field performance data rather than accepting vendor-provided assurances alone. We then assessed each CDMO's raw material supply chain resilience.
KEY FINDINGS
  1. Only one of the three candidate CDMOs had validated commercial-scale yield data across gene therapy products comparable to the developer's own candidate.
  2. The recommended CDMO achieved a modeled batch success rate exceeding 96% across comparable commercial manufacturing runs over time (client-reported, unverified by MMA).
  3. Technology transfer track record varied considerably across the three CDMOs evaluated, with the recommended CDMO offering the fastest documented transition pathway available.
  4. Selecting a CDMO without proven commercial-scale data, based purely on manufacturing cost, would have risked meaningful launch delay and lasting reputational exposure.
RECOMMENDED STRATEGY
Phase 1: Phase 1 (0 to 3 months): Finalize CDMO selection and integrate commercial-scale requirements into technology transfer protocol design fully and completely. Phase 2: Phase 2 (3 to 9 months): Complete technology transfer and process validation, confirming batch success against modeled projections throughout the process. Phase 3: Phase 3 (9 to 12 months): Launch commercial manufacturing and validate outcomes against the original 96% success benchmark target set.
OUTCOME
The developer completed technology transfer and commercial launch within the twelve-month timeline, achieving batch success rates in line with the projected estimate ahead of the launch deadline. CDMO performance held steady through initial commercial production, and the selection framework is now the developer's standard approach for future manufacturing partnerships (client-reported, unverified by MMA).

Frequently Asked Questions

Foundational context covering the market sizes, CAGR, scope, country, region and competition that inform every finding below. This section is provided to cover basics and most often pre-purchase conversations, answered from the MMA Primary Research Dataset.

What is the current size of the Cell and Gene Therapy Manufacturing Market?

The global cell and gene therapy manufacturing market reached an estimated USD 14.47 billion in 2025, covering viral vector, plasmid DNA, cell processing, and fill-finish contract manufacturing services.

How large will the Cell and Gene Therapy Manufacturing Market be by 2036?

MMA projects the market will reach approximately USD 62.74 billion by 2036, reflecting expanding commercial therapy approvals and rising viral vector manufacturing capacity investment across major biopharma markets worldwide.

What is the CAGR for the Cell and Gene Therapy Manufacturing Market 2026 to 2036?

The market is forecast to grow at a 15.8% CAGR between 2026 and 2036, driven by expanding commercial therapy approvals and rising viral vector manufacturing capacity investment worldwide.

Which segment is growing fastest?

Viral vector manufacturing leads at a 21.0% CAGR, roughly 1.33 times the overall market rate, as AAV and lentiviral capacity remains the primary bottleneck constraining commercial launches.

Who are the major companies in the Cell and Gene Therapy Manufacturing Market?

Leading participants include Catalent, Thermo Fisher Scientific, Lonza Group, WuXi Advanced Therapies, and Charles River Laboratories, evaluated on a consistent contract manufacturing revenue basis across biopharma customers.

Which country is growing fastest?

The United States leads country-level growth, anchoring North America's dominant share through concentrated viral vector manufacturing capacity and the majority of FDA-approved commercial therapy products.

Report Segmentation Architecture

The full report scope spans multiple orthogonal segmentation dimensions, with cross-tabulated demand data provided for each dimension pair. Coverage extends further to regional breakdowns, trend trajectories, and the competitive detail needed to support segment-level decision-making.

By Manufacturing Service Type

  • Viral Vector Manufacturing
  • Cell Processing and Expansion Services
  • Plasmid DNA Manufacturing
  • Fill-Finish and Formulation Services
  • Analytical and Quality Control Testing

By Therapy Modality

  • Chimeric Antigen Receptor (CAR) Cell Therapy
  • Adeno-Associated Virus (AAV) Gene Therapy
  • Lentiviral and Retroviral Gene Therapy
  • Ex Vivo and In Vivo Gene Editing

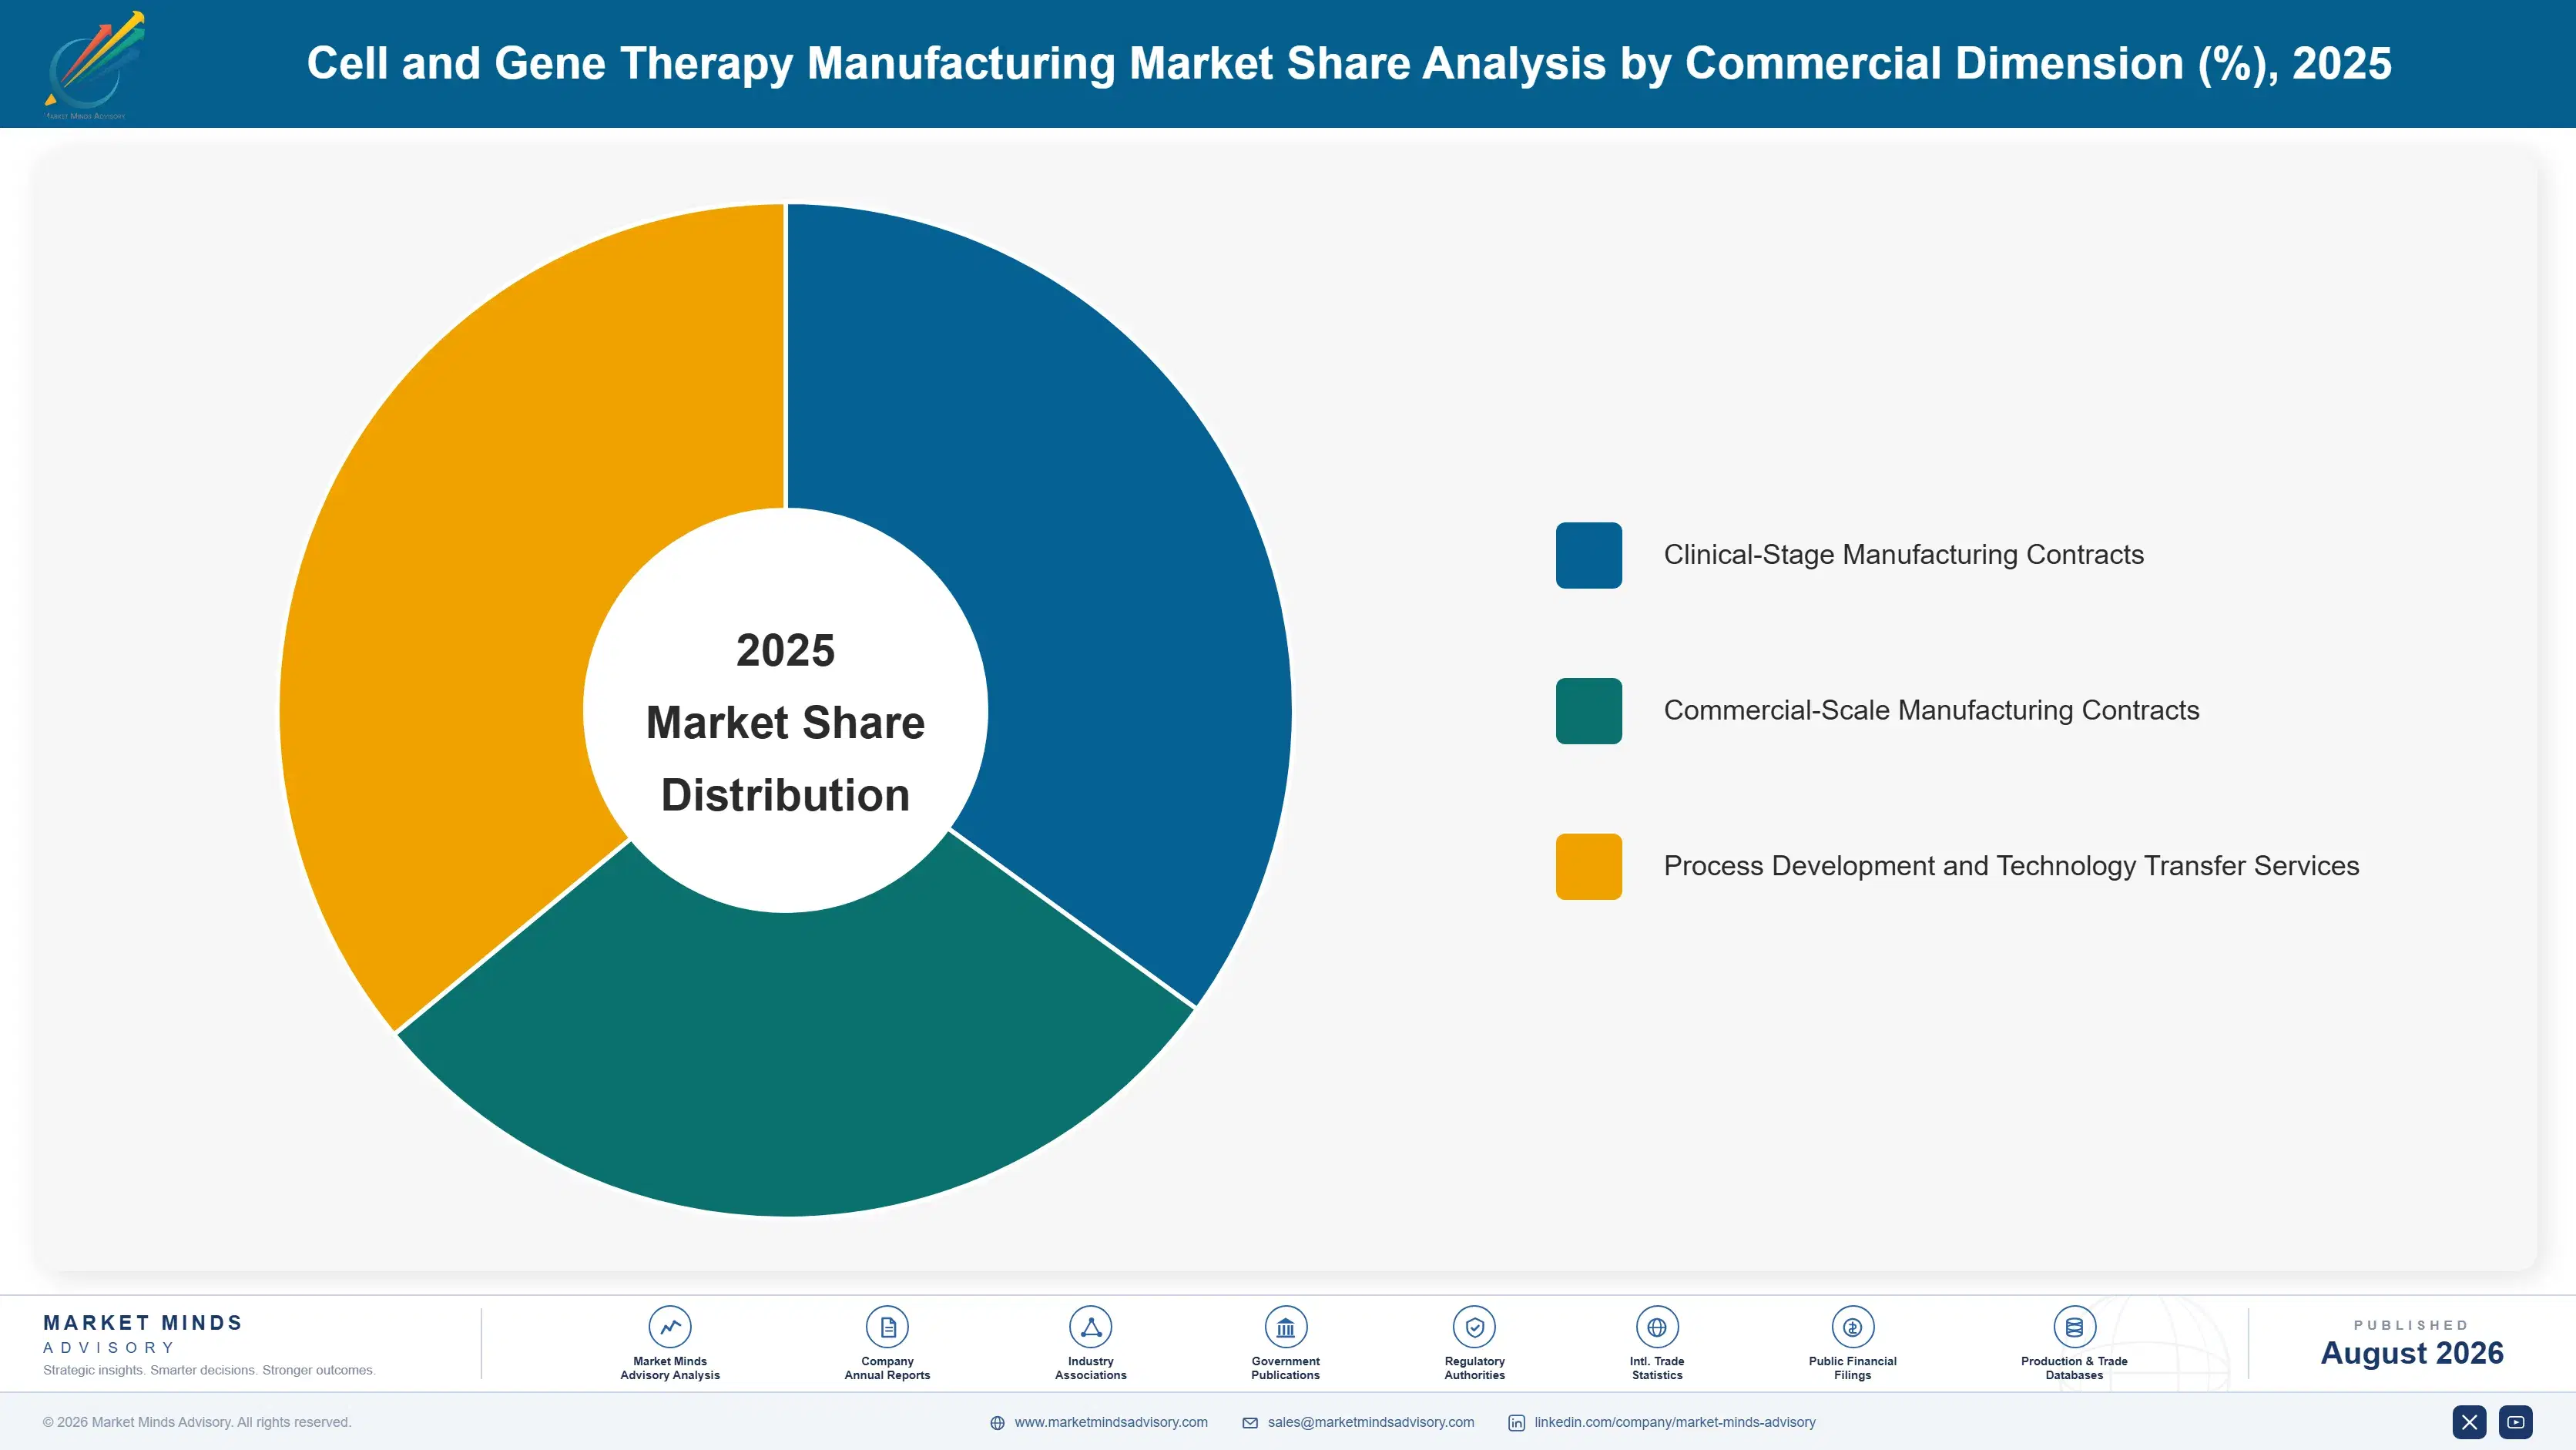
By Commercial Dimension

  • Clinical-Stage Manufacturing Contracts
  • Commercial-Scale Manufacturing Contracts
  • Process Development and Technology Transfer Services

By Region

  • North America
  • Western Europe
  • East Asia
  • South Asia and Pacific
  • Latin America
  • Middle East and Africa
  • Eastern Europe

Scope, Methodology, and Coverage

Every figure in this report is reproducible from documented input assumptions. The scope below maps the historical period, the forecast horizon, the segmentation dimensions, and the countries covered, alongside the underlying primary and qualitative methodology.
Historical Period
2020 to 2025
Forecast Period
2026 to 2036
Base Year
2025 (USD billions; MMA Primary Research Dataset, August 2026)
Market Definition
The cell and gene therapy manufacturing market comprises contract development and manufacturing services for viral vectors, plasmid DNA, cell processing, and fill-finish operations, valued at manufacturing service prices to biopharma customers. It spans clinical-stage and commercial-scale production supporting both cell and gene therapy modalities. General biologics manufacturing for traditional drugs is excluded from this scope entirely.
Quantitative Units
USD billions (current prices); manufacturing batch volume where applicable
Segmentation Dimensions
By Manufacturing Service Type; By Therapy Modality; By Commercial Dimension; By Region
Regions Covered
North America, Western Europe, East Asia, South Asia and Pacific, Latin America, Middle East and Africa, Eastern Europe
Countries Covered
USA, Canada, Switzerland, Germany, UK, France, China, Japan, South Korea, India, Australia, Brazil, Mexico, Argentina, Chile, UAE, Saudi Arabia, South Africa, Poland, Czechia, and additional markets relevant to this sector
Key Companies Profiled
Catalent (Novo Holdings), Thermo Fisher Scientific, Lonza Group, WuXi Advanced Therapies, Charles River Laboratories, Novasep (Ajinomoto Bio-Pharma), Fujifilm Diosynth Biotechnologies, Cognate BioServices (Charles River), Oxford Biomedica, Cellares, Miltenyi Biotec, Sartorius, Merck KGaA (MilliporeSigma), Samsung Biologics, AGC Biologics, Resilience (National Resilience), Vibalogics, Andelyn Biosciences, Cytiva, Kincell Bio
Quantitative Methodology
Primary survey, n=3,800 respondents, Q4 2025, six countries; demand-side model with trade association cross-validation
Qualitative Methodology
47 expert interviews, Q4 2025; applied to validate demand model assumptions, identify emerging dynamics, and assess competitive positioning
Report Format
PDF and XLSX data workbook (Word format preview document)
Publisher
Market Minds Advisory
Report Code
MMA-2026-HLT-226
Published
August 2026
Contact
sales@marketmindsadvisory.com | www.marketmindsadvisory.com

Purchase the full Cell and Gene Therapy Manufacturing Market Report (2026 to 2036).

The full MMA Cell and Gene Therapy Manufacturing report sizes the market across five manufacturing service segments, seven regions, and multiple therapy modalities through 2036. It profiles 20 companies on a consistent basis of contract manufacturing revenue to qualified biopharma customers, scoring each on commercial-scale yield validation, technology transfer continuity, raw material integration, and testing transparency. Scenario models quantify how commercial approvals and viral vector capacity investment move both volume and achievable margin across all seven regions. The report also includes yield benchmark data and CDMO capacity mapping.
Five-service market sizing across seven regions through 2036
Twenty-company benchmark on contract manufacturing revenue
Commercial therapy approval tracking by region and modality
Validated commercial-scale yield benchmarking across leading CDMOs
Technology transfer continuity mapping across major biopharma partnerships
Specialty raw material supply chain risk mapping

Built For The People Who Decide

From boardroom strategy to bench-side execution, this report is read cover-to-cover by leaders shaping the next decade of their industry, turning demand scenarios, market dynamics and valuation benchmarks into decisions.
CXOs/ Presidents/ VPs/ Managers
M&A and Corporate Development
Strategy Teams and R&D Heads
Procurement and Product Directors
Regulatory and Compliance Leaders
Investor Relations and Equity Analysts