

Market Minds Advisory
Casual Shoes Market

Casual Shoes Market: Casual Shoes Market: Most Athletic Footwear Is Casual Footwear, The Last Decides Comfort, And Almost Nothing Can Be Resoled, 2026 to 2036

Around 71% of performance footwear is never used for its sport, only 2% of products publish last dimensions, and 6% of volume is built so the sole can be replaced.

Lead Analyst

Published

September 2026

Make Smarter Decisions with Customized Research Insights

Request a free sample report and evaluate market opportunities, growth trends, and competitive dynamics relevant to your business needs.

2025 MARKET VALUE$96.0BMarket Size 2025
2036 FORECAST VALUE$174.9BBase Case , 2026 to 2036
CAGR 2026 TO 20365.6 %Bull 6.8% / Bear 4.4%
INCREMENTAL OPPORTUNITY$73.5BNet 10- year value creation
EXPANSION MULTIPLE1.72x2036 value over 2026 base
Strategic Levers
M&A Pipeline
Regional Outlook
Country Rankings
Competitive Intelligence
Segmental Deep-dive
Call-Us : 91 93563 13602

Executive Snapshot and Market Trajectory.

Around 71% of footwear sold as performance product is never used for the sport it was engineered for. It is casual footwear that happens to carry a running or basketball specification, and the industry counts it in a different category entirely. The category is larger than published splits suggest.
Goodyear welted and resoleable construction grows at 8.4%, half again the market rate of 5.6%, from a base of about 6% of volume, as repairability moves from a heritage argument into a regulatory one. Injection moulded comfort construction follows at 7.2%. Vulcanised construction grows slowest of the six methods at 4.7%. Cemented synthetic sneaker construction still carries most of the volume by a wide margin.
East Asia holds 30% of demand, with Indian growth of 9.8% leading every market covered. Roughly 2% of products publish last width and instep dimensions alongside a size number, and fit accounts for about 29% of online returns, which is the largest avoidable cost anywhere in this industry. Roughly 94% of volume is built by methods that cannot be resoled, which is becoming a regulatory exposure rather than only a durability preference among enthusiasts.
Market Definition
This market covers non-athletic everyday footwear across construction methods, including Goodyear welted and resoleable construction, stitchdown and Blake construction, cemented leather construction, cemented synthetic sneaker construction, vulcanised construction, and injection moulded comfort construction. It excludes performance footwear used for its designed sport, formal and dress footwear, safety and occupational footwear, orthopaedic and medical footwear, and slippers and indoor-only footwear.
Base Year Value
$96.0B in 2025 (MMA Primary Research Dataset, September 2026)
Forecast Period
2026 to 2036, eleven discrete annual values
CAGR
5.6% base case. Bull 6.8%. Bear 4.4%.
Fastest Growth Segment
Goodyear Welted And Resoleable Construction: 8.4% CAGR
Fastest Growth Country
India: 9.8% CAGR
Fastest Growth Region
South Asia and Pacific: 7.6% CAGR
Largest Region
East Asia: 30% of 2025 global value
Market Leaders
Nike, Adidas, Skechers, Deckers Outdoor, and VF Corporation lead the field. Source: MMA Primary Research Dataset, July 2026.
Primary Survey
n=3,800 procurement and R&D decision-makers, Q4 2025, six countries
Methodology
Demand-side build-up, cross-validated against public data, 47 expert interviews

Casual Shoes Market Forecast Scenarios

casual-shoes-market-size-forecast-scenario-1790020358903
Growth from 2020 to 2025 ran at 4.5% and the category absorbed demand from formal footwear rather than generating its own. Workplaces relaxed dress expectations permanently, and shoes that would once have been weekend wear became everyday wear across most developed markets. Comfort construction expanded fastest as that shift reached older buyers who had not previously worn anything but leather.
The base case at 5.6% rests on three mechanisms. Resoleable construction keeps growing as repairability rules move from discussion into procurement and product regulation. Asian consumption keeps expanding, with Indian growth at 9.8% leading every country covered. And comfort construction keeps taking share from conventional cemented sneakers among buyers who prioritise how a shoe feels over what technology it names. None of the three assumes the athletic and casual classification split is corrected.
The bull case at 6.8% depends on last dimension disclosure becoming a norm, which would cut a fit return rate near 29% and release cost across the whole online channel. The bear case at 4.4% is repairability regulation arriving faster than manufacturers can retool, since around 94% of volume is built by methods that cannot be resoled at all.

What Is Actually Being Bought

The largest fact about this market is a classification error. Around 71% of footwear sold as performance product never sees the sport it was engineered for, which means most athletic footwear is casual footwear wearing a technical specification. Brands design carbon plates and stability systems for buyers who will walk to a train station in them. The category is larger than published splits suggest.
TOP FIVE CONCENTRATION33%Share of category revenue held by the leading brands
ATHLETIC MISCLASSIFICATION SHARE71%Performance footwear never used for the sport it addressed
LAST DIMENSION DISCLOSURE2%Products publishing last width and instep measurements alongside size
ONLINE FIT RETURN RATE29%Online purchases returned citing fit rather than any other reason
RESOLEABLE CONSTRUCTION SHARE6%Volume built so the sole can be replaced
RESALE VALUE COVERAGE17%Volume with an active secondary market setting perceived value
Comfort is decided by the last, which is the shaped form a shoe is built around, and specifically by its width, volume, and instep height. Cushioning technology is what gets marketed, because a foam compound can be named and trademarked and a last cannot. Around 2% of products publish last dimensions alongside a size number, which is why fit drives about 29% of online returns and a size nine varies by nearly a full size.
Then construction, which has quietly become a disposal question. Roughly 94% of volume is cemented or injection moulded, meaning the sole is glued and the shoe cannot be resoled when it wears through. Goodyear welted and stitchdown construction can be resoled repeatedly and account for a small share of volume. Repairability regulation is noticing this now.
"Most of what the industry calls athletic footwear is casual footwear with a technical story attached, and the buyer walking to the office in a carbon-plated racing shoe is the customer this category is actually serving. Meanwhile nobody publishes a last width, which is the only number that decides whether the shoe fits."
Practice Director, Footwear and Consumer Apparel · MMA Consumer Apparel and Footwear Practice · September 2026

Market Trends

Repairability Moves From Heritage To Regulation

Goodyear welted and resoleable construction grows at 8.4%, fastest of the six methods, from a base of around 6% of volume. The argument used to be heritage and cost per wear, made by a small group of buyers who kept shoes for years. It is becoming a regulatory question instead, as durability and repairability requirements move into product rules and public procurement across several markets. Retooling a cemented production line for welted construction is a capital and skills change measured in years, which makes early movement worth considerably more than it looks.
Market Impact: Country grows at 9.8%

Comfort Construction Displaces The Technical Sneakers

Injection moulded comfort construction grows at 7.2% against cemented synthetic sneakers at 5.4%, as buyers who have worn technical footwear for years stop responding to cushioning names and start choosing on how a shoe actually feels on their foot. That shift favours brands built around last shape and fit range over those built around foam compound marketing. Older buyers entering the category from formal footwear go straight to comfort construction without passing through the sneaker segment at all, which is a demographic effect brands consistently underestimate. Fit range rather than foam compound is what wins that buyer.
Market Impact: Comfort grows at 7.2%

Market Opportunities and Growth Drivers

Indian Consumption Grows Across Every Price Tier

India grows at 9.8%, faster than any country covered, as footwear consumption per household rises and organised retail reaches beyond the largest cities. South Asia and Pacific holds 19% of world demand on that basis. Domestic manufacture supplies most of the mass tier and is expanding into export supply as production diversifies away from a narrower set of Asian sources. Price points sit far below world averages, and the mix skews heavily toward cemented synthetic construction rather than anything resoleable. Regional foot shape differs measurably from Western lasts, and domestic brands compete directly on that difference.
Market Impact: Fit drives 29% of returns

Workplace Dress Relaxation Became Permanent Demand

Formal footwear demand transferred into this category rather than disappearing, as workplaces relaxed dress expectations and did not reverse. That moved a substantial block of buyers who had worn leather shoes daily into casual construction, and many went to comfort formats rather than to sneakers. The transfer is largely complete in developed markets and still running in emerging ones. Brands treating it as a temporary shift rather than a permanent reallocation have consistently under-invested in the formats those buyers actually chose. The transfer is largely complete in developed markets and still running in emerging ones.
Market Impact: About 94% cannot be resoled

Market Restraints and Challenges

Nobody Publishes The Measurement That Decides Fit

Around 2% of products publish last width, volume, and instep dimensions alongside a size number, and the root cause is that lasts are proprietary shapes brands treat as design assets rather than as specifications. Commercially this produces a fit return rate near 29% online, which is the largest avoidable cost in the industry. Brands respond by publishing measured internal dimensions, by offering multiple width fittings, and by providing scan-based fit matching rather than size charts alone. A customer whose first pair fitted badly rarely gives the brand another attempt, which makes the cost far larger than handling expense suggests.
Market Impact: Resoleable holds 6% volume

Most Volume Cannot Be Repaired At All

Roughly 94% of volume is cemented or injection moulded, and the root cause is that glued construction is faster, cheaper, and requires less skilled labour than welted or stitchdown methods. Commercially this is becoming a regulatory exposure as repairability rules advance, and retooling is a multi-year change rather than a specification adjustment. Brands respond by developing resoleable ranges early, by qualifying welted manufacturing capacity, and by publishing expected wear life alongside construction method. Retooling is a multi-year capital and skills change rather than a specification adjustment, so timetables matter more than intentions here.
Market Impact: Comfort grows at 7.2%
3 additional market trends, 4 additional growth drivers, and 2 additional restraints and challenges are covered in the full report. Contact sales@marketmindsadvisory.com to access the complete intelligence.

Segment CAGR and Growth Architecture

Segmentation follows construction method across six categories: Goodyear welted and resoleable construction, stitchdown and Blake construction, cemented leather construction, cemented synthetic sneaker construction, vulcanised construction, and injection moulded comfort construction. Product style, price tier, and distribution channel are treated as separate dimensions entirely. Performance sport footwear, formal shoes, safety boots, and slippers fall outside the defined scope.
casual-shoes-market-market-share-analysis-1790020359606

Goodyear Welted And Resoleable Construction

Goodyear welted and resoleable construction grows at 8.4%, half again the market rate of 5.6%, from a base near 6% of volume. A welted shoe can be resoled repeatedly, which historically appealed to a small group of buyers calculating cost per wear over years rather than seasons. Repairability and durability requirements moving into product regulation and public procurement change that from a preference into a specification. The constraint is manufacturing: welted construction needs skilled labour and equipment that cemented lines do not have, and retooling is measured in years rather than seasons. Brands qualifying capacity early are buying optionality cheaply. Very little of the industry retains the capability to make it.
CAGR 8.4%

Injection Moulded Comfort Construction

Injection moulded comfort construction grows at 7.2% by competing on how a shoe feels rather than on what its cushioning is called. The method bonds a moulded sole directly to the upper, producing consistent underfoot geometry at high volume and low cost, and it suits the wide fit ranges that comfort buyers need. Growth comes disproportionately from older buyers arriving out of formal footwear who never adopted sneakers at all. Brands built around last shape and fitting range serve that buyer far better than those built around foam compound marketing, and the difference shows up in repeat purchase rather than in trial. Wide fitting ranges matter far more here than any cushioning name.
CAGR 7.2%
Full segment breakdown across 6 segments available in the complete report.

Regional Architecture and Country Demand Map

Regional shares reflect where casual footwear is purchased rather than where it is manufactured. Two regions sit outside the standard bands, for reasons named in their own paragraphs and summarised below for operator review. Foot shape, regulatory timetables, and channel structure vary sharply between them.

East Asia

Chinese consumption is the largest single national market in the category and the region also manufactures a substantial share of world footwear, though production has been diversifying outward for a decade. Growth of 6.6% runs above the world rate. Domestic Chinese brands hold meaningful share against the global groups and compete on fit for regional foot shape, which imported lasts serve poorly. Japanese and Korean demand skews toward comfort and heritage construction rather than technical sneakers. Resale markets are unusually developed and set perceived value on a meaningful share of premium volume. Imported lasts serve regional foot shape poorly and domestic brands win on exactly that difference every time. Fit is the competitive axis here.
Share: 30% | CAGR: 6.6% (2026 to 2036)

North America

Athletic misclassification is most pronounced here, with performance footwear worn casually accounting for a very large share of what the category actually consists of. Growth of 4.8% runs a little under the world rate. Online penetration is the highest of any region, which makes the fit return rate near 29% a proportionally larger cost than elsewhere. Resale markets set perceived value on a substantial share of premium sneaker volume, and brands capture almost none of it. Comfort construction is growing quickly among older buyers leaving formal footwear. Returns are handled as a logistics cost rather than a product problem across most of the industry here, which is why the underlying last performance is rarely examined at all.
Share: 20% | CAGR: 4.8% (2026 to 2036)
Regional intelligence for 5 additional markets available in the complete report: Western Europe, South Asia and Pacific, Latin America, Middle East and Africa, Eastern Europe. Contact sales@marketmindsadvisory.com.
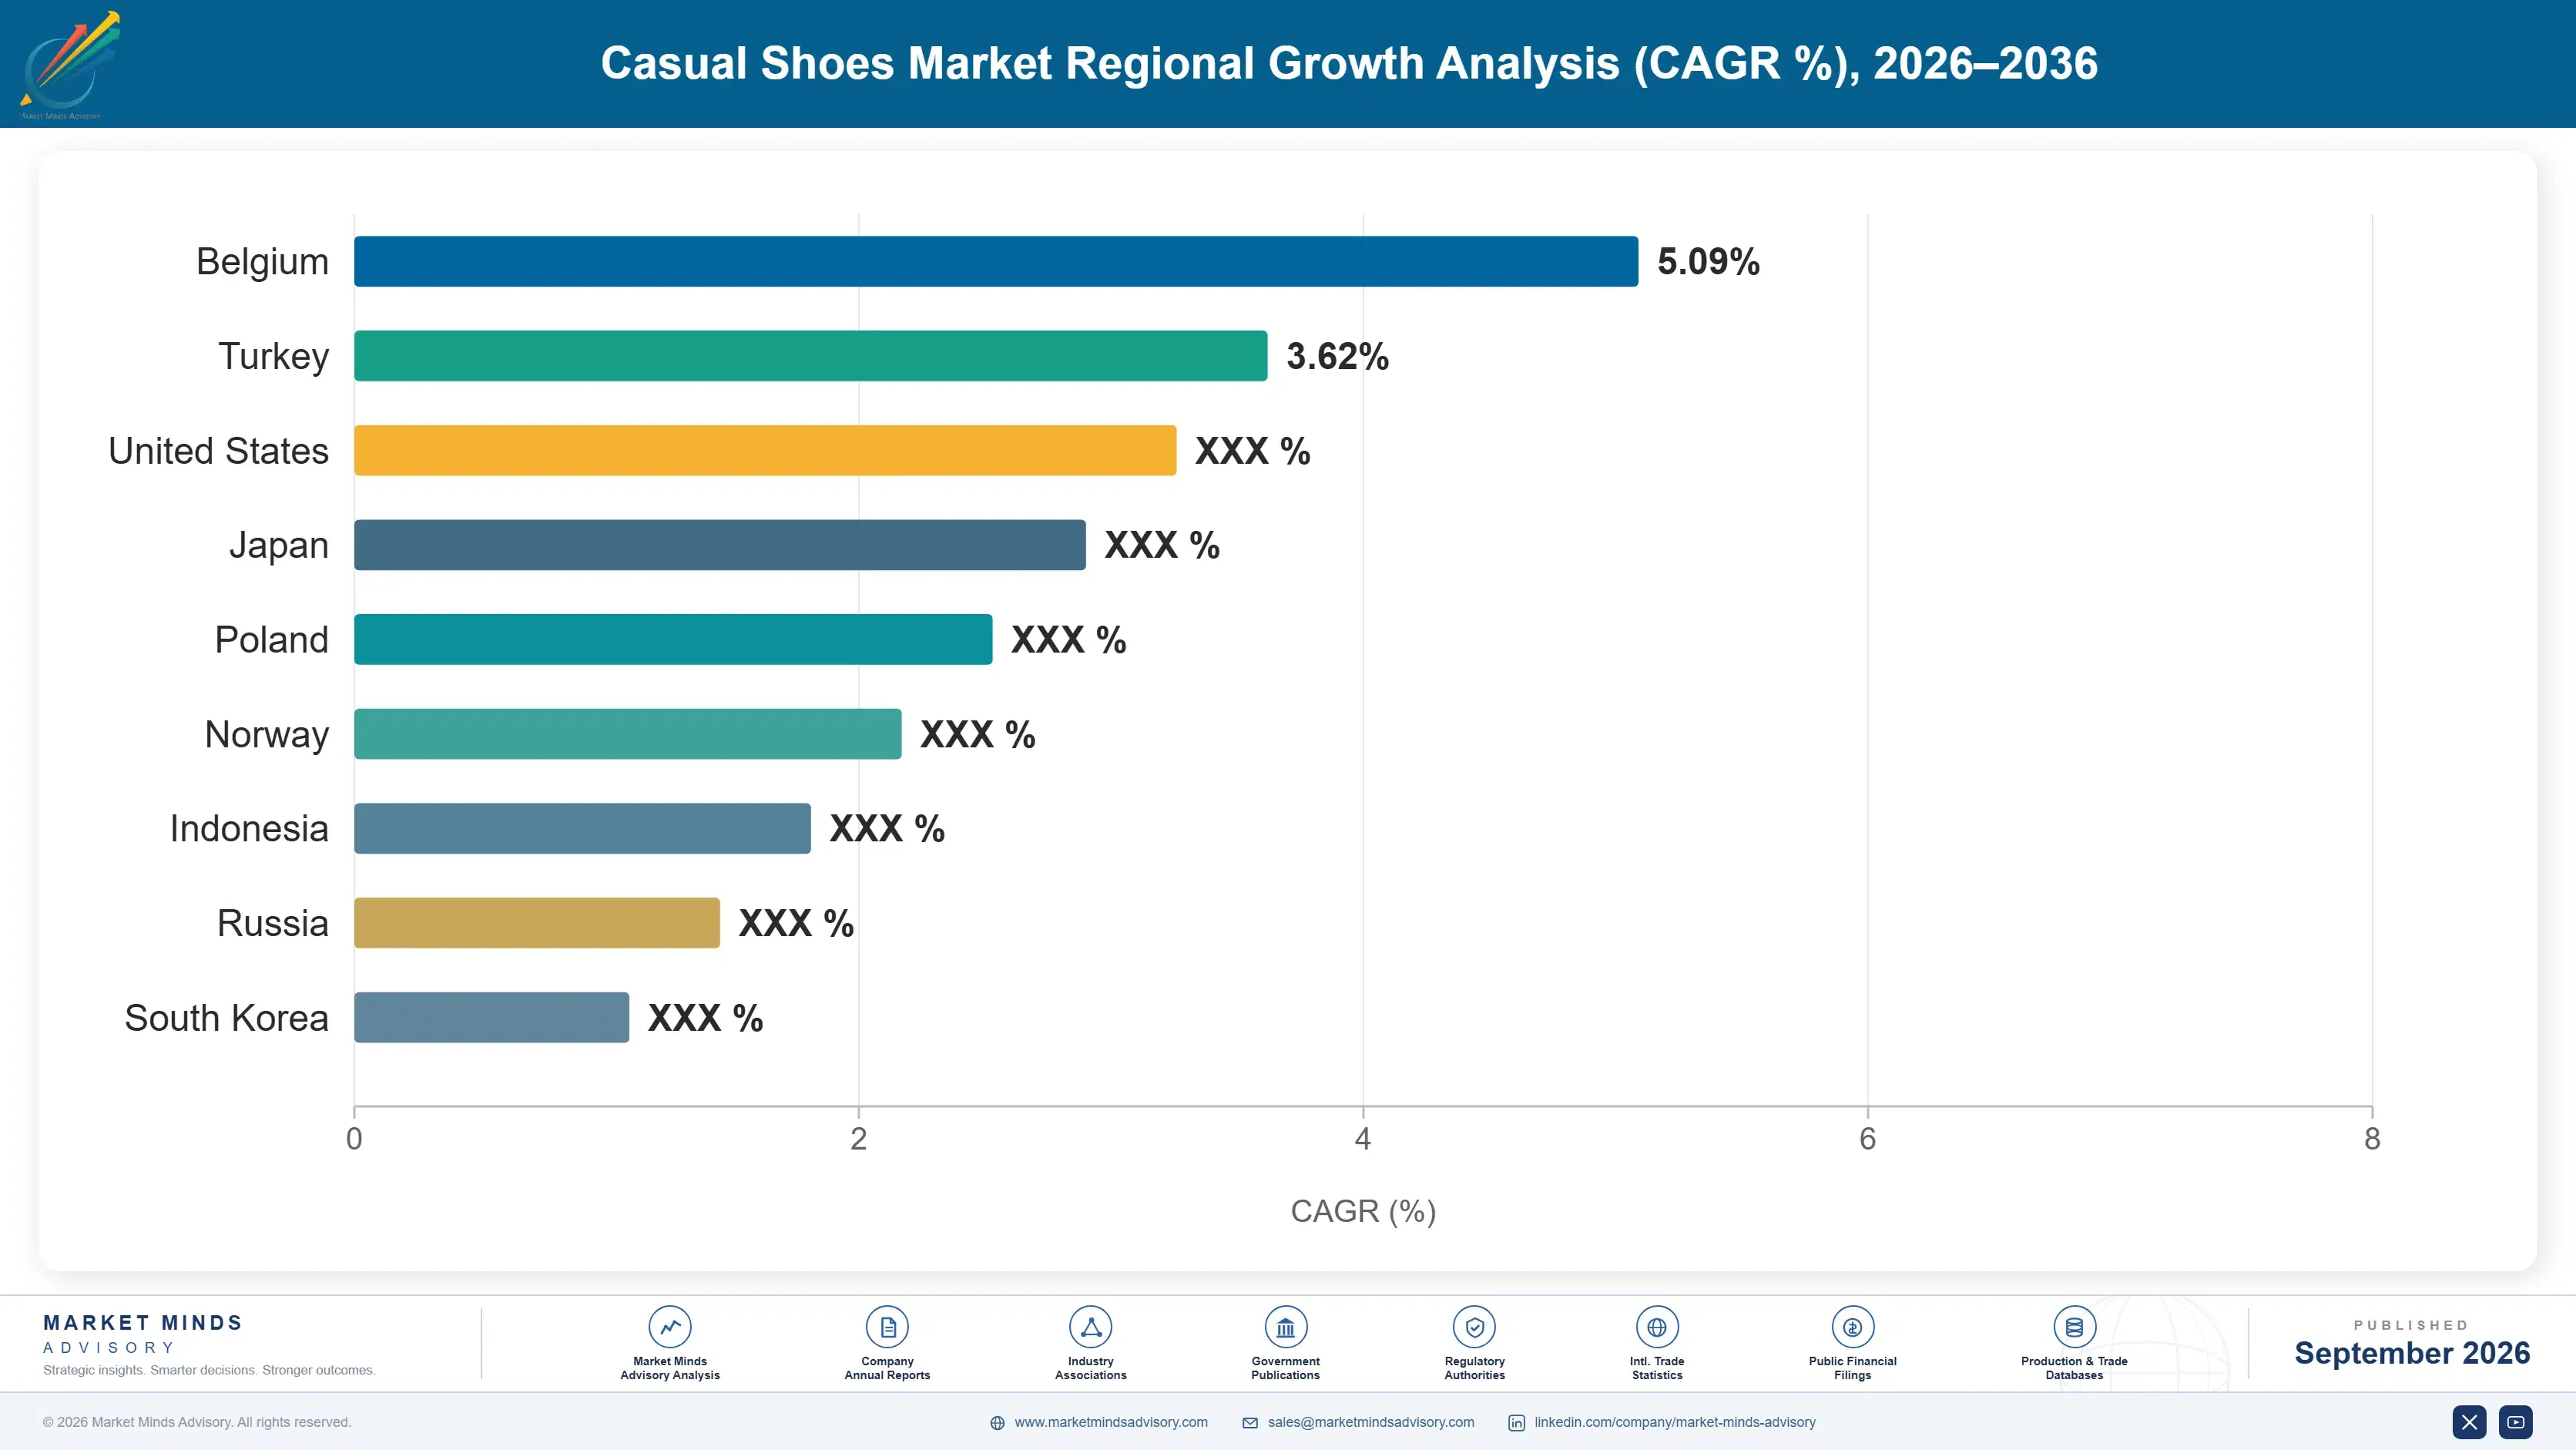
casual-shoes-market-country-cagr-analysis-1790020360129

Where Footwear Brands Build Position

Four commercial moves matter in a category that misclassifies most of its own volume, markets the wrong variable, and builds almost everything so it cannot be repaired. Each publishes or changes something the industry has treated as unquestionable for decades. Each addresses something the industry has treated as unquestionable for decades. None requires a new material or technology.

Publish Last Dimensions Rather Than Size Numbers

Around 2% of products publish last width, volume, and instep dimensions, and fit accounts for about 29% of online returns, which is the largest avoidable cost in this industry. Brands publishing measured internal dimensions and offering multiple width fittings report return rates 2.8 times lower alongside materially better repeat purchase. Lasts are treated as proprietary design assets, which is why the disclosure has not happened. The measurement is trivial and the commercial effect is not. Return rates also vary enormously between lasts within identical styling, and almost nobody measures that at all.
Market Impact: Cuts online return rates 2.8 times lower overall

Qualify Resoleable Manufacturing Capacity Early Enough

Roughly 94% of volume is built by methods that cannot be resoled, and repairability requirements are moving into product regulation and public procurement across several markets. Brands qualifying welted or stitchdown capacity ahead of requirement report compliance readiness 3.4 times faster than those retooling reactively. Retooling a cemented line is a capital and skills change measured in years rather than seasons. Buying that optionality early costs far less than buying it under a deadline. The skills and equipment are not transferable from a cemented line, which is what makes the timetable binding rather than negotiable.
Market Impact: Raises compliance readiness 3.4 times faster than retoolers

Design For The Buyer Who Actually Wears It

About 71% of performance footwear is never used for its designed sport, which means a large share of technical development serves people walking to work in it. Brands designing casual-first product with honest positioning report gross margin 2.2 times better than those funding performance development consumed by nobody. The technical story sells and the technical engineering largely does not get used. Separating what is marketed from what is built is the uncomfortable part of this. Separating what is marketed from what is engineered is the uncomfortable part, and it is where the margin difference actually comes from.
Market Impact: Raises gross margin to 2.2 times better overall

Build Fit Range For Regional Foot Shape

Global brands ship lasts drafted for Western foot proportions into markets where measured foot shape differs materially, particularly across South Asia and East Asia where regional growth is fastest. Brands developing region-specific lasts report market share capture 2.6 times greater than those adapting sizing alone. Domestic brands in those markets already compete on exactly this and win on it. Adjusting a size chart does not address a difference in width and instep. Domestic brands in those markets already compete on exactly this and win on it consistently, which makes the gap a competitive one rather than a theoretical one.
Market Impact: Raises regional share capture to 2.6 times greater

Who Controls the Margin Pool

Concentration is low for a category of this size. Five brands hold 33% of category revenue, measured consistently on that basis across all participants, and the remainder spreads across global sportswear groups, comfort footwear specialists, heritage construction makers, regional domestic brands competing on local fit, and private label supply into mass retail across every market. The leader to challenger gap is wide in brand weight and absent in construction, since the same contract factories supply most of the field.
Competition currently turns on three dimensions: fit range and last development, which decides both comfort and return cost; construction capability, particularly resoleable methods that most of the industry no longer has; and regional last adaptation, where domestic brands beat global groups in the fastest growing markets. Price and image decide at mass tier, which still accounts for most pairs sold in every region.

Pressure builds from two directions at once. Repairability requirements advance faster than cemented production can retool. Domestic brands in Asian markets win on fit that imported lasts cannot match. Rankings will shift toward brands holding welted capability and genuine fit range rather than marketing weight alone. Brands holding only cemented synthetic volume are most exposed.
casual-shoes-market-company-positioning-matrix-1790020360654

Competitive Moat and Risk Dimensions

NIKE

Moat: Brand Weight And Development Scale

Marketing scale and product development capability let a single brand define what a category looks like and sustain price positions that specification alone would not support. In a market where about 71% of performance product is worn casually, the technical story does commercial work that the technical engineering does not.
NIKE

Risk: No Resoleable Construction Base

A production base built entirely on cemented and injection moulded construction cannot be retooled for welted methods on a regulatory timetable, because the skills and equipment are not transferable. Repairability requirements advancing in Europe reach a portfolio with essentially no compliant capacity behind it. Skills and equipment do not transfer from cemented lines.
SKECHERS

Moat: Comfort Construction And Fit Range

Depth in comfort construction and unusually wide fitting ranges serve the buyer arriving from formal footwear who never adopted technical sneakers at all. That segment grows at 7.2% and is reached through fit rather than through marketing, which is a considerably cheaper way to win a customer.
SKECHERS

Risk: Limited Premium Resale Presence

Resale markets set perceived value on around 17% of category volume and concentrate in premium sneaker product, which comfort construction does not participate in. That leaves pricing power capped by the primary market alone, with no secondary market supporting the position from underneath. Primary market pricing has to carry the whole position.

Players Tracked

Prominent Players

Nike
Adidas
Skechers
Deckers Outdoor
VF Corporation

Other Key Players

Puma
New Balance
ASICS
Anta Sports
Li Ning
Crocs
Wolverine World Wide
Steve Madden
Caleres
Genesco
Birkenstock
Dr Martens
ECCO
Clarks
Bata Corporation

Recent Developments

MARCH 2026

ECCO Publishes Last Width And Instep Dimensions Across Its Range

ECCO began publishing measured internal last dimensions alongside size numbers across its casual footwear, covering width, volume, and instep height. The disclosure treats a proprietary design asset as a specification a buyer can use. Figures are stated per last rather than per style across the whole range.
Signal: The only number that decides fit has never been published before. Publishing turns a design asset into a specification.
SEPTEMBER 2025

Dr Martens Expands Welted Manufacturing Capacity In Europe

Dr Martens completed an organic expansion of welted construction capacity at a European site, funded internally with no partner involved. Management cited advancing repairability requirements rather than any current shortage of production output. Skilled lasting operators were recruited and trained ahead of the capacity coming online.
Signal: Retooling for welted construction takes years and cannot start at deadline. Capacity qualified early costs far less.
MAY 2025

Anta Sports Acquires Regional Last Development Business

Anta Sports completed an acquisition of a last development and foot measurement business specialising in East and South Asian foot proportions. The transaction was an outright acquisition rather than a joint venture or minority stake. Foot measurement datasets transferred with the business under the agreed terms.
Signal: Regional fit is where domestic brands beat imported lasts consistently. A size chart cannot fix a shape difference.

What A Casual Shoe Costs

Three cost groups dominate. Uppers, sole units, and materials run 38% to 46% of cost of goods sold, and the eight-point range separates leather and welted components from synthetic cemented construction. Cut, lasting, and assembly labour take 24% to 32%, rising sharply for welted and stitchdown methods requiring skilled operators. Brand marketing allowance and returns handling account for 20% to 28% across the range.
Leather and synthetic upper material pricing moved through 2024 and 2025 on agricultural and petrochemical cycles respectively, and United States Census Bureau trade data recorded both movements across the period. Several brands described returns handling as the faster-rising cost line in their annual reports rather than materials. Skilled lasting labour costs rose across every manufacturing region simultaneously. The three exposures moved independently across the period.

The competitive disadvantage mechanism runs through returns rather than through materials. A brand with fit returns near the category rate of 29% online carries handling, restocking, and lost customer cost that scales with revenue rather than falling with volume. Exposure therefore varies by last development and fit disclosure rather than by scale, and brands weighted toward online distribution carry it most heavily of anybody.
casual-shoes-market-cost-volatility-analysis-1790020360852

Invest In Last Development Before Material Upgrades

Fit returns cost handling, restocking, and the customer, while material upgrades rarely change a purchase a buyer cannot evaluate before wearing the shoe. Last development and multiple width fittings move the largest avoidable cost line in this category and continue paying across every season the last is used. A last is used across many seasons rather than one.

Qualify Welted Capacity Against Regulatory Timetables

Repairability requirements advance on published timetables while retooling a cemented line for welted construction takes years of capital and skills development. Qualifying capacity against those timetables rather than in response to them converts a compliance risk into an optionality position bought at a considerable discount. Skilled lasting operators have to be trained before capacity opens.

Contract Leather And Synthetic Uppers Separately

Leather follows agricultural and hide supply cycles while synthetic uppers follow petrochemical feedstock, and the two have no meaningful relationship in any period. Contracting them independently rather than through one procurement view prevents a single approach from carrying exposure to markets that move for entirely unrelated reasons. Hide supply and petrochemical feedstock have never moved together.

Portfolio Architecture for Margin Defence

Margin follows fit capability and construction rather than material specification. Mass cemented synthetic footwear competes close to commodity terms against private label supply from the same factories. Vulcanised canvas earns modestly on brand heritage. Comfort construction earns well where fit range is genuinely wide, and welted resoleable construction earns most, because so little of the industry retains the capability to make it.
The tension between volume and premium runs through what the buyer is actually solving. A shopper choosing a sneaker online sees similar specifications, similar prices, and no information about whether it will fit, so brand and image decide and a third of the decisions come back. A buyer who needs a wider fitting, or who intends to keep the shoe and resole it, is solving a specific problem and pays substantially more for a product that answers it.

High-value pools concentrate in welted construction, in comfort footwear with published fit range, and in region-specific lasts for the Asian markets growing fastest. Where the product is a cemented synthetic sneaker sold online on image and a size number, the same factories supply everybody and around a third of the units shipped come straight back.

Volume / Commodity-Adjacent

Mass cemented synthetic and vulcanised footwear sold on image, price, and a size number alone. The twelve-point range reflects sourcing position and marketing weight rather than any fit or construction capability a buyer could evaluate first.
Gross Margin: 34% to 46%

Premium / Certified

Comfort construction and cemented leather footwear offering multiple width fittings and genuine last development. The twelve-point range separates real fit range capability from brands adjusting a size chart and calling it a fitting option.
Gross Margin: 52% to 64%

Sustainability / Regulatory / Next-Generation

Goodyear welted and stitchdown construction with published wear life, resoling service, and disclosed last dimensions. The fourteen-point range reflects manufacturing capability and fit disclosure, neither of which can be assembled in a season.
Gross Margin: 68% to 82%
casual-shoes-market-portfolio-architecture-1790020361352

High-value Sub-segments and Strategic Watch-out

Welted Resoleable Construction

Highest value in the category and the only construction that survives repairability requirements without retooling anything at all. The fourteen-point range reflects skilled manufacturing capacity, which most of the industry lost decades ago and cannot rebuild quickly. Brazilian and Southern European capacity is positioned unusually well.
Gross Margin: 70% to 84%

Published Fit Range Comfort Footwear

High value serving buyers arriving from formal footwear who choose on how a shoe feels rather than what its cushioning is called. The fourteen-point range reflects genuine width fitting depth against brands offering a single last in more sizes. Repeat purchase follows a known last rather than a new product.
Gross Margin: 56% to 70%

Region-Specific Last Development

Volume core in the fastest growing markets, where measured foot shape differs materially from the Western lasts global brands ship. The twelve-point range reflects last development investment, which domestic competitors have already made. Adjusting a size chart does not address a shape difference at all.
Gross Margin: 46% to 58%

Mass Cemented Synthetic Sneakers

The strategic watch-out. Same factories supply everybody, nothing can be resoled, and roughly a third of online units return on fit. The twelve-point range reflects marketing weight and sourcing position with nothing else defending it. Around a third of online units come straight back on fit.
Gross Margin: 32% to 44%

How This Demand Repeats

Replacement runs on wear rather than on season for most of this category, and wear is set by construction. A cemented shoe reaches end of life when the sole wears through and is discarded, which puts replacement on a cycle of roughly a year to eighteen months for regular wear. A welted shoe gets resoled instead, which extends life by years and moves revenue from replacement into service.
Repeat purchase depends heavily on whether the first pair fitted. A customer who found a comfortable last returns to the same brand and frequently to the same model, because they are buying a known shape rather than a new product. A customer whose first pair fitted badly rarely gives the brand another attempt, which is why a fit return rate near 29% online costs far more than the handling expense it appears as.

The buyer is shifting as formal footwear demand completes its transfer into this category and as older consumers arrive without ever having worn technical sneakers. That buyer asks about width fittings and about whether the shoe can be repaired, and very few brands can answer either question. Brands organised around image and technical narrative reach almost none of them.
casual-shoes-market-end-use-penetration-index-1790020361854

Where This Market Rewards

These are among the four positions where our research anticipates prominent divergence between winners and laggards over the coming forecast period. Each is grounded in the demand model, the regulatory perimeter, and the announced capacity pipeline.
01 / LAST DIMENSION DISCLOSURE

Two per cent publish the number

Around 2% of products publish last width, volume, and instep dimensions while fit accounts for about 29% of online returns, which is the largest avoidable cost anywhere in this industry. Brands publishing measured internal dimensions and offering multiple width fittings report return rates 2.8 times lower alongside materially better repeat purchase. Lasts are treated as proprietary design assets, which is precisely why the disclosure has never happened, and return rates vary enormously between lasts within identical styling, which nobody measures.
02 / WELTED CAPACITY QUALIFICATION

Ninety-four per cent cannot be repaired

Roughly 94% of category volume is built by cemented or injection moulded methods that cannot be resoled, while repairability requirements advance into product regulation and public procurement. Brands qualifying welted or stitchdown capacity ahead of requirement report compliance readiness 3.4 times faster than reactive retoolers. Retooling a cemented line is a capital and skills change measured in years, so buying that optionality early costs far less, and the skills and equipment simply do not transfer from a cemented production line.
03 / HONEST CATEGORY POSITIONING

Seventy-one per cent never runs

About 71% of footwear sold as performance product is never used for the sport it was engineered for, which means a large share of technical development serves people walking to a train station. Brands designing casual-first product with honest positioning report gross margin 2.2 times better than those funding performance engineering nobody consumes. The technical story sells and the technical engineering largely does not get used at all, and separating what is marketed from what is engineered is the uncomfortable part of it.
04 / REGIONAL LAST ADAPTATION

Western lasts fit Western feet

Global brands ship lasts drafted for Western foot proportions into South Asian and East Asian markets where measured foot shape differs materially in width and instep height. Brands developing region-specific lasts report share capture 2.6 times greater than those adapting sizing alone in the same markets. Domestic brands already compete on exactly this and win, and adjusting a size chart does not address a shape difference, and domestic brands in those markets already compete on exactly this and win consistently.

Engagement Snapshot From the Field

A live engagement with an industry participant carrying material or product regulatory and market exposure ahead of a defining policy shift, showing how our research translates into a defensible multi-year portfolio strategy.
MARKET MINDS ADVISORY · CLIENT ENGAGEMENT SUMMARY
Casual Shoes Producer Strategic Portfolio Review and Transition Roadmap 2026·Investment Scenario on Casual Shoes Exposure Evaluation 2025-26
CLIENT PROFILE
A global footwear brand with casual revenue near USD 2.1 billion (client-reported, unverified by MMA) across North America, Western Europe, and Asia. Online return rates had risen for three consecutive years, and European regulatory affairs had flagged advancing repairability requirements the product portfolio could not meet at all. Returns had never been analysed by last. The two issues had never been discussed together internally.
STRATEGIC CHALLENGE
Returns were being managed as a logistics cost rather than a product problem, and the brand had no visibility of which lasts drove them. The repairability exposure had been raised repeatedly by regulatory affairs and had never reached product planning in any form. Regulatory affairs and product planning were not connected.
MMA APPROACH
MMA analysed returns by last rather than by style, measured internal dimensions across the range against customer foot measurements in three markets, assessed the portfolio against published repairability timetables, and modelled last disclosure and welted capacity qualification against the incumbent plan. Returns were analysed by last rather than by style, which is the level at which fit actually varies.
KEY FINDINGS
  1. Return rates varied enormously between lasts within the same styling, and two lasts accounted for a disproportionate share of the total across every market examined.
  2. Measured customer feet in the Asian markets diverged materially in width and instep from the lasts being shipped there, which no size chart adjustment could address.
  3. No product in the range could be resoled, and published European repairability timetables gave less time than retooling a cemented line typically requires.
  4. Competitor brands publishing width fittings held materially lower return rates in the same channels selling comparable product at comparable prices. Nobody had benchmarked that.
CLIENT PROFILE
A global footwear brand with casual revenue near USD 2.1 billion (client-reported, unverified by MMA) across North America, Western Europe, and Asia. Online return rates had risen for three consecutive years, and European regulatory affairs had flagged advancing repairability requirements the product portfolio could not meet at all. Returns had never been analysed by last. The two issues had never been discussed together internally.
STRATEGIC CHALLENGE
Returns were being managed as a logistics cost rather than a product problem, and the brand had no visibility of which lasts drove them. The repairability exposure had been raised repeatedly by regulatory affairs and had never reached product planning in any form. Regulatory affairs and product planning were not connected.
MMA APPROACH
MMA analysed returns by last rather than by style, measured internal dimensions across the range against customer foot measurements in three markets, assessed the portfolio against published repairability timetables, and modelled last disclosure and welted capacity qualification against the incumbent plan. Returns were analysed by last rather than by style, which is the level at which fit actually varies.
KEY FINDINGS
  1. Return rates varied enormously between lasts within the same styling, and two lasts accounted for a disproportionate share of the total across every market examined.
  2. Measured customer feet in the Asian markets diverged materially in width and instep from the lasts being shipped there, which no size chart adjustment could address.
  3. No product in the range could be resoled, and published European repairability timetables gave less time than retooling a cemented line typically requires.
  4. Competitor brands publishing width fittings held materially lower return rates in the same channels selling comparable product at comparable prices. Nobody had benchmarked that.
RECOMMENDED STRATEGY
Phase 1: Phase one: withdraw or redevelop the two worst-performing lasts and publish measured internal dimensions across the remaining range. Report return rates by last from that point onward. Phase 2: Phase two: develop region-specific lasts for the Asian markets rather than continuing to adapt sizing on Western shapes. Measure feet locally rather than adapting charts. Phase 3: Phase three: qualify welted manufacturing capacity now against the published regulatory timetable rather than retooling later. Treat the timetable as binding rather than advisory.
OUTCOME
Online return rates fell by roughly a quarter within two seasons of the last withdrawals and dimension publishing (client-reported, unverified by MMA). Welted capacity was qualified ahead of the timetable. Returns are now reported by last rather than by style across the whole business. Asian share improved after the regional lasts shipped.

Frequently Asked Questions

Foundational context covering the market sizes, CAGR, scope, country, region and competition that inform every finding below. This section is provided to cover basics and most often pre-purchase conversations, answered from the MMA Primary Research Dataset.

What is the current size of the Casual Shoes Market?

The market was worth USD 96.0 billion in 2025 and stands at USD 101.4 billion in 2026. Value covers non-athletic everyday footwear at brand selling price.

How large will the Casual Shoes Market be by 2036?

MMA forecasts USD 174.9 billion by 2036, an increase of USD 73.5 billion across the forecast period. That represents 1.72 times the 2026 base of USD 101.4 billion.

What is the CAGR for the Casual Shoes Market 2026 to 2036?

The base case compound annual growth rate is 5.6%, with a bull case at 6.8% and a bear case at 4.4%. Historical growth from 2020 to 2025 ran at 4.5%.

Which segment is growing fastest?

Goodyear welted and resoleable construction grows at 8.4%, half again the market rate of 5.6%. Repairability is moving from a heritage argument into a regulatory requirement.

Who are the major companies in the Casual Shoes Market?

Nike, Adidas, Skechers, Deckers Outdoor and VF Corporation lead the field. Together they hold 33% of category revenue, with domestic Asian brands strong on regional fit.

Which country is growing fastest?

India grows at 9.8%, as footwear consumption per household rises and organised retail reaches well beyond the largest cities. Domestic manufacture supplies most of the mass tier.

Report Segmentation Architecture

The full report scope spans multiple orthogonal segmentation dimensions, with cross-tabulated demand data provided for each dimension pair. Coverage extends further to regional breakdowns, trend trajectories, and the competitive detail needed to support segment-level decision-making.

By Construction Method

  • Goodyear Welted and Resoleable Construction
  • Stitchdown and Blake Construction
  • Cemented Leather Construction
  • Cemented Synthetic Sneaker Construction
  • Vulcanised Construction
  • Injection Moulded Comfort Construction

By End-Use Industry

  • Everyday Urban Wear
  • Workplace Casual Dress
  • Travel and Leisure Wear
  • Comfort and Extended Standing Use
  • Youth and Student Wear
  • Heritage and Enthusiast Collecting

By Commercial Dimension

  • Brand Direct to Consumer Online
  • Multi-Brand Footwear Retail
  • Department Store Distribution
  • Mass and Value Retail
  • Specialist Comfort and Fit Retail
  • Resale and Secondary Market Channels

By Region

  • East Asia
  • North America
  • Western Europe
  • South Asia and Pacific
  • Latin America
  • Middle East and Africa
  • Eastern Europe

Scope, Methodology, and Coverage

Every figure in this report is reproducible from documented input assumptions. The scope below maps the historical period, the forecast horizon, the segmentation dimensions, and the countries covered, alongside the underlying primary and qualitative methodology.
Historical Period
2020 to 2025
Forecast Period
2026 to 2036
Base Year
2025 (USD billions; MMA Primary Research Dataset, September 2026)
Market Definition
This market covers non-athletic everyday footwear across construction methods, including Goodyear welted and resoleable construction, stitchdown and Blake construction, cemented leather construction, cemented synthetic sneaker construction, vulcanised construction, and injection moulded comfort construction. It excludes performance footwear used for its designed sport, formal and dress footwear, safety and occupational footwear, orthopaedic and medical footwear, and slippers and indoor-only footwear.
Quantitative Units
USD billions, revenue at brand selling price
Segmentation Dimensions
Construction method, end-use setting, commercial dimension, region
Regions Covered
East Asia, North America, Western Europe, South Asia and Pacific, Latin America, Middle East and Africa, Eastern Europe
Countries Covered
China, Japan, South Korea, Taiwan, India, Indonesia, Vietnam, Thailand, Philippines, Australia, United States, Canada, Mexico, Germany, Italy, Spain, Portugal, France, United Kingdom, Netherlands, Poland, Romania, Czechia, Brazil, Argentina, Colombia, Saudi Arabia, United Arab Emirates, Ethiopia, South Africa
Key Companies Profiled
Nike, Adidas, Skechers, Deckers Outdoor, VF Corporation, Puma, New Balance, ASICS, Anta Sports, Li Ning, Crocs, Wolverine World Wide, Steve Madden, Caleres, Genesco, Birkenstock, Dr Martens, ECCO, Clarks, Bata Corporation
Quantitative Methodology
Primary survey, n=3,800 respondents, Q4 2025, six countries; demand-side model with trade association cross-validation
Qualitative Methodology
47 expert interviews, Q4 2025; applied to validate demand model assumptions, identify emerging dynamics, and assess competitive positioning
Report Format
PDF and XLSX data workbook (Word format preview document)
Publisher
Market Minds Advisory
Report Code
MMA-2026-CON-711
Published
September 2026
Contact
sales@marketmindsadvisory.com | www.marketmindsadvisory.com

Purchase the full Casual Shoes Market Report (2026 to 2036).

The full report sizes the casual shoes market across six construction methods, seven regions, and thirty countries, with forecasts to 2036 under base, bull, and bear cases. It quantifies how much performance footwear is worn casually rather than athletically, measures last dimension disclosure against online fit returns, and assesses portfolio exposure to advancing repairability requirements. Competitive analysis covers twenty participants evaluated consistently on category revenue, with detailed treatment of fit range capability and welted manufacturing capacity. Regional foot shape divergence and resale value coverage are analysed throughout. Primary research includes 3,800 survey responses and 47 expert interviews.
Six construction methods sized and forecast separately
Twenty participants evaluated on category revenue consistently
Performance footwear worn casually quantified against athletic classification
Last dimension disclosure measured against online fit returns
Portfolio exposure assessed against repairability regulatory timetables
Regional foot shape divergence compared with shipped last dimensions

Built For The People Who Decide

From boardroom strategy to bench-side execution, this report is read cover-to-cover by leaders shaping the next decade of their industry, turning demand scenarios, market dynamics and valuation benchmarks into decisions.
CXOs/ Presidents/ VPs/ Managers
M&A and Corporate Development
Strategy Teams and R&D Heads
Procurement and Product Directors
Regulatory and Compliance Leaders
Investor Relations and Equity Analysts