Market Minds Advisory
Cargo Handling Equipment Market

Cargo Handling Equipment Market: Crane Orders Follow Vessel Size, Not Trade Volume

A commercial reading of port machinery, where ship dimensions rather than cargo volume drive replacement, one country builds most of the cranes, and electrification arrived through emissions rules nobody negotiated.

Lead Analyst

David Horsley

Published

September 2026

Make Smarter Decisions with Customized Research Insights

Request a free sample report and evaluate market opportunities, growth trends, and competitive dynamics relevant to your business needs.

2025 MARKET VALUE$28.9BMarket Size 2025
2036 FORECAST VALUE$49.4BBase Case , 2026 to 2036
CAGR 2026 TO 20365.0 %Bull 6.1% / Bear 4.0%
INCREMENTAL OPPORTUNITY$19.1BNet 10- year value creation
EXPANSION MULTIPLE1.63x2036 value over 2026 base
Strategic Levers
M&A Pipeline
Regional Outlook
Country Rankings
Competitive Intelligence
Segmental Deep-dive
Call-Us : 91 93563 13602

Executive Snapshot and Market Trajectory

A terminal does not buy a new crane because throughput rose. It buys one because a larger vessel arrived and the existing crane cannot reach across it, which means ship design decisions taken in Korean shipyards determine capital spending in ports on every continent, years in advance.
The market stands at USD 28.9 billion in 2025 and reaches USD 49.42 billion by 2036 at a 5.0% CAGR. Electric and hybrid terminal tractors grow fastest at 11.8%, about 2.36 times the overall rate, as port emissions rules force replacement regardless of remaining diesel equipment life. East Asia holds 29% of value on Chinese manufacturing and terminal investment, while India posts the quickest national growth at 9.4% on national port development programmes.
Concentration is high, with the top five holding roughly 57% of equipment revenue and a single Chinese manufacturer supplying most of the world's container cranes. Two forces are now reshaping the field. Port emissions regulation has made electrification a compliance requirement rather than an efficiency choice, and several jurisdictions have raised security concerns about crane control systems that no commercial argument has been able to resolve.
Market Definition
The cargo handling equipment market covers machinery that moves freight within ports, terminals, and intermodal facilities, spanning ship-to-shore container cranes, yard cranes and stacking equipment, mobile handling equipment including reach stackers and straddle carriers, terminal tractors and yard trucks, and bulk and specialised handling systems. Vessels and barges, shipping containers themselves, warehouse automation inside distribution facilities, port civil infrastructure, and terminal operating software sold separately are excluded.
Base Year Value
$28.9B in 2025 (MMA Primary Research Dataset, August 2026)
Forecast Period
2026 to 2036, eleven discrete annual values
CAGR
5.0% base case. Bull 6.1%. Bear 4.0%.
Fastest Growth Segment
Electric and Hybrid Terminal Tractors: 11.8% CAGR
Fastest Growth Country
India: 9.4% CAGR
Fastest Growth Region
South Asia and Pacific: 7.0% CAGR
Largest Region
East Asia: 29% of 2025 global value
Market Leaders
ZPMC, Konecranes, Kalmar, Liebherr, Cargotec. Source: MMA Analysis based on company annual reports.
Primary Survey
n=3,800 procurement and R&D decision-makers, Q4 2025, six countries
Methodology
Demand-side build-up, cross-validated against public data, 47 expert interviews

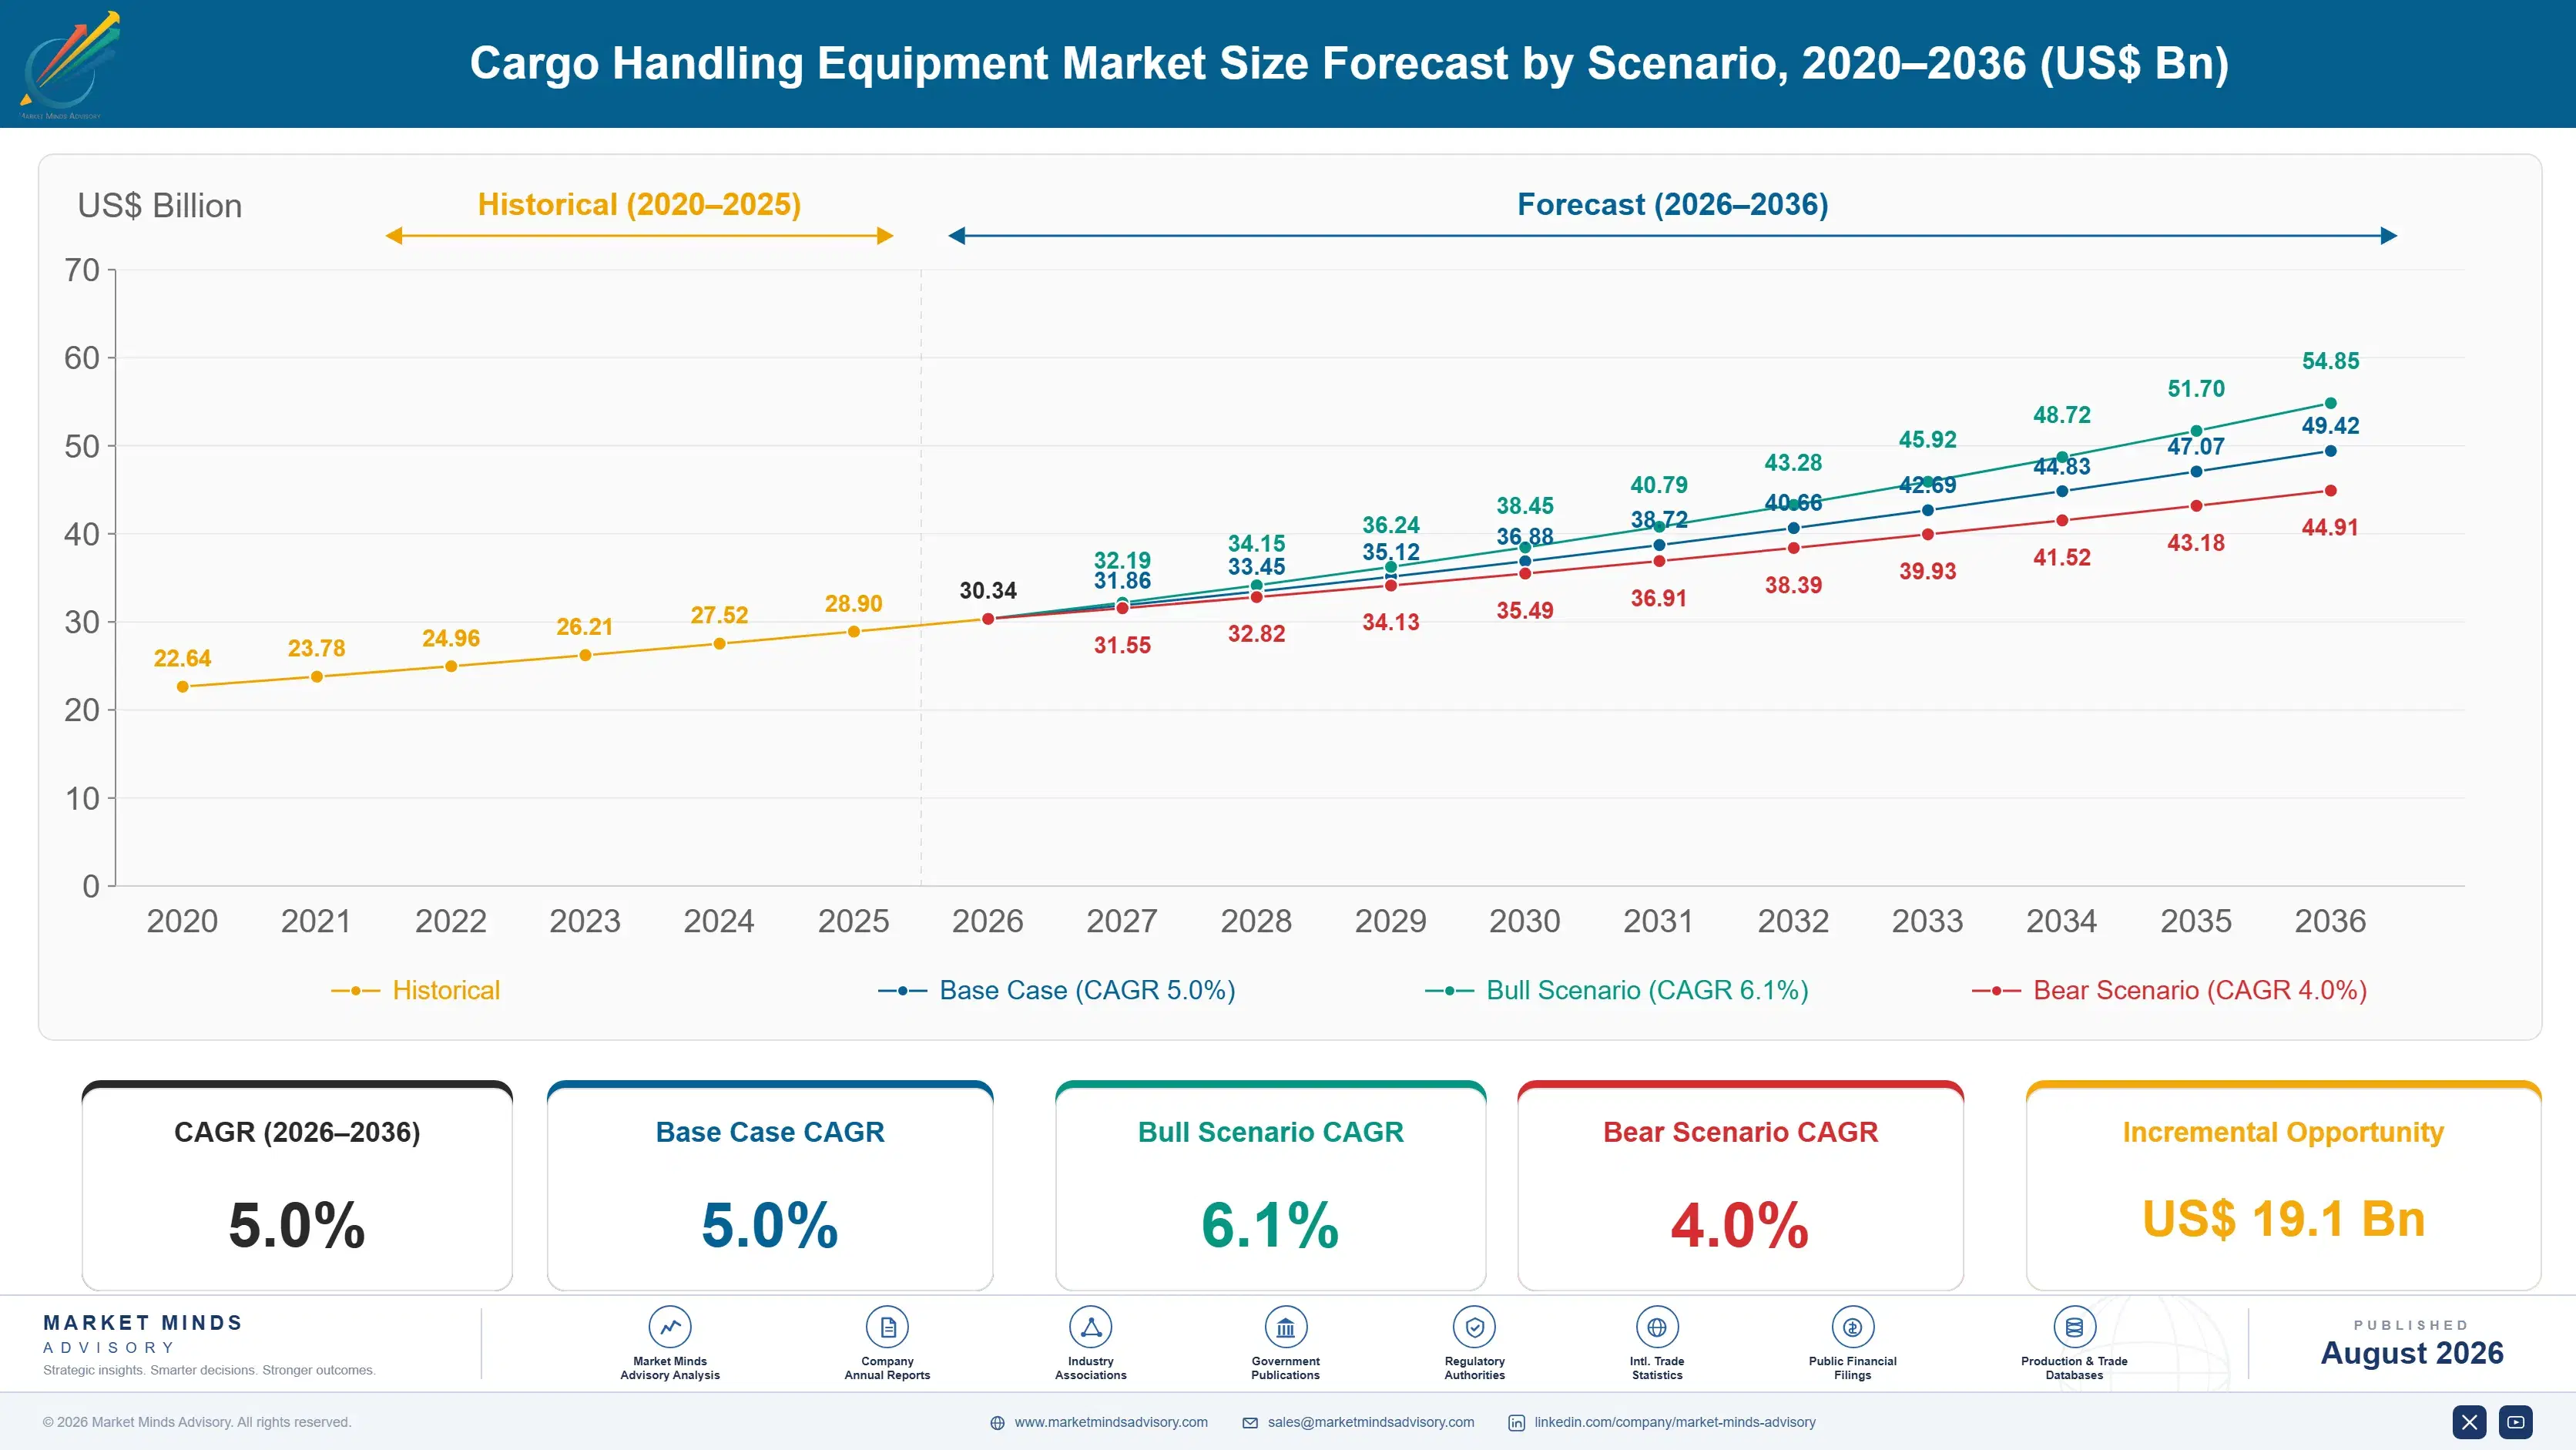
Cargo Handling Equipment Market Forecast Scenarios

cargo-handling-equipment-market-size-forecast-scenario-1787324509492
Growth from 2020 to 2025 compounded near 4.0%, and congestion did more for order books than trade growth did. Port bottlenecks through 2021 and 2022 exposed terminals that could not handle arriving volumes, and operators ordered equipment they had deferred for years. Freight rates funded it comfortably. Ordering then normalised as congestion cleared and terminal operators returned to replacement cycles rather than capacity panic.
Three mechanisms carry the base case to 5.0%. First, vessel upsizing: each generation of larger container ship requires cranes with greater outreach and lift height, which strands otherwise serviceable equipment on physical grounds alone. Second, emissions regulation, since port authorities in California, northern Europe, and several Asian hubs now restrict diesel equipment on timetables that override remaining asset life. Third, automation retrofit, as terminals add remote operation and stacking automation to existing yards rather than rebuilding them.
The bull case at 6.1% assumes emissions deadlines hold and vessel upsizing continues at recent rates, forcing replacement across more terminals simultaneously. The bear case at 4.0% assumes trade fragmentation reduces long-haul container volumes, terminal operators defer capital under freight rate weakness, and security restrictions on Chinese equipment raise costs enough that some projects simply do not proceed.

Why Ship Dimensions Set The Replacement Cycle

Three forces set demand. Vessel upsizing provides the hardest driver, because a crane that cannot reach across an arriving ship is obsolete regardless of its mechanical condition or remaining service life. Emissions regulation provides the second, overriding asset life on a compliance timetable no operator negotiates. And automation provides the third, as terminals retrofit remote operation and automated stacking into yards that were never designed for either.
MARKET CONCENTRATIONCR5: 57%Highly concentrated with one manufacturer dominating container cranes
CRANE SERVICE LIFE25 to 40 yearsWorking life of a ship-to-shore crane before replacement becomes necessary
TOP PRODUCING COUNTRYChina: 70%Largest single national share of container crane output worldwide
STEEL COST SHAREAbout 38%Structural steel as a portion of finished crane manufacturing cost
DELIVERY LEAD TIME18 to 36 monthsPeriod from order placement to commissioned equipment on quay
ELECTRIC FLEET SHAREAbout 16%Terminal handling equipment now operating without diesel propulsion
The commercial character rests on how long equipment lasts against how quickly requirements change. A ship-to-shore crane runs 25 to 40 years mechanically, but the vessels it serves have grown through several generations in that time. Terminals consequently scrap functioning equipment on dimensional grounds, which is an unusual replacement logic. Lead times of 18 to 36 months mean the order must be placed well before the larger vessels actually arrive.
The next decade turns on two things. Whether security restrictions on Chinese crane supply genuinely reshape sourcing, since one manufacturer builds roughly 70% of container cranes and no Western alternative exists at comparable cost or capacity. And whether electrification proceeds on the regulatory timetable, because charging infrastructure and grid connection at ports frequently lag the equipment deadlines by several years.
"Terminals scrap perfectly good cranes because a ship got wider. That is the whole capital cycle, and it means the order book is set in shipyards rather than by anything happening on the quay. The operators who plan against trade forecasts instead of vessel orderbooks are consistently surprised."
Director, Ports and Terminal Equipment Practice · MMA Industrial Equipment / Por

Market Trends

Security Concerns Complicate Chinese Crane Sourcing

United States legislation and executive action have raised concerns about control systems and communications equipment in ship-to-shore cranes supplied from China, which builds roughly 70% of world output. Funding has been directed toward domestic manufacturing capability that does not currently exist at competitive scale. The commercial difficulty is stark: no Western manufacturer builds container cranes at comparable cost or volume, so restricting supply raises cost and lengthens delivery rather than shifting sourcing cleanly. Terminal operators caught between compliance requirements and the absence of alternatives are deferring orders while the position clarifies.
Market Impact: Cranes last 25 to 40 years
Port Emissions Rules Override Remaining Asset Life

California air quality regulations, northern European port authority conditions, and rules at several Asian hubs now restrict diesel terminal equipment on fixed timetables regardless of how much service life remains. That converts electrification from an efficiency calculation into a replacement deadline, which is a completely different purchasing conversation. Terminal tractors and yard equipment are affected first because duty cycles suit battery operation well. The complication is infrastructure, since charging capacity and grid connection at ports routinely lag the equipment deadlines by several years and no operator controls that timing. Deadlines do not move for infrastructure.
Market Impact: Retrofit costs 40% of newbuild

Market Opportunities and Growth Drivers

Vessel Upsizing Strands Otherwise Serviceable Cranes

Each generation of larger container ship demands greater crane outreach and lift height, and a crane that cannot span an arriving vessel is commercially obsolete whatever its mechanical condition. Ships have grown through several size generations while cranes were built to last 25 to 40 years, so terminals routinely scrap functioning equipment on dimensional grounds alone. The replacement decision is therefore made in shipyards rather than on the quay, and operators tracking trade volume forecasts rather than vessel order books are consistently caught out by the timing. Timing surprises operators who track the wrong indicator.
Market Impact: Grid connections take 42 months

Automation Retrofit Extends Existing Yard Capacity

Building a new automated terminal costs enormous capital and requires land that most established ports simply do not have. Retrofitting remote crane operation, automated stacking, and yard management into existing facilities delivers a substantial share of the throughput gain at a fraction of the cost. Operators at Rotterdam, Los Angeles, and several Asian hubs have taken that route deliberately rather than building new. The equipment implication is demand for automation-capable yard cranes and control systems rather than for complete terminal builds, which changes the order profile considerably. Land scarcity makes retrofit the only realistic route.
Market Impact: Orders swing 40% annually

Market Restraints and Challenges

Charging Infrastructure Lags Equipment Deadlines Badly

Electrifying a terminal fleet requires grid connection, charging capacity, and often substation upgrades that take years to permit and build, while emissions deadlines are set by regulation. The root cause is that port authorities control equipment rules while utilities control connection timing, and the two operate on entirely different schedules. Commercially this leaves operators facing compliance dates they cannot physically meet. Participants mitigate through battery-swap systems, opportunity charging during natural dwell periods, hybrid equipment as a transitional step, and on-site generation or storage that bypasses grid constraints entirely. Nobody controls both halves of that timetable.
Market Impact: China builds 70% of cranes

Terminal Capital Follows Freight Rates Rather Than Plans

Container terminal operators fund equipment from cash generated by handling volumes, and freight rate collapses cut that cash faster than any budget process responds. The root cause is that terminal revenue correlates with a shipping cycle notoriously difficult to forecast. Commercially this produces order books that swing violently while manufacturing capacity stays fixed, so suppliers face utilisation problems no sales effort resolves. Manufacturers respond with service and parts revenue that persists through downturns, refurbishment programmes, leasing structures, and geographic spread across terminals on unrelated trade routes. Manufacturing capacity stays fixed while orders swing.
Market Impact: Electric fleet reaches 16%
3 additional market trends, 4 additional growth drivers, and 2 additional restraints and challenges are covered in the full report. Contact sales@marketmindsadvisory.com to access the complete intelligence.

Segment CAGR and Growth Architecture

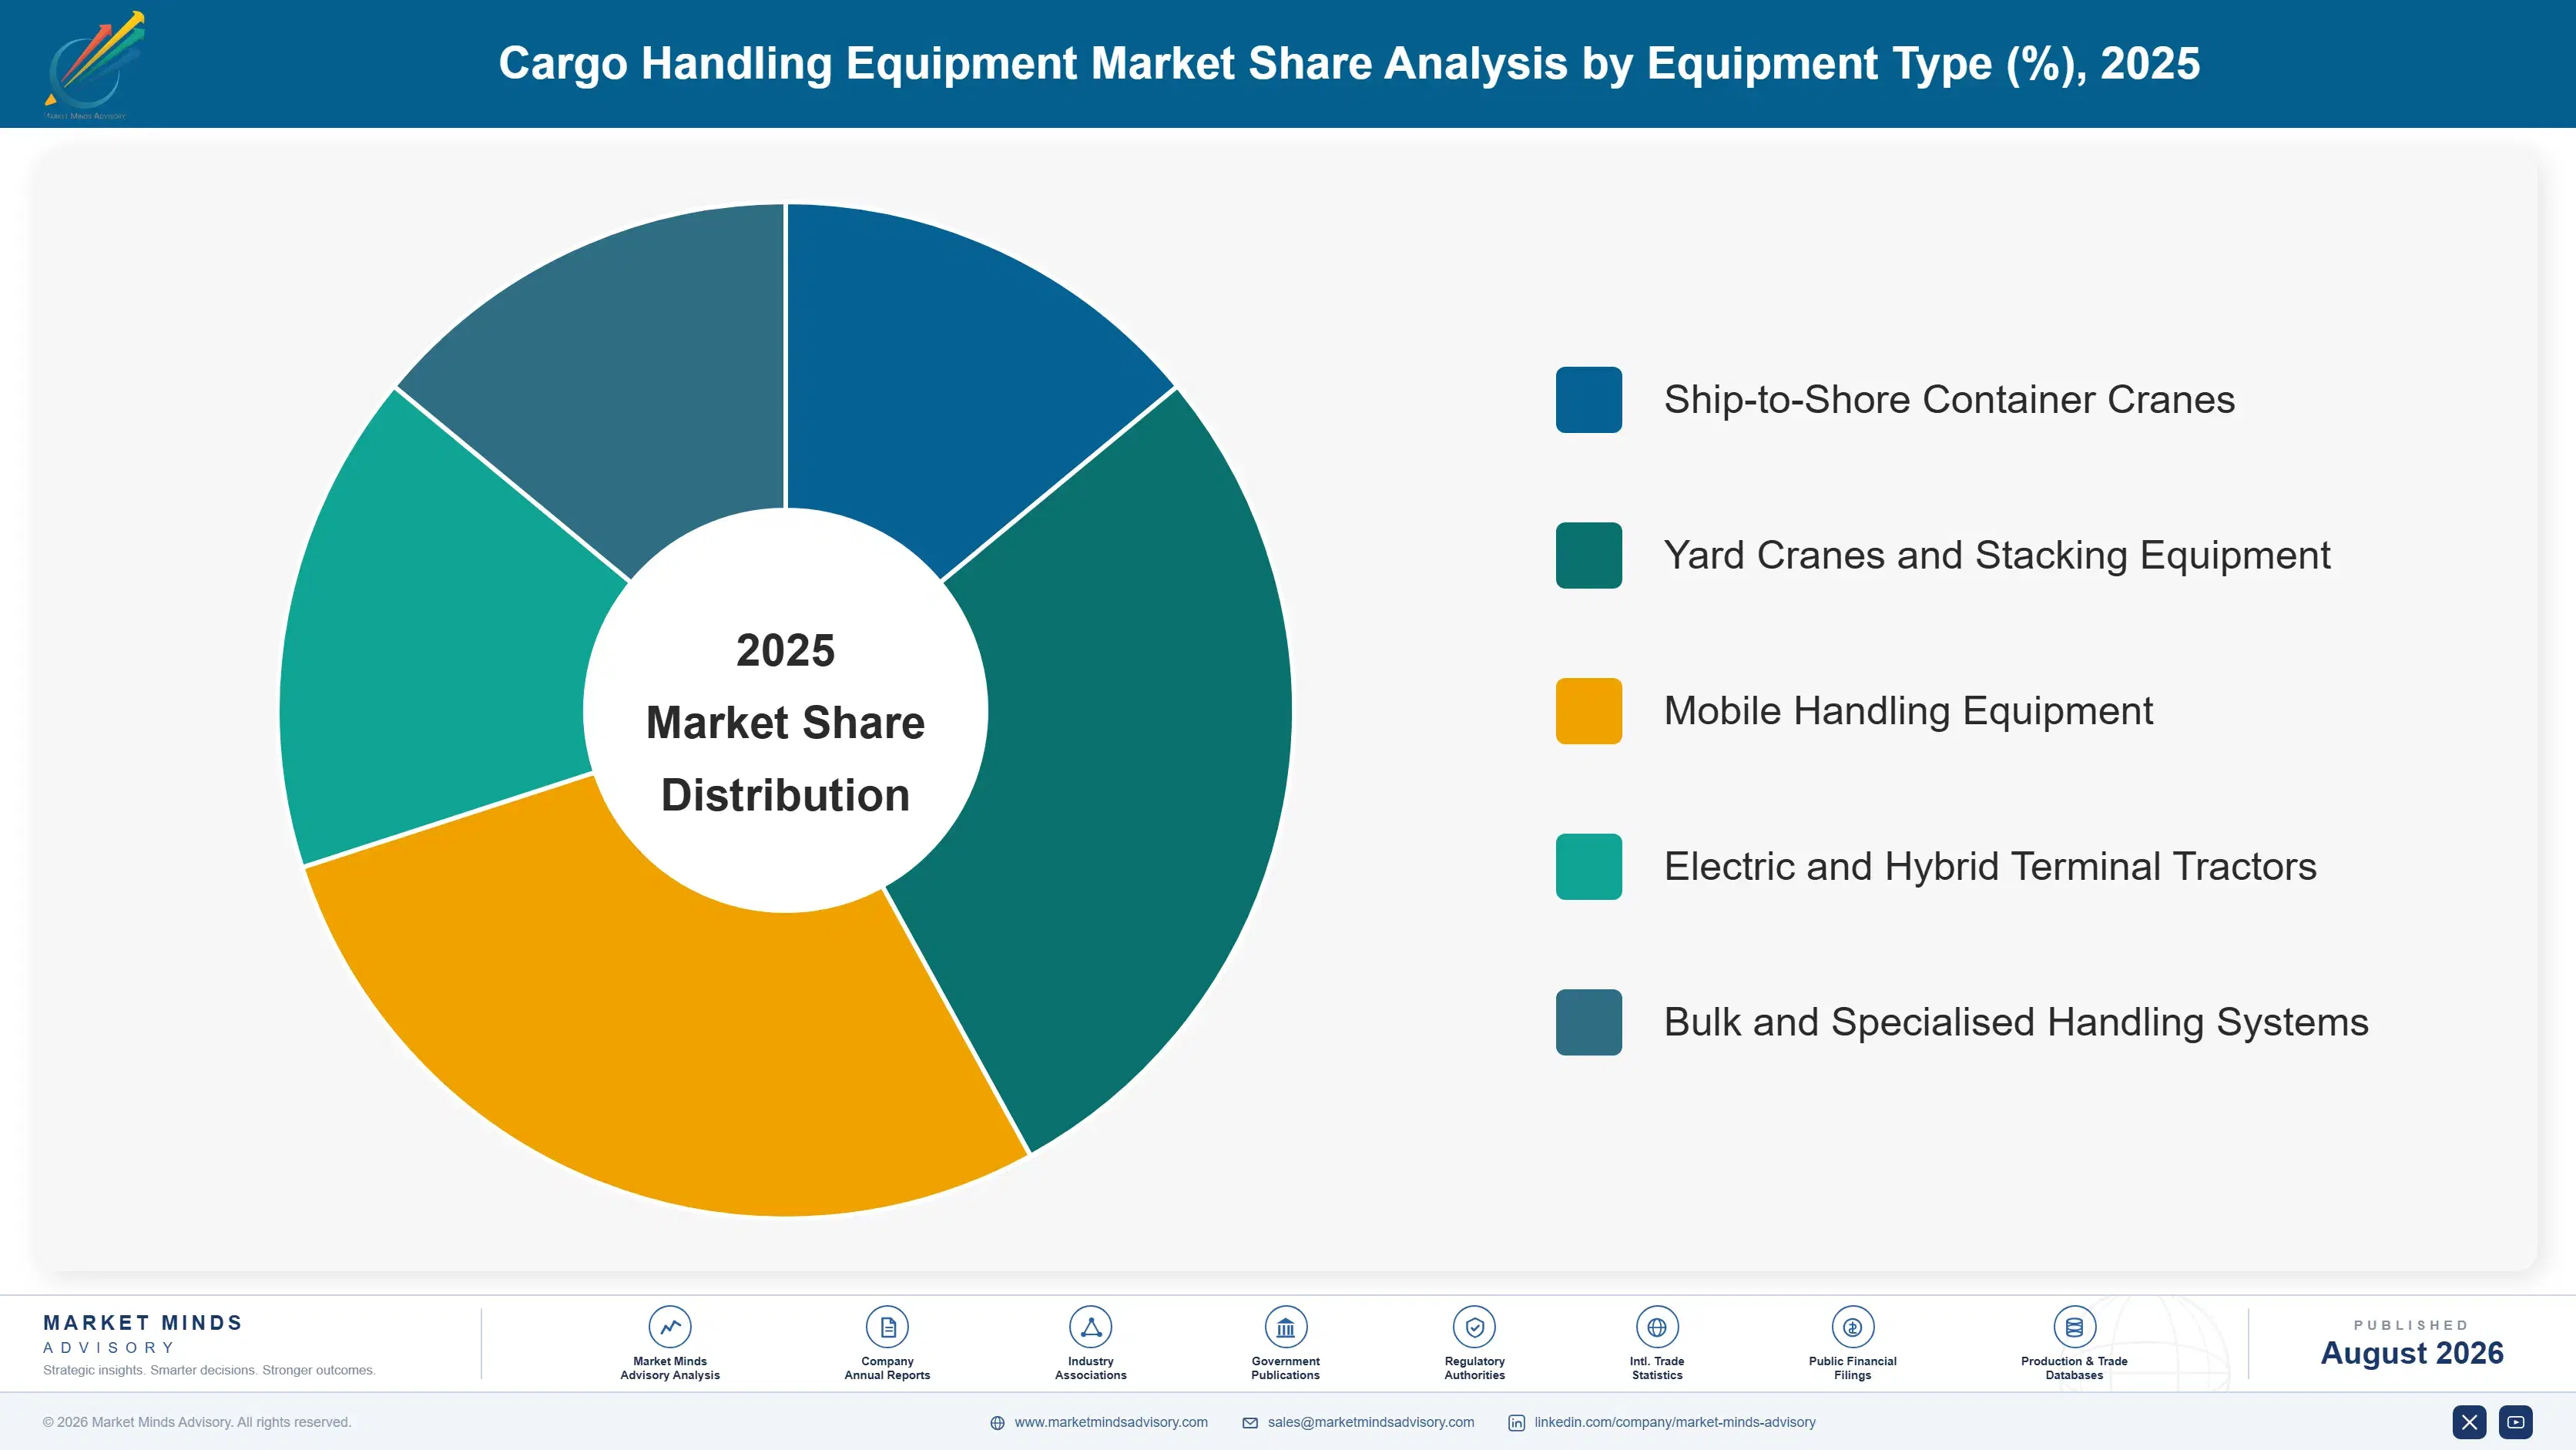
Segmentation follows equipment type, a single machinery logic describing what the unit physically does within the terminal. Each type carries its own capital intensity, replacement driver, electrification path, and competitive field, so commercial position tracks the machine rather than the port served. End-use facility type and procurement model appear separately within the framework as distinct dimensions.
cargo-handling-equipment-market-market-share-analysis-1787324510038

Electric and Hybrid Terminal Tractors

Electric and hybrid terminal tractors grow fastest at 11.8%, about 2.36 times the overall 5.0% rate, and emissions regulation rather than operating cost explains almost all of it. Terminal tractors suit battery operation unusually well, since duty cycles are predictable, distances are short, and vehicles return to known points where charging can be installed. Port authorities in California, northern Europe, and several Asian hubs have set diesel restriction deadlines that override remaining asset life entirely. The constraint is charging infrastructure rather than vehicle availability, because grid connection and substation work at ports takes years while the deadlines do not move. Battery swap and opportunity charging have both emerged as practical responses to that mismatch.
CAGR 11.8%

Yard Cranes and Stacking Equipment

Yard cranes and stacking equipment grow at 6.4%, the second-fastest type, covering rubber-tyred and rail-mounted gantry cranes, automated stacking cranes, and the control systems that operate them remotely. Automation retrofit is the driver rather than capacity expansion, since terminals unable to acquire land raise throughput inside existing yards by automating stacking and running cranes remotely from control rooms. Electrification is further advanced here than in mobile equipment because rail-mounted cranes can draw power directly from the yard. Automated stacking also removes the labour that port unions have historically defended most firmly, which makes deployment a negotiated process rather than a purely commercial one in several jurisdictions. Negotiation rather than economics decides deployment pace.
CAGR 6.4%
Full segment breakdown across 5 segments available in the complete report.

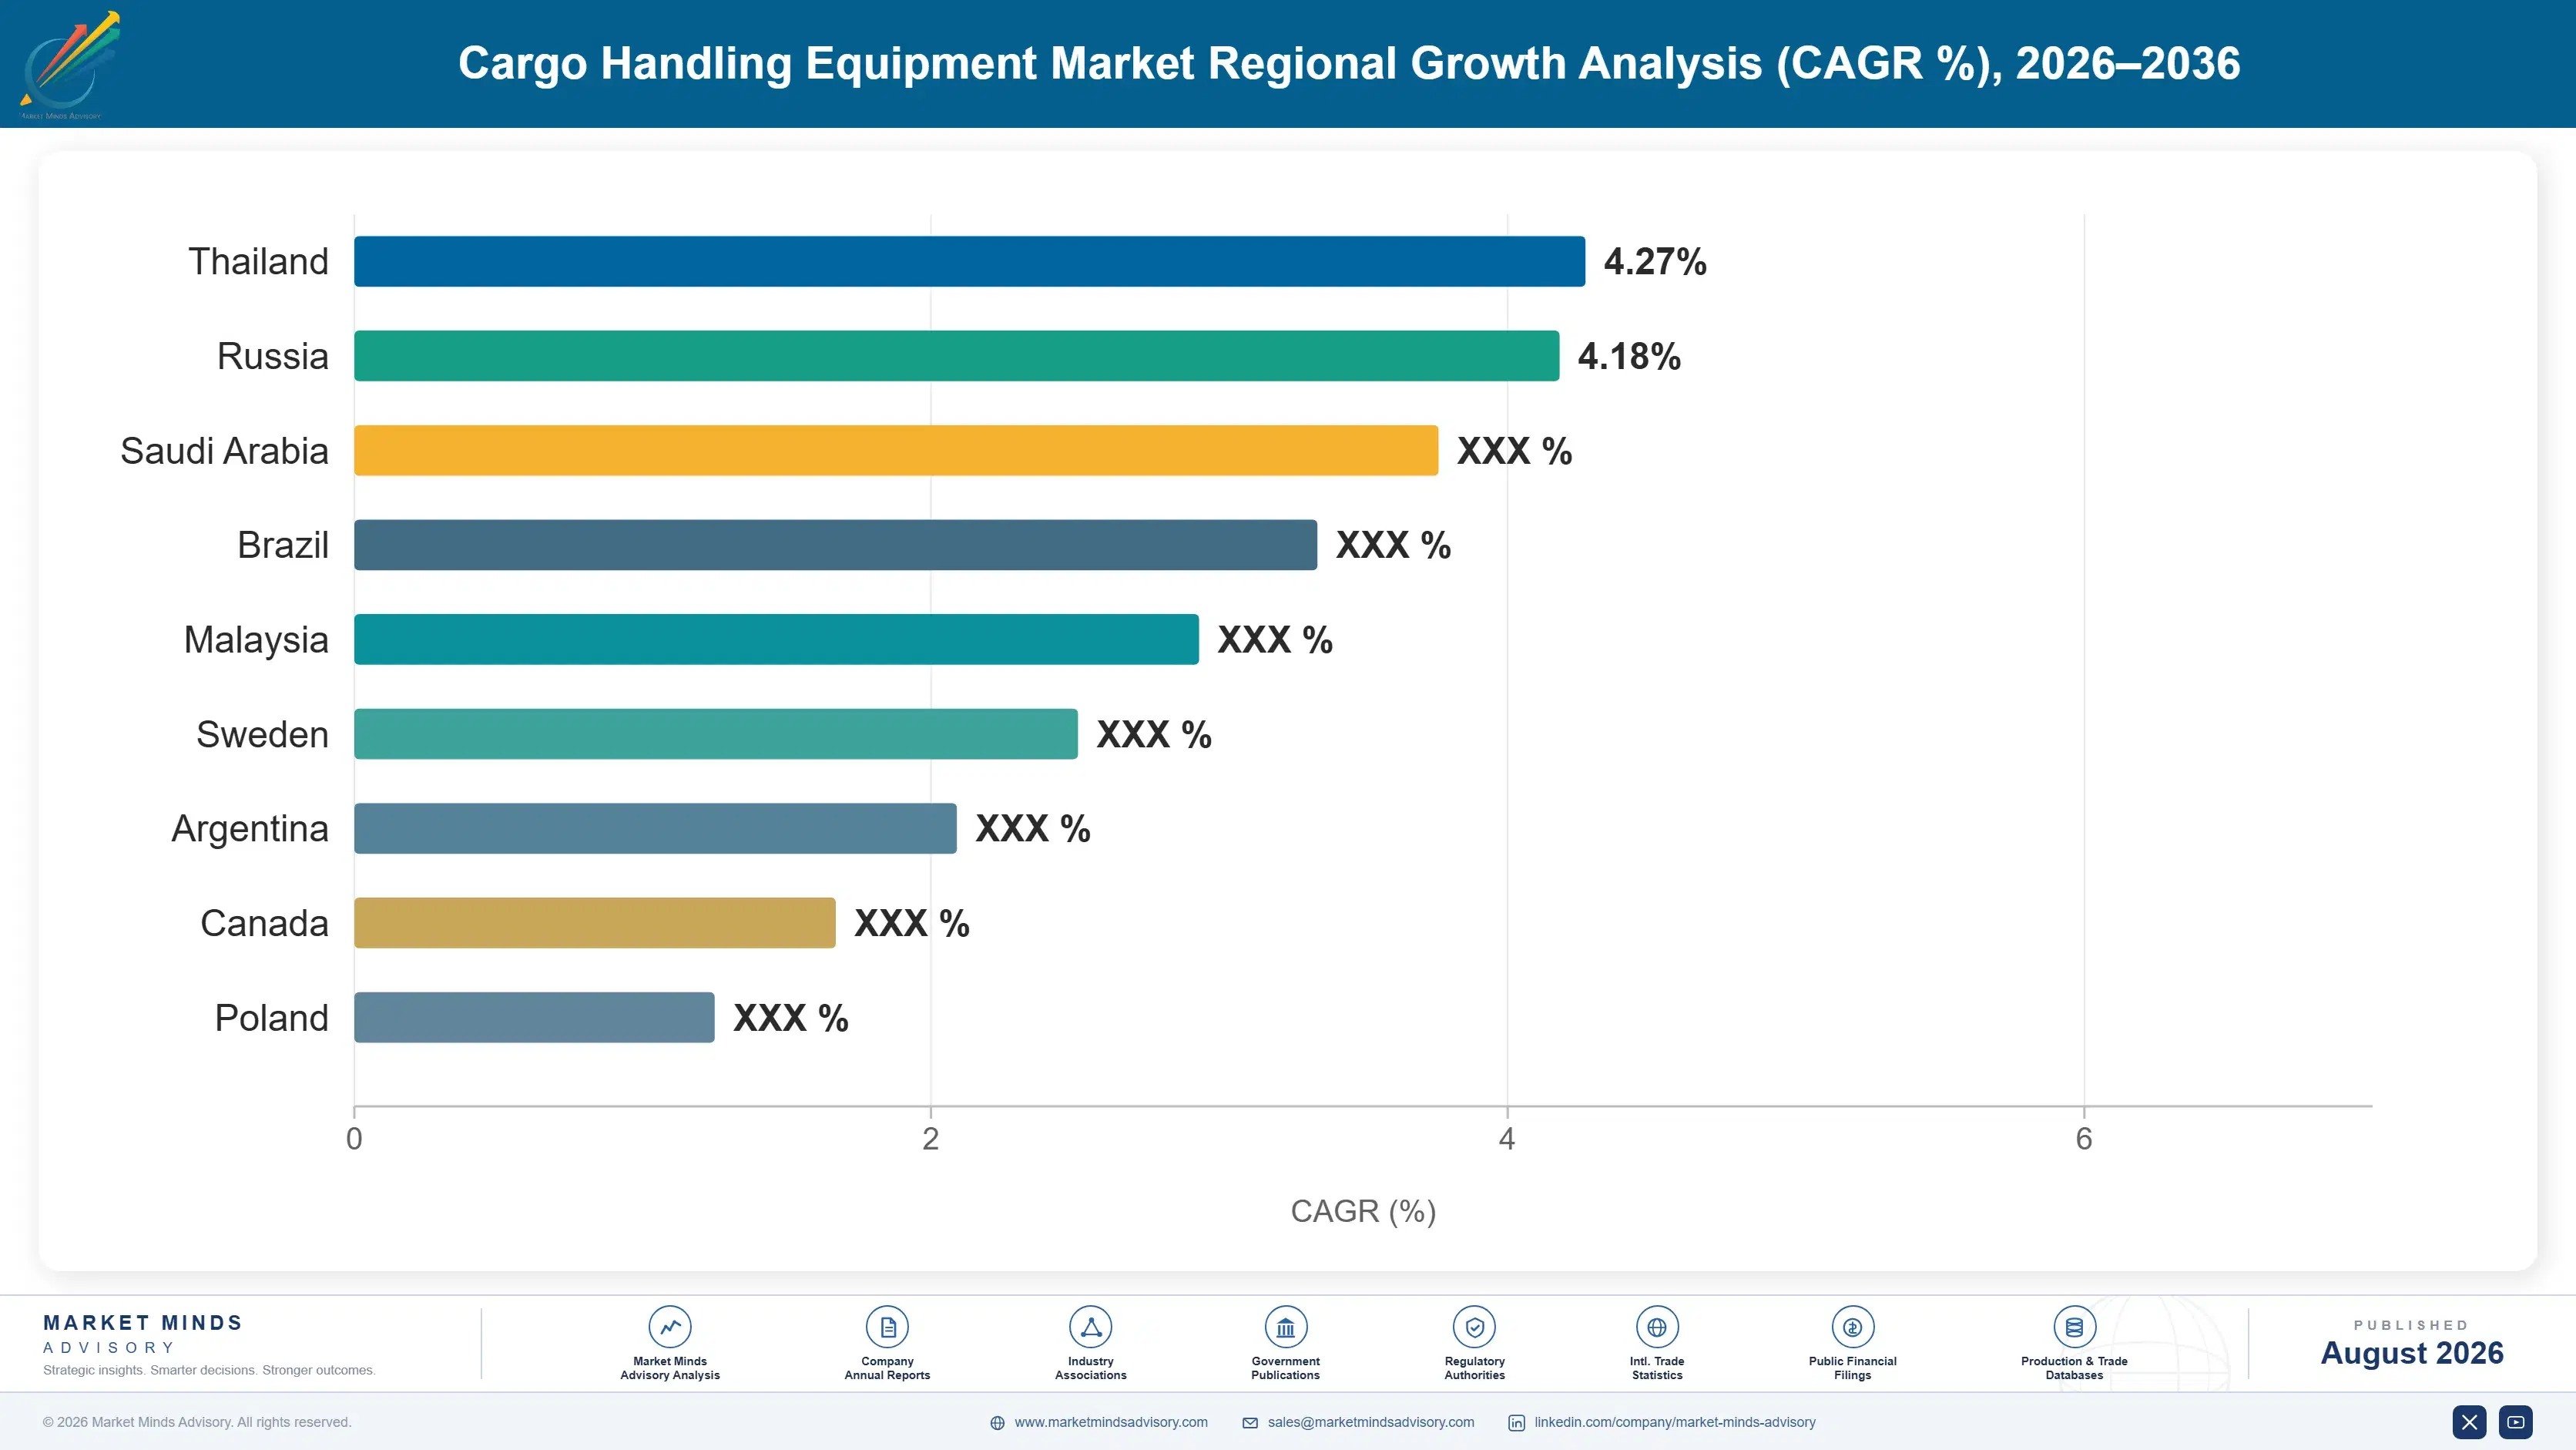
Regional Architecture and Country Demand Map

Container throughput and terminal investment together set this distribution, with manufacturing concentrated almost entirely in one country regardless of where equipment operates. East Asia leads on both throughput and production, while other regional shares track terminal capital cycles rather than any local manufacturing base. Manufacturing location explains most of it.

North America

North America holds 25% of value, and policy rather than throughput growth has become the dominant variable. Security concerns about Chinese-supplied ship-to-shore cranes have prompted legislation, funding for domestic manufacturing capability that does not yet exist at scale, and genuine uncertainty for terminal operators mid-procurement. Californian air quality rules simultaneously impose the most demanding diesel restriction timetable anywhere, forcing electrification across Los Angeles and Long Beach on deadlines that charging infrastructure struggles to meet. Port congestion investment from the pandemic period has largely worked through. Growth of 5.4% reflects electrification mandates and automation retrofit against ordering deferred while sourcing questions remain unresolved. No compliant alternative exists at comparable cost today.
Share: 25% | CAGR: 5.4% (2026 to 2036)

Western Europe

Automation and emissions regulation together define this market. Western Europe holds 23% of value, with Rotterdam, Hamburg, and Antwerp among the most automated terminals anywhere and port authority conditions restricting diesel equipment ahead of most other jurisdictions. Land scarcity forces throughput gains inside existing footprints, which favours automation retrofit over new terminal construction. Konecranes, Kalmar, Liebherr, and Cargotec all manufacture here, giving the region genuine supply capability outside container cranes specifically. Container volumes have been weak and Red Sea rerouting disrupted established patterns. Growth of 3.6% is the slowest of the seven, reflecting mature throughput and terminal capital that freight weakness has constrained. Land scarcity favours retrofit over new construction.
Share: 23% | CAGR: 3.6% (2026 to 2036)
Regional intelligence for 5 additional markets available in the complete report: East Asia, South Asia and Pacific, Latin America, Middle East and Africa, Eastern Europe. Contact sales@marketmindsadvisory.com.
cargo-handling-equipment-market-country-cagr-analysis-1787324510563

Where Equipment Suppliers Actually Earn Returns

Competing on crane price against a manufacturer that builds seventy per cent of world output is a contest nobody outside China wins. The four moves below shift earnings toward ground that scale cannot take: service across a forty-year asset life, electrification systems, automation retrofit, and the sourcing restrictions that briefly reopened a closed market.

Build Service Revenue Across The Asset Life

A ship-to-shore crane operates 25 to 40 years and consumes spares, inspection, refurbishment, and control system upgrades throughout, which generates revenue long after the manufacturing margin is spent. Service also persists through the freight rate downturns that swing new equipment orders by 40% annually, which is the only stabiliser available in this business. Suppliers should contract service at the point of sale rather than negotiating afterwards, since a competitor can win the parts business on an installed crane far more easily than the crane itself. Losing service surrenders the only stable revenue available.
Market Impact: Cranes operate 25 to 40 years gener

Sell Electrification As Compliance, Not Efficiency

Port authorities in California, northern Europe, and several Asian hubs restrict diesel equipment on timetables that override remaining asset life entirely, which makes electrification a deadline rather than a payback calculation. Operators facing a compliance date evaluate suppliers on delivery certainty and charging integration rather than on operating cost projections. Suppliers offering charging infrastructure, battery swap, and grid integration alongside the vehicles win work that vehicle-only competitors cannot, because the infrastructure is the harder half of the problem. Roughly 16% of terminal equipment now runs without diesel, and the deadlines keep tightening.
Market Impact: Electric fleet share has reached on

Target Automation Retrofit Over New Terminal Builds

A new automated terminal needs land most established ports cannot obtain, while retrofitting remote operation and automated stacking into existing yards delivers much of the throughput gain at roughly 40% of newbuild cost. That makes retrofit the larger and more reliable opportunity, and it favours suppliers who can integrate with equipment already installed rather than those selling complete systems. Operators at Rotterdam and Los Angeles took this route deliberately. Suppliers should build retrofit capability and reference projects rather than waiting for greenfield terminal awards. Greenfield terminal awards arrive far too rarely to plan around.
Market Impact: Retrofit costs roughly 40% of a new

Position Against Sourcing Restrictions While They Hold

Security concerns have complicated Chinese crane procurement in North America, and funding has been directed toward domestic capability that does not currently exist at competitive scale. That creates a genuine opening for non-Chinese manufacturers, though it is a policy window rather than a permanent shift and cost gaps have not closed. Suppliers should pursue affected terminal operators and government-funded programmes actively now, because the window closes either when domestic capacity arrives or when the restrictions soften. Roughly 70% of world supply sits inside the restricted origin, which is what created the opening.
Market Impact: Restrictions affect roughly 70% of

Who Controls the Margin Pool

Concentration is high: the top five hold roughly 57% of equipment revenue, and one Chinese manufacturer supplies most ship-to-shore container cranes. The gap between that manufacturer and everyone else is one of scale and cost rather than engineering capability, since crane design is well understood across the industry. All participants here are assessed on one basis, revenue from port and terminal handling equipment and service, excluding vessels, containers, and warehouse automation.
Competition runs along four lines. First, manufacturing cost and delivery, where Chinese scale is genuinely difficult to match. Second, service network density, since equipment running 25 to 40 years generates more revenue after installation than at it. Third, automation and control capability, which decides retrofit work. Fourth, electrification and charging integration, now a compliance requirement rather than an optional feature in several jurisdictions.

Pressure is building from two directions. Security restrictions on Chinese supply have opened a policy window for Western manufacturers, though none has capacity at comparable cost. Meanwhile terminal operators facing electrification deadlines are consolidating purchasing toward suppliers who can deliver charging infrastructure alongside equipment. Rankings should favour suppliers with service depth and electrification capability over those competing on equipment specification and price alone.
cargo-handling-equipment-market-company-positioning-matrix-1787324511083

Competitive Moat and Risk Dimensions

ZPMC

Moat: Unmatched crane manufacturing scale

ZPMC builds roughly seventy per cent of world container cranes from Chinese yards, at a cost and delivery capability no competitor approaches on comparable specification. Vertical integration through steel supply and heavy fabrication controls the largest cost element directly. Installed base across terminals on every continent generates service and parts revenue alongside continuing new equipment demand from repeat customers.
ZPMC

Risk: Security restrictions and concentration

Security concerns about control systems have prompted legislation and funding aimed at reducing dependence on its supply in North America. Concentration in one product category leaves it exposed to container terminal capital cycles with limited offsetting business. Its scale advantage also becomes a fixed cost burden when freight rate weakness cuts terminal ordering across multiple regions simultaneously.
KONECRANES

Moat: Service network and installed base

Konecranes generates a substantial share of revenue from service across an installed base spanning ports, terminals, and industrial lifting, which persists through the equipment order cycles that swing violently. Geographic service density supports response commitments that manufacturers without local presence cannot credibly offer. Breadth beyond container handling into industrial cranes spreads exposure across unrelated demand patterns considerably.
KONECRANES

Risk: Cost position against Chinese scale

European manufacturing costs sit well above Chinese competitors on comparable equipment, which confines it to segments where service, automation, or restrictions justify the premium. Container terminal capital cycles remain volatile and correlate with the industrial demand its other divisions serve rather than offsetting it. Automation capability also faces competition from terminal operating system vendors approaching from software rather than machinery.

Players Tracked

Prominent Players

ZPMC
Konecranes
Kalmar
Liebherr
Cargotec

Other Key Players

Terex Port Solutions
Sany Marine
Hyster-Yale
Anhui Heli
Mitsui E&S
TCM Handling
Taylor Machine Works
Toyota Industries
Doosan Industrial Vehicle
SANY Heavy Industry
Bromma
Elme Spreader
Terberg
Orange EV
BYD Forklift

Recent Developments

FEBRUARY 2024

United States announces funding for domestic crane manufacturing

The administration set out investment aimed at establishing domestic ship-to-shore crane manufacturing capability alongside measures addressing security concerns in equipment sourced from China. This was a funding and policy announcement rather than any commercial transaction, and it targeted a capability that does not currently exist at competitive scale domestically.
Signal: Funding capability that takes years to bui
SEPTEMBER 2024

California advances zero-emission cargo handling equipment requirements

Californian regulatory work progressed on requirements phasing diesel cargo handling equipment out of port operations on defined timetables, affecting terminal tractors, yard equipment, and mobile handling machinery. This was regulatory development rather than legislation or any transaction, and it set deadlines independent of remaining equipment service life.
Signal: Deadlines that override asset life turn el
JUNE 2024

Singapore Tuas terminal development progresses through further phases

Construction and equipment installation advanced at the Tuas port development, one of the largest single automated terminal projects under way anywhere, consolidating container operations from existing city terminals. This was progress on an existing project rather than a new award, and it represents equipment demand at unusual concentration.
Signal: A handful of megaprojects move this market

Structural Steel, Drives, Electrification, Assembly Labour

Steel dominates the cost sheet in a way few equipment markets match. Structural steel accounts for roughly 38% of finished crane cost, purchased in heavy plate from mills close to the fabrication yard because freight on that weight is punishing. Drives, motors, and control systems take 22% to 28%. Assembly and welding labour adds 16% to 22%, and electrification hardware 8% to 14% on new equipment.
Steel prices moved violently through 2021 and 2022 and manufacturers on fixed-price contracts absorbed most of it. Plate prices rose sharply as energy costs lifted mill output costs across Europe and Asia, with IEA analysis recording the energy movement behind it. Konecranes and Cargotec both disclosed material cost pressure in 2022 reporting. Orders quoted eighteen months earlier carried inflation no escalation clause had anticipated, damaging margin on substantial backlogs.

Exposure separates by steel sourcing and contract structure rather than by scale. A Chinese manufacturer buys plate domestically at prices Western fabricators pay freight and duty above. One quoting fixed prices on equipment delivering 36 months later carries commodity risk nobody forecasts accurately. That is why Chinese cost advantage persists and why Western manufacturers moved toward service, automation, and electrification where steel matters less.
cargo-handling-equipment-market-cost-volatility-analysis-1787324511282

Index long-delivery contracts to published steel benchmarks

Equipment quoted today and delivered 36 months later carries steel exposure across a period no manufacturer can forecast, as 2022 demonstrated across the industry. Escalation clauses tied to published plate benchmarks convert that into a mechanical adjustment rather than a margin gamble. Terminal operators resist them, though they concede more readily on long-delivery equipment, which is where the exposure sits.

Shift revenue mix toward service and electrification content

Steel is over a third of crane cost and Chinese fabricators buy it cheaper, so steel-heavy equipment is a losing position for Western manufacturers. Service across a forty-year asset life, automation retrofit, and charging integration all carry high value with modest steel content. The investment is capability and network density rather than fabrication capacity, which is cheaper and faster.

Standardise drive and control platforms across equipment ranges

Bespoke control engineering for each equipment type multiplies development cost and complicates service across an installed base running for decades. A common drive and control platform across cranes, straddle carriers, and tractors converts engineering into configuration and simplifies spares holding considerably. The constraint is that terminal operators specify variations freely, which product teams accommodate rather than resist.

Portfolio Architecture for Margin Defence

The portfolio splits into three tiers with sharply different economics. Ship-to-shore cranes and heavy steel equipment form the volume tier, competing on delivered cost against Chinese fabrication with margin set by steel sourcing and yard efficiency. Mobile handling and yard cranes earn more because service attachment and specification variety narrow the field. Electrification systems, automation retrofit, and lifetime service sit differently again, priced against compliance or throughput rathe
The tension runs between equipment revenue that fills yards and service revenue that survives the cycle. New equipment orders swing 40% annually with freight rates, making manufacturing utilisation difficult to plan, while service across a forty-year asset life continues regardless. Yet the equipment sale creates the installed base service depends on. Manufacturers handling this well contract service at point of sale rather than surrendering it afterwards.

High-value pools concentrate where capability or compliance limits competition: charging infrastructure integrated with electric equipment, automation retrofit into existing yards, control system upgrades on installed cranes, and supply into terminals affected by sourcing restrictions. All four escape the steel cost comparison. Standard ship-to-shore cranes sit at the other end, competing against a manufacturer building most of world output at costs nobody outside China matches.

Volume / Commodity-Adjacent Tier

Ship-to-shore container cranes, conventional yard gantries, and heavy steel-intensive handling equipment. The range is wide because steel sourcing location dominates everything, and Chinese fabricators earn respectably where Western yards struggle to cover cost.
Gross Margin: 6-18%

Premium / Certified Tier

Reach stackers, straddle carriers, specialised bulk handling, and equipment carrying significant service attachment. The range is wide because service attachment rates and specification variety both differ enormously between terminal operators and regions.
Gross Margin: 16-30%

Sustainability / Regulatory / Next-Generation Tier

Electric and hybrid equipment with charging integration, automation retrofit, remote operation systems, and lifetime service contracts. The range is wide because service contracts earn strongly while electrification still carries unrecovered development and infrastructure integration cost.
Gross Margin: 24-46%
cargo-handling-equipment-market-portfolio-architecture-1787324511789

High-value Sub-segments and Strategic Watch-out

Electric and Hybrid Terminal Tractors

High value and high growth at 11.8%, the fastest type, driven by diesel restriction deadlines that override remaining asset life entirely. Charging infrastructure rather than vehicle availability is the constraint, since grid connection at ports takes years while regulatory deadlines do not move. Battery swap is the practical response.
Gross Margin: 26-44%

Yard Cranes and Stacking Equipment

High value with strong growth at 6.4%, carried by automation retrofit rather than capacity expansion across land-constrained terminals. Rail-mounted designs electrify readily, though automated stacking removes labour that port unions have historically defended most firmly of all. Rail-mounted designs electrify more readily than mobile equipment.
Gross Margin: 20-34%

Ship-to-Shore Container Cranes

The value core by revenue, growing at 4.2% on vessel upsizing that strands otherwise serviceable equipment on dimensional grounds. One manufacturer builds roughly 70% of output, which leaves everyone else competing where sourcing restrictions or service depth justify a premium. Sourcing restrictions briefly changed that arithmetic.
Gross Margin: 6-18%

Mobile Handling Equipment

The strategic watch-out, growing at 4.6% across reach stackers, straddle carriers, and empty container handlers in a field crowded with forklift manufacturers. Electrification is arriving on regulatory timetables, and differentiation has narrowed to service response and charging integration. Forklift manufacturers compete aggressively on price here.
Gross Margin: 16-30%

How Terminal Equipment Orders Commit

Demand commits per project and recurs through service for decades. A terminal orders equipment when vessel dimensions, emissions deadlines, or a concession award force it, then operates that equipment for 25 to 40 years while buying spares, inspection, and upgrades throughout. That makes the installed base the durable asset and the equipment order the entry ticket. Suppliers who surrender service at handover give away the revenue that survives every downturn in new ordering.
Stickiness varies sharply by equipment type and integration depth. Automated stacking and control systems stick hardest, since they integrate with terminal operating software and retraining operators is expensive. Ship-to-shore cranes stick through spares and structural inspection relationships across decades. Yard cranes stick moderately, reopening at refurbishment. Mobile equipment sticks least of all, competing at each replacement against forklift manufacturers with comparable products and aggressive pricing.

Buyer profiles have shifted as global terminal operators consolidated, replacing individual port authorities with procurement functions negotiating across dozens of facilities. Those buyers standardise equipment and demand consistent service globally, which advantages suppliers with network reach. Compliance and sustainability functions now also participate, since emissions deadlines and reporting have moved equipment specification into conversations that engineering once held alone.
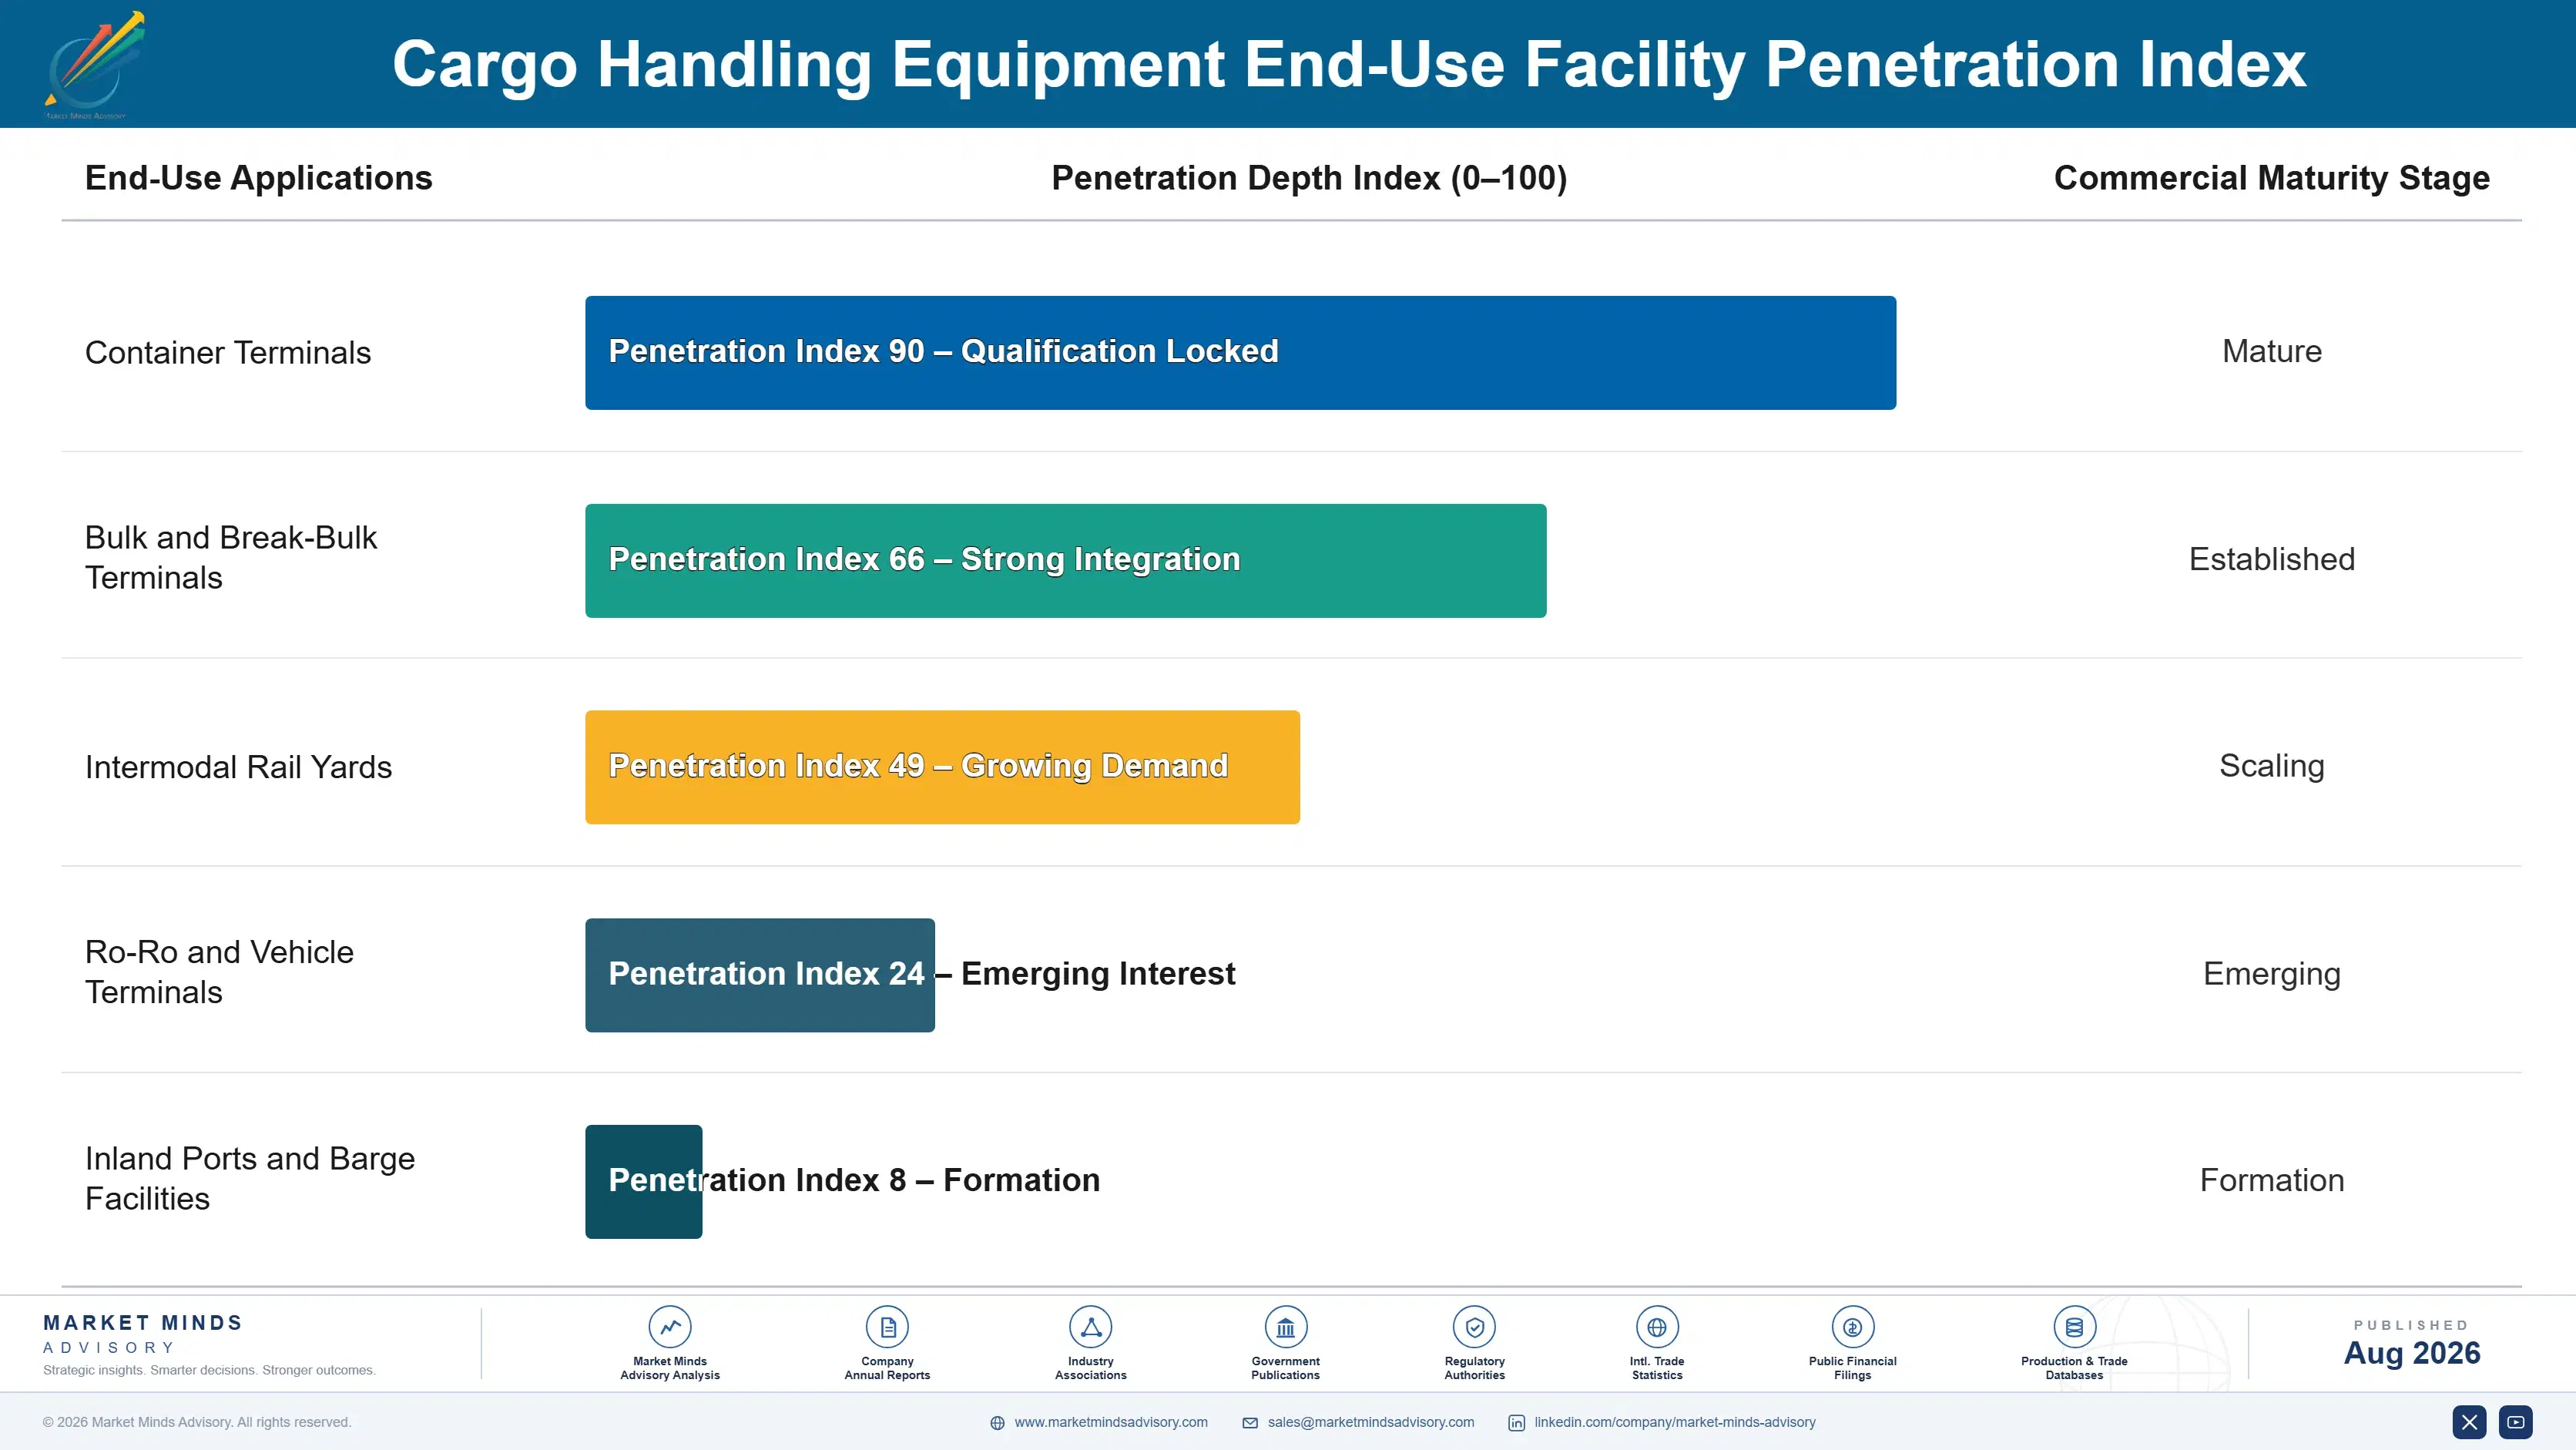
cargo-handling-equipment-market-end-use-penetration-index-1787324512279

Our Call On Cargo Handling

These are among the four positions where our research anticipates prominent divergence between winners and laggards over the coming forecast period. Each is grounded in the demand model, the regulatory perimeter, and the announced capacity pipeline.
01 / SHIPS SET THE CYCLE

Vessel dimensions strand cranes that still work perfectly

A crane that cannot span an arriving vessel is commercially obsolete whatever its mechanical condition, and cranes are built to last 25 to 40 years while ships have grown through several size generations across that same period. The replacement decision is therefore taken in shipyards rather than anywhere on the quay. Terminal operators and suppliers should plan capital and capacity against vessel order books rather than trade volume forecasts, because the two diverge and only one of them actually drives equipment purchases.
02 / SERVICE SURVIVES CYCLES

Equipment orders swing while the installed base keeps paying

New equipment ordering swings roughly 40% annually with freight rates that nobody forecasts reliably, while a crane operating 25 to 40 years consumes spares, inspection, refurbishment, and control upgrades throughout its life regardless of the shipping cycle. Service is therefore the only genuine stabiliser available anywhere in this business. Manufacturers should contract service terms at point of sale rather than afterwards, because a competitor wins the parts business on an installed crane far more easily than it ever wins the crane itself.
03 / COMPLIANCE BEATS PAYBACK

Emissions deadlines removed the electrification business case

Port authorities in California, northern Europe, and several Asian hubs now restrict diesel equipment on fixed timetables that override remaining asset life entirely, which converts electrification from an operating cost calculation into a hard replacement deadline. Operators facing a fixed date evaluate delivery certainty and charging integration rather than any fuel saving projection. Suppliers offering charging infrastructure, battery swap, and grid integration alongside vehicles win work that vehicle-only competitors cannot, because the infrastructure is genuinely the harder half of the problem.
04 / SOURCING WINDOW OPENED

Security restrictions briefly reopened a closed market

Security concerns have complicated Chinese crane procurement in North America, where roughly 70% of world supply originates, and funding has been directed toward a domestic capability that does not yet exist at competitive scale. That creates genuine opportunity for non-Chinese manufacturers, though it remains a policy window rather than any permanent shift. Suppliers should pursue affected operators and funded programmes now, because the window closes when capacity arrives or restrictions soften, whichever of those two happens first, and neither is predictable.

Engagement Snapshot From the Field

A live engagement with an industry participant carrying material or product regulatory and market exposure ahead of a defining policy shift, showing how our research translates into a defensible multi-year portfolio strategy.
MARKET MINDS ADVISORY · CLIENT ENGAGEMENT SUMMARY
Cargo Handling Equipment Producer Strategic Portfolio Review and Transition Roadmap 2026·Investment Scenario on Cargo Handling Equipment Exposure Evaluation 2025-26
CLIENT PROFILE
A container terminal operator running four facilities across two continents engaged MMA after emissions deadlines and crane sourcing restrictions arrived within the same planning cycle. The client reported a fleet of 214 diesel terminal tractors facing restriction deadlines, and two ship-to-shore crane orders paused mid-procurement over security compliance questions it could not resolve (client-reported, unverified by MMA).
STRATEGIC CHALLENGE
Grid connection studies showed charging capacity arriving two years after the diesel restriction deadline at the most exposed terminal, which no equipment purchase resolved. Meanwhile the paused crane orders had no compliant alternative supplier at comparable cost or delivery. The board needed a path that met the deadlines it could meet and a defensible position on the ones it could not.
MMA APPROACH
MMA modelled charging demand against grid connection timelines terminal by terminal, which no internal team had done at that granularity. We assessed battery swap, opportunity charging, and on-site generation as bridges across the gap between deadline and connection. We then evaluated compliant crane suppliers on genuine delivery capability rather than stated capacity, and tested refurbishment of existing cranes as an interim option.
KEY FINDINGS
  1. Charging capacity arrived 24 months after the restriction deadline at the most exposed terminal, and no equipment decision closed that gap alone (client-reported, unverified by MMA).
  2. Battery swap combined with on-site storage bridged the connection gap at roughly 31% of the cost of accelerating the grid connection itself.
  3. Only one compliant crane supplier could deliver within the required window, and its quoted price ran about 42% above the paused Chinese order.
  4. Refurbishing two existing cranes deferred the sourcing decision by six years at a small fraction of full replacement cost (client-reported, unverified by MMA).
CLIENT PROFILE
A container terminal operator running four facilities across two continents engaged MMA after emissions deadlines and crane sourcing restrictions arrived within the same planning cycle. The client reported a fleet of 214 diesel terminal tractors facing restriction deadlines, and two ship-to-shore crane orders paused mid-procurement over security compliance questions it could not resolve (client-reported, unverified by MMA).
STRATEGIC CHALLENGE
Grid connection studies showed charging capacity arriving two years after the diesel restriction deadline at the most exposed terminal, which no equipment purchase resolved. Meanwhile the paused crane orders had no compliant alternative supplier at comparable cost or delivery. The board needed a path that met the deadlines it could meet and a defensible position on the ones it could not.
MMA APPROACH
MMA modelled charging demand against grid connection timelines terminal by terminal, which no internal team had done at that granularity. We assessed battery swap, opportunity charging, and on-site generation as bridges across the gap between deadline and connection. We then evaluated compliant crane suppliers on genuine delivery capability rather than stated capacity, and tested refurbishment of existing cranes as an interim option.
KEY FINDINGS
  1. Charging capacity arrived 24 months after the restriction deadline at the most exposed terminal, and no equipment decision closed that gap alone (client-reported, unverified by MMA).
  2. Battery swap combined with on-site storage bridged the connection gap at roughly 31% of the cost of accelerating the grid connection itself.
  3. Only one compliant crane supplier could deliver within the required window, and its quoted price ran about 42% above the paused Chinese order.
  4. Refurbishing two existing cranes deferred the sourcing decision by six years at a small fraction of full replacement cost (client-reported, unverified by MMA).
RECOMMENDED STRATEGY
Phase 1: Phase 1 (0 to 10 months): Deploy battery swap and on-site storage to bridge the gap between diesel deadlines and grid connection dates. Phase 2: Phase 2 (10 to 24 months): Refurbish the two existing cranes rather than paying the compliant supplier premium under time pressure. Phase 3: Phase 3 (24 to 42 months): Place crane orders once domestic capacity or clarified restrictions improve the available supplier field.
OUTCOME
The client met its diesel restriction deadline using battery swap and on-site storage while grid connection proceeded on the utility's own schedule. Crane refurbishment deferred the sourcing decision past the current policy uncertainty, avoiding the premium the only compliant supplier had quoted under deadline pressure (client-reported, unverified by MMA).

Frequently Asked Questions

Foundational context covering the market sizes, CAGR, scope, country, region and competition that inform every finding below. This section is provided to cover basics and most often pre-purchase conversations, answered from the MMA Primary Research Dataset.

What is the current size of the Cargo Handling Equipment Market?

The global cargo handling equipment market is valued at USD 28.9 billion in 2025, covering ship-to-shore cranes, yard cranes, mobile handling equipment, terminal tractors, and bulk handling systems. Vessels, containers, and warehouse automation are excluded.

How large will the Cargo Handling Equipment Market be by 2036?

The market is forecast to reach USD 49.42 billion by 2036 in the base case, about 1.63 times the 2026 level. That represents incremental value of roughly USD 19.08 billion across the decade.

What is the CAGR for the Cargo Handling Equipment Market 2026 to 2036?

The market grows at a 5.0% CAGR in the base case, with bull and bear scenarios at 6.1% and 4.0%. The spread turns mainly on emissions deadlines holding and how sourcing restrictions resolve.

Which segment is growing fastest?

Electric and hybrid terminal tractors grow fastest at 11.8%, about 2.36 times the overall rate, because diesel restriction deadlines override remaining asset life. Yard cranes and stacking equipment follow at 6.4%.

Who are the major companies in the Cargo Handling Equipment Market?

Leading suppliers include ZPMC, Konecranes, Kalmar, Liebherr, and Cargotec. Concentration is high, with the top five holding roughly 57% of equipment revenue and one manufacturer dominating container cranes.

Which country is growing fastest?

India grows fastest at a 9.4% CAGR, as national port development programmes add container capacity at Mundra, Jawaharlal Nehru, and several greenfield sites. Vietnam follows on manufacturing-led terminal expansion.

Report Segmentation Architecture

The full report scope spans multiple orthogonal segmentation dimensions, with cross-tabulated demand data provided for each dimension pair. Coverage extends further to regional breakdowns, trend trajectories, and the competitive detail needed to support segment-level decision-making.

By Equipment Type

  • Ship-to-Shore Container Cranes
  • Yard Cranes and Stacking Equipment
  • Mobile Handling Equipment
  • Electric and Hybrid Terminal Tractors
  • Bulk and Specialised Handling Systems

By End-Use Facility

  • Container Terminals
  • Bulk and Break-Bulk Terminals
  • Intermodal Rail Yards
  • Ro-Ro and Vehicle Terminals
  • Inland Ports and Barge Facilities

By Procurement Model

  • Direct Terminal Operator Purchase
  • Concession-Linked Capital Award
  • Equipment Leasing Arrangement
  • Service and Refurbishment Contract

By Region

  • North America
  • Western Europe
  • East Asia
  • South Asia and Pacific
  • Latin America
  • Middle East and Africa
  • Eastern Europe

Scope, Methodology, and Coverage

Every figure in this report is reproducible from documented input assumptions. The scope below maps the historical period, the forecast horizon, the segmentation dimensions, and the countries covered, alongside the underlying primary and qualitative methodology.
Historical Period
2020 to 2025
Forecast Period
2026 to 2036
Base Year
2025 (USD billions; MMA Primary Research Dataset, August 2026)
Market Definition
The cargo handling equipment market comprises the manufacture, supply, and servicing of machinery used to move freight within ports, marine terminals, intermodal yards, and inland freight facilities, valued at supplier revenue from equipment, installation, and service. It spans ship-to-shore container cranes, yard cranes and automated stacking equipment, mobile handling equipment including reach stackers, straddle carriers, and empty container handlers, terminal tractors and yard trucks including electric and hybrid variants, and bulk and specialised handling systems such as grab unloaders and conveyor shiploaders. Vessels, barges, and tugs, shipping containers themselves, automated storage and picking systems inside distribution warehouses, port civil infrastructure including quays and dredging, and terminal operating software sold independently of equipment are excluded.
Quantitative Units
USD billions (current prices); equipment units and installed fleet counts where applicable
Segmentation Dimensions
By Equipment Type; By End-Use Facility; By Procurement Model; By Region
Regions Covered
North America, Western Europe, East Asia, South Asia and Pacific, Latin America, Middle East and Africa, Eastern Europe
Countries Covered
USA, China, Germany, France, UK, Japan, South Korea, India, Australia, Canada, Brazil, Mexico, Indonesia, Vietnam, Thailand, Malaysia, UAE, Saudi Arabia, South Africa, Nigeria, Turkey, Poland, Netherlands, Italy, Spain, Sweden, Switzerland, Argentina, Colombia, Singapore, and additional markets relevant to this sector
Key Companies Profiled
ZPMC, Konecranes, Kalmar, Liebherr, Cargotec, Terex Port Solutions, Sany Marine, Hyster-Yale, Anhui Heli, Mitsui E&S, TCM Handling, Taylor Machine Works, Toyota Industries, Doosan Industrial Vehicle, SANY Heavy Industry, Bromma, Elme Spreader, Terberg, Orange EV, BYD Forklift
Quantitative Methodology
Primary survey, n=3,800 respondents, Q4 2025, six countries; demand-side model with trade association cross-validation
Qualitative Methodology
47 expert interviews, Q4 2025; applied to validate demand model assumptions, identify emerging dynamics, and assess competitive positioning
Report Format
PDF and XLSX data workbook (Word format preview document)
Publisher
Market Minds Advisory
Report Code
MMA-2026-CON-225
Published
August 2026
Contact
sales@marketmindsadvisory.com | www.marketmindsadvisory.com

Purchase the full Cargo Handling Equipment Market Report (2026 to 2036).

The full MMA Cargo Handling Equipment report sizes the market across five equipment types, five facility types, four procurement models, and seven regions through 2036. It profiles 20 suppliers on a consistent basis of port and terminal equipment and service revenue, scoring each on manufacturing cost position, service network density, automation capability, and electrification and charging integration. Scenario models quantify how vessel upsizing, emissions deadlines, and sourcing restrictions move both equipment volume and achievable margin by type. The report also includes vessel order book mapping against crane replacement requirements, charging infrastructure timeline analysis against regulatory deadlines, automation retrofit cost comparison, and sourcing restriction exposure assessment for suppliers and terminal operators.
Five-equipment and four-model market sizing to 2036
Twenty-supplier benchmark on port and terminal equipment revenue
Vessel order book mapping against crane replacement requirements
Charging infrastructure timeline analysis against emissions deadlines
Automation retrofit cost comparison against new terminal construction
Sourcing restriction exposure assessment across supplier and operator base

Built For The People Who Decide

From boardroom strategy to bench-side execution, this report is read cover-to-cover by leaders shaping the next decade of their industry, turning demand scenarios, market dynamics and valuation benchmarks into decisions.
CXOs/ Presidents/ VPs/ Managers
M&A and Corporate Development
Strategy Teams and R&D Heads
Procurement and Product Directors
Regulatory and Compliance Leaders
Investor Relations and Equity Analysts