Market Minds Advisory
Carbon Fiber Market

Carbon Fiber Market: Precursor Cost, Oxidation Time, And A Wind Industry That Changed Its Mind

A commercial reading of carbon fiber, where the precursor decides the cost, oxidation ovens decide the capacity, and one wind turbine design choice moves more tonnage than a decade of aerospace qualification.

Lead Analyst

Bilal Shaikh

Published

September 2026

Make Smarter Decisions with Customized Research Insights

Request a free sample report and evaluate market opportunities, growth trends, and competitive dynamics relevant to your business needs.

2025 MARKET VALUE$5.9BMarket Size 2025
2036 FORECAST VALUE$15.2BBase Case , 2026 to 2036
CAGR 2026 TO 20369.0 %Bull 10.2% / Bear 7.8%
INCREMENTAL OPPORTUNITY$8.8BNet 10- year value creation
EXPANSION MULTIPLE2.37x2036 value over 2026 base
Strategic Levers
M&A Pipeline
Regional Outlook
Country Rankings
Competitive Intelligence
Segmental Deep-dive
Call-Us : 91 93563 13602

Executive Snapshot and Market Trajectory

Carbon fiber costs what it does because of the oven, not the chemistry. Oxidation takes hours at controlled temperature and the line runs at a fixed speed regardless of demand, which means capacity is physically inflexible and every producer knows exactly what everyone else can make.
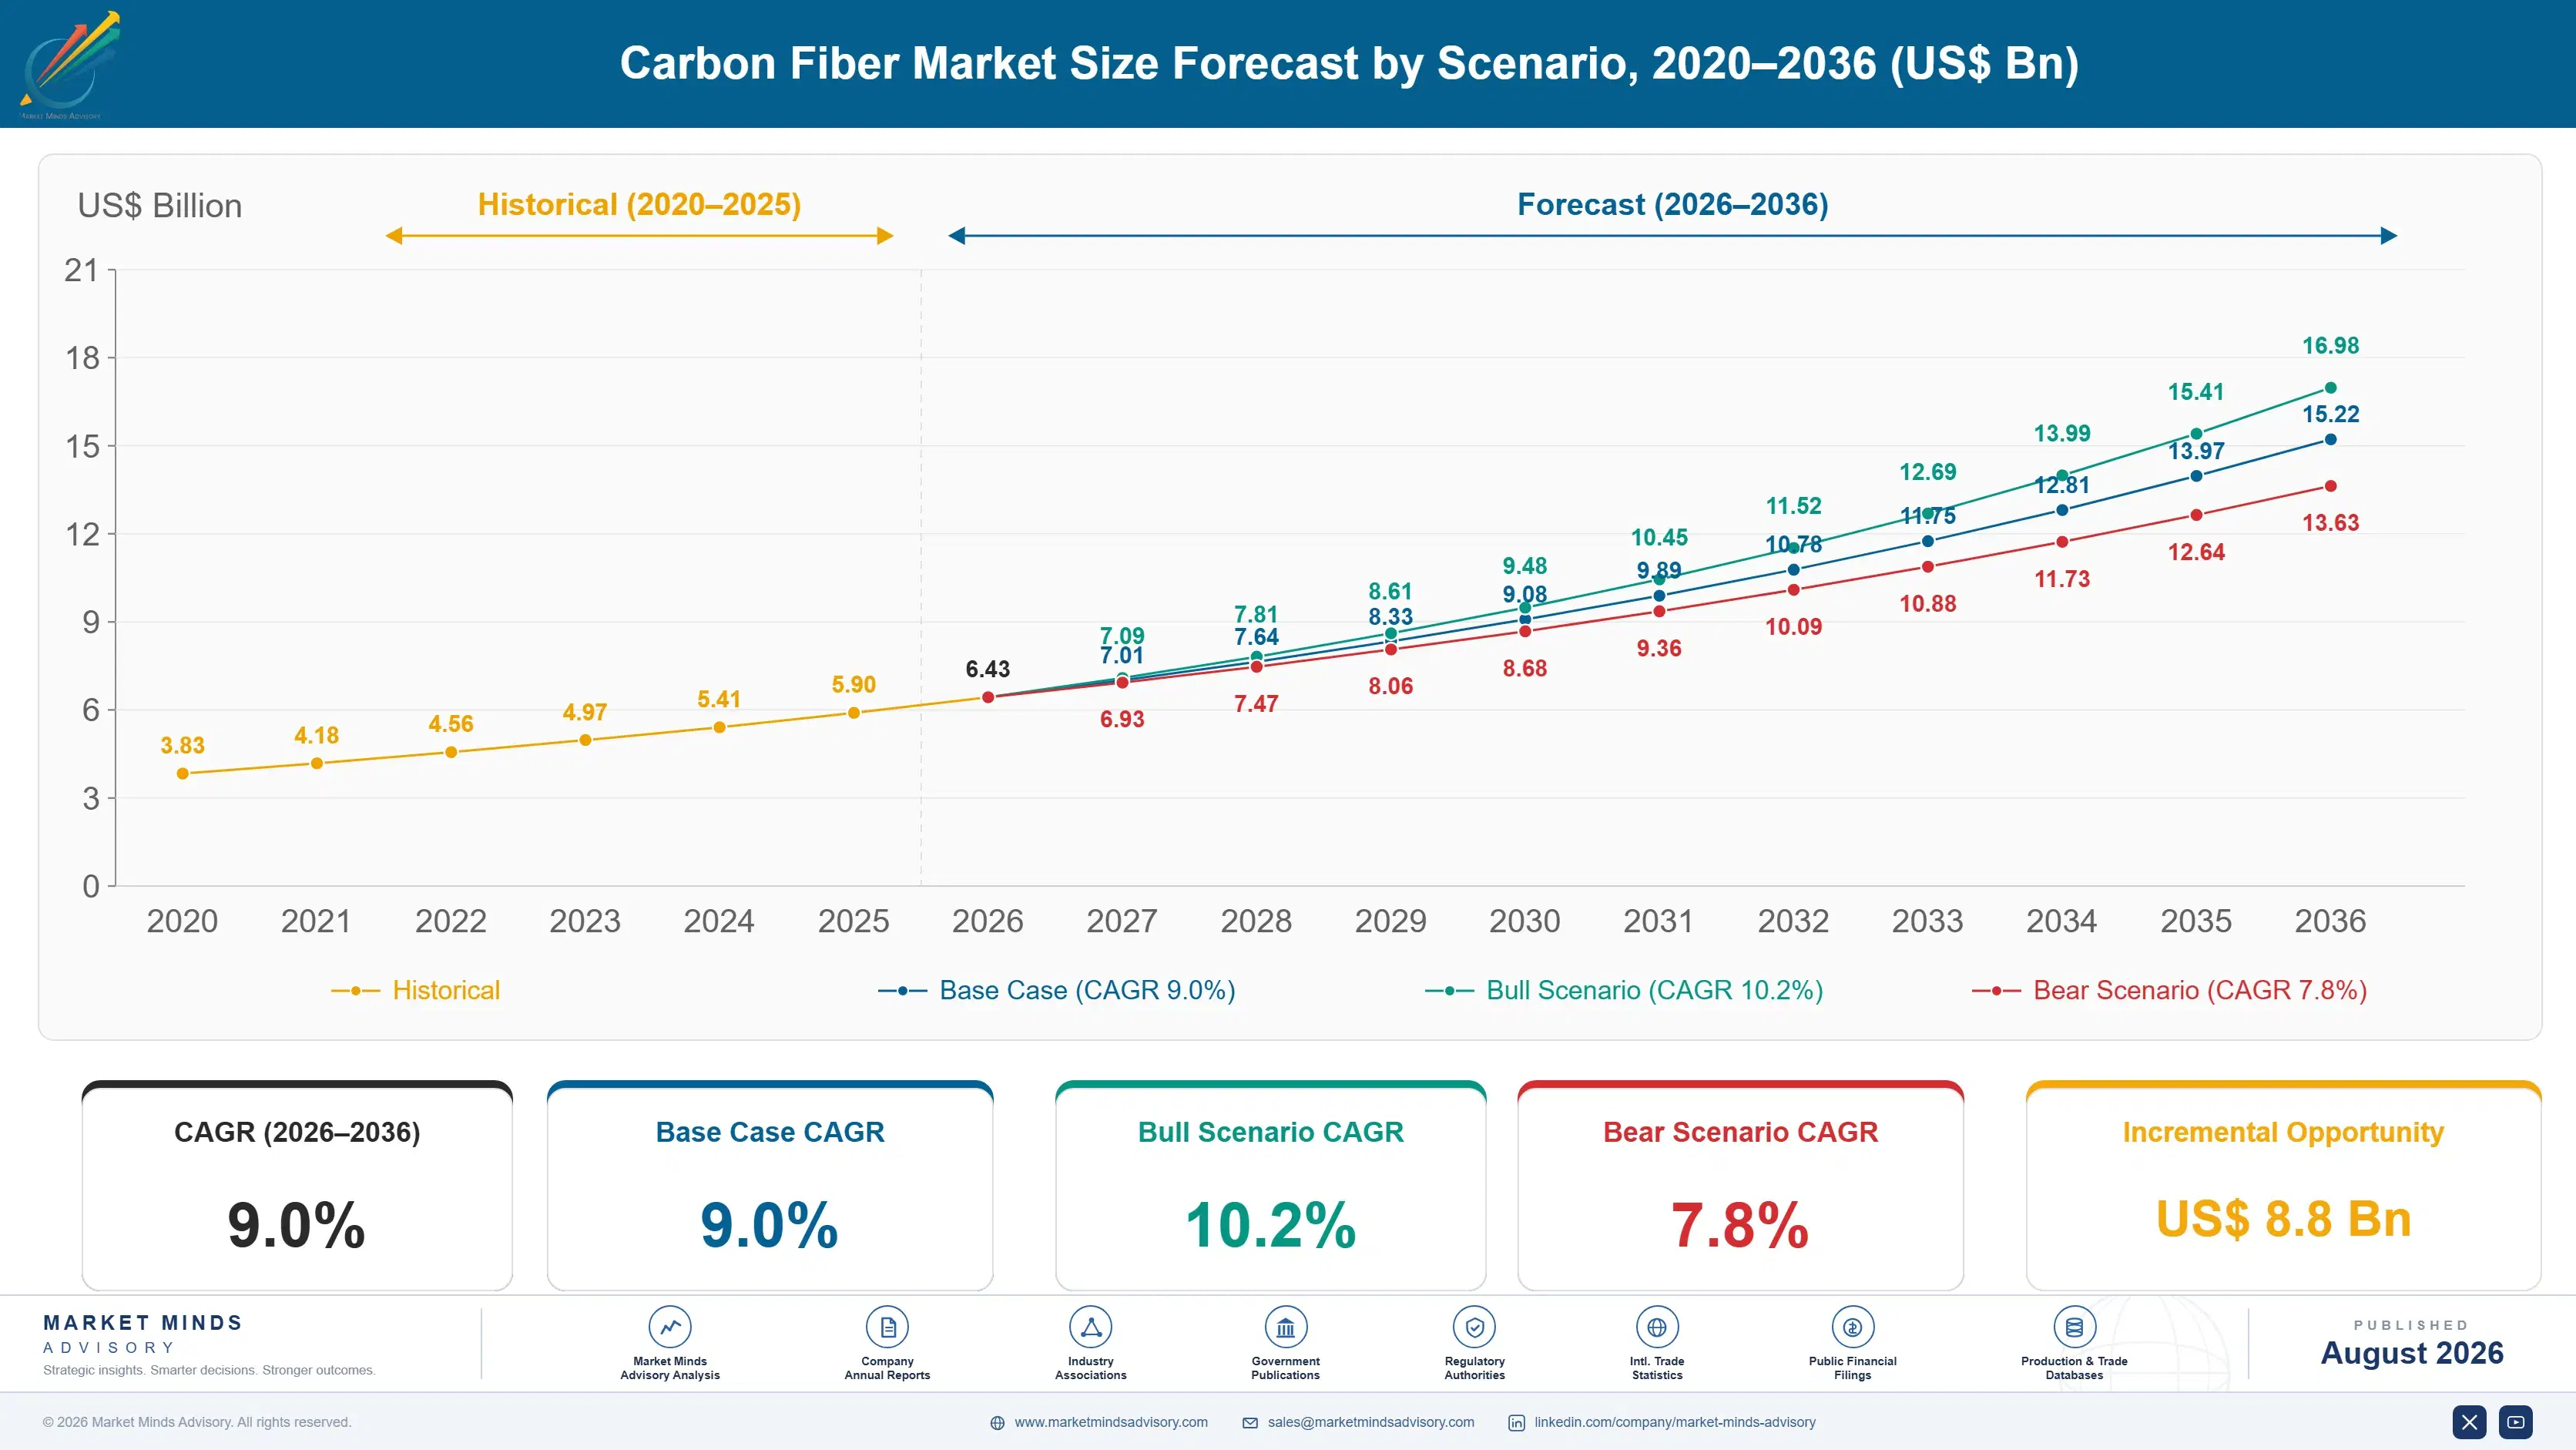
The market stands at USD 5.9 billion in 2025 and reaches USD 15.22 billion by 2036 at a 9.0% CAGR. Recycled and reclaimed carbon fiber grows fastest at 16.8%, about 1.87 times the overall rate, as end-of-life aircraft and blade waste finally reach volumes worth processing. East Asia holds 30% of value on Japanese and Chinese production capacity, while India posts the quickest national growth at 14.2% from a very small base.
Concentration is severe, with the top five holding roughly 63% of production capacity and Japanese producers supplying much of the aerospace-qualified grade. Two forces are now reshaping the field. Chinese capacity has expanded far faster than Western demand absorbed it, collapsing industrial-grade pricing, and wind turbine designers have moved between carbon and glass spar caps in ways that swing tonnage more than any other single design decision made.
Market Definition
The carbon fiber market covers the production and first sale of carbon fiber in filament, tow, fabric, and intermediate prepreg form, spanning standard modulus industrial fiber, intermediate and high modulus aerospace grade fiber, large tow fiber for wind and industrial use, recycled and reclaimed fiber, and prepreg and intermediate materials. Finished composite parts and structures, glass and aramid fibers, resin systems sold separately, composite manufacturing equipment, and carbon black or graphite products are excluded.
Base Year Value
$5.9B in 2025 (MMA Primary Research Dataset, August 2026)
Forecast Period
2026 to 2036, eleven discrete annual values
CAGR
9.0% base case. Bull 10.2%. Bear 7.8%.
Fastest Growth Segment
Recycled and Reclaimed Carbon Fiber: 16.8% CAGR
Fastest Growth Country
India: 14.2% CAGR
Fastest Growth Region
South Asia and Pacific: 11.0% CAGR
Largest Region
East Asia: 30% of 2025 global value
Market Leaders
Toray Industries, Hexcel, Mitsubishi Chemical Group, Teijin, SGL Carbon. Source: MMA Analysis based on company annual reports.
Primary Survey
n=3,800 procurement and R&D decision-makers, Q4 2025, six countries
Methodology
Demand-side build-up, cross-validated against public data, 47 expert interviews

Carbon Fiber Market Forecast Scenarios

carbon-fiber-market-size-forecast-scenario-1787324485815
Growth from 2020 to 2025 compounded near 7.6%, and two shocks pulled in opposite directions. Aerospace demand collapsed in 2020 as aircraft build rates were cut, stranding qualified capacity that could not be redirected to industrial grades. Wind and pressure vessel demand then absorbed some of the slack. Chinese capacity additions arrived through the same period and drove industrial pricing down sharply, which persists.
Three mechanisms carry the base case to 9.0%. First, aerospace recovery and next-generation programmes, since new single-aisle designs use composite structures more extensively and build rates are climbing back toward and beyond prior peaks. Second, pressure vessels, where hydrogen storage and compressed natural gas tanks both consume fiber in genuinely large quantities per unit. Third, recycling, as end-of-life aircraft, blades, and manufacturing waste reach volumes that make reclamation commercially sensible rather than merely virtuous.
The bull case at 10.2% assumes hydrogen storage scales as current programmes imply and wind designers return to carbon spar caps on the largest offshore blades. The bear case at 7.8% assumes Chinese overcapacity keeps industrial pricing suppressed across the period, aerospace build rate recovery continues slipping, and glass fiber hybrid designs hold the wind applications carbon was expected to take.

Why The Oxidation Oven Sets Everyone's Capacity

Three forces set demand. Aerospace provides the value, since qualified grades command prices industrial applications never approach and programmes run for decades. Wind provides the volume, or removes it, depending on whether designers choose carbon or glass spar caps in any given blade generation. And pressure vessels provide the growth, because hydrogen and compressed gas storage consume large quantities of fiber per unit and the applications are multiplying.
MARKET CONCENTRATIONCR5: 63%Highly concentrated among producers holding qualified aerospace capacity
PRECURSOR COST SHAREAbout 51%Polyacrylonitrile precursor as a portion of finished fiber cost
OXIDATION RESIDENCE TIME60 to 120 minutesTime fiber spends in ovens before carbonisation can begin
AEROSPACE QUALIFICATION PERIOD3 to 7 yearsDuration to qualify a new fiber on a structural application
ENERGY COST SHAREAbout 23%Process energy as a portion of total production cost
RECYCLED FIBER SHAREAbout 4%Reclaimed material as a portion of total fiber supply
The commercial character is set by a process nobody can speed up. Oxidation takes sixty to one hundred and twenty minutes at controlled temperature, and the line runs at fixed speed whatever the order book says. Capacity is therefore physically inflexible, expansion means building ovens years ahead of demand, and every producer can calculate exactly what every competitor can make. That transparency makes this an unusually disciplined industry, until somebody adds capacity anyway.
The next decade turns on two things. Whether Chinese capacity growth continues outpacing demand, since industrial-grade pricing has already fallen far enough to make Western expansion uneconomic. And whether recycled fiber reaches quality and volume levels that displace virgin material in secondary applications, because the reclaimed stream is finally reaching the scale where processing it makes commercial sense.
"Everyone talks about aerospace qualification like it is the barrier. The real barrier is that you cannot build half an oxidation line, and the one you build takes three years and runs at one speed forever. This industry adds capacity in lumps and then spends five years regretting the timing."
Director, Advanced Materials and Composites Practice · MMA Chemicals and Materia

Market Trends

Chinese Capacity Collapsed Industrial Grade Pricing

Chinese producers including Zhongfu Shenying and Jilin Chemical Fibre added large tow capacity at a pace Western demand never matched, and industrial-grade prices fell sharply as a result. Domestic policy support treated carbon fiber as a strategic material rather than a commercial venture, which changed the investment arithmetic entirely. The consequence for Western producers is that industrial and wind applications no longer justify new capacity at all, pushing them toward aerospace and pressure vessel grades where qualification barriers still hold. That concentration works until aerospace build rates disappoint, which they have repeatedly.
Market Impact: Vessels contain 700 bar pressure
Recycled Fiber Reaches Commercially Interesting Volumes

End-of-life aircraft, decommissioned wind blades, and manufacturing offcuts have accumulated to the point where reclamation makes commercial sense rather than merely satisfying a sustainability commitment. Pyrolysis and solvolysis both recover fiber with most of its tensile properties intact, though fiber length shortens and the material suits non-structural and semi-structural applications rather than primary aerospace. Automotive, sporting goods, and industrial moulding compounds absorb it readily at prices well below virgin. Recycled supply sits near 4% of total fiber today and grows at 16.8%, which is the fastest movement anywhere in this market.
Market Impact: Qualification locks 3 to 7 years

Market Opportunities and Growth Drivers

Hydrogen Storage Consumes Fiber Per Vessel Heavily

A type four hydrogen pressure vessel wraps a polymer liner in carbon fiber to contain gas at 700 bar, and the quantity consumed per tank is substantial by any composite standard. Heavy vehicle fuel systems, distribution trailers, and stationary storage all use the same construction. Compressed natural gas vessels follow identical logic in markets where hydrogen remains distant. What makes this commercially attractive is that the fiber is a safety-critical structural element rather than a weight-saving preference, so specification holds firm even when cost pressure arrives from procurement. Procurement rarely wins that argument.
Market Impact: Oxidation takes 120 minutes

Next-Generation Aircraft Raise Composite Content Further

Current widebody aircraft use composite primary structure extensively, and the single-aisle replacements now in development are expected to extend that further into wings and fuselage sections that remain aluminium today. Each programme decision locks fiber specification for decades, since requalifying a structural material mid-programme is effectively impossible. Build rate recovery toward and beyond prior peaks compounds the effect. Aerospace grades command prices industrial applications never approach, which is why every Western producer has concentrated there as Chinese capacity took the industrial end of the market. Programme decisions arrive perhaps twice a decade.
Market Impact: Blades exceed 100 metres

Market Restraints and Challenges

Oxidation Capacity Cannot Flex With Demand

Fiber spends sixty to one hundred and twenty minutes in oxidation ovens at controlled temperature, and the line runs at fixed speed whatever the order book requires. The root cause is chemistry rather than engineering, since the stabilisation reaction takes the time it takes. Commercially this means capacity arrives in large increments after multi-year construction, and producers commit capital against demand forecasts that are routinely wrong. Participants mitigate by building modular lines, converting between grades where qualification permits, running tolling arrangements with competitors, and accepting lower utilisation rather than chasing volume at any price.
Market Impact: Industrial prices fell over 30%

Wind Designers Switch Between Carbon And Glass

Blade designers choose carbon spar caps for stiffness on the longest blades and glass or hybrid construction where cost matters more, and that decision moves more tonnage than any other single choice in this market. The root cause is that carbon offers a genuine performance advantage at a price that only justifies itself above certain blade lengths. Commercially this makes wind demand violently unpredictable from a producer's perspective. Suppliers respond by pricing large tow separately, contracting volume with turbine makers directly, and refusing to build capacity against a single application.
Market Impact: Recycled reaches 4% of supply
3 additional market trends, 4 additional growth drivers, and 2 additional restraints and challenges are covered in the full report. Contact sales@marketmindsadvisory.com to access the complete intelligence.

Segment CAGR and Growth Architecture

Segmentation follows fiber grade, a single performance logic describing what the material is specified and qualified to do. Each grade carries its own precursor route, qualification burden, pricing structure, and competitive field, so commercial position tracks the specification rather than the application served. End-use industry and supply form appear separately within the framework as distinct dimensions.
carbon-fiber-market-market-share-analysis-1787324486347

Recycled and Reclaimed Carbon Fiber

Recycled and reclaimed carbon fiber grows fastest at 16.8%, about 1.87 times the overall 9.0% rate, from roughly 4% of total supply. Pyrolysis and solvolysis both recover fiber retaining most of its tensile strength, though the process shortens filament length and removes the continuous tow format that structural applications require. That limitation defines the addressable market precisely: automotive moulding compounds, sporting goods, industrial components, and semi-structural parts rather than primary aerospace structure. Feedstock is finally arriving in volume from decommissioned wind blades, retired aircraft, and manufacturing offcuts that producers previously landfilled. Pricing sits well below virgin material, which is the whole commercial proposition, and collection logistics rather than processing technology remains the binding constraint.
CAGR 16.8%

Large Tow Fiber

Large tow fiber grows at 10.4%, the second-fastest grade, produced in filament counts of 24,000 and above for applications where cost matters more than the ultimate properties of small tow aerospace material. Wind blade spar caps, pressure vessels, automotive structures, and industrial components all consume it. The economics differ fundamentally from aerospace grade: production runs faster, precursor requirements are less exacting, and prices sit at a fraction of qualified structural material. Chinese capacity concentrated here first and drove pricing down sharply, which has made Western expansion in this grade genuinely difficult to justify. Demand nonetheless remains the largest single volume pool in the market, and pressure vessel growth is now more reliable than wind.
CAGR 10.4%
Full segment breakdown across 5 segments available in the complete report.

Regional Architecture and Country Demand Map

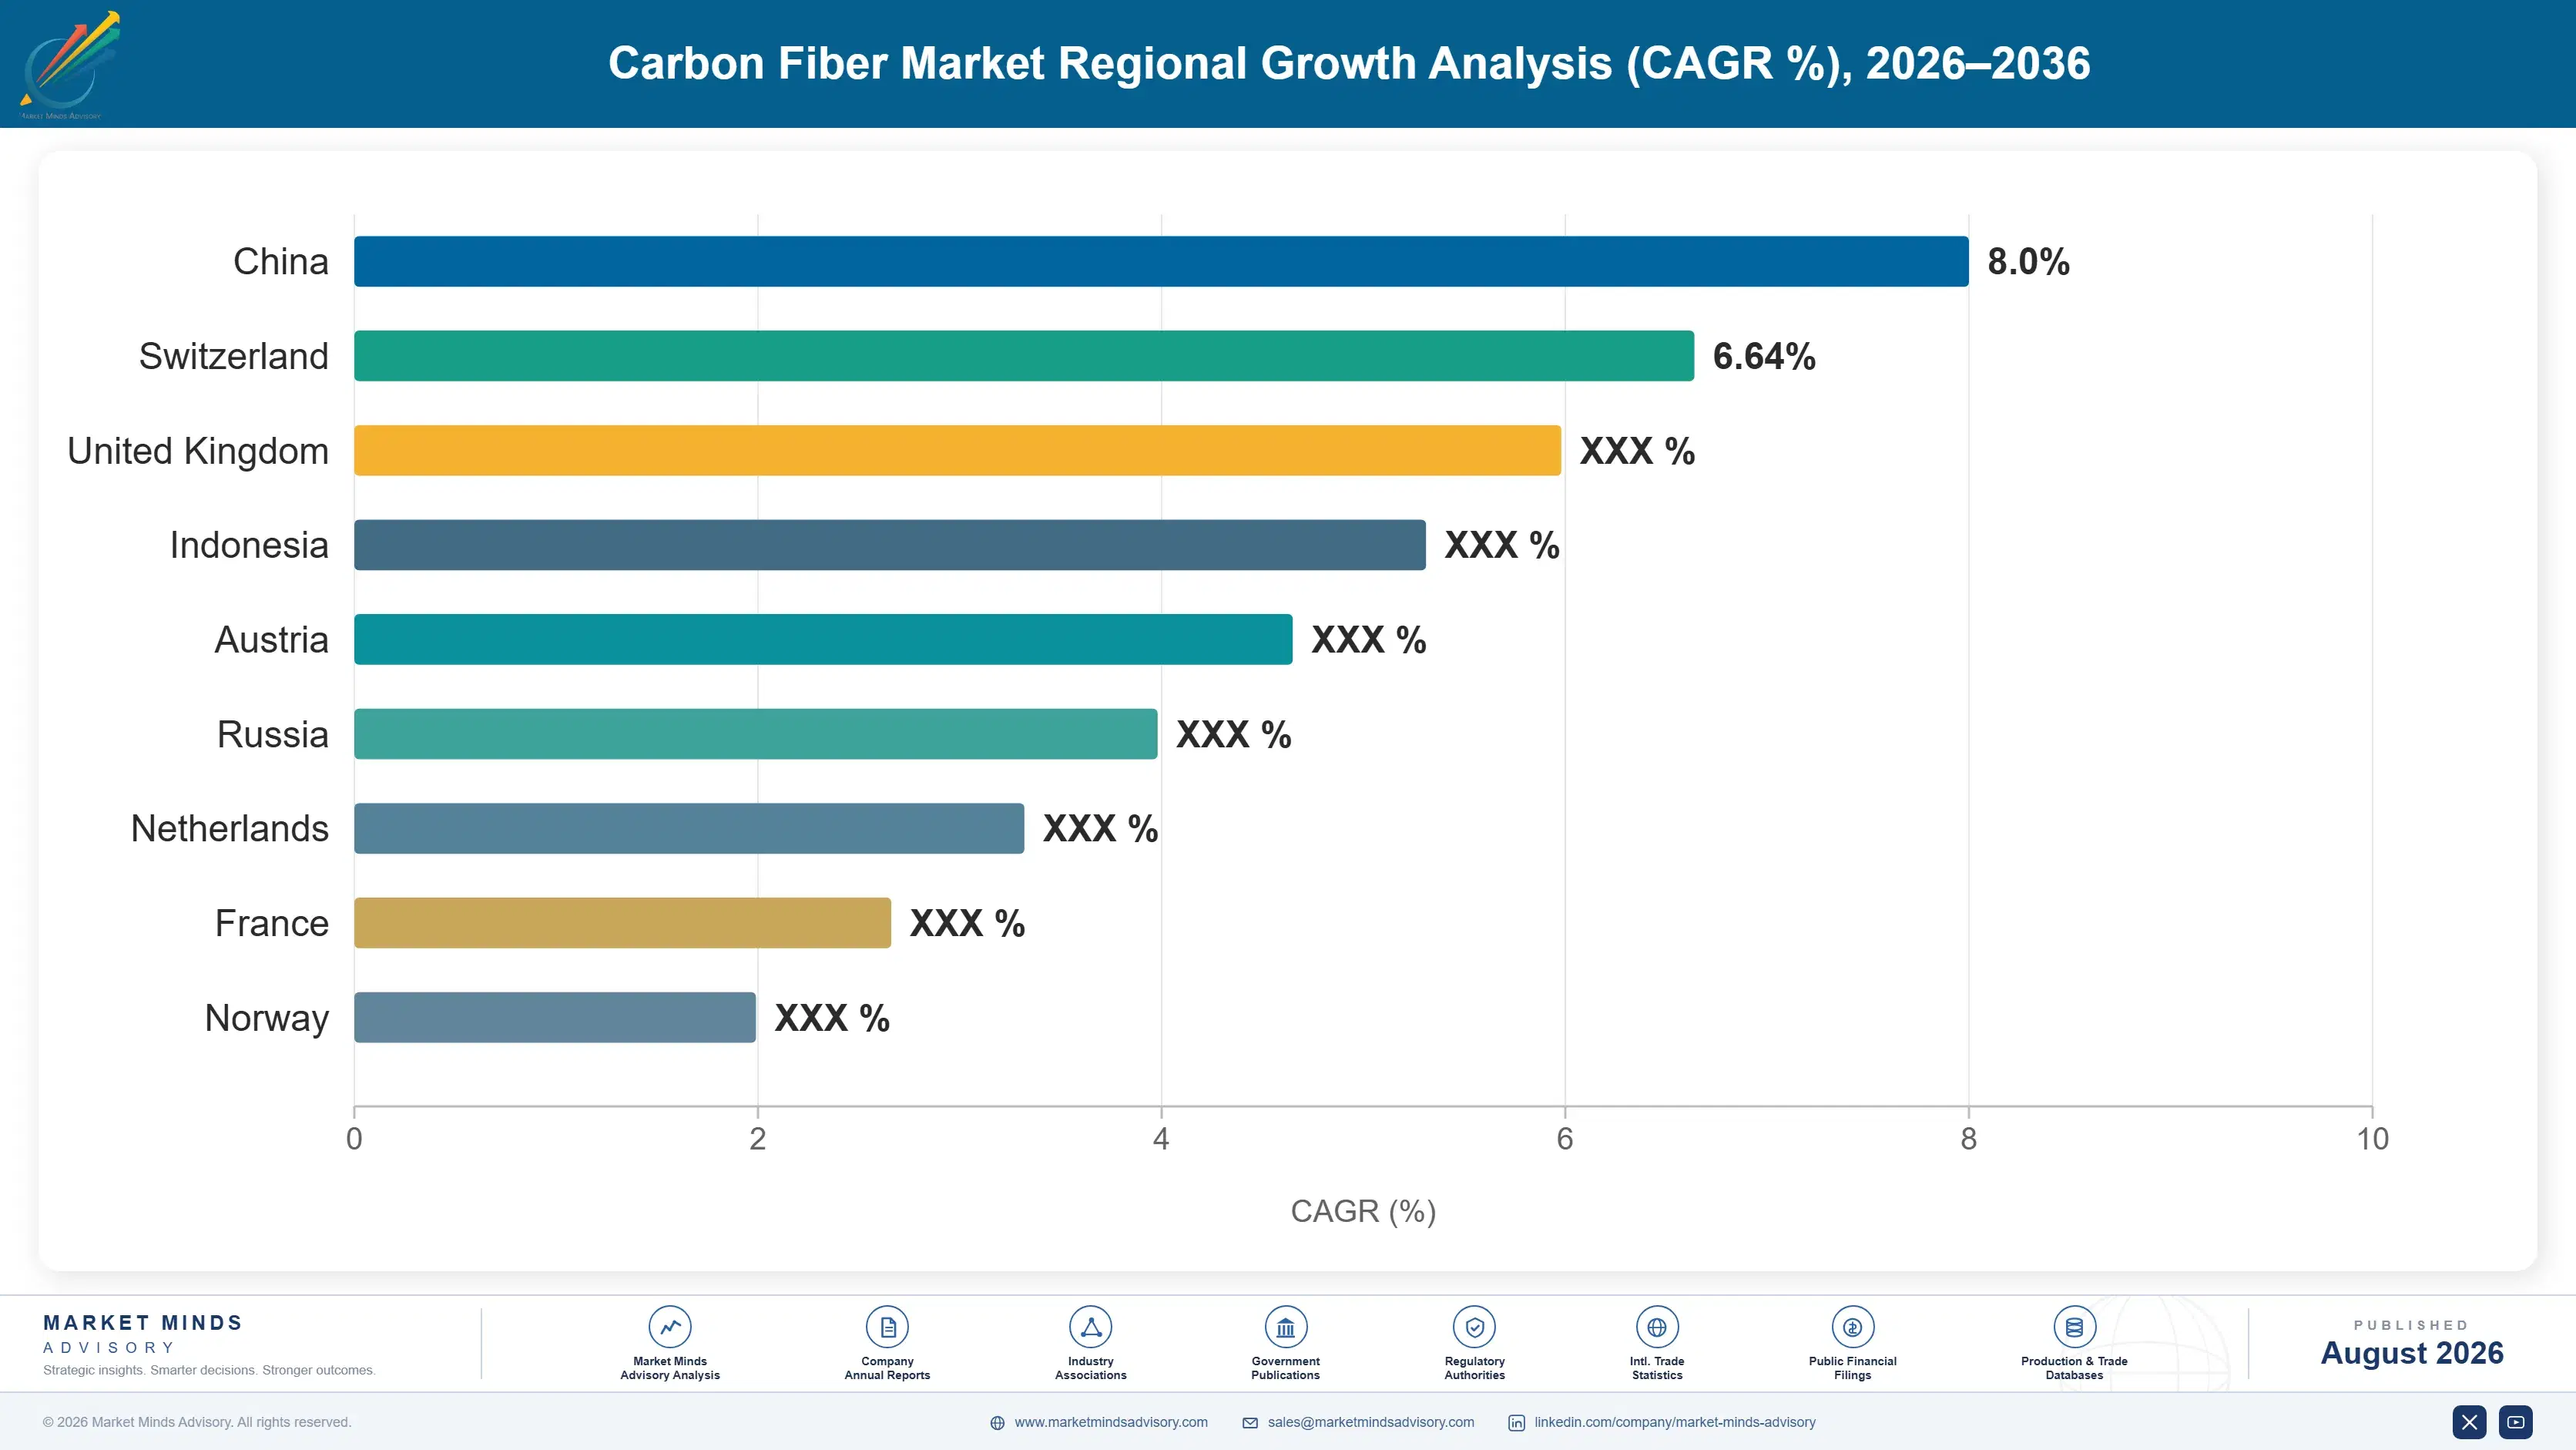
Production capacity rather than consumption sets this distribution, and capacity concentrates where energy is available and policy supported it. East Asia leads on Japanese aerospace grade and Chinese industrial volume together, while North America and Western Europe hold shares reflecting aerospace demand more than manufacturing.

North America

North America holds 27% of value on aerospace demand that no other region matches in concentration. Boeing programmes, defence contracts, and a deep tier one composite structures base all consume qualified fiber at premium grades, and Hexcel operates substantial domestic capacity serving them. Pressure vessel demand for hydrogen and compressed gas storage has grown from a small base and is now commercially meaningful. Wind demand is smaller than in Europe and more exposed to policy reversals that have already stranded projects. Growth of 8.6% reflects aerospace build rate recovery and pressure vessel expansion against industrial applications that Chinese pricing has made uncompetitive to serve domestically. Defence demand adds a further protected layer.
Share: 27% | CAGR: 8.6% (2026 to 2036)

Western Europe

Aerospace and wind between them define this market. Western Europe holds 22% of value, with Airbus programmes anchoring qualified fiber demand and offshore wind installation rates among the highest anywhere consuming large tow material in quantity. SGL Carbon and Teijin both operate European capacity, though energy costs following 2022 have made carbonisation genuinely expensive relative to Chinese and American production. Blade design decisions between carbon and glass spar caps move regional tonnage more than any other variable, and those decisions are taken by a handful of turbine makers. Growth of 7.4% is the slowest of the seven, reflecting energy cost disadvantage and wind demand that swings on design choices. A handful of turbine makers decide it.
Share: 22% | CAGR: 7.4% (2026 to 2036)
Regional intelligence for 5 additional markets available in the complete report: East Asia, South Asia and Pacific, Latin America, Middle East and Africa, Eastern Europe. Contact sales@marketmindsadvisory.com.
carbon-fiber-market-country-cagr-analysis-1787324486854

Where Fiber Producers Actually Defend Position

Competing on large tow price against subsidised Chinese capacity is a contest with a known ending, and several Western producers learned it expensively. The four moves below shift earnings toward positions capacity additions cannot erode: qualification incumbency, pressure vessel specification, reclaimed feedstock control, and utilisation discipline in a business where the oven never stops.

Hold Qualification Incumbency Rather Than Chase Volume

Qualifying a structural fiber on an aerospace application takes 3 to 7 years and requalifying mid-programme is effectively impossible, which makes an incumbent position worth decades of supply at prices industrial grades never approach. That protection does not exist in wind or industrial applications, where switching is a purchasing decision. Producers should direct qualification resource at programmes entering design rather than defending industrial share against Chinese pricing, because the aerospace position compounds while the industrial one erodes every year. Programmes entering design now decide the next twenty years of supply.
Market Impact: Qualification runs 3 to 7 years per

Specify Into Pressure Vessels Before Standards Settle

A type four vessel containing hydrogen at 700 bar uses fiber as a safety-critical structural element rather than a weight-saving option, which holds specification firm against procurement pressure in a way few applications manage. Standards and certification routes are still forming across heavy vehicles, distribution, and stationary storage. Producers engaging with vessel makers and certification bodies now shape requirements around their own material properties, which is worth considerably more than winning the same business on price later. Certification bodies write requirements around whatever material they examine first, which is worth more than winning on price later.
Market Impact: Type four vessels operate at 700 ba

Control Reclaimed Feedstock Before Volumes Arrive

Decommissioned wind blades, retired aircraft, and manufacturing offcuts are accumulating faster than reclamation capacity, and recycled fiber grows at 16.8% against a market at 9.0%. Collection logistics rather than pyrolysis technology is the binding constraint, which means securing feedstock agreements with airlines, wind operators, and composite manufacturers is the position worth taking. Whoever holds the waste stream controls the segment, because processing capability is available to anyone willing to fund it. Airlines, wind operators, and composite manufacturers all hold waste they currently pay to dispose of, which makes the agreement cheap to secure today.
Market Impact: Recycled fiber grows at 16.8% again

Protect Utilisation Rather Than Discount For Tonnage

An oxidation line runs at fixed speed and costs the same whether it produces qualified aerospace grade or discounted industrial tow, so filling capacity with low-price volume consumes the asset without earning from it. Precursor accounts for roughly 51% of finished cost and does not fall with the selling price. Producers should accept lower utilisation on premium grades rather than converting lines to chase tonnage, because the capacity released does not come back when better business arrives. Capacity released to chase tonnage does not return when better business finally arrives.
Market Impact: Precursor alone accounts for 51% of

Who Controls the Margin Pool

Concentration is severe: the top five hold roughly 63% of production capacity, with Japanese producers supplying much of the aerospace-qualified grade worldwide. The gap between leaders and challengers is one of qualification position and precursor capability rather than carbonisation technology, which is widely understood. All participants here are assessed on one basis, carbon fiber production capacity and fiber revenue, excluding finished composite parts, resin systems, and other reinforcemen
Competition runs along four lines. First, aerospace qualification incumbency, which protects positions for decades once established. Second, precursor integration, since polyacrylonitrile represents roughly half of finished cost and quality determines fiber properties directly. Third, energy cost position, because carbonisation is genuinely energy-intensive. Fourth, capacity timing, where adding ovens years ahead of demand separates disciplined producers from those chasing forecasts.

Pressure is building from two directions. Chinese capacity continues expanding against domestic policy support rather than commercial return, which suppresses industrial pricing globally and shows no sign of stopping. Meanwhile recycled fiber is beginning to serve applications that virgin large tow previously held. Rankings should favour producers with aerospace qualification depth and precursor integration over those exposed to industrial grades where price alone decides the order.
carbon-fiber-market-company-positioning-matrix-1787324487371

Competitive Moat and Risk Dimensions

TORAY INDUSTRIES

Moat: Aerospace qualification and precursor control

Toray holds qualified positions on the structural applications of most major commercial aircraft programmes, which locks supply for decades since requalification mid-programme is effectively impossible. Precursor development and production in-house controls roughly half of finished cost and determines fiber properties competitors must buy in. Manufacturing scale across Japan, the United States, and Europe serves airframers where they build.
TORAY INDUSTRIES

Risk: Aerospace cycle and Chinese pricing

Concentration in aerospace ties results directly to aircraft build rates that have disappointed repeatedly against manufacturer guidance. Industrial and wind grades face Chinese competition that Japanese cost structures cannot match on any comparable product. Capacity committed against aerospace recovery forecasts also carries utilisation risk, since oxidation lines cannot be idled cheaply once built and commissioned.
HEXCEL

Moat: Integrated prepreg and structures position

Hexcel supplies fiber alongside prepreg and intermediate materials, which places it closer to the airframer's manufacturing process than a fiber producer selling tow alone. Qualified positions across Airbus and Boeing programmes provide multi-decade revenue visibility that few materials businesses enjoy. Deep engineering relationships with tier one structures suppliers make its materials difficult to displace at any programme stage.
HEXCEL

Risk: Programme concentration and build rates

Revenue depends heavily on a small number of aircraft programmes, so a build rate cut or a delay flows straight through with no offsetting business line. Industrial diversification has been limited by Chinese pricing in exactly the applications that would provide balance. Energy and precursor costs in Western locations also sit above Asian competitors producing comparable industrial grades.

Players Tracked

Prominent Players

Toray Industries
Hexcel
Mitsubishi Chemical Group
Teijin
SGL Carbon

Other Key Players

Solvay
Formosa Plastics
Zhongfu Shenying
Jilin Chemical Fibre
Hyosung Advanced Materials
DowAksa
Kureha
Nippon Graphite Fiber
Zoltek
Gurit
Park Aerospace
Sinofibers Technology
ELG Carbon Fibre
Carbon Conversions
Vartega

Recent Developments

MARCH 2024

Chinese large tow capacity additions continue despite weak pricing

Additional large tow carbon fiber capacity was commissioned across several Chinese producers, extending an expansion that had already pushed industrial-grade prices well below levels supporting Western investment. This was organic capacity commissioning supported by industrial policy rather than any commercial transaction, and it deepened a global oversupply in industrial grades.
Signal: Capacity built against policy rather than
SEPTEMBER 2024

SGL Carbon reviews strategic options for composites business

SGL Carbon announced a review of its composite solutions operations amid weak industrial demand and pricing pressure across carbon fiber applications outside aerospace. This was a strategic review rather than a completed divestment or acquisition, and it reflected the difficulty Western producers face competing in industrial grades against subsidised capacity.
Signal: Western producers exiting industrial grade
JUNE 2024

Wind blade recycling capacity commissioned in Europe

Reclamation capacity for decommissioned wind blade composite entered operation in Europe, recovering carbon and glass fiber from blades reaching end of service life. This was organic capacity commissioning rather than an acquisition, and it addressed a waste stream that had been landfilled or incinerated for lack of any commercial alternative.
Signal: Reclaimed feedstock arriving in volume fin

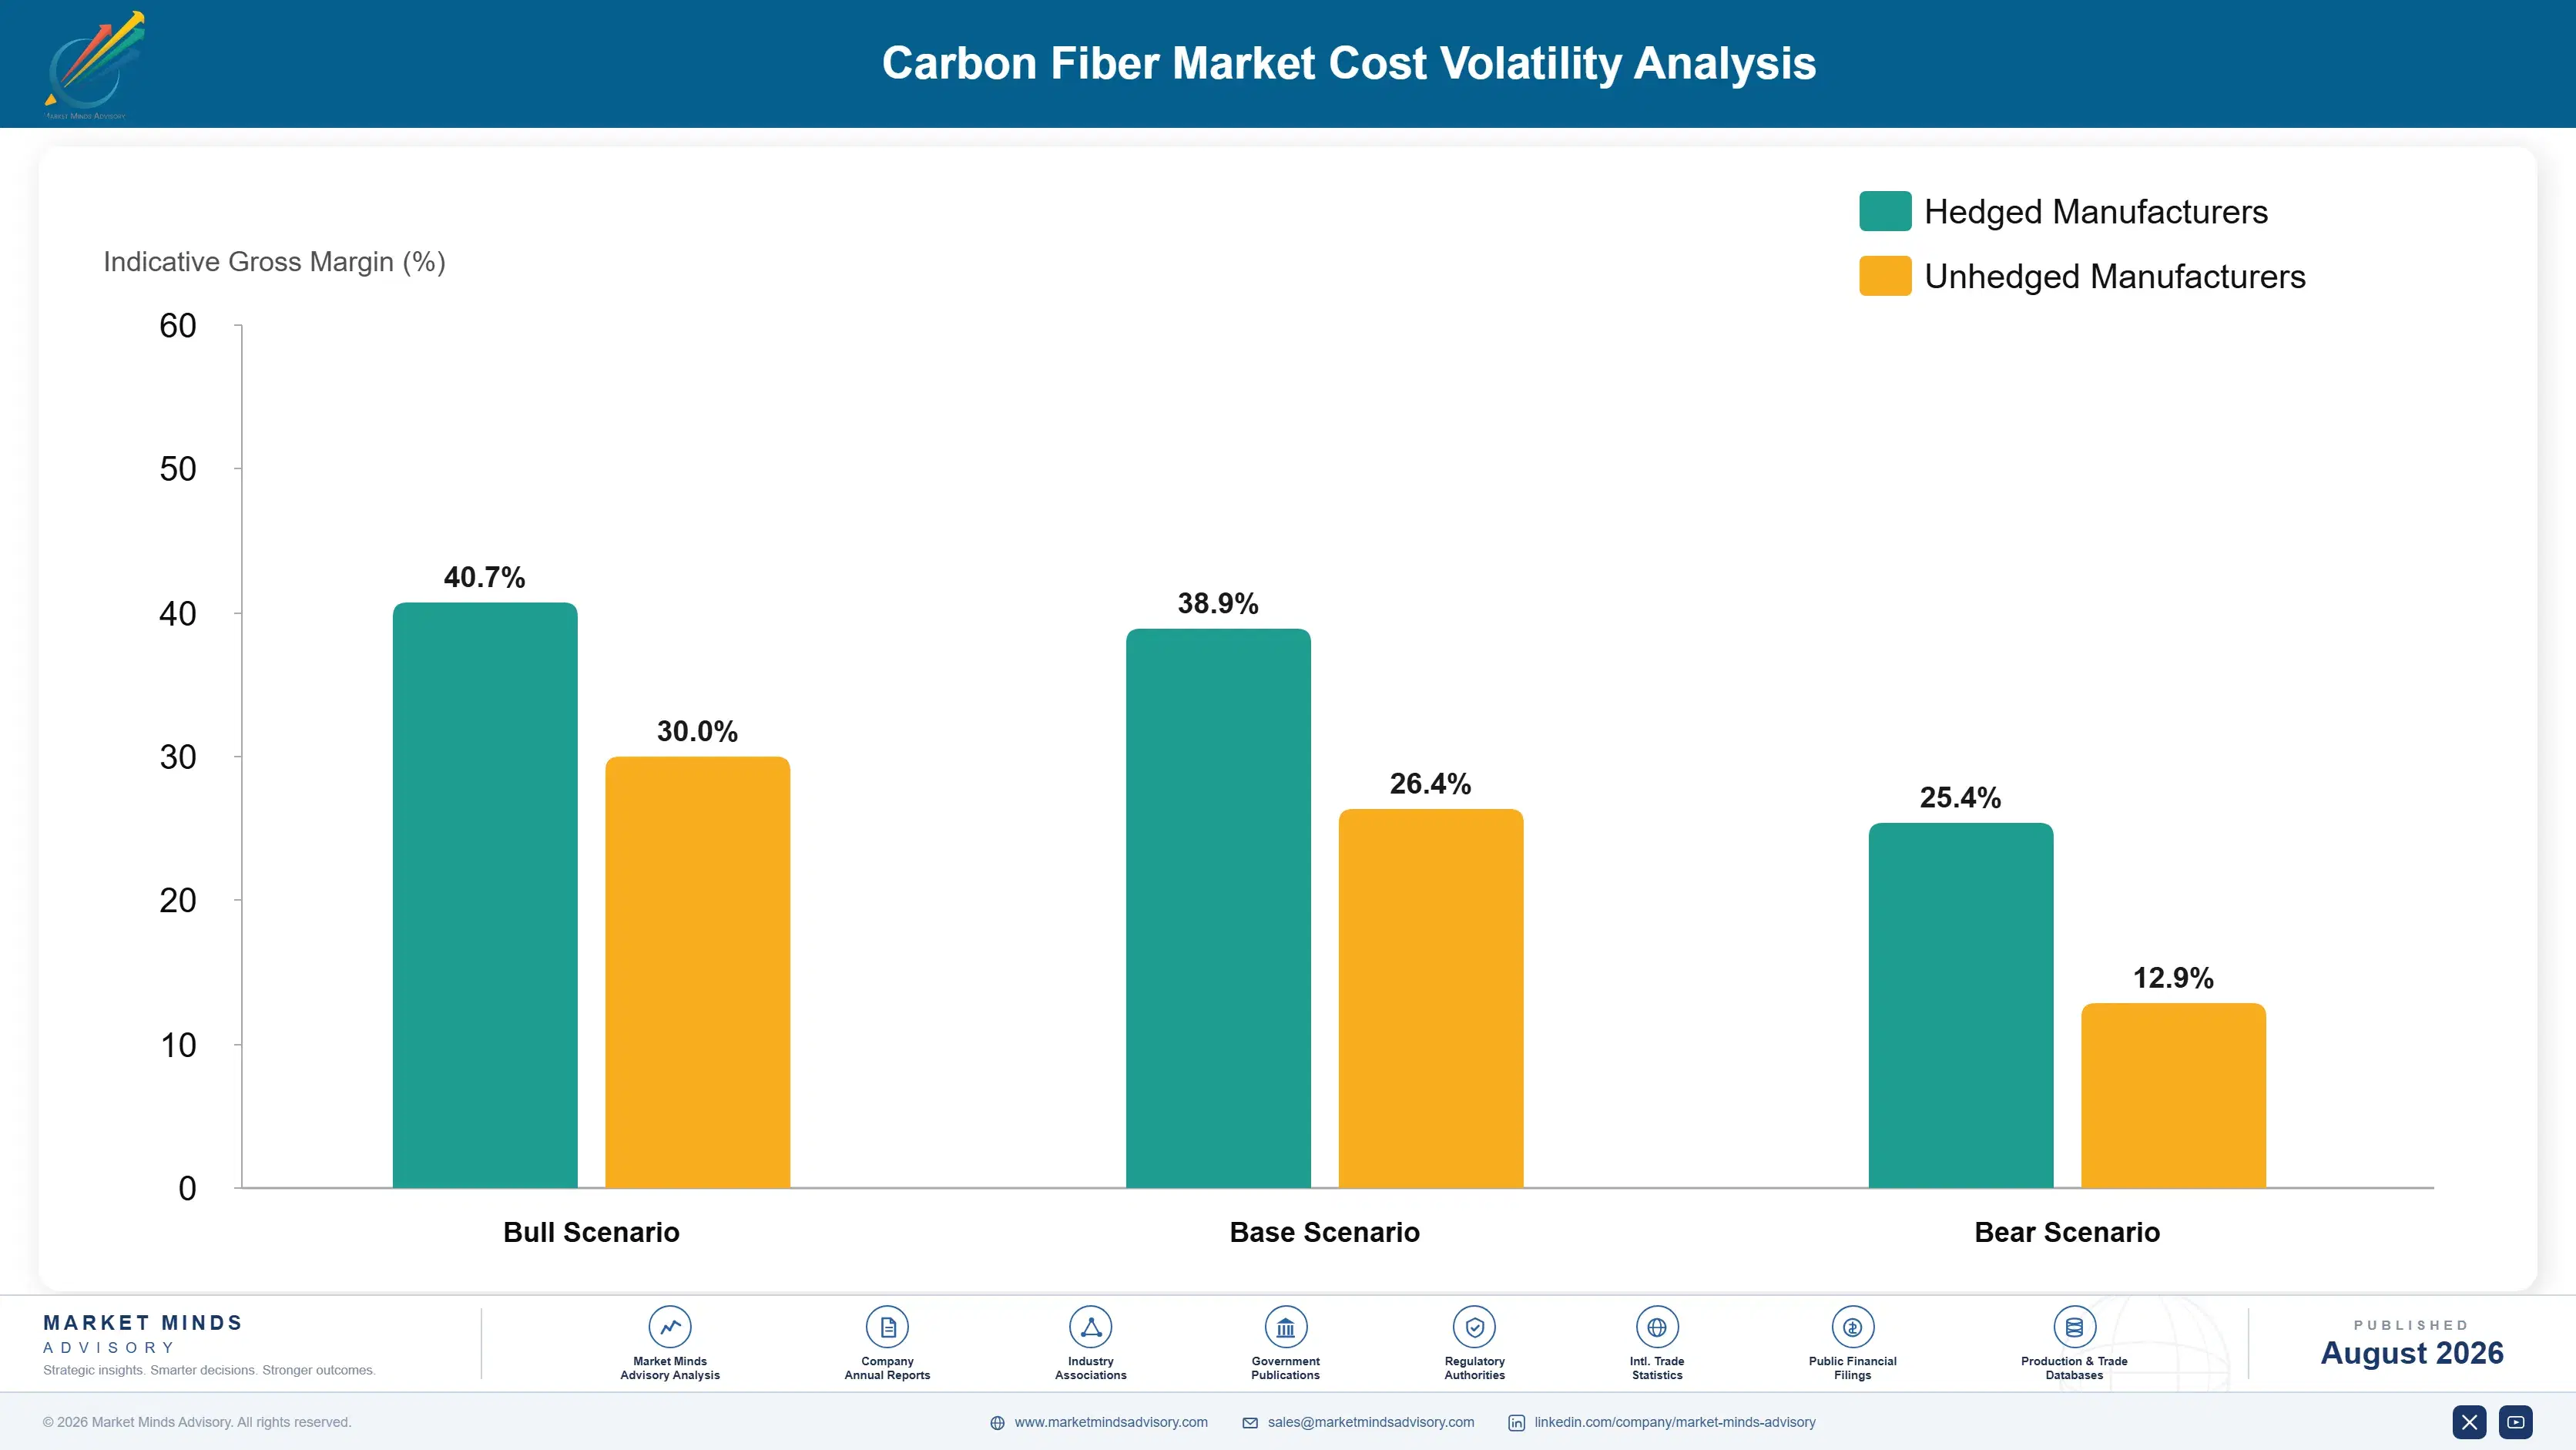
Precursor, Process Energy, Capital, Labour

Precursor and energy dominate everything else here. Polyacrylonitrile precursor accounts for roughly 51% of finished fiber cost, sourced from a narrow field of producers since textile-grade material will not work and carbon fiber precursor is a specialised product. Process energy for oxidation and carbonisation takes about 23%, running continuously at high temperature. Capital depreciation on oxidation and carbonisation lines adds 14% to 19%, and labour a comparatively small remainder.
European energy costs through 2022 hit this industry with unusual force. Carbonisation runs at temperatures above 1,000 degrees continuously and cannot be throttled without ruining the fiber in process, so producers absorbed energy costs IEA analysis recorded reaching several times prior-year levels. SGL Carbon and Teijin both disclosed energy cost pressure across 2022 reporting. Acrylonitrile feedstock moved with propylene simultaneously, compounding the effect on precursor pricing.

Exposure separates by precursor integration and energy location rather than by scale. A producer making its own precursor controls half of finished cost and the properties qualification depends on. One buying precursor competes on a cost base its supplier sets. Energy geography compounds it, since a European line pays multiples of what Chinese or American production costs to run through the same process.
carbon-fiber-market-cost-volatility-analysis-1787324487567

Integrate backward into precursor production

Precursor is over half of finished cost and its quality determines the fiber properties that aerospace qualification rests on, so buying it externally surrenders economics and differentiation. Owned precursor capacity is expensive and slow to build, which is why producers holding it defend those positions firmly. New entrants without it compete on carbonisation efficiency alone, a very thin advantage.

Site carbonisation capacity against long-term energy contracts

Carbonisation runs continuously above 1,000 degrees and cannot be throttled when prices spike, so energy exposure is fixed in volume and variable only in price. Long-dated power purchase agreements, hydro or nuclear supply, and siting decisions taken on energy availability all reduce it. The trade-off is distance from customers, though fiber ships far better than most industrial products.

Design lines to convert between grades where qualification permits

Demand swings between aerospace, wind, and pressure vessels on timescales shorter than capacity construction, and a line dedicated to one grade sits idle when that application softens. Modular design permitting conversion between grades preserves utilisation across cycles. Aerospace qualification restricts how far this can go, since a qualified line cannot simply be repurposed and requalified quickly afterwards.

Portfolio Architecture for Margin Defence

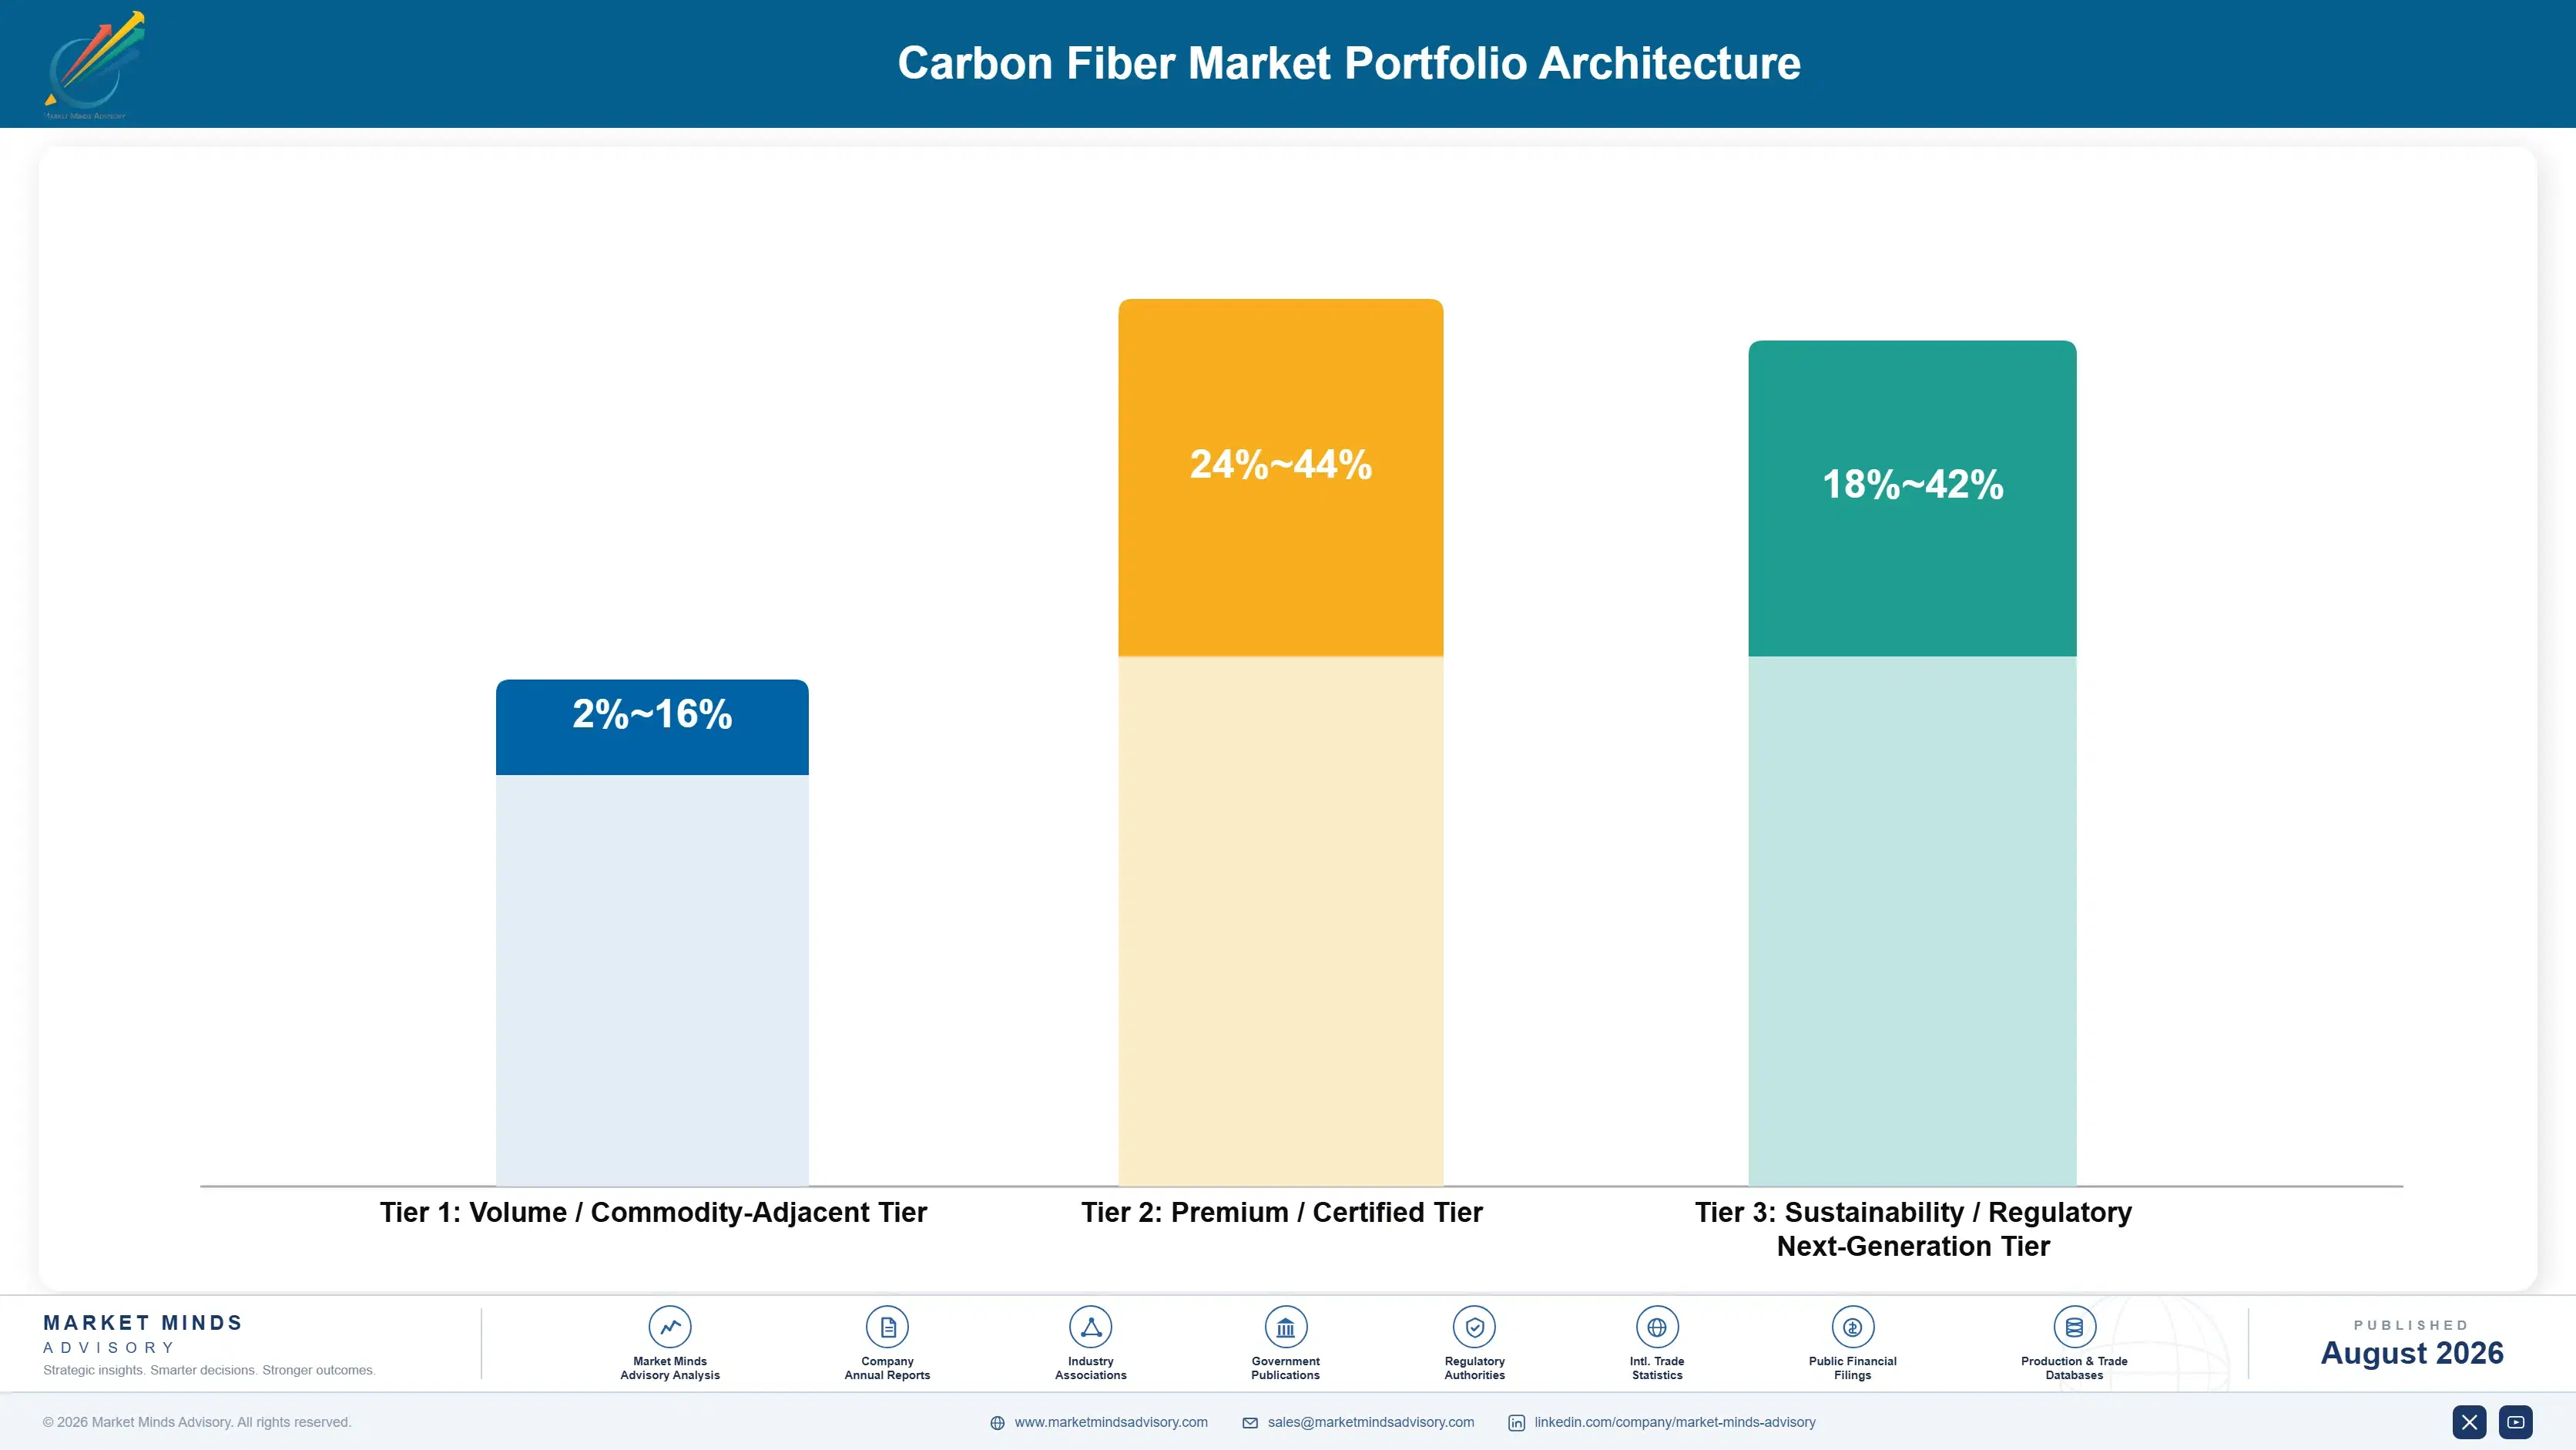
The portfolio splits into three tiers with sharply different economics. Large tow industrial fiber forms the volume tier, competing on delivered price against Chinese capacity with margin set by precursor cost and utilisation. Aerospace-qualified grades earn considerably more because qualification locks positions for decades and the competitive field is genuinely narrow. Pressure vessel grades and recycled material sit differently again, priced against application requirements rather than a comm
The tension runs between tonnage that fills ovens and grades that earn the return. Industrial volume keeps oxidation lines running at fixed speed, covers the capital cost of assets that cannot be idled cheaply, and maintains precursor purchasing scale. Yet it competes against capacity built for policy reasons rather than commercial ones. Producers handling this well protect premium utilisation and accept lower overall loading rather than discounting into oversupply.

High-value pools concentrate where qualification or specification limits competition: aerospace grades locked to programmes for decades, pressure vessel fiber where safety criticality holds specification, defence applications with restricted supplier lists, and reclaimed material where feedstock control decides participation. All four escape the delivered price comparison. Standard large tow sits at the other end, competing against subsidised capacity that keeps expanding.

Volume / Commodity-Adjacent Tier

Standard modulus large tow fiber for wind, industrial, and general moulding applications sold on delivered price. The range is wide because Chinese capacity sets the ceiling while precursor integration and energy location determine whether a producer earns anything at all.
Gross Margin: 2-16%

Premium / Certified Tier

Intermediate and high modulus aerospace-qualified fiber, prepreg, and intermediate materials for structural applications. The range is wide because qualified programme positions price firmly while newly qualified grades often discount to establish the first application.
Gross Margin: 24-44%

Sustainability / Regulatory / Next-Generation Tier

Pressure vessel grades for hydrogen storage, recycled and reclaimed fiber, and defence and space qualified material. The range is wide because pressure vessel grades price on safety criticality while recycled material earns on feedstock cost rather than product premium.
Gross Margin: 18-42%
carbon-fiber-market-portfolio-architecture-1787324488067

High-value Sub-segments and Strategic Watch-out

Recycled and Reclaimed Carbon Fiber

High value and high growth at 16.8%, the fastest grade, as decommissioned blades and retired aircraft finally reach processable volumes. Collection logistics rather than pyrolysis technology is the binding constraint, which makes feedstock agreements the position genuinely worth holding here. Feedstock agreements are the position worth holding.
Gross Margin: 22-42%

Large Tow Fiber

High volume with growth at 10.4%, the largest single pool in the market and the one Chinese capacity has hit hardest. Pressure vessel demand is now more reliable than wind, where designer choices between carbon and glass swing tonnage unpredictably. Chinese pricing has hit this grade hardest.
Gross Margin: 2-16%

Aerospace Grade Fiber and Prepreg

The value core by revenue, growing at 8.4% on build rate recovery and next-generation programme content. Qualification locks positions for decades, which protects incumbents completely and leaves challengers waiting for programmes that enter design only occasionally. Requalification mid-programme is effectively impossible for any competitor at all.
Gross Margin: 24-44%

Standard Modulus Industrial Fiber

The strategic watch-out, growing at just 5.2% while Chinese capacity keeps expanding against policy support rather than commercial return. Western producers are exiting rather than competing, which concedes the volume pool and concentrates everyone into aerospace together. Policy support rather than return funds the expansion.
Gross Margin: 2-14%

How Fiber Specifications Actually Lock

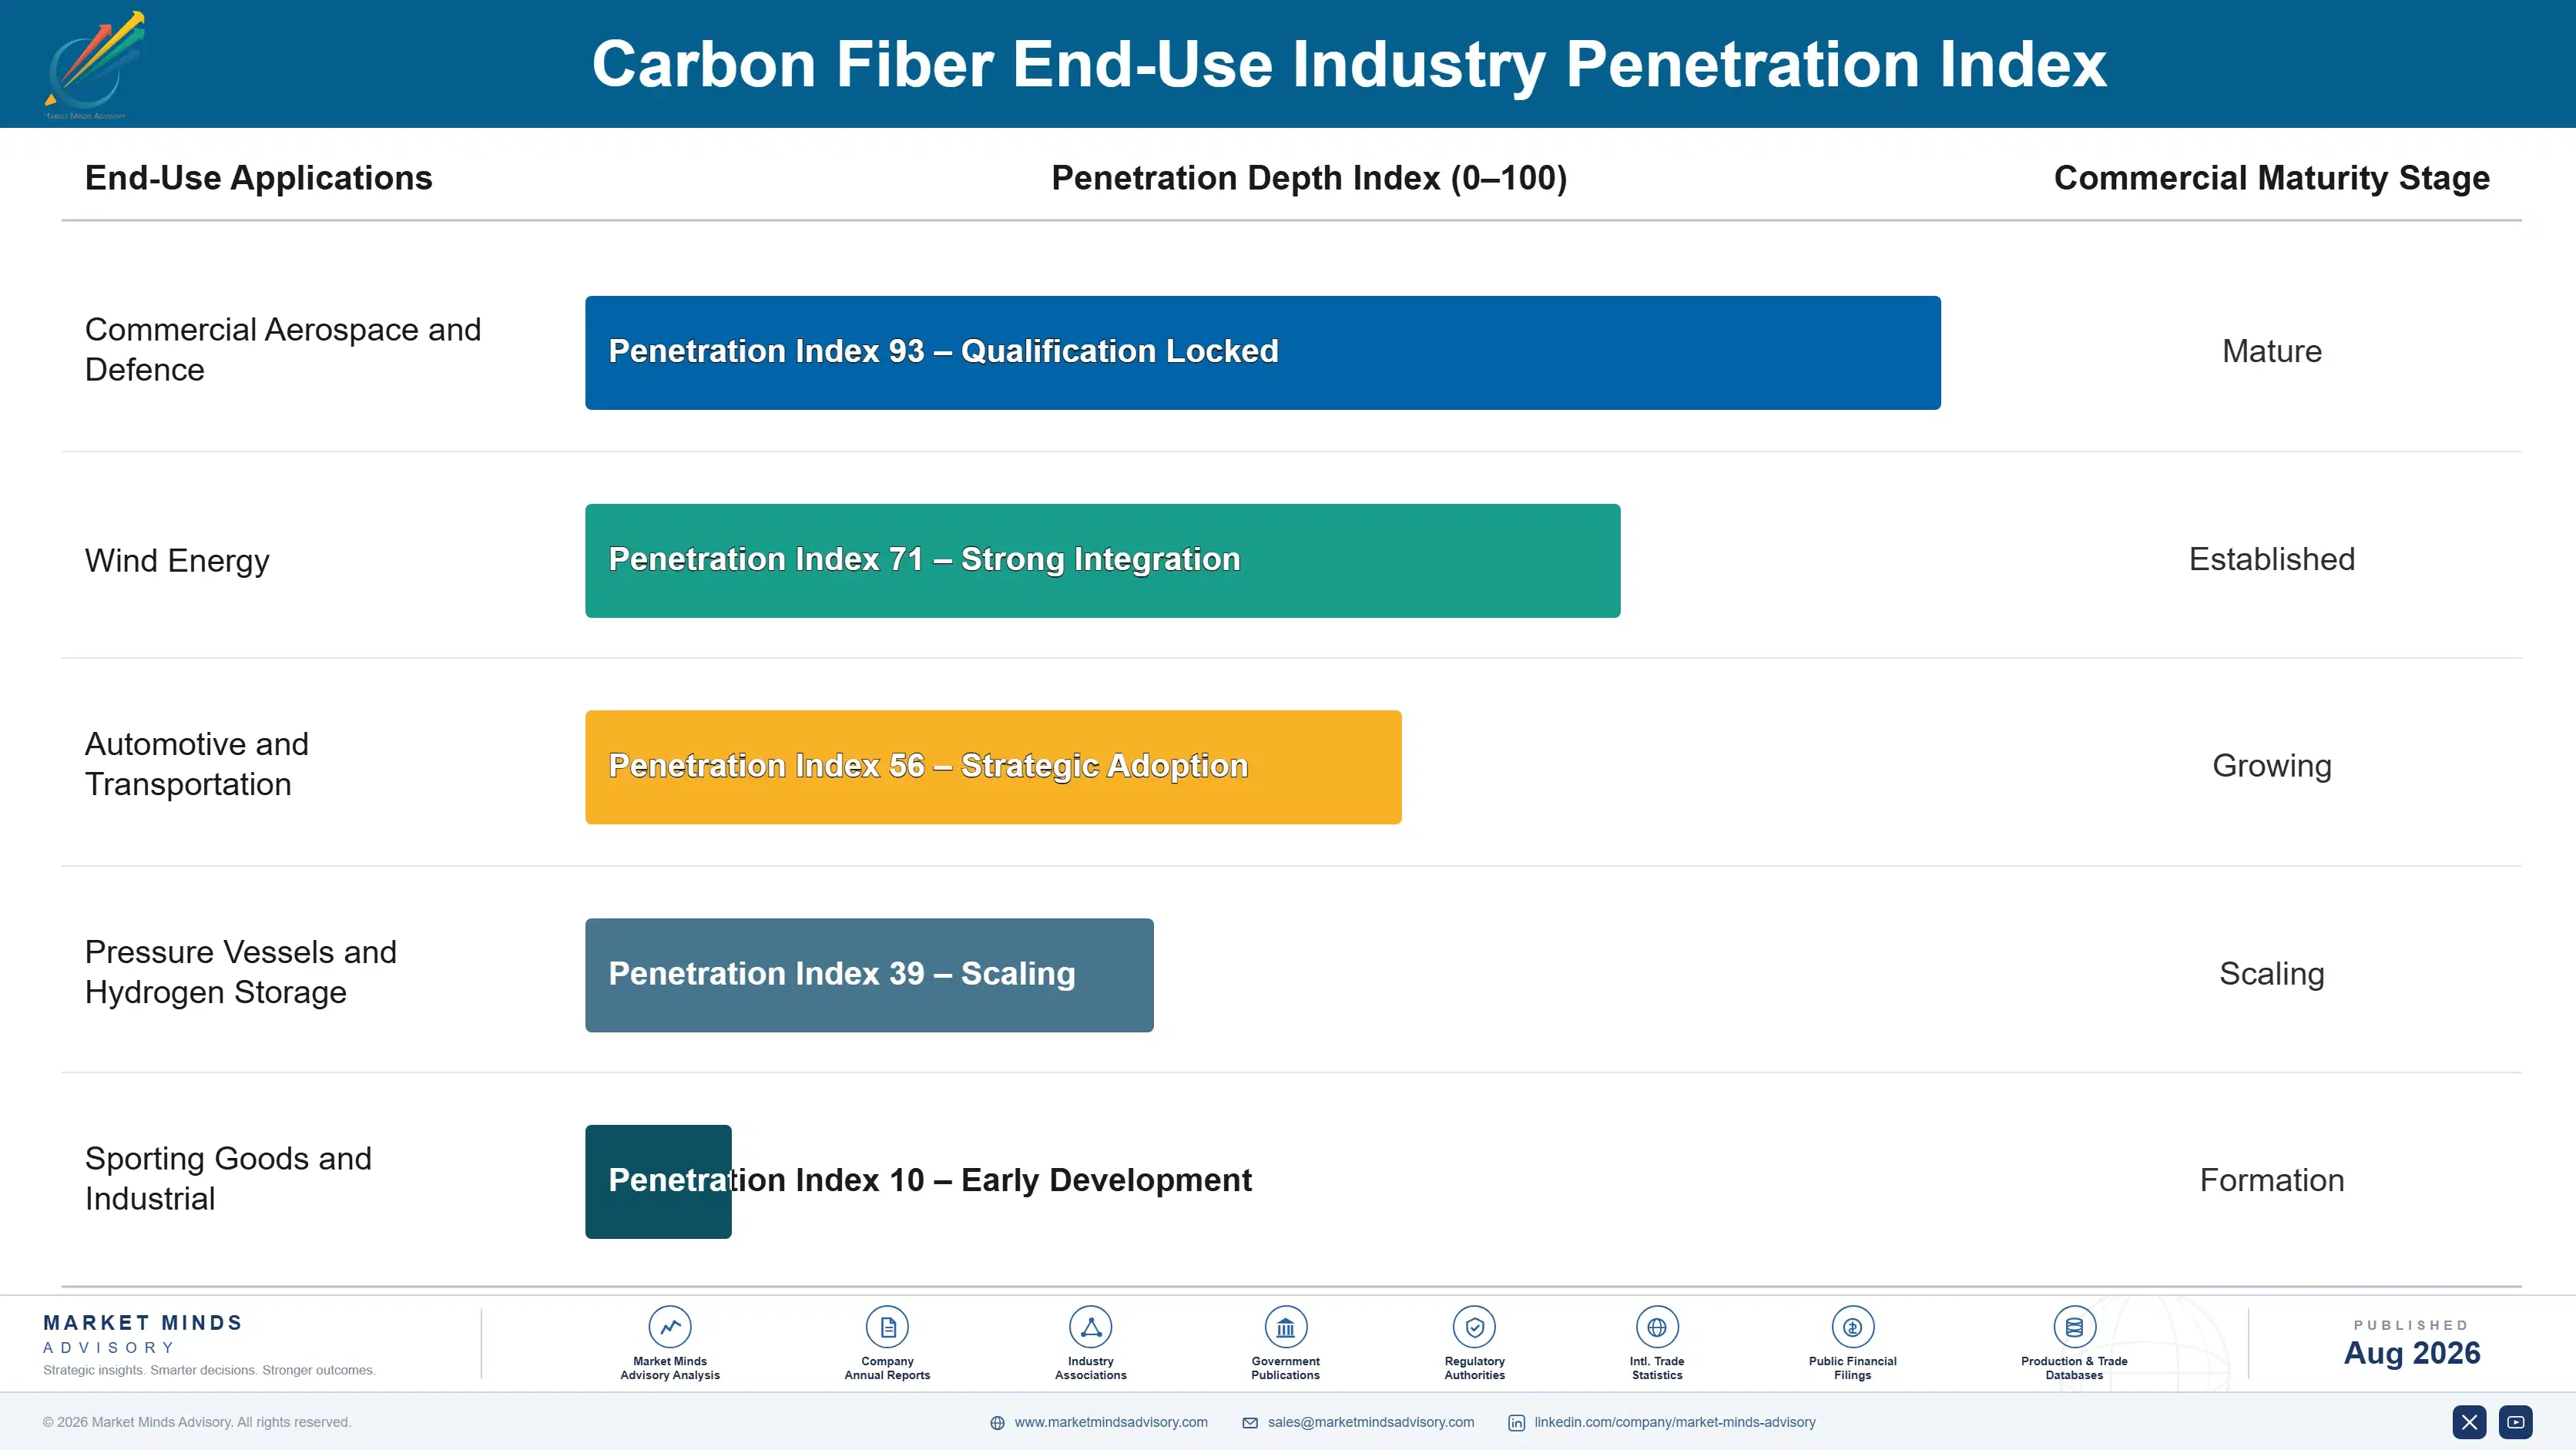
Demand locks at qualification and then runs for the life of the programme. An aerospace structural application qualifies a specific fiber from a specific line, and changing it means repeating structural testing and certification that nobody undertakes mid-programme. That gives incumbents decades of visibility and leaves challengers waiting for the next clean-sheet design. Industrial applications work entirely differently, switching on price at each purchase order.
Stickiness varies sharply by application. Aerospace primary structure sticks hardest, protected by certification that makes change effectively impossible. Pressure vessels stick next, since safety criticality and certification testing both discourage substitution once a design is approved. Sporting goods and industrial moulding stick least of all, buying on price and switching freely between suppliers and increasingly toward recycled material. Wind sits awkwardly between, contracted by volume but redesigned every blade generation.

Buyer profiles have shifted from materials engineers specifying on properties toward programme procurement teams weighing supply security alongside performance. Concentration among Japanese producers made airframers uncomfortable enough to fund alternative qualification deliberately. Younger design teams also consider recycled content and end-of-life treatment in ways their predecessors never did, which is beginning to affect specification on secondary structures rather than remaining a reporting exercise.
carbon-fiber-market-end-use-penetration-index-1787324488560

Our Call On Carbon Fiber

These are among the four positions where our research anticipates prominent divergence between winners and laggards over the coming forecast period. Each is grounded in the demand model, the regulatory perimeter, and the announced capacity pipeline.
01 / OVENS SET CAPACITY

Oxidation time makes supply physically inflexible

Fiber spends sixty to one hundred and twenty minutes in oxidation at controlled temperature and the line runs at fixed speed whatever the order book says, so capacity arrives in large increments after multi-year construction. That means producers commit capital against demand forecasts that are routinely wrong, and every competitor can calculate exactly what everyone else can make. Investment decisions should be taken on qualified demand already contracted rather than on application forecasts, because an idle oxidation line cannot be unbuilt.
02 / QUALIFICATION COMPOUNDS VALUE

An aerospace position lasts longer than most companies

Qualifying a structural fiber takes 3 to 7 years and requalifying mid-programme is effectively impossible, which converts a single design win into decades of guaranteed supply at prices industrial grades never approach. No comparable protection exists anywhere in wind or industrial applications, where switching is simply a purchasing decision taken at each order. Producers should direct qualification resource at programmes entering design now rather than defending industrial share, because the aerospace position compounds while the industrial one erodes every single year.
03 / CHINESE CAPACITY RESET PRICING

Policy-funded expansion broke the industrial grade economics

Chinese producers added large tow capacity at a pace Western demand never matched, supported by policy treating carbon fiber as strategic rather than commercial, and industrial prices fell over 30% as a result. Western producers cannot match that cost base and several are reviewing or exiting the grade entirely. Companies should concede industrial volume deliberately rather than defending it at negative margin, and redirect precursor and oven capacity toward aerospace and pressure vessel grades where qualification still genuinely protects the pricing.
04 / FEEDSTOCK DECIDES RECYCLING

Whoever holds the waste stream owns the segment

Recycled fiber grows at 16.8% against a market at 9.0% as decommissioned blades, retired aircraft, and manufacturing offcuts reach volumes worth processing commercially rather than simply landfilling them. Pyrolysis and solvolysis capability is readily available to anyone willing to fund it, so processing technology confers no lasting advantage at all. Collection logistics is the genuine constraint, which makes long-term feedstock agreements with airlines, wind operators, and composite manufacturers the position actually worth securing now, well before those volumes genuinely arrive.

Engagement Snapshot From the Field

A live engagement with an industry participant carrying material or product regulatory and market exposure ahead of a defining policy shift, showing how our research translates into a defensible multi-year portfolio strategy.
MARKET MINDS ADVISORY · CLIENT ENGAGEMENT SUMMARY
Carbon Fiber Producer Strategic Portfolio Review and Transition Roadmap 2026·Investment Scenario on Carbon Fiber Exposure Evaluation 2025-26
CLIENT PROFILE
A Western carbon fiber producer operating three production lines engaged MMA after two consecutive years of losses on industrial grades. The client reported revenue near USD 340 million, roughly 58% of tonnage sold into wind and general industrial applications at prices below full cost, and one line qualified for aerospace running at 61% utilisation (client-reported, unverified by MMA).
STRATEGIC CHALLENGE
Management wanted to defend industrial volume to keep all three lines loaded, on the reasoning that fixed costs must be absorbed somewhere. Nobody had tested whether the loaded volume was actually contributing anything after precursor cost. Meanwhile the aerospace line was underutilised while qualification opportunities on two new programmes were passing for lack of engineering resource redirected from industrial support.
MMA APPROACH
MMA rebuilt contribution per line and per grade including precursor at market cost, which internal reporting had allocated on a plant average that concealed the position entirely. We assessed the two open qualification opportunities against realistic programme volumes and timing. We then modelled deliberate industrial exit against continued defence, testing utilisation, cash, and the cost of restarting a line if demand returned.
KEY FINDINGS
  1. Industrial tonnage contributed negatively after precursor at market cost, and plant-average allocation had hidden that across three reporting years (client-reported, unverified by MMA).
  2. Exiting industrial grades and idling one line cost less annually than the contribution loss those grades were generating at current pricing on current volumes.
  3. Redirecting engineering resource to the two open qualification opportunities was feasible within existing headcount once industrial technical support stopped, and cost nothing additional.
  4. Pressure vessel demand could absorb roughly 40% of the released capacity within three years at prices well above industrial grades (client-reported, unverified by MMA).
CLIENT PROFILE
A Western carbon fiber producer operating three production lines engaged MMA after two consecutive years of losses on industrial grades. The client reported revenue near USD 340 million, roughly 58% of tonnage sold into wind and general industrial applications at prices below full cost, and one line qualified for aerospace running at 61% utilisation (client-reported, unverified by MMA).
STRATEGIC CHALLENGE
Management wanted to defend industrial volume to keep all three lines loaded, on the reasoning that fixed costs must be absorbed somewhere. Nobody had tested whether the loaded volume was actually contributing anything after precursor cost. Meanwhile the aerospace line was underutilised while qualification opportunities on two new programmes were passing for lack of engineering resource redirected from industrial support.
MMA APPROACH
MMA rebuilt contribution per line and per grade including precursor at market cost, which internal reporting had allocated on a plant average that concealed the position entirely. We assessed the two open qualification opportunities against realistic programme volumes and timing. We then modelled deliberate industrial exit against continued defence, testing utilisation, cash, and the cost of restarting a line if demand returned.
KEY FINDINGS
  1. Industrial tonnage contributed negatively after precursor at market cost, and plant-average allocation had hidden that across three reporting years (client-reported, unverified by MMA).
  2. Exiting industrial grades and idling one line cost less annually than the contribution loss those grades were generating at current pricing on current volumes.
  3. Redirecting engineering resource to the two open qualification opportunities was feasible within existing headcount once industrial technical support stopped, and cost nothing additional.
  4. Pressure vessel demand could absorb roughly 40% of the released capacity within three years at prices well above industrial grades (client-reported, unverified by MMA).
RECOMMENDED STRATEGY
Phase 1: Phase 1 (0 to 9 months): Exit loss-making industrial grades and reallocate precursor and engineering resource toward aerospace and pressure vessel work. Phase 2: Phase 2 (9 to 26 months): Pursue both open aerospace qualifications with the engineering capacity released from industrial technical support. Phase 3: Phase 3 (26 to 40 months): Restart the idled line against contracted pressure vessel volume rather than speculative industrial demand.
OUTCOME
The client exited industrial grades and returned to positive contribution within a year despite lower total tonnage. Both aerospace qualifications progressed on schedule with the redirected engineering resource, and the idled line was restarted eighteen months later against contracted pressure vessel volume rather than speculative demand (client-reported, unverified by MMA).

Frequently Asked Questions

Foundational context covering the market sizes, CAGR, scope, country, region and competition that inform every finding below. This section is provided to cover basics and most often pre-purchase conversations, answered from the MMA Primary Research Dataset.

What is the current size of the Carbon Fiber Market?

The global carbon fiber market is valued at USD 5.9 billion in 2025, covering standard modulus, aerospace grade, large tow, and recycled fiber plus prepreg and intermediate materials. Finished composite parts and other reinforcement fibers are excluded.

How large will the Carbon Fiber Market be by 2036?

The market is forecast to reach USD 15.22 billion by 2036 in the base case, about 2.37 times the 2026 level. That represents incremental value of roughly USD 8.79 billion across the decade.

What is the CAGR for the Carbon Fiber Market 2026 to 2036?

The market grows at a 9.0% CAGR in the base case, with bull and bear scenarios at 10.2% and 7.8%. The spread turns mainly on hydrogen storage scaling and whether wind designers return to carbon spar caps.

Which segment is growing fastest?

Recycled and reclaimed carbon fiber grows fastest at 16.8%, about 1.87 times the overall rate, as decommissioned blades and retired aircraft reach processable volumes. Large tow fiber follows at 10.4%.

Who are the major companies in the Carbon Fiber Market?

Leading producers include Toray Industries, Hexcel, Mitsubishi Chemical Group, Teijin, and SGL Carbon. Concentration is severe, with the top five holding roughly 63% of global production capacity.

Which country is growing fastest?

India grows fastest at a 14.2% CAGR from a very small base, driven by defence, space, and industrial programmes that domestic capacity is only beginning to serve. China follows on capacity utilisation.

Report Segmentation Architecture

The full report scope spans multiple orthogonal segmentation dimensions, with cross-tabulated demand data provided for each dimension pair. Coverage extends further to regional breakdowns, trend trajectories, and the competitive detail needed to support segment-level decision-making.

By Fiber Grade

  • Standard Modulus Industrial Fiber
  • Aerospace Grade Fiber and Prepreg
  • Large Tow Fiber
  • Recycled and Reclaimed Carbon Fiber
  • Pressure Vessel and Specialty Grades

By End-Use Industry

  • Commercial Aerospace and Defence
  • Wind Energy
  • Automotive and Transportation
  • Pressure Vessels and Hydrogen Storage
  • Sporting Goods and Industrial

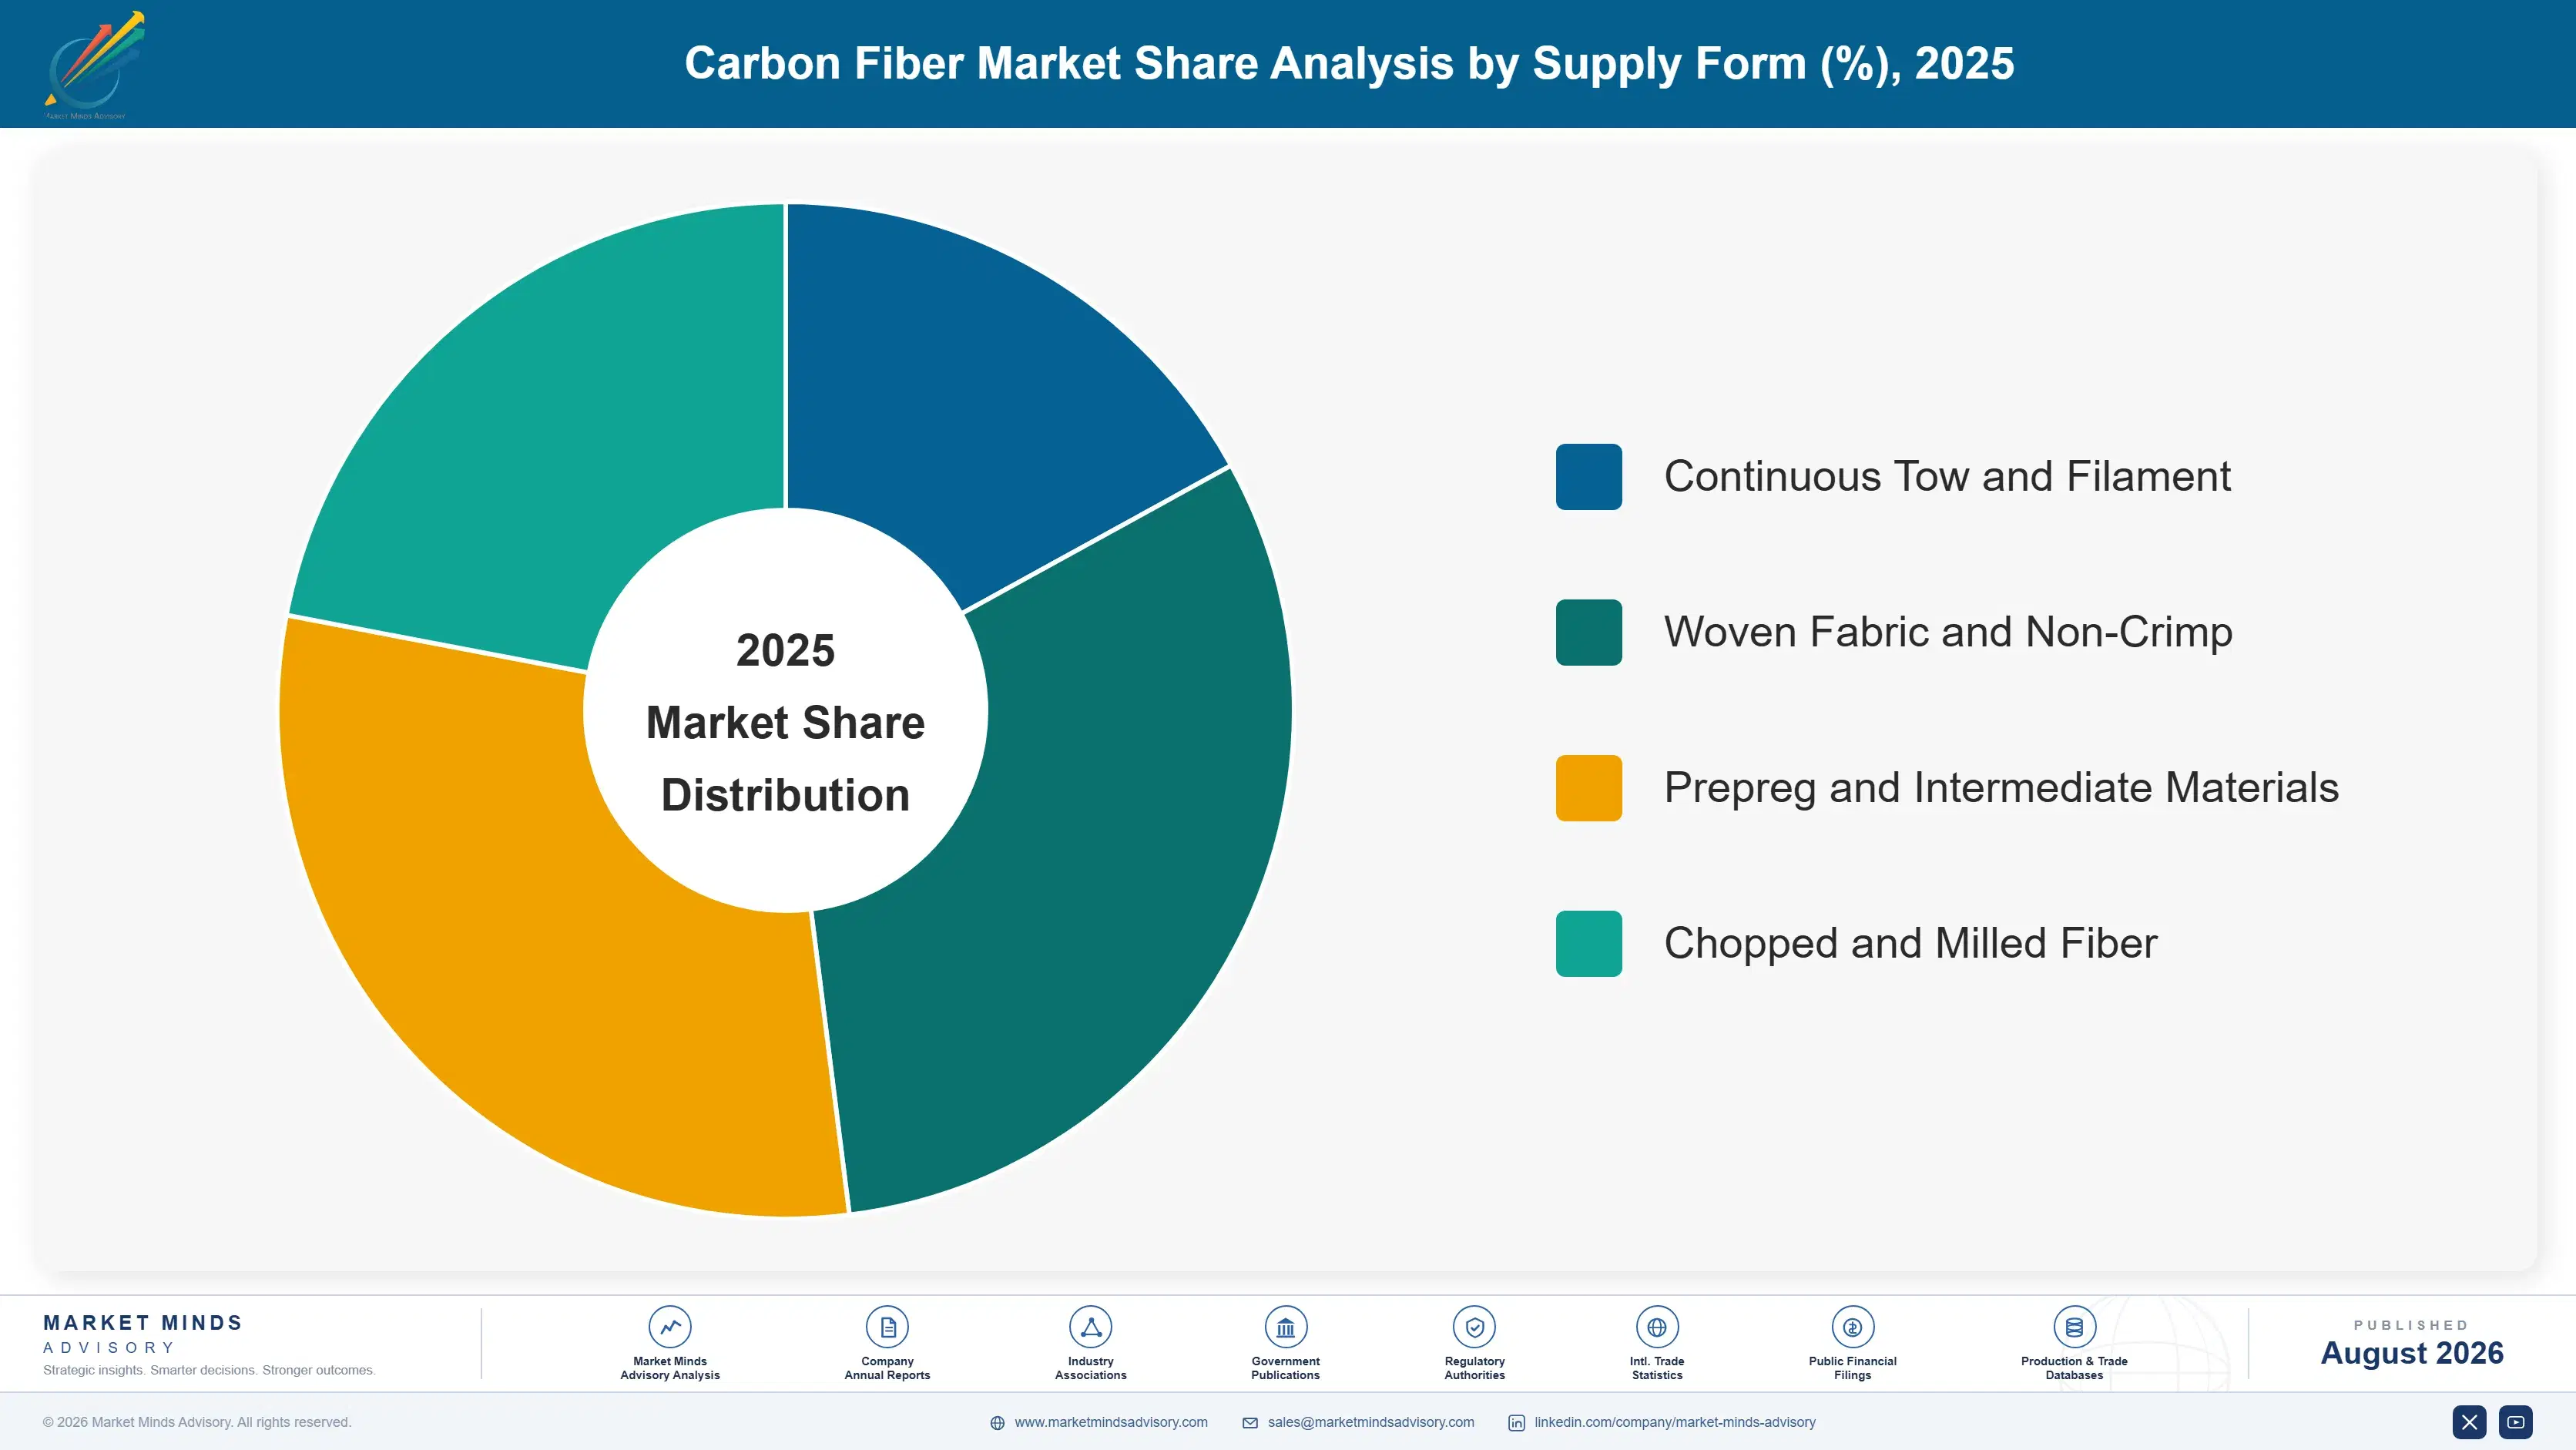
By Supply Form

  • Continuous Tow and Filament
  • Woven Fabric and Non-Crimp
  • Prepreg and Intermediate Materials
  • Chopped and Milled Fiber

By Region

  • North America
  • Western Europe
  • East Asia
  • South Asia and Pacific
  • Latin America
  • Middle East and Africa
  • Eastern Europe

Scope, Methodology, and Coverage

Every figure in this report is reproducible from documented input assumptions. The scope below maps the historical period, the forecast horizon, the segmentation dimensions, and the countries covered, alongside the underlying primary and qualitative methodology.
Historical Period
2020 to 2025
Forecast Period
2026 to 2036
Base Year
2025 (USD billions; MMA Primary Research Dataset, August 2026)
Market Definition
The carbon fiber market comprises the production and first sale of carbon fiber in continuous filament, tow, woven fabric, chopped, and prepreg intermediate form, valued at producer selling prices to converters, composite manufacturers, and end users. It spans standard modulus industrial fiber, intermediate and high modulus aerospace-qualified fiber, large tow fiber produced at filament counts above 24,000 for wind and industrial applications, recycled and reclaimed fiber recovered through pyrolysis or solvolysis, and pressure vessel and specialty grades. Finished composite parts, structures, and assemblies, glass, aramid, basalt, and natural reinforcement fibers, resin systems and adhesives sold separately from fiber, composite manufacturing and curing equipment, and carbon black, graphite electrodes, or activated carbon products are excluded.
Quantitative Units
USD billions (current prices); fiber production and consumption volume in thousand tonnes where applicable
Segmentation Dimensions
By Fiber Grade; By End-Use Industry; By Supply Form; By Region
Regions Covered
North America, Western Europe, East Asia, South Asia and Pacific, Latin America, Middle East and Africa, Eastern Europe
Countries Covered
USA, China, Germany, France, UK, Japan, South Korea, India, Australia, Canada, Brazil, Mexico, Indonesia, Vietnam, Thailand, Malaysia, UAE, Saudi Arabia, South Africa, Nigeria, Turkey, Poland, Netherlands, Italy, Spain, Sweden, Switzerland, Argentina, Colombia, Singapore, and additional markets relevant to this sector
Key Companies Profiled
Toray Industries, Hexcel, Mitsubishi Chemical Group, Teijin, SGL Carbon, Solvay, Formosa Plastics, Zhongfu Shenying, Jilin Chemical Fibre, Hyosung Advanced Materials, DowAksa, Kureha, Nippon Graphite Fiber, Zoltek, Gurit, Park Aerospace, Sinofibers Technology, ELG Carbon Fibre, Carbon Conversions, Vartega
Quantitative Methodology
Primary survey, n=3,800 respondents, Q4 2025, six countries; demand-side model with trade association cross-validation
Qualitative Methodology
47 expert interviews, Q4 2025; applied to validate demand model assumptions, identify emerging dynamics, and assess competitive positioning
Report Format
PDF and XLSX data workbook (Word format preview document)
Publisher
Market Minds Advisory
Report Code
MMA-2026-CHM-197
Published
August 2026
Contact
sales@marketmindsadvisory.com | www.marketmindsadvisory.com

Purchase the full Carbon Fiber Market Report (2026 to 2036).

The full MMA Carbon Fiber report sizes the market across five fiber grades, five end-use industries, four supply forms, and seven regions through 2036. It profiles 20 producers on a consistent basis of carbon fiber production capacity and fiber revenue, scoring each on aerospace qualification position, precursor integration, energy cost location, and capacity timing discipline. Scenario models quantify how Chinese capacity expansion, aerospace build rates, and hydrogen storage adoption move both volume and achievable pricing by grade. The report also includes contribution modelling by grade at market precursor cost, oxidation capacity and utilisation mapping, qualification pipeline assessment against programme timing, and reclaimed feedstock availability forecasting for producers and composite manufacturers.
Five-grade and four-form market sizing to 2036
Twenty-producer benchmark on capacity and fiber revenue
Contribution modelling by grade at market precursor cost
Oxidation capacity and utilisation mapping across the producer field
Aerospace qualification pipeline assessment against programme design timing
Reclaimed feedstock availability forecasting from blades and aircraft

Built For The People Who Decide

From boardroom strategy to bench-side execution, this report is read cover-to-cover by leaders shaping the next decade of their industry, turning demand scenarios, market dynamics and valuation benchmarks into decisions.
CXOs/ Presidents/ VPs/ Managers
M&A and Corporate Development
Strategy Teams and R&D Heads
Procurement and Product Directors
Regulatory and Compliance Leaders
Investor Relations and Equity Analysts