Market Minds Advisory
Carbon Capture and Storage (CCS) Market

Carbon Capture and Storage (CCS) Market: Carbon Capture and Storage Market: Concentration Decides The Cost

The cost of capturing a tonne of carbon dioxide varies fourfold depending on how pure the stream already is. Almost every project that failed ignored that, and almost every one that works did not.

Lead Analyst

Published

September 2026

Make Smarter Decisions with Customized Research Insights

Request a free sample report and evaluate market opportunities, growth trends, and competitive dynamics relevant to your business needs.

2025 MARKET VALUE$8.4BMarket Size 2025
2036 FORECAST VALUE$28.1BBase Case , 2026 to 2036
CAGR 2026 TO 203611.6 %Bull 12.9% / Bear 10.3%
INCREMENTAL OPPORTUNITY$18.7BNet 10- year value creation
EXPANSION MULTIPLE3.00x2036 value over 2026 base
Strategic Levers
M&A Pipeline
Regional Outlook
Country Rankings
Competitive Intelligence
Segmental Deep-dive
Call-Us : 91 93563 13602

Executive Snapshot and Market Trajectory.

Concentration decides everything and it is the least discussed number in this sector. Capturing carbon dioxide from an ammonia plant costs USD 22 a tonne because the stream is pure. Doing it from a power station flue costs USD 94, and no engineering has closed that gap.
Hydrogen and ammonia capture grows at 17.4%, half again the market rate of 11.6%, because those processes vent a nearly pure stream that costs a quarter of what a power station flue costs to capture. North America holds 34% of demand, above any normal band, and the reason is a tax credit rather than a target: 45Q pays per tonne stored, for twelve years, to whoever stores it. Nothing in Europe works that simply.
Concentration is low at 34% of contracted capacity, because capture technology licensing, engineering, pipeline transport and storage are four different businesses that no participant holds end to end. The binding constraint is none of them individually. It is permitted pore space with a pipeline to it, and a storage site takes eight years to reach an injection permit. Everybody has been optimising the wrong part of this chain entirely.
Market Definition
The carbon capture and storage market covers the capture of carbon dioxide from industrial and energy point sources, its conditioning and transport, and its permanent geological storage, segmented by the emission source captured across natural gas processing and LNG, hydrogen and ammonia production, cement and lime manufacturing, iron, steel and metals, power generation, and refining and chemicals. Scope is measured as contracted and operating capture capacity with the associated transport and storage revenue. Excluded are direct air capture, carbon dioxide utilisation into products, enhanced recovery where storage is not permanently certified, biological sequestration, and emissions trading instruments.
Base Year Value
$8.4B in 2025 (MMA Primary Research Dataset, August 2026)
Forecast Period
2026 to 2036, eleven discrete annual values
CAGR
11.6% base case. Bull 12.9%. Bear 10.3%.
Fastest Growth Segment
Hydrogen and Ammonia Production: 17.4% CAGR
Fastest Growth Country
Australia: 13.9% CAGR
Fastest Growth Region
South Asia and Pacific: 13.9% CAGR
Largest Region
North America: 34% of 2025 global value
Market Leaders
SLB, Mitsubishi Heavy Industries, Linde, Air Liquide and Baker Hughes. Source: MMA Analysis, July 2026.
Primary Survey
n=3,800 procurement and R&D decision-makers, Q4 2025, six countries
Methodology
Demand-side build-up, cross-validated against public data, 47 expert interviews

Carbon Capture and Storage (CCS) Market Forecast Scenarios

carbon-capture-storage-market-size-forecast-scenario-1788193603079
Between 2020 and 2025 the sector compounded at 10.2%, and announcement volume ran far ahead of anything built. Final investment decisions arrived slowly because storage permits and transport arrangements were not ready, and several flagship projects reported capture rates well below design. The gap between announced pipeline and operating capacity widened every single year of that period, which nobody in the sector enjoyed explaining.
The 11.6% base case rests on three mechanisms. Tax credits and contract-for-difference schemes now pay per tonne stored across North America, the United Kingdom and Norway, which converts an obligation into a revenue line. Hard-to-abate industries facing carbon prices have no alternative technology for process emissions from cement and steel. And shared transport and storage hubs are reaching operation, which removes the infrastructure barrier for everybody behind them. None of the three requires new capture technology.
The bull case at 12.9% turns on European carbon prices rising far enough that cement and steel capture pencils without any subsidy, which would remove the political dependency. The bear case at 10.3% is that same dependency: 45Q and the European schemes are political instruments, and a reversal would end most of the announced pipeline within a single budget cycle.

The Purity Of The Stream

Project economics follow the concentration of carbon dioxide in the source stream, and the sector talks about almost anything else. Ammonia and gas processing vent a nearly pure stream, so separation costs around USD 22 a tonne. Cement flue gas sits near a fifth. Power station flue gas runs far more dilute and costs USD 94, because the equipment handles enormous volumes of nitrogen to reach the same tonne.
TOP FIVE CONCENTRATION34%Share of contracted capture capacity held by five participants
DILUTE STREAM COSTUSD 94/tCapture cost from a low concentration power station flue
CONCENTRATED STREAM COSTUSD 22/tCapture cost where the source stream is already pure
STORAGE SITE LEAD TIME8 yearsMedian from site screening to injection permit approval
ACHIEVED CAPTURE RATE78%Actual capture achieved against design rate on operating projects
HUB CONNECTED SHARE63%Portion of contracted capacity relying on shared transport infrastructure
That single arithmetic explains which projects were built and which collapsed. Gas processing capture has operated commercially for decades without any subsidy at all, because the carbon dioxide had to be removed anyway and storing it cost little more than venting. Power sector capture has failed repeatedly on three continents. Projects now reaching final investment decision are overwhelmingly concentrated streams, which always were the sensible place to start.
The constraint moved from capture to storage and most of the sector has not adjusted. A capture plant takes three or four years. A storage site takes eight to reach an injection permit, through seismic acquisition, appraisal drilling, containment assessment and a regulatory process transferring long-term liability. Some 63% of contracted capacity depends on shared hubs, because individual storage development defeats individual projects.
"The engineering community spent fifteen years making capture cheaper and the binding constraint turned out to be a permit for a hole in the ground. The people who quietly acquired pore space and appraisal data are holding the scarce asset, and almost none of them are engineering companies."
Director, Carbon Management Practice · MMA Energy Practice · August 2026

Market Trends

Concentrated streams took the entire project pipeline

Projects reaching final investment decision are now overwhelmingly those capturing from ammonia, hydrogen, gas processing and ethanol production, where the source stream is already close to pure and separation costs around USD 22 a tonne against USD 94 for a dilute power station flue. That is a fourfold cost difference no engineering improvement has ever closed, and the sector spent fifteen years pretending otherwise. Hydrogen and ammonia capture grows at 17.4% against a market rate of 11.6% as a direct result, and power sector capture has quietly stopped attracting capital in most markets.
Market Impact: Pays per tonne for 12 years
Shared hubs replaced project specific storage entirely

Individual storage development defeats individual projects, because appraisal, drilling and permitting cost more than most single emitters can justify and take eight years that no capture plant schedule can absorb. Shared transport and storage hubs spread that cost across many emitters and present a connection point rather than a development project, which is why 63% of contracted capacity now depends on them. Northern Lights, Porthos and the Gulf Coast networks established the model. The commercial consequence is that hub access, not capture capability, decides which emitters can participate at all.
Market Impact: Addresses 2 thirds of cement emissions

Market Opportunities and Growth Drivers

Tax credits converted obligation into a revenue line

The United States 45Q credit pays a fixed amount for every tonne permanently stored, for twelve years, to the party that stores it, which turns carbon capture from a compliance cost into a contracted income stream a lender can underwrite. European schemes reach the same place through contracts for difference in the United Kingdom and the Netherlands and through direct support in Norway. That distinction matters enormously: a subsidy paid per tonne stored is financeable, and a carbon price that may or may not hold is not. North America takes 34% of demand largely because of it.
Market Impact: Delays projects by 8 years

Process emissions leave heavy industry no alternative

Roughly two thirds of the carbon dioxide from cement comes from the chemistry of calcining limestone rather than from burning fuel, so no amount of renewable electricity or alternative fuel removes it. Steel, lime and parts of the chemical industry face the same physical situation. Those industries can decarbonise energy and still emit, which leaves capture as the only available route to a deep reduction. Cement and lime capture grows at 15.2% for that reason, and the driver is chemistry rather than any policy that could later be reversed. Chemistry does not get repealed.
Market Impact: Achieves 78% of design rate

Market Restraints and Challenges

Storage permitting takes longer than any project schedule

Reaching an injection permit takes a median of eight years through seismic acquisition, appraisal drilling, containment and plume modelling, public consultation and a regulatory decision that must also resolve who holds liability for the stored carbon dioxide in perpetuity. The root cause is that no regulator wants to accept an indefinite liability and no operator wants to keep it, so the transfer question stalls otherwise complete applications. Commercial impact is capture capacity with nowhere to go. Participants are responding through shared hubs, early pore space acquisition, state-backed liability frameworks and reuse of appraised depleted fields.
Market Impact: Costs USD 22 against USD 94

Operating projects miss their design capture rates

Several flagship projects have reported achieved capture around 78% against design rates in the nineties, from solvent degradation, compressor availability, upstream process variability and reservoir injectivity below expectation. The root cause is that these are first-of-a-kind plants integrated into industrial processes that were never designed to accommodate them. Commercial impact is credibility damage that reaches financing terms across the whole sector rather than the individual project. Mitigation runs through conservative design margins, published operating data, availability guarantees from technology licensors and performance-linked commercial structures replacing nameplate claims. Nobody has published a full year honestly yet.
Market Impact: Serves 63% of contracted capacity
3 additional market trends, 4 additional growth drivers, and 2 additional restraints and challenges are covered in the full report. Contact sales@marketmindsadvisory.com to access the complete intelligence.

Segment CAGR and Growth Architecture

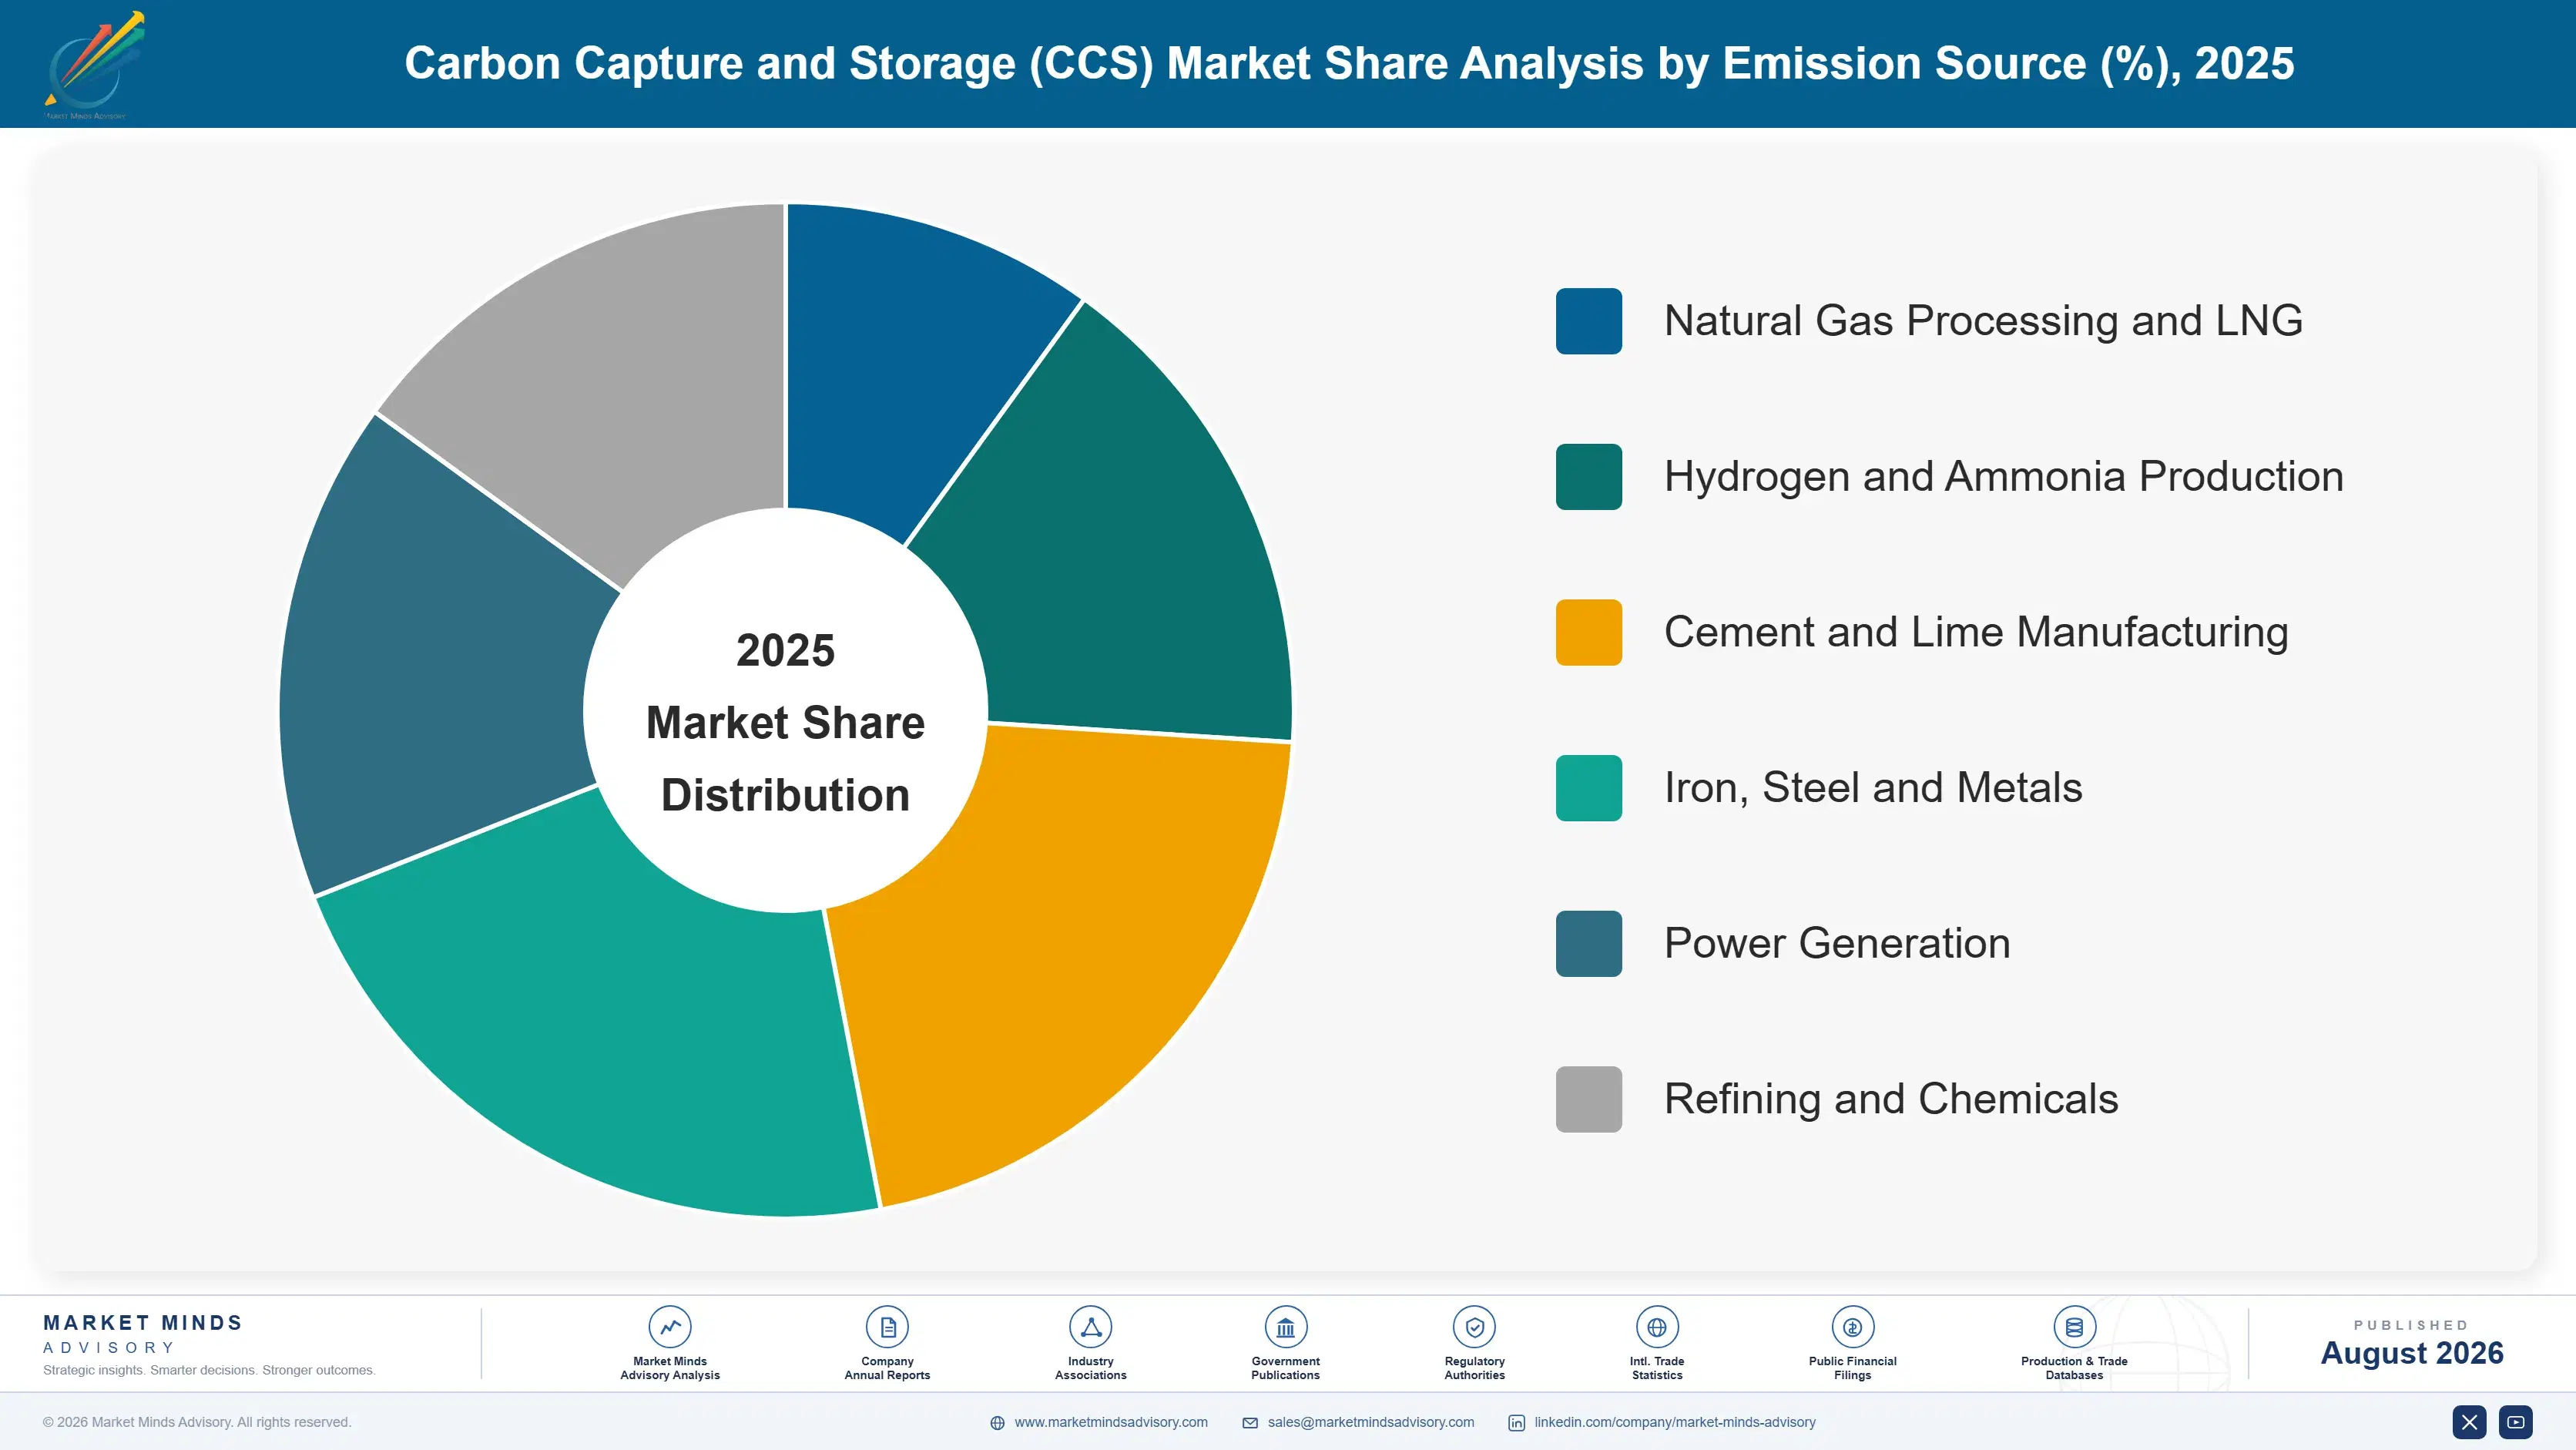
Segmentation follows emission source, the dimension on which stream concentration, capture cost and policy exposure all move together. Power generation and refining carry announced volume at costs that only a subsidy supports. Hydrogen, ammonia and cement carry the growth, because two of them are cheap to capture and the third has no alternative route at all.
carbon-capture-storage-market-market-share-analysis-1788193603638

Hydrogen and Ammonia Production

Hydrogen and ammonia capture grows at 17.4%, half again the market rate of 11.6%, and the reason is that the carbon dioxide arrives already separated. Steam methane reforming produces a concentrated process stream that has to be removed anyway to make the product, so the incremental cost of capture is compression and dehydration rather than separation, at around USD 22 a tonne. Low-carbon hydrogen and ammonia standards across Europe, Japan and Korea require a certified carbon intensity that only storage delivers for a fossil-derived product. That combination of the cheapest capture in the sector and a product standard demanding it makes this the least contested economics anywhere in carbon management.
CAGR 17.4%

Cement and Lime Manufacturing

Cement and lime capture grows at 15.2% on chemistry rather than on policy, which makes it unusually durable. Around two thirds of the carbon dioxide released comes from calcining limestone rather than from burning fuel, so a plant running entirely on renewable energy still emits at nearly the same rate. There is no alternative process at commercial scale and no substitute material at the volumes construction consumes. Flue gas concentration sits near a fifth carbon dioxide, considerably better than a power station and worse than an ammonia plant, which places capture cost in the middle of the range. Every serious cement decarbonisation plan now depends on capture, and the producers know it.
CAGR 15.2%
Full segment breakdown across 6 segments available in the complete report.

Regional Architecture and Country Demand Map

North America takes 34%, above its usual band, because 45Q pays per tonne stored rather than setting a target. Western Europe follows on hubs and carbon pricing. Australia grows fastest of any country covered. Every one of those positions rests on a policy instrument rather than on geology or demand.

North America

A 34% share above the usual band comes down to one instrument working better than every alternative anywhere. The 45Q credit pays a fixed sum per tonne permanently stored, for twelve years, to the party doing the storing, which a lender can underwrite in a way no carbon price allows. Gulf Coast geology offers storage capacity and an existing carbon dioxide pipeline network built decades ago for enhanced recovery. Class VI permitting is advancing and several states now administer it directly, which shortens the timeline meaningfully. Ethanol, ammonia and gas processing supply concentrated streams at low capture cost. Every element of the chain is present here simultaneously. That is not true anywhere else at all.
Share: 34% | CAGR: 12.4% (2026 to 2036)

Western Europe

Shared infrastructure rather than subsidy generosity explains this position, and it is a genuinely different model from the American one. Northern Lights, Porthos and the Norwegian and Dutch storage developments present emitters with a connection point instead of a development project, which removes the eight year barrier that stops individual schemes. Emissions trading gives a carbon price and contracts for difference in the United Kingdom and the Netherlands cover the gap where the price falls short. North Sea depleted fields carry decades of appraisal data already acquired. Growth at 10.2% is the slowest of the seven regions and reflects a mature policy design rather than weak demand. The infrastructure came first here, deliberately.
Share: 25% | CAGR: 10.2% (2026 to 2036)
Regional intelligence for 5 additional markets available in the complete report: East Asia, South Asia and Pacific, Latin America, Middle East and Africa, Eastern Europe. Contact sales@marketmindsadvisory.com.
carbon-capture-storage-market-country-cagr-analysis-1788193604162

Four Moves On The Real Constraint

None of these four is about capture technology, which is fortunate, because capture works and has for decades. Each addresses what actually stops projects: the purity of the stream somebody chose, the permit for the pore space, and a financing market that has been burned before. Each is a commercial choice rather than an engineering one.

Chase the concentrated streams first, always

Capture from ammonia, hydrogen, gas processing and ethanol costs around USD 22 a tonne because the carbon dioxide arrives already separated, against USD 94 from a dilute power station flue that requires handling enormous volumes of nitrogen for the same tonne. That fourfold difference has survived fifteen years of engineering effort and it will survive fifteen more. A developer selecting projects by stream concentration rather than by emitter size builds a portfolio that pencils without heroic subsidy assumptions. Several have learned this the expensive way. Several developers have learned that the expensive way.
Market Impact: Captures at USD 22 rather than USD 94

Acquire pore space before it is contested

A storage site takes a median of 8 years to reach an injection permit, and the sites with existing appraisal data from decades of oil and gas work take considerably less. Depleted fields with seismic coverage, well logs and proven containment are the scarcest asset in this sector and they are currently held by parties who value them at nothing. Options and acquisitions cost a fraction of a capture plant. The developers holding permitted pore space will set terms for everybody who does not, which is already beginning to happen.
Market Impact: Removes about 8 years from the project schedule

Publish the operating data honestly, first

Flagship projects reporting achieved capture around 78% against design rates in the nineties have damaged financing terms across the whole sector rather than only their own. Lenders now discount nameplate claims from everybody. A participant publishing actual availability, achieved rate and the reasons for shortfall converts a credibility problem into a differentiator, because the alternative is being priced alongside the projects that overpromised. It costs an uncomfortable disclosure decision. Nobody has done it and the first participant to do so will be rewarded for it. There is a first-mover position sitting here unclaimed.
Market Impact: Corrects on a 78% achieved capture rate publicly

Sell hub access as the product

Some 63% of contracted capacity now depends on shared transport and storage, because individual storage development costs more and takes longer than most single emitters can justify at all. A hub operator is selling connection rather than infrastructure, and the emitter is buying schedule certainty rather than tonnes of capacity. That reframing reaches a different decision-maker with a different budget and a different timeline. Hub operators still presenting capacity tables to engineers are selling to the wrong function inside the customer. That is a sales problem, not an infrastructure one. Very few have fixed it.
Market Impact: Serves the 63% of capacity relying on hubs

Who Controls the Margin Pool

CR5 stands at 34% of contracted and operating capture capacity in million tonnes per annum, which is the only basis comparable across participants reporting in entirely different revenue categories. Concentration is low because capture licensing, engineering, transport and storage are four separate businesses and nobody holds the whole chain. The gap between leaders and the field is a gap in storage position rather than technology.
Competition runs on storage access, financing capability and integration reach. Storage access decides which projects can proceed, since capture without a permitted destination is stranded equipment. Financing capability decides who survives an eight year development before any revenue arrives. Integration reach decides who can present an emitter with one contract instead of four. Capture technology differentiates far less than the licensors would like.

Rankings will move as hubs reach operation and the parties holding pore space discover what it is worth. A hub operator with permitted storage and pipeline capacity is holding the scarce asset in this chain, and every capture project behind it is a customer without alternatives. The pressure comes from a permitting process rather than from a competitor, which rewards patience and land position over engineering.
carbon-capture-storage-market-company-positioning-matrix-1788193604692

Competitive Moat and Risk Dimensions

SLB

Moat: Subsurface capability across the chain

Decades of reservoir characterisation, seismic interpretation and well construction give the group capability in exactly the part of this chain that has become the constraint, which is finding, appraising and permitting storage. Capture technology through its capture business sits alongside it. Very few participants hold both the subsurface and the surface side, and the subsurface half is the scarce one.
SLB

Risk: Oilfield association complicates public consent

Storage projects require public and regulatory consent in communities that often view oilfield service companies with suspicion, and the association can slow a permit that a differently branded participant would obtain more easily. Technical capability does not resolve a consent problem. Several European projects have found the sponsor's identity mattering as much as the geology beneath the site.
MITSUBISHI HEAVY INDUSTRIES

Moat: Proven solvent capture at scale

Long deployment of amine capture technology across commercial installations gives the group operating data from plants that have actually run for years rather than pilot results, which matters enormously to a lender assessing first-of-a-kind risk. Reference plants are the currency in this sector. Accumulating equivalent references requires operating time that no amount of capital shortens for a competitor.
MITSUBISHI HEAVY INDUSTRIES

Risk: No storage position at all

Supplying capture technology into a chain where storage access has become the binding constraint leaves the group dependent on other parties resolving the part that stops projects. A licensor cannot convert a strong technical position into revenue when the customer cannot obtain a permit. Building subsurface capability is entirely outside the group's engineering heritage.

Players Tracked

Prominent Players

SLB
Mitsubishi Heavy Industries
Linde
Air Liquide
Baker Hughes

Other Key Players

Honeywell UOP
Technip Energies
Fluor
Shell
ExxonMobil
Occidental Petroleum
Equinor
TotalEnergies
Chiyoda Corporation
Carbon Clean
Svante
Sulzer
Wood Group
Aker Solutions
Storegga

Recent Developments

FEBRUARY 2025

European storage hub accepted first third-party emitter volumes

A North Sea storage hub began accepting carbon dioxide from third-party industrial emitters rather than only from its founding participants, demonstrating the shared infrastructure model in commercial operation. Emitters connecting behind it avoided the eight year storage development that had previously stopped comparable projects across the region.
Signal: The hub model turned an eight year development problem into a connection agreement for everybody behind it.
MAY 2025

United States Class VI permitting authority devolved to further states

Additional states received primacy over Class VI injection well permitting, moving the decision from federal to state administration and shortening review timelines materially for storage developments in those jurisdictions. Project developers redirected their site screening toward states holding that authority within a single quarter of the change.
Signal: Permitting jurisdiction now moves capital faster than geology does, which nobody in the sector planned for.
SEPTEMBER 2025

Operating project disclosed capture rate below design

A large operating capture installation disclosed achieved capture materially below its design rate across a full year, attributing the shortfall to solvent degradation and upstream process variability rather than to any fundamental technology failure. Lenders assessing comparable projects tightened performance assumptions across the sector afterwards.
Signal: One honest disclosure repriced risk for every project that had not yet published anything at all.

Energy, Solvent And Compression

Energy for solvent regeneration accounts for roughly 38% of operating cost on a dilute stream, compression to pipeline pressure around 21%, and solvent make-up and degradation losses a further 12%. Capital charges on the capture island and the pipeline dominate the rest. Regeneration energy is steam, which means the cost line moves with whatever fuel the host plant burns rather than with any chemical market.
European energy pricing through 2022 demonstrated the exposure directly and expensively. The International Energy Agency documented industrial gas price movement across that period, and capture projects drawing regeneration steam from gas-fired boilers saw operating cost move with it while their tonne-based revenue stayed fixed. Projects with waste heat integration were unaffected. Those buying steam at market price discovered that a subsidy fixed per tonne offers no protection against an input that is not.

The disadvantage falls entirely on stream concentration rather than on procurement. A dilute flue gas requires the equipment to process enormous volumes of nitrogen to reach the same tonne of carbon dioxide, which multiplies energy, solvent circulation and compression duty together. A concentrated stream avoids all three. No purchasing decision closes a fourfold gap that originates in the physics of the source.
carbon-capture-storage-market-cost-volatility-analysis-1788193604888

Integrate waste heat rather than buying steam

Solvent regeneration energy is 38% of operating cost on a dilute stream and it moves with whatever fuel the host plant burns, while the revenue is fixed per tonne stored. Projects drawing regeneration heat from process waste streams were untouched by the last energy cycle. The integration cost is engineering at the design stage and impossible to retrofit cheaply afterwards.

Select projects by stream concentration first

A concentrated source stream avoids energy, solvent circulation and compression duty simultaneously, which is why capture costs USD 22 a tonne from ammonia and USD 94 from a power station flue. No procurement skill closes a gap that originates in physics. Developers screening by emitter size rather than by stream purity have consistently built the more expensive portfolio.

Contract solvent supply with degradation guarantees

Solvent make-up and degradation losses are 12% of operating cost and the rate depends on flue gas impurities the capture operator does not control. Supply agreements carrying degradation performance terms move part of that exposure to the licensor who specified the chemistry. Most operators buy solvent as a commodity and absorb the whole variance themselves without ever negotiating it.

Portfolio Architecture for Margin Defence

Margin here follows stream concentration rather than technology sophistication, which reverses how the sector presents itself. Capture from a concentrated source earns a wide margin against a fixed per tonne credit because the cost is low, while the identical commercial structure on a dilute stream barely covers operating cost. Participants selecting projects by stream purity rather than by emitter prominence run a completely different portfolio from the rest.
Volume and premium pull against each other through the hub rather than the plant. Transport and storage capacity sold to many emitters earns modest unit margins and builds the utilisation that makes a hub viable at all, and that utilisation is what allows premium terms on the next connection. A hub serving only the highest-paying emitters never fills, and an unfilled hub returns nothing to anybody who built it.

High-value pools sit in permitted storage, in hub connection agreements and in long-term monitoring obligations that nobody wants and somebody must hold. The third is the least understood: measurement, monitoring and verification runs for decades after injection stops, at contracted rates, with no competition once the wells are in. It is the most annuity-like revenue in the entire carbon management chain.

Volume / Commodity-Adjacent

Capture equipment supply and engineering services into dilute flue gas applications competing on installed cost per tonne of capacity. Margins are thin because the underlying economics barely work. The 9 point spread reflects whether the participant licenses technology or only fabricates equipment.
Gross Margin: 8 to 17%

Premium / Certified

Capture from concentrated streams in ammonia, hydrogen and gas processing, where low cost per tonne against a fixed credit produces genuine margin. Stream selection rather than technology supports the return. The 9 point spread reflects whether waste heat integration was designed in from the start.
Gross Margin: 26 to 35%

Sustainability / Regulatory / Next-Generation

Permitted storage capacity, hub connection agreements and long-term monitoring and verification obligations sold on multi-decade terms. Margins are high because permitted pore space is genuinely scarce. The 18 point spread separates storage tariffs from monitoring service revenue, which behave very differently.
Gross Margin: 38 to 56%
carbon-capture-storage-market-portfolio-architecture-1788193605390

High-value Sub-segments and Strategic Watch-out

Hydrogen and Ammonia Production

High value and high growth at 17.4%. The carbon dioxide arrives already separated so capture costs a quarter of a dilute stream, and product carbon intensity standards require certified storage anyway. The 8 point spread reflects whether the project sits behind a shared hub or develops storage itself.
Gross Margin: 40 to 48%

Cement and Lime Manufacturing

High value with strong growth at 15.2%. Two thirds of the emissions come from limestone chemistry rather than fuel, so no alternative process removes them at any commercial scale. The 8 point spread reflects flue gas concentration, which varies more between cement plants than most assume.
Gross Margin: 30 to 38%

Natural Gas Processing and LNG

The volume core. It earns modestly and it has operated commercially for decades without subsidy, which gives the sector its only long operating record and its financing credibility. The 8 point spread reflects proximity to storage and whether injection infrastructure already existed on the site itself.
Gross Margin: 22 to 30%

Power Generation

The strategic watch-out. Dilute flue gas at USD 94 a tonne has defeated projects across three continents and no engineering has closed the gap against concentrated sources. The 22 point spread separates projects with waste heat and subsidy support from those competing on merit alone.
Gross Margin: 4 to 26%

Decades After Injection Stops

The annuity here runs longer than in almost any industrial sector, because the obligation outlives the operation. A storage site takes tonnes for perhaps twenty years and then requires monitoring, verification and reporting for decades after injection stops, at contracted rates, from a party that cannot walk away. That tail is contractually locked and competitively uncontested, and very few participants have priced it as the asset it actually is.
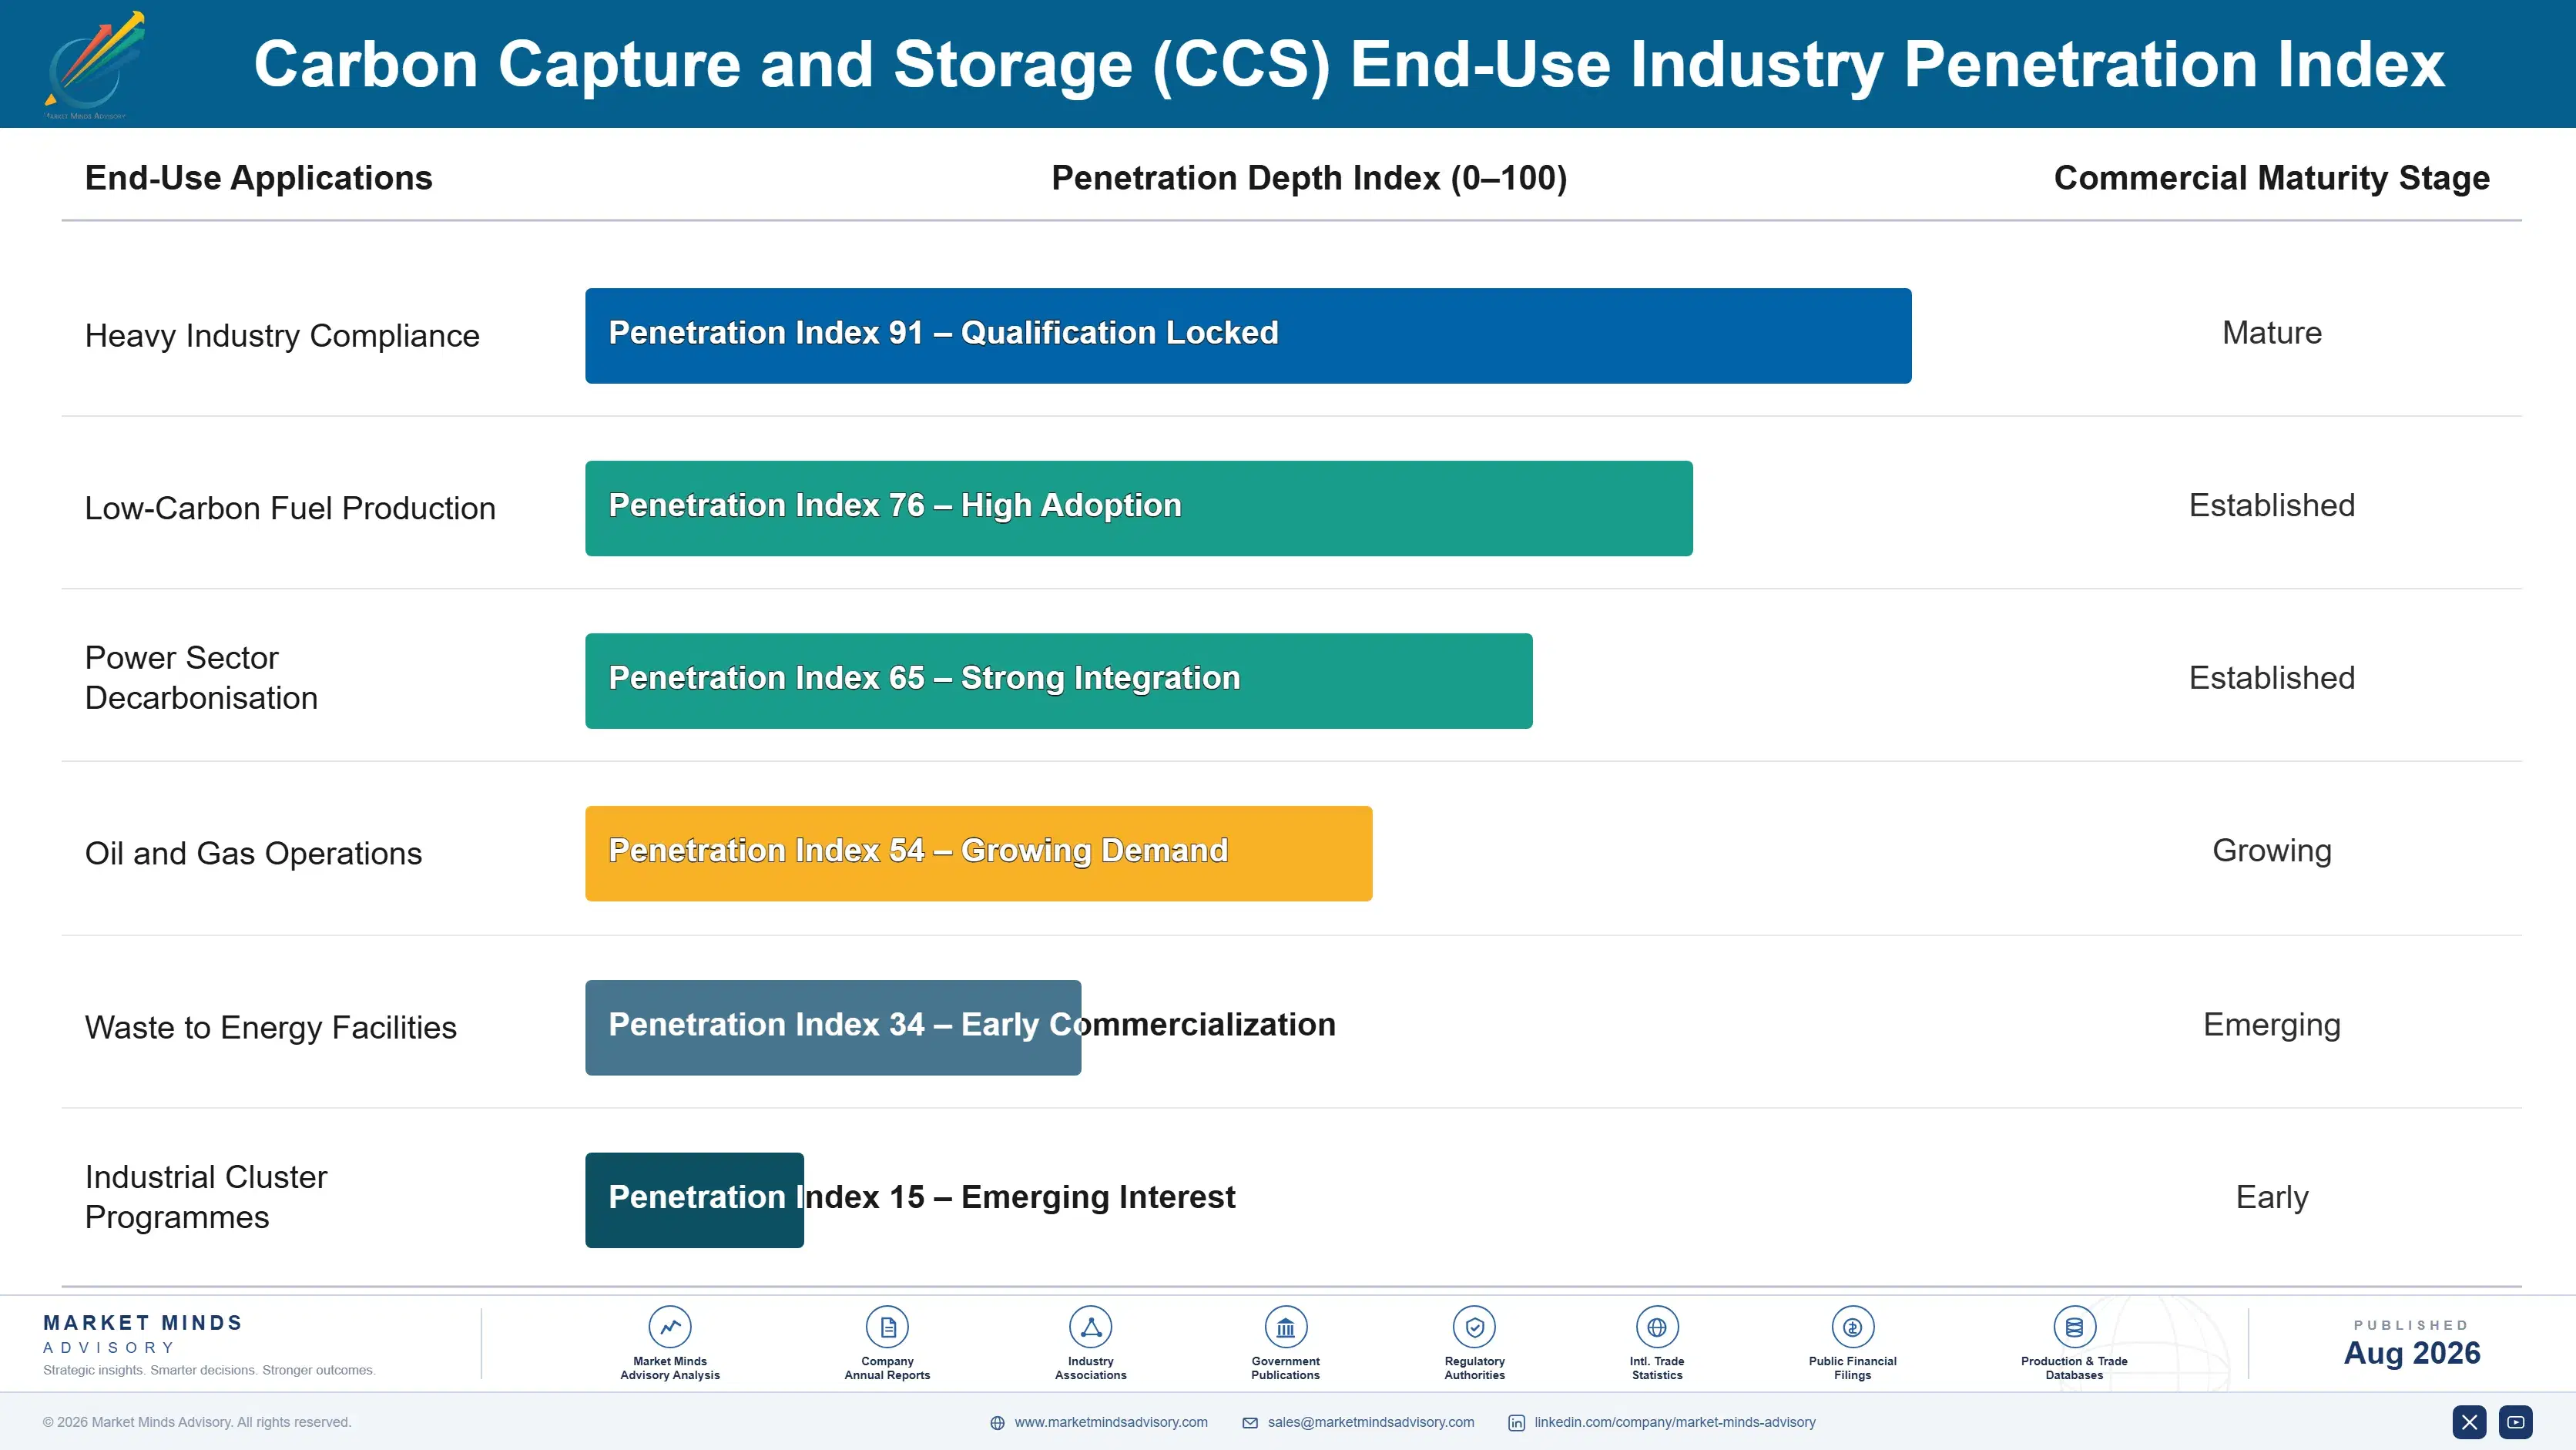
Adoption depth varies enormously by emission source rather than by geography or company size. A gas processor capturing a concentrated stream signs and proceeds, because the arithmetic works without argument. A cement producer has no alternative and proceeds slowly because the capital is enormous relative to the business. A power generator evaluates repeatedly and declines, and has been doing so consistently for the better part of two decades now.

Buyer profiles have shifted from environmental functions toward treasury and project finance, and the sector's commercial organisations have not followed. An environmental manager asks about capture rate and emissions reduction. A treasurer asks whether the 45Q revenue is contractible, who holds the storage liability and what happens if the achieved rate lands at 78%. The second conversation decides the project entirely.
carbon-capture-storage-market-end-use-penetration-index-1788193605879

What Actually Gets Built

These are among the four positions where our research anticipates prominent divergence between winners and laggards over the coming forecast period. Each is grounded in the demand model, the regulatory perimeter, and the announced capacity pipeline.
01 / STREAM SELECTION DISCIPLINE

Pick the source, not the emitter

Capture from ammonia, hydrogen, gas processing and ethanol costs around USD 22 a tonne because the carbon dioxide arrives already separated, against USD 94 from a dilute power station flue that forces the equipment to process enormous volumes of nitrogen. That fourfold gap has survived fifteen years of engineering effort and originates in physics rather than in design choices anybody can improve. A developer screening projects by stream concentration rather than by emitter prominence builds a portfolio that works without heroic subsidy assumptions.
02 / PORE SPACE ACQUISITION

Buy the permit problem before everyone else does

Reaching an injection permit takes a median of 8 years, and depleted fields carrying existing seismic coverage, well logs and proven containment take considerably less because most of the appraisal work is already done and paid for. Those sites are the scarcest asset in this chain and are currently held by parties who value them at close to nothing at all. Options cost a fraction of a capture plant, and developers holding permitted pore space will set terms for everybody who does not.
03 / OPERATING DATA DISCLOSURE

Publish the real number before someone else does

Flagship projects reporting achieved capture near 78% against design rates in the nineties have damaged financing terms across the entire sector, and lenders now discount nameplate claims from every participant regardless of individual track record. A developer publishing actual availability, achieved rate and honest reasons for any shortfall converts a sector-wide credibility problem into genuine differentiation. It costs one uncomfortable disclosure decision, nobody in the sector has yet made it, and the first participant to do so will be rewarded for it.
04 / HUB CONNECTION SELLING

Sell schedule certainty, not storage capacity

Some 63% of contracted capacity now depends on shared transport and storage, because individual storage development costs more and takes far longer than any single emitter can reasonably justify on its own. A hub operator is therefore selling a connection date rather than infrastructure, and the emitter is buying schedule certainty rather than tonnes of theoretical capacity underground. That reframing reaches a different function with a different budget, and hub operators presenting capacity tables to engineers are addressing the wrong person.

Engagement Snapshot From the Field

A live engagement with an industry participant carrying material or product regulatory and market exposure ahead of a defining policy shift, showing how our research translates into a defensible multi-year portfolio strategy.
MARKET MINDS ADVISORY · CLIENT ENGAGEMENT SUMMARY
Carbon Capture and Storage (CCS) Producer Strategic Portfolio Review and Transition Roadmap 2026·Investment Scenario on Carbon Capture and Storage (CCS) Exposure Evaluation 2025-26
CLIENT PROFILE
A European industrial group operating cement, lime and chemical assets across six countries, facing emissions trading exposure across roughly nine million tonnes annually and holding board approval to develop a carbon capture programme without any clear view of where to start (client-reported, unverified by MMA). Three feasibility studies had already been completed and none had reached a decision.
STRATEGIC CHALLENGE
Emissions trading costs were rising against assets the group could not decarbonise through energy substitution, because most of the carbon dioxide came from process chemistry rather than from fuel. Management needed to know which sites to develop first, whether to build storage or connect to a hub, and how much of the case depended on policy that could reverse.
MMA APPROACH
MMA modelled capture cost per tonne at every site against flue gas concentration, available waste heat and distance to announced storage infrastructure, producing a ranked development sequence rather than a technology recommendation. Forty-seven expert interviews with hub operators, storage developers, regulators, technology licensors and project lenders established what could be connected, what could be permitted and what could actually be financed.
KEY FINDINGS
  1. Capture cost across the group's 11 sites varied by a factor of 3, driven almost entirely by flue gas concentration and available waste heat rather than plant size.
  2. Only 4 sites sat within economic pipeline distance of announced storage hubs, and those 4 were not the sites the group had studied first.
  3. Independent storage development would add roughly 8 years and a capital requirement the group could not possibly fund alongside its own capture programme.
  4. Lenders interviewed would finance hub-connected projects and would not finance any project at all depending on storage the group had to permit for itself.
CLIENT PROFILE
A European industrial group operating cement, lime and chemical assets across six countries, facing emissions trading exposure across roughly nine million tonnes annually and holding board approval to develop a carbon capture programme without any clear view of where to start (client-reported, unverified by MMA). Three feasibility studies had already been completed and none had reached a decision.
STRATEGIC CHALLENGE
Emissions trading costs were rising against assets the group could not decarbonise through energy substitution, because most of the carbon dioxide came from process chemistry rather than from fuel. Management needed to know which sites to develop first, whether to build storage or connect to a hub, and how much of the case depended on policy that could reverse.
MMA APPROACH
MMA modelled capture cost per tonne at every site against flue gas concentration, available waste heat and distance to announced storage infrastructure, producing a ranked development sequence rather than a technology recommendation. Forty-seven expert interviews with hub operators, storage developers, regulators, technology licensors and project lenders established what could be connected, what could be permitted and what could actually be financed.
KEY FINDINGS
  1. Capture cost across the group's 11 sites varied by a factor of 3, driven almost entirely by flue gas concentration and available waste heat rather than plant size.
  2. Only 4 sites sat within economic pipeline distance of announced storage hubs, and those 4 were not the sites the group had studied first.
  3. Independent storage development would add roughly 8 years and a capital requirement the group could not possibly fund alongside its own capture programme.
  4. Lenders interviewed would finance hub-connected projects and would not finance any project at all depending on storage the group had to permit for itself.
RECOMMENDED STRATEGY
Phase 1: Phase one: develop the 4 hub-connected sites in order of capture cost per tonne, and stop all work on independent storage development entirely. Phase 2: Phase two: negotiate hub connection agreements now while capacity remains uncontracted, since connection slots are allocated well before any construction begins. Phase 3: Phase three: design waste heat integration into every capture island from the outset, since retrofitting it afterwards is prohibitively expensive.
OUTCOME
Within five quarters the group held connection agreements at two hubs covering four sites and had taken a final investment decision on the first (client-reported, unverified by MMA). The three previously completed feasibility studies covered sites that remain undeveloped. Independent storage development was abandoned entirely.

Frequently Asked Questions

Foundational context covering the market sizes, CAGR, scope, country, region and competition that inform every finding below. This section is provided to cover basics and most often pre-purchase conversations, answered from the MMA Primary Research Dataset.

What is the current size of the Carbon Capture and Storage (CCS) Market?

The global carbon capture and storage market was valued at USD 8.4 billion in 2025, covering capture from industrial point sources with transport and geological storage. The 2026 figure reaches USD 9.37 billion.

How large will the Carbon Capture and Storage (CCS) Market be by 2036?

MMA forecasts USD 28.08 billion by 2036, an increase of USD 18.71 billion over the 2026 base. That represents an expansion multiple of 3.00 times across the forecast period.

What is the CAGR for the Carbon Capture and Storage (CCS) Market 2026 to 2036?

The base case compound annual growth rate is 11.6%, with a bull case at 12.9% and a bear case at 10.3%. Historical growth between 2020 and 2025 ran at 10.2%.

Which segment is growing fastest?

Hydrogen and ammonia production capture grows at 17.4%, half again the market rate of 11.6%, because the carbon dioxide arrives already separated. Cement and lime follows at 15.2%.

Who are the major companies in the Carbon Capture and Storage (CCS) Market?

SLB, Mitsubishi Heavy Industries, Linde, Air Liquide and Baker Hughes lead on contracted capture capacity, with combined CR5 of 34%. Concentration is low because no participant holds the whole chain.

Which country is growing fastest?

Australia grows fastest at 13.9%, holding operating storage at Gorgon and Moomba plus hub proposals to import carbon dioxide from Japan and Korea. South Asia and Pacific leads regionally at 13.9%.

Report Segmentation Architecture

The full report scope spans multiple orthogonal segmentation dimensions, with cross-tabulated demand data provided for each dimension pair. Coverage extends further to regional breakdowns, trend trajectories, and the competitive detail needed to support segment-level decision-making.

By Emission Source

  • Natural Gas Processing and LNG
  • Hydrogen and Ammonia Production
  • Cement and Lime Manufacturing
  • Iron, Steel and Metals
  • Power Generation
  • Refining and Chemicals

By End-Use Industry

  • Heavy Industry Compliance
  • Low-Carbon Fuel Production
  • Power Sector Decarbonisation
  • Oil and Gas Operations
  • Waste to Energy Facilities
  • Industrial Cluster Programmes

By Commercial Dimension

  • Technology Licensing Agreements
  • Engineering and Construction Contracts
  • Hub Connection Agreements
  • Storage Tariff Contracts
  • Monitoring and Verification Services
  • Capture as a Service Models

By Region

  • North America
  • Western Europe
  • East Asia
  • South Asia and Pacific
  • Latin America
  • Middle East and Africa
  • Eastern Europe

Scope, Methodology, and Coverage

Every figure in this report is reproducible from documented input assumptions. The scope below maps the historical period, the forecast horizon, the segmentation dimensions, and the countries covered, alongside the underlying primary and qualitative methodology.
Historical Period
2020 to 2025
Forecast Period
2026 to 2036
Base Year
2025 (USD billions; MMA Primary Research Dataset, August 2026)
Market Definition
The carbon capture and storage market covers the capture of carbon dioxide from industrial and energy point sources, its conditioning and transport, and its permanent geological storage, segmented by the emission source captured across natural gas processing and LNG, hydrogen and ammonia production, cement and lime manufacturing, iron, steel and metals, power generation, and refining and chemicals. Scope is measured as contracted and operating capture capacity with the associated transport and storage revenue. Excluded are direct air capture, carbon dioxide utilisation into products, enhanced recovery where storage is not permanently certified, biological sequestration, and emissions trading instruments.
Quantitative Units
USD billion, 2025 base year, 2026 to 2036 forecast period
Segmentation Dimensions
Emission source, end-use application, commercial model, region
Regions Covered
North America, Western Europe, East Asia, South Asia and Pacific, Latin America, Middle East and Africa, Eastern Europe
Countries Covered
United States, Canada, Norway, United Kingdom, Netherlands, Germany, Denmark, Poland, China, Japan, South Korea, India, Australia, Brazil, Mexico, Saudi Arabia, United Arab Emirates, Qatar
Key Companies Profiled
20 companies across technology licensors, engineering contractors and storage developers
Quantitative Methodology
Primary survey, n=3,800 respondents, Q4 2025, six countries; demand-side model with trade association cross-validation
Qualitative Methodology
47 expert interviews, Q4 2025; applied to validate demand model assumptions, identify emerging dynamics, and assess competitive positioning
Report Format
PDF and XLSX data workbook (Word format preview document)
Publisher
Market Minds Advisory
Report Code
MMA-2026-ENE-341
Published
August 2026
Contact
sales@marketmindsadvisory.com | www.marketmindsadvisory.com

Purchase the full Carbon Capture and Storage (CCS) Market Report (2026 to 2036).

The full MMA report on the carbon capture and storage market runs to detailed source and regional models across the 2026 to 2036 forecast period, with capture cost benchmarks separated by flue gas concentration and heat integration route. It profiles 20 companies on a consistent contracted capture capacity basis, covering technology licensors, engineering contractors and storage developers. Storage permitting timelines and hub connection availability are mapped by jurisdiction against the announced project pipeline. Regional chapters cover the seven MMA regions with country-level detail on the eighteen markets surveyed. Primary research draws on a quantitative survey of 3,800 respondents across six countries and 47 expert interviews conducted in Q4 2025.
Capture cost benchmarks by flue gas concentration and integration
Storage permitting timelines mapped across eighteen surveyed jurisdictions
Achieved versus design capture rates on operating installations
Twenty company profiles on consistent contracted capacity basis
Hub connection availability assessed against announced project pipeline
Seven regional chapters with eighteen country detail tables

Built For The People Who Decide

From boardroom strategy to bench-side execution, this report is read cover-to-cover by leaders shaping the next decade of their industry, turning demand scenarios, market dynamics and valuation benchmarks into decisions.
CXOs/ Presidents/ VPs/ Managers
M&A and Corporate Development
Strategy Teams and R&D Heads
Procurement and Product Directors
Regulatory and Compliance Leaders
Investor Relations and Equity Analysts