Market Minds Advisory
Carbon-Aware Cloud Workload Scheduling Market

Carbon-Aware Cloud Workload Scheduling Market: Carbon-Aware Cloud Workload Scheduling: Grid Signals, Shiftable Compute and the Narrow Slice Where Emissions Timing Actually Pays

Only a fifth of cloud compute can genuinely move in time or place, and shifting it often raises the bill, which is why disclosure obligations fund almost every deployment here.

Lead Analyst

Published

September 2026

Make Smarter Decisions with Customized Research Insights

Request a free sample report and evaluate market opportunities, growth trends, and competitive dynamics relevant to your business needs.

2025 MARKET VALUE$0.3BMarket Size 2025
2036 FORECAST VALUE$1.5BBase Case , 2026 to 2036
CAGR 2026 TO 203615.4 %Bull 16.6% / Bear 14.2%
INCREMENTAL OPPORTUNITY$1.1BNet 10- year value creation
EXPANSION MULTIPLE4.20x2036 value over 2026 base
Strategic Levers
M&A Pipeline
Regional Outlook
Country Rankings
Competitive Intelligence
Segmental Deep-dive
Call-Us : 91 93563 13602

Executive Snapshot and Market Trajectory.

The technique works and the addressable slice is small. Roughly 18% of cloud compute can be moved in time or geography without breaking something, and the rest is latency-bound, data-resident or simply running because a customer is waiting for it. Vendors who implied otherwise lost technical buyers early.
That constraint shapes everything commercial about this market. The fastest growth sits in grid carbon intensity signals and forecasting at 23.1%, half again the market rate of 15.4%, because every scheduler needs the data and almost nobody wants to produce it themselves. Western Europe takes 34% of spending on the back of mandatory disclosure and unusually variable grids. Ireland grows faster than any country covered here. Transmission constraints made flexibility a condition of connecting.
Competition is fragmented, with the top five holding roughly 34% on measured software and data subscription revenue. The awkward commercial fact is that hyperscalers give away much of the measurement capability as a platform feature, which caps what independent vendors can charge for it. Around 71% of purchases are driven by a reporting obligation rather than by any efficiency case. Efficiency arguments alone close very few deals.
Market Definition
This market covers software and data services that schedule, place or shape cloud and data centre compute according to electricity grid carbon intensity, including temporal shifting, regional placement, grid signal and forecasting services, cloud emissions accounting, demand response integration and software carbon efficiency tooling. Revenue is measured as subscription and attributable services. Corporate carbon accounting suites without compute scheduling capability, energy management hardware, power purchase agreement brokerage and general cloud cost optimisation are excluded.
Base Year Value
$0.3B in 2025 (MMA Primary Research Dataset, September 2026)
Forecast Period
2026 to 2036, eleven discrete annual values
CAGR
15.4% base case. Bull 16.6%. Bear 14.2%.
Fastest Growth Segment
Grid Carbon Intensity Signal and Forecasting: 23.1% CAGR
Fastest Growth Country
Ireland: 21.4% CAGR
Fastest Growth Region
South Asia and Pacific: 17.6% CAGR
Largest Region
Western Europe: 34% of 2025 global value
Market Leaders
Schneider Electric, IBM, SAP, Electricity Maps and WattTime lead on measured carbon-aware scheduling and cloud emissions subscription revenue. Source: MMA Primary Research Dataset, July 2026.
Primary Survey
n=3,800 procurement and R&D decision-makers, Q4 2025, six countries
Methodology
Demand-side build-up, cross-validated against public data, 47 expert interviews

Carbon-Aware Cloud Workload Scheduling Market Forecast Scenarios

carbon-aware-cloud-workload-scheduling-market-size-forecast-scenario-1788417752940
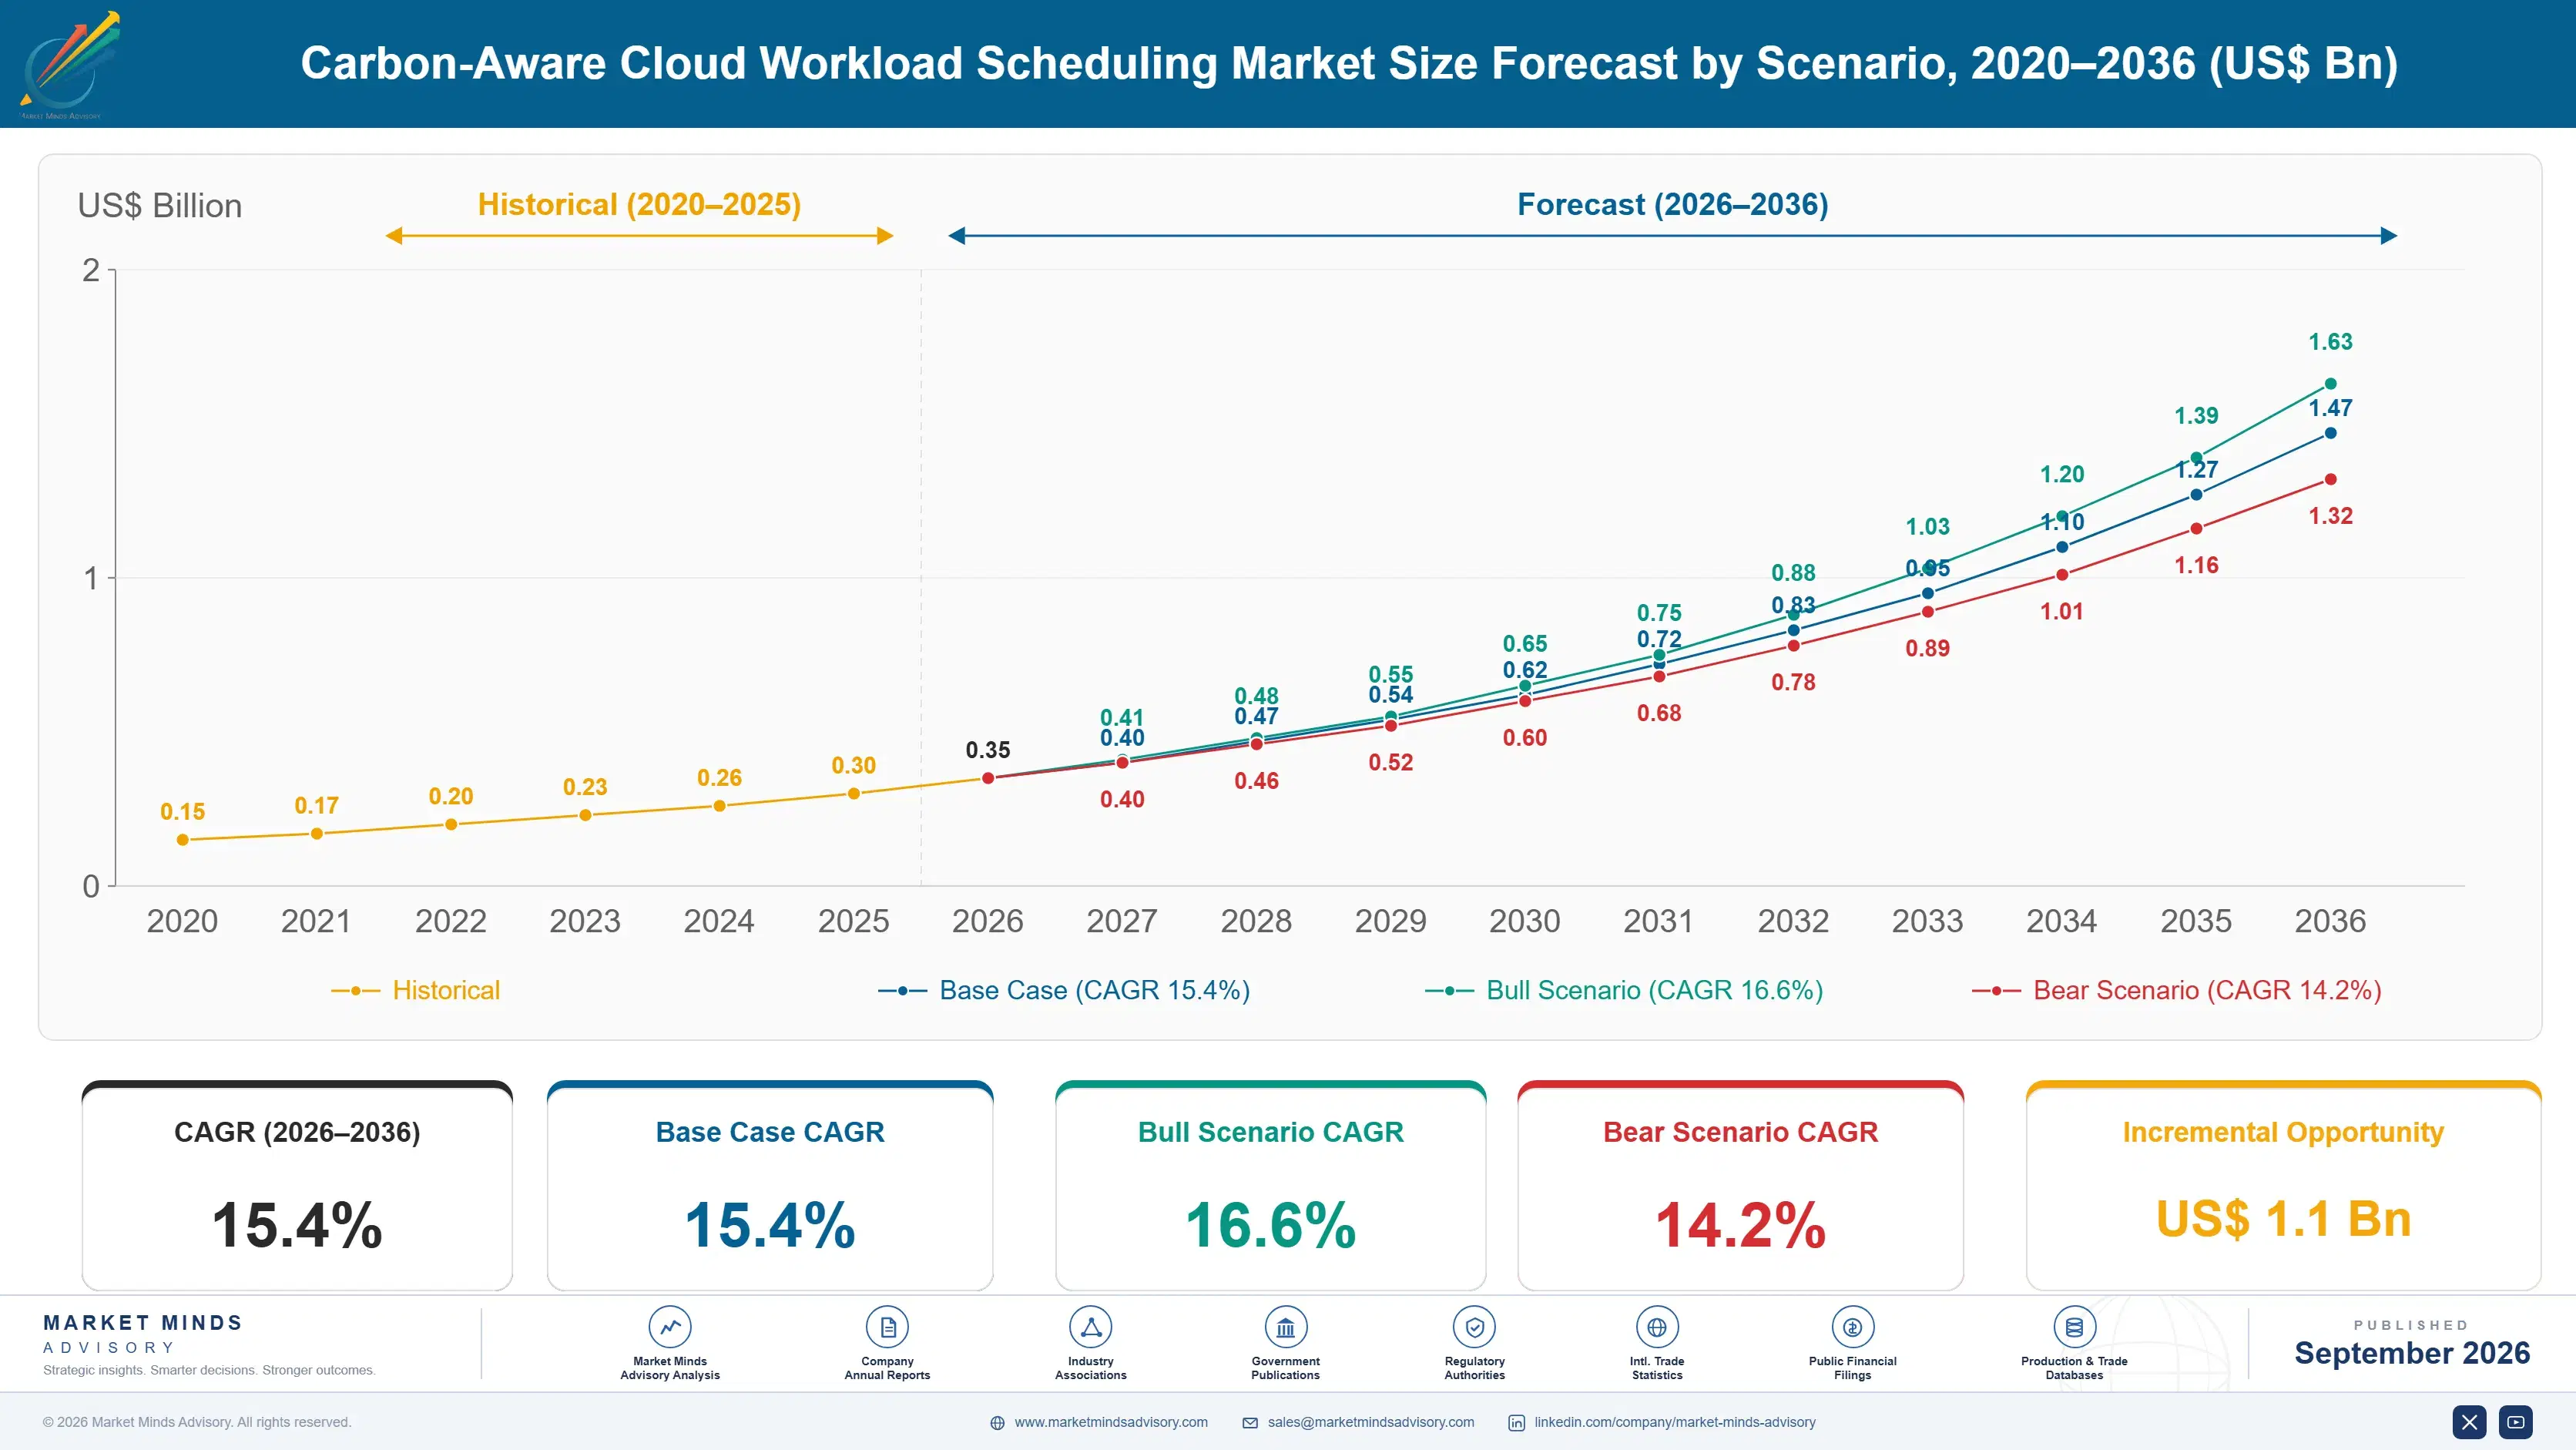
Growth from 2020 to 2025 ran at 14.0% and came almost entirely from measurement rather than from scheduling. Enterprises bought cloud emissions accounting because auditors and sustainability reports required a number, and very few of them acted on it afterwards. The scheduling products that did ship were mostly open-source projects and hyperscaler features rather than commercial software, which is why revenue lagged the attention this topic received.
The base case at 15.4% rests on three mechanisms. European disclosure rules now require reported emissions at a granularity that generic estimates cannot satisfy, which makes measurement audited rather than voluntary. Grid connection conditions for data centres in constrained markets increasingly require demonstrable demand flexibility, which makes scheduling an operating requirement rather than a sustainability choice. Third, AI training workloads are large, batch-shaped and genuinely shiftable, which finally gives the technique meaningful volume to work with.
The bull case at 16.6% depends on grid operators paying for data centre flexibility at rates that make shifting profitable rather than merely virtuous. The bear case at 14.2% is that AI capacity scarcity keeps operators running everything they can whenever they can. Carbon timing loses to utilisation whenever accelerators are the constraint. Utilisation wins that argument.

Timing Compute to the Grid Has a Narrow Window

The physics is genuinely favourable. Grid carbon intensity on a typical European or North American system swings by more than 60% between the cleanest and dirtiest hours of a day, so running a batch job at three in the morning rather than six in the evening can halve its emissions without a code change. That is why the idea attracted so much engineering attention.
TOP FIVE CONCENTRATION34%Fragmented field split between infrastructure vendors and data specialists
SHIFTABLE WORKLOAD SHARE18%Portion of cloud compute that can actually move
CARBON INTENSITY SWING62%Difference between cleanest and dirtiest hours on typical grids
COST PENALTY FREQUENCY44%Share of shift decisions that raise the cloud bill
DISCLOSURE DRIVEN PURCHASES71%Buyers acting on a reporting obligation rather than ambition
AVERAGE ANNUAL CONTRACTUSD 84,000Typical enterprise subscription across platform and data components
The commercial problem is that very little compute can take advantage of it. Interactive services must answer now. Databases sit where their data sits. Regulated workloads cannot cross borders. What remains is batch: model training, continuous integration, data pipelines, transcoding, backup and analytics, together roughly 18% of cloud compute. That slice is worth addressing but it is not the whole cloud.
There is a second complication that vendors discuss less. Cheap electricity and clean electricity are correlated but not identical, and spot instance pricing follows capacity rather than carbon. Roughly 44% of carbon-optimal shift decisions raise the cloud bill. Finance functions notice, which is why the purchases that close are attached to a disclosure obligation or connection condition rather than a savings argument.
"The engineering community fell in love with this idea and then discovered that the finance function has to approve it. Carbon-aware scheduling sells where somebody is legally obliged to report a number or physically obliged to shed load, and almost nowhere else."
Principal Analyst, Cloud Infrastructure and Sustainability Practice · MMA Technology Practice · September 2026

Market Trends

AI Training Finally Supplies Genuinely Shiftable Volume

For most of this category's short history the shiftable workload pool was too small to interest anyone. Large model training changed that: runs are long, batch-shaped, tolerant of scheduling latency and enormous in power terms, which is exactly the profile carbon-aware scheduling was built for. Several operators now schedule checkpointed training around grid conditions across regions. The countervailing force is accelerator scarcity, since an idle cluster costs far more than the carbon saved, and that tension is currently resolved in favour of utilisation almost everywhere it arises. That balance will hold while capacity stays tight.
Market Impact: Applies to 2 separate reporting regimes
Hyperscalers Absorb Measurement Into Free Platform Features

Cloud emissions dashboards, regional carbon data and basic reporting now ship as included platform capability from all three major providers, which removed the entry-level commercial opportunity that many vendors were built around. What remains chargeable is cross-provider consolidation, marginal emissions signals rather than average grid factors, audit-grade methodology and actual scheduling control. Vendors that positioned as measurement tools have repositioned or been acquired. The pattern is familiar from cloud cost management, where the same absorption happened over roughly the same period and with the same commercial consequences. Positioning below the platform line is not survivable.
Market Impact: Conditions affect 6 constrained markets

Market Opportunities and Growth Drivers

European Disclosure Rules Demand Granular Reported Emissions

Sustainability reporting obligations under European rules require reported figures that stand up to assurance, and generic annual grid averages applied to a cloud bill do not. Companies with material cloud footprints have discovered that their auditors want methodology, temporal granularity and evidence of provider data rather than an estimate. That converts cloud emissions measurement from a voluntary internal exercise into an audited disclosure input with a named owner and a budget. The European data centre energy reporting scheme adds a parallel obligation on operators themselves, with defined reporting fields. Both regimes carry named owners inside the business.
Market Impact: Raises cost in 44% of decisions

Grid Connection Conditions Require Demonstrable Demand Flexibility

In constrained markets, transmission operators have started attaching flexibility conditions to new data centre connections, requiring the site to reduce or shift load on request rather than simply consuming what it contracted for. Ireland is the clearest case and the reason it grows at 21.4%, faster than any country covered here, but Dutch, Danish and several American utility territories have moved in similar directions. This turns workload scheduling into an operating requirement tied to the right to connect, which is a far stronger commercial driver than emissions reporting ever was.
Market Impact: Removes 40% of addressable load

Market Restraints and Challenges

Carbon-Optimal Scheduling Frequently Raises Cloud Cost

Roughly 44% of carbon-optimal shift decisions increase the bill, because spot capacity pricing tracks demand and availability rather than grid emissions and the two only sometimes align. The root cause is that cloud pricing was never designed to signal carbon and providers have little incentive to change that. Commercially this puts the sustainability team in conflict with the finance function on every deployment, and finance usually wins. Vendors are mitigating by optimising jointly for cost and carbon with a configurable ceiling on cost increase, which closes deals that pure carbon optimisation cannot.
Market Impact: Training covers 40% of shiftable load

Accelerator Scarcity Overrides Every Carbon Consideration

When graphics processing capacity is the binding constraint, an idle accelerator costs far more per hour than the carbon it would have avoided, so operators run continuously and schedule around availability rather than emissions. The root cause is straightforward supply economics and it will persist while capacity remains tight. This removes the single largest shiftable workload pool from practical addressability for as long as the shortage lasts. Vendors are focusing instead on placement decisions at job submission, which cost nothing in utilisation terms and still capture meaningful emissions differences. Placement decisions are the practical fallback while the shortage persists.
Market Impact: Free features cover 3 major platforms
3 additional market trends, 4 additional growth drivers, and 2 additional restraints and challenges are covered in the full report. Contact sales@marketmindsadvisory.com to access the complete intelligence.

Segment CAGR and Growth Architecture

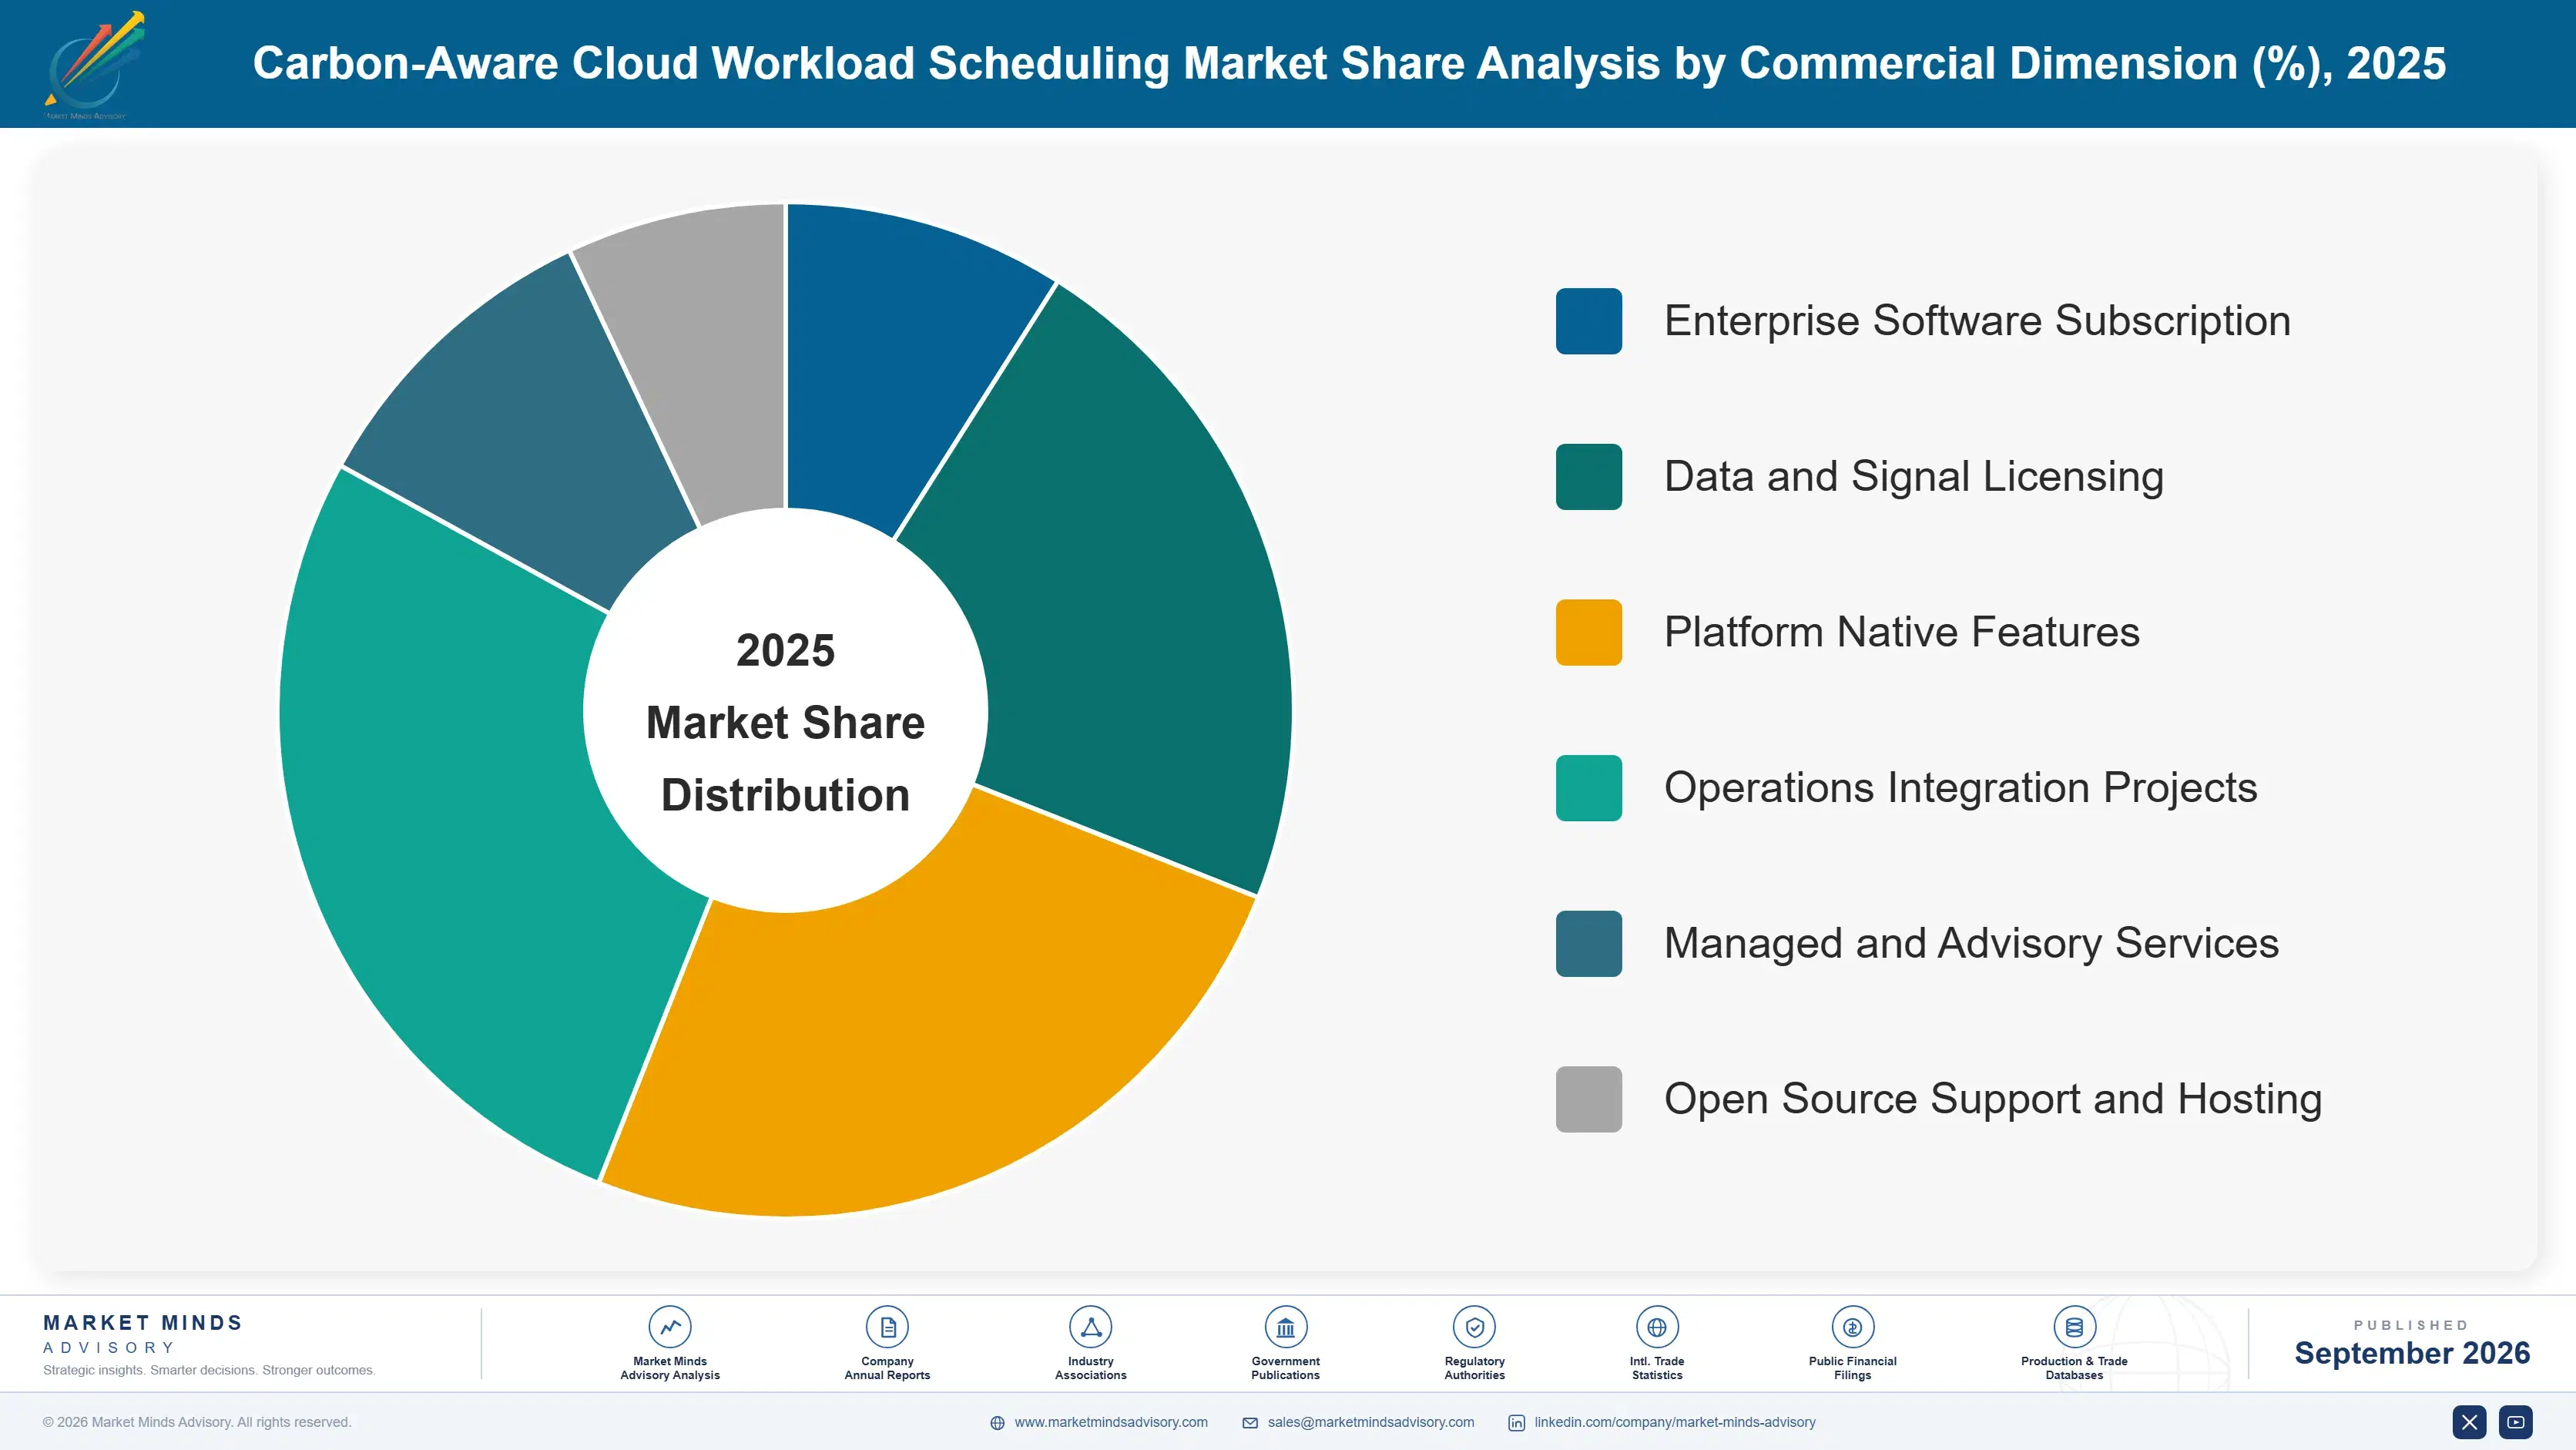
Segmentation follows the capability being sold, because each one reaches a different budget holder and carries different competitive exposure to free platform features. Data and signal services behave quite differently from scheduling control software, and the layer closest to the grid has proved the most defensible commercially by a considerable margin. Free platform features decide much of it.
carbon-aware-cloud-workload-scheduling-market-market-share-analysis-1788417753475

Grid Carbon Intensity Signal and Forecasting

Signal and forecasting services are the fastest part of this market at 23.1%, half again the market rate of 15.4%, and the most defensible layer in it. Every scheduler, dashboard and reporting tool needs grid intensity data, marginal emissions modelling and short-horizon forecasts, and building that capability requires power system modelling skills that software teams do not have. Buyers include the scheduling vendors themselves, which makes this an infrastructure position rather than an application one. Audit expectations have moved toward marginal rather than average factors, which raises the modelling bar and further protects the small number of firms that can meet it credibly. Coverage breadth rather than product depth is what buyers compare here.
CAGR 23.1%

Data Centre Demand Response Integration

Demand response integration connects workload scheduling to grid operator signals and market programmes, allowing a site to curtail or shift load in response to a dispatch instruction or price event. Growth at 19.4% is driven by connection conditions in constrained markets rather than by emissions ambition, which makes it unusually durable demand. The buyer is a data centre operations function with a grid obligation, not a sustainability team with a target. Revenue per site is far higher than enterprise scheduling subscriptions, and the work involves genuine engineering integration with building management and power systems rather than software configuration alone. Contracts run alongside the connection agreement itself, which makes them unusually durable. Renewal is rarely questioned.
CAGR 19.4%
Full segment breakdown across 6 segments available in the complete report.

Regional Architecture and Country Demand Map

Regional demand follows disclosure obligation and grid constraint rather than cloud spending. Markets with mandatory reporting, variable renewable generation and congested transmission buy heavily; markets with abundant firm capacity and voluntary reporting largely do not, whatever their compute volumes. Compute volume predicts very little on its own.

Western Europe

Europe holds 34%, above the regional band, and two mechanisms explain it rather than any general sustainability preference. Mandatory sustainability disclosure requires assured emissions figures at a granularity that generic estimates cannot support, and the separate data centre energy reporting scheme obliges operators to file defined energy and efficiency data. Grid conditions reinforce it: Irish, Danish, Dutch and German systems carry high renewable variability and congested transmission, so intensity swings are large and connection conditions are demanding. Ireland is the fastest-growing country market anywhere at 21.4%, driven by transmission constraints that made flexibility a condition of connecting new capacity at all. Nordic operators buy less than their reputation suggests, since already clean grids weaken the timing argument considerably.
Share: 34% | CAGR: 13.8% (2026 to 2036)

North America

American demand is driven by hyperscale and colocation operators rather than by enterprise cloud customers, and it is concentrated in a handful of utility territories where interconnection queues and capacity constraints have made flexibility commercially valuable. Californian disclosure legislation has created a genuine reporting obligation for large companies operating in the state. Texan and Mid-Atlantic markets pay for demand response participation at rates that make load shifting profitable on its own terms, which is rare. Canadian demand is smaller and tied to provincial grids that are already low carbon, which weakens the emissions argument considerably even where reporting obligations exist. Enterprise buyers elsewhere purchase measurement rather than scheduling, which caps regional contract values.
Share: 31% | CAGR: 14.6% (2026 to 2036)
Regional intelligence for 5 additional markets available in the complete report: East Asia, South Asia and Pacific, Latin America, Middle East and Africa, Eastern Europe. Contact sales@marketmindsadvisory.com.
carbon-aware-cloud-workload-scheduling-market-country-cagr-analysis-1788417754002

Where This Category Can Charge Properly

Free hyperscaler measurement features have removed the obvious entry-level product, so pricing has to sit where platform vendors will not go: marginal emissions modelling, audit-grade methodology, cross-provider consolidation and physical integration with grid operations. Anything a cloud console does adequately cannot be sold twice. That principle rules out most of the obvious product ideas immediately.

Sell Marginal Signals Not Average Grid Factors

Average intensity data is published and effectively free, while marginal emissions modelling requires power system expertise that almost no buyer will build internally. Vendors offering marginal signals with defensible methodology sustain price points roughly 4 times those achievable on average factor data, and auditors increasingly expect the marginal basis anyway. This is the most defensible layer in the category because the barrier is modelling capability rather than software engineering. It also positions the vendor as infrastructure to competitors, since scheduling products need the data regardless of who sells the scheduler.
Market Impact: Sustains roughly 4 times the average data pricing

Optimise Jointly for Cost and Carbon

Pure carbon optimisation raises the cloud bill in about 44% of decisions and puts the sustainability team in an argument with finance it usually loses. Vendors offering joint optimisation with a configurable ceiling on acceptable cost increase close deals that carbon-only products cannot, because the finance function approves rather than blocks. Deployments configured this way typically capture 60% of the available emissions reduction at neutral or slightly negative cost. That is a considerably better commercial proposition than a larger reduction nobody will authorise. Finance approves what it helped to configure itself.
Market Impact: Captures 60% of available reduction at neutral cost

Integrate With Grid Operations Not Just Cloud APIs

Software that talks only to cloud provider interfaces competes with free platform features. Software integrated with building management, power distribution and grid operator dispatch signals is doing engineering work that no cloud console will ever perform, and it is sold to a data centre operations budget rather than a sustainability one. Per-site values run around 8 times a typical enterprise software subscription. The integration work is slow and site-specific, which is precisely why it defends a position that application-layer products cannot. Reference sites take years to accumulate and cannot be bought. That is the barrier and the protection at once.
Market Impact: Commands roughly 8 times the enterprise subscription value

Attach Assurance Methodology to Every Reported Figure

The number an enterprise reports has to survive an assurance provider, and most buyers discover this only after they have bought a tool that cannot document how it calculated anything. Vendors shipping documented methodology, provider data lineage and auditor-ready evidence packs win replacement deals against incumbents at a rate around 3 times their share of new business. Assurance readiness is not a feature that demonstrates well, and it is the reason the second purchase in this category is usually a different vendor than the first. Buyers discover the gap during their first assurance cycle.
Market Impact: Wins replacement deals at 3 times current share

Who Controls the Margin Pool

Concentration sits near 34% across the top five on measured software and data subscription revenue, which is low and reflects a category still forming around several different value propositions. The gap between leaders and challengers is narrower than in most software markets, because leading positions rest on adjacent businesses rather than on anything specific to this category. Infrastructure vendors bring energy relationships, enterprise suites bring reporting workflow, and data specialists bring the one scarce capability.
Competition runs on three dimensions rather than on product features. The first is data credibility, meaning whether emissions figures survive assurance review, which decides more enterprise deals than scheduling capability does. The second is operations integration depth, where connecting to power systems and grid dispatch separates real products from interface wrappers. The third is cross-provider coverage, since most enterprises run several clouds and native tools do not consolidate.

Pressure comes from two directions simultaneously. Platform features keep expanding into what independent vendors charge for, which already removed the entry-level measurement business. Meanwhile cloud cost management vendors are adding carbon dimensions to existing products, arriving with installed bases pure-play vendors cannot match. Rankings will move toward whoever owns the marginal data layer or grid operations integration.
carbon-aware-cloud-workload-scheduling-market-company-positioning-matrix-1788417754527

Competitive Moat and Risk Dimensions

SCHNEIDER ELECTRIC

Moat: Power infrastructure and operations reach

Schneider reaches this market through the electrical infrastructure and building management systems that data centre operators already run, which puts it inside the operations budget rather than the sustainability one. That position makes grid dispatch and demand response integration a natural extension rather than a new capability. Established colocation and hyperscale relationships shorten procurement against software-only competitors.
SCHNEIDER ELECTRIC

Risk: Limited cloud native depth

The company's strength lies at the facility level rather than inside cloud workload orchestration, where scheduling decisions are made by engineering teams using container platforms. Reaching those teams requires software credibility that infrastructure heritage does not confer. Enterprise cloud customers without their own facilities represent a large share of the market this position does not address.
ELECTRICITY MAPS

Moat: Marginal emissions modelling capability

The company produces grid carbon intensity data including marginal signals across a wide set of systems, which requires power market modelling expertise software vendors underestimate. Because scheduling products and reporting tools all need this data, it occupies an infrastructure position and sells to competitors as readily as to end users. Audit expectations moving toward marginal factors strengthen that position.
ELECTRICITY MAPS

Risk: Narrow single layer exposure

Operating at the data layer means the company captures a fraction of the value created in deployments where scheduling and reporting products take the customer relationship. Its position depends on buyers continuing to prefer purchased data over building modelling capability internally, which large operators could reverse. Grid operators publishing marginal data directly would compress that space further.

Players Tracked

Prominent Players

Schneider Electric
IBM
SAP
Electricity Maps
WattTime

Other Key Players

Microsoft
Google
Amazon Web Services
ServiceNow
Flexera
CloudZero
Cast AI
Harness
Greenpixie
Climatiq
Watershed
Persefoni
Cycloid
Sweep
Normative

Recent Developments

MARCH 2025

Irish transmission operator tightens flexibility conditions on data centre connections

Revised connection arrangements require new large demand customers to demonstrate dispatchable load reduction capability before energisation, extending conditions that had previously applied to a narrower set of applicants. Existing connection holders face review at contract renewal rather than immediately. Applications already in progress were unaffected by the revision.
Signal: Grid connection conditions have become a stronger commercial driver in this category than emissions disclosure obligations are.
JULY 2025

SAP extends sustainability footprint management with compute emissions capability

The company added cloud and data centre emissions handling to its existing sustainability reporting product, developed internally rather than acquired. The extension targets European customers requiring assured figures under sustainability disclosure rules, and connects to existing financial reporting workflow. Existing sustainability customers were offered it as an upgrade.
Signal: Enterprise reporting suites are absorbing this capability, which squeezes standalone measurement vendors from the opposite direction to hyperscalers.
OCTOBER 2025

Cloud cost management vendors add carbon dimensions to optimisation products

Several established cloud financial management vendors released carbon reporting and joint cost and carbon optimisation capability, built on existing telemetry rather than through acquisition. The releases target the same finance and platform engineering buyers those products already serve across large multi-cloud estates. No acquisitions accompanied any of the releases.
Signal: Arriving with an installed base matters more here than product depth, and pure-play carbon vendors have no equivalent advantage.

What Delivering This Capability Costs

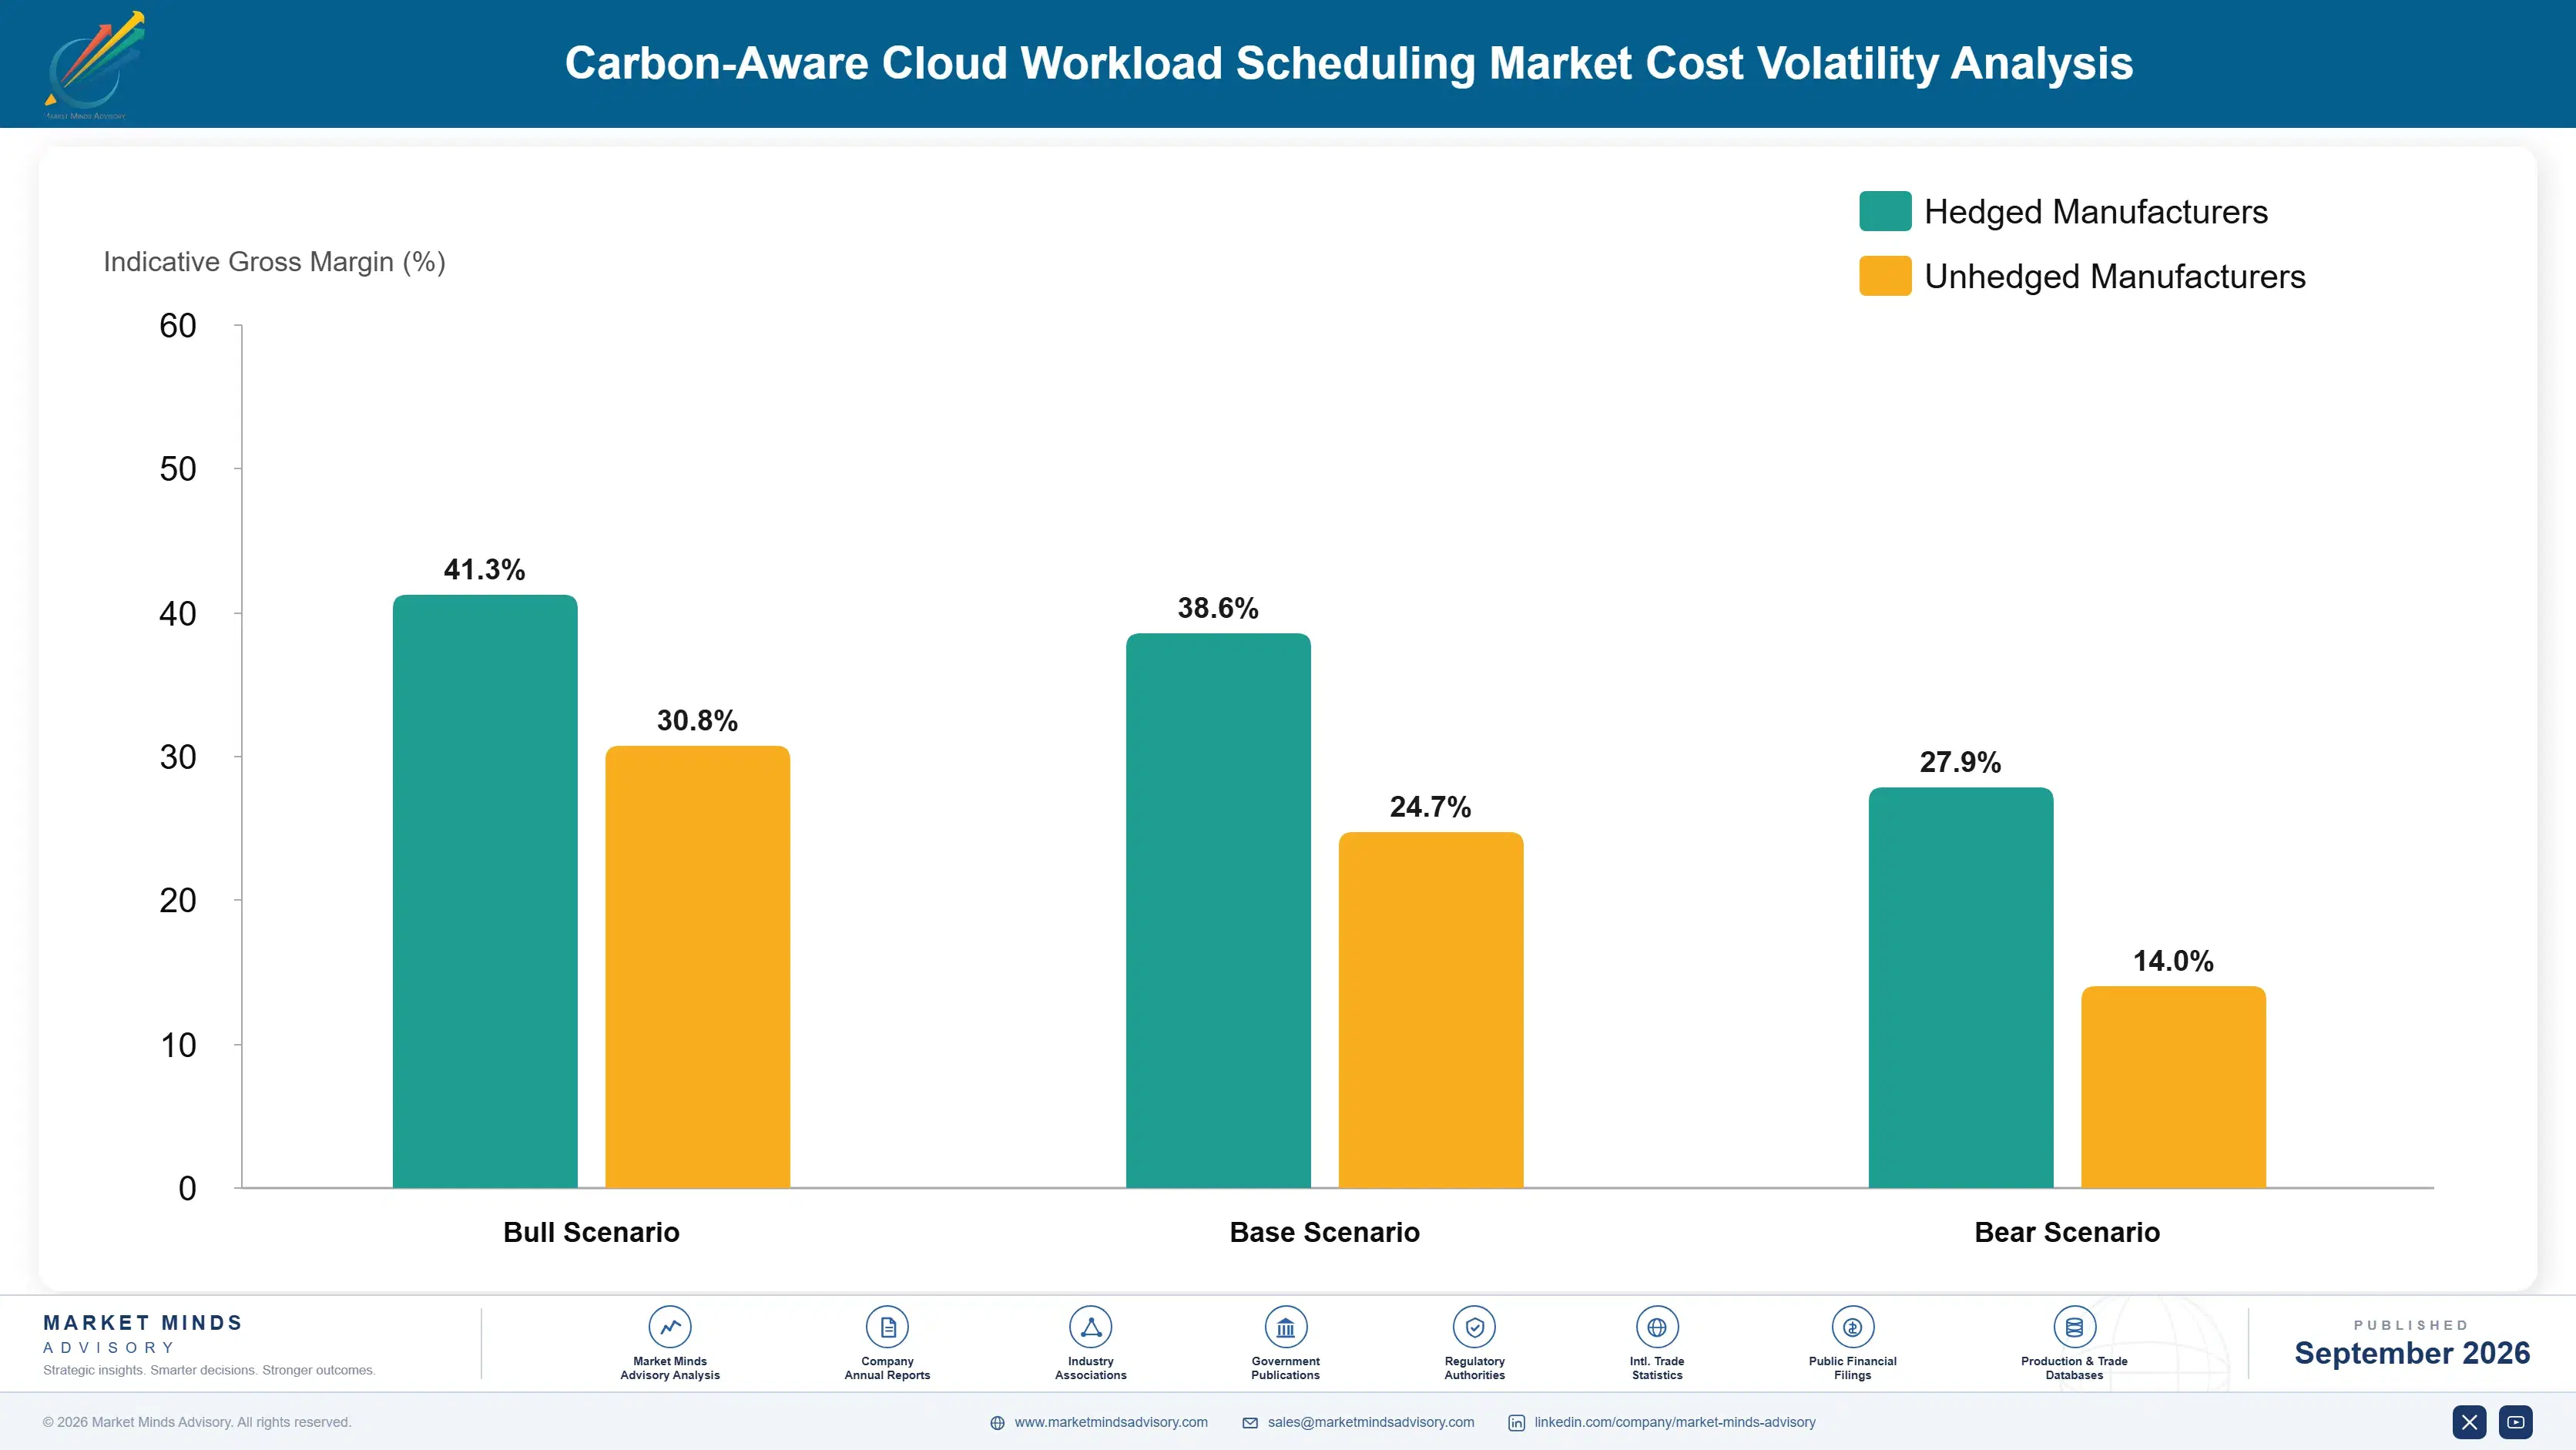
Cost structure divides sharply by layer. Data and signal businesses spend between 41% and 55% of cost on power system modelling, data acquisition and validation, a wide range reflecting grid coverage and whether marginal signals are produced. Application vendors spend less on data and more on integration engineering, roughly 34%, with hosting under 11%. Assurance methodology is a growing line for everyone selling into Europe.
The recent pressure has been on data acquisition rather than on technology. Grid operator data availability and licensing terms vary enormously by market, and several European and North American systems changed publication arrangements through 2024 and 2025, forcing vendors to rebuild feeds. IEA reporting on data centre electricity demand documented the rising policy attention that drove those changes. Coverage expansion costs rose for vendors committed to global coverage.

Exposure varies by position rather than by size. Data vendors carry acquisition and modelling cost across every market they cover, whether or not customers use those grids, which makes global coverage expensive to maintain. Application vendors buying data face a usage-scaled cost and a supplier who is often a competitor. Operations-integrated vendors carry per-site field engineering cost, the highest of the three and the most defensible.
carbon-aware-cloud-workload-scheduling-market-cost-volatility-analysis-1788417754723

Cover grids on demand rather than pre-emptively

Building modelled coverage for every grid ahead of demand consumes capital against markets that may never buy. Vendors adding coverage against contracted customer requirements cut sustaining cost by around 30% and reach profitability considerably earlier. The disadvantage is a slower response when a customer expands into a new territory, which sales teams dislike and which occasionally loses an evaluation.

Licence data rather than rebuilding modelling capability

Application vendors periodically decide to build their own grid modelling and almost always underestimate the power market expertise required. Licensing from a specialist converts a fixed investment into a usage-scaled cost and removes a hiring problem. The strategic concern is dependence on a supplier who also sells to competitors, which argues for contractual coverage commitments rather than internal building.

Standardise assurance evidence packs across customers

Every European customer needs documented methodology and data lineage for their assurance provider, and answering each request individually consumes senior technical time at the worst moment in the reporting cycle. A standardised evidence pack reviewed once with major assurance firms cuts that effort by roughly 65%. It also wins replacement deals, where incumbents often cannot produce equivalent documentation.

Portfolio Architecture for Margin Defence

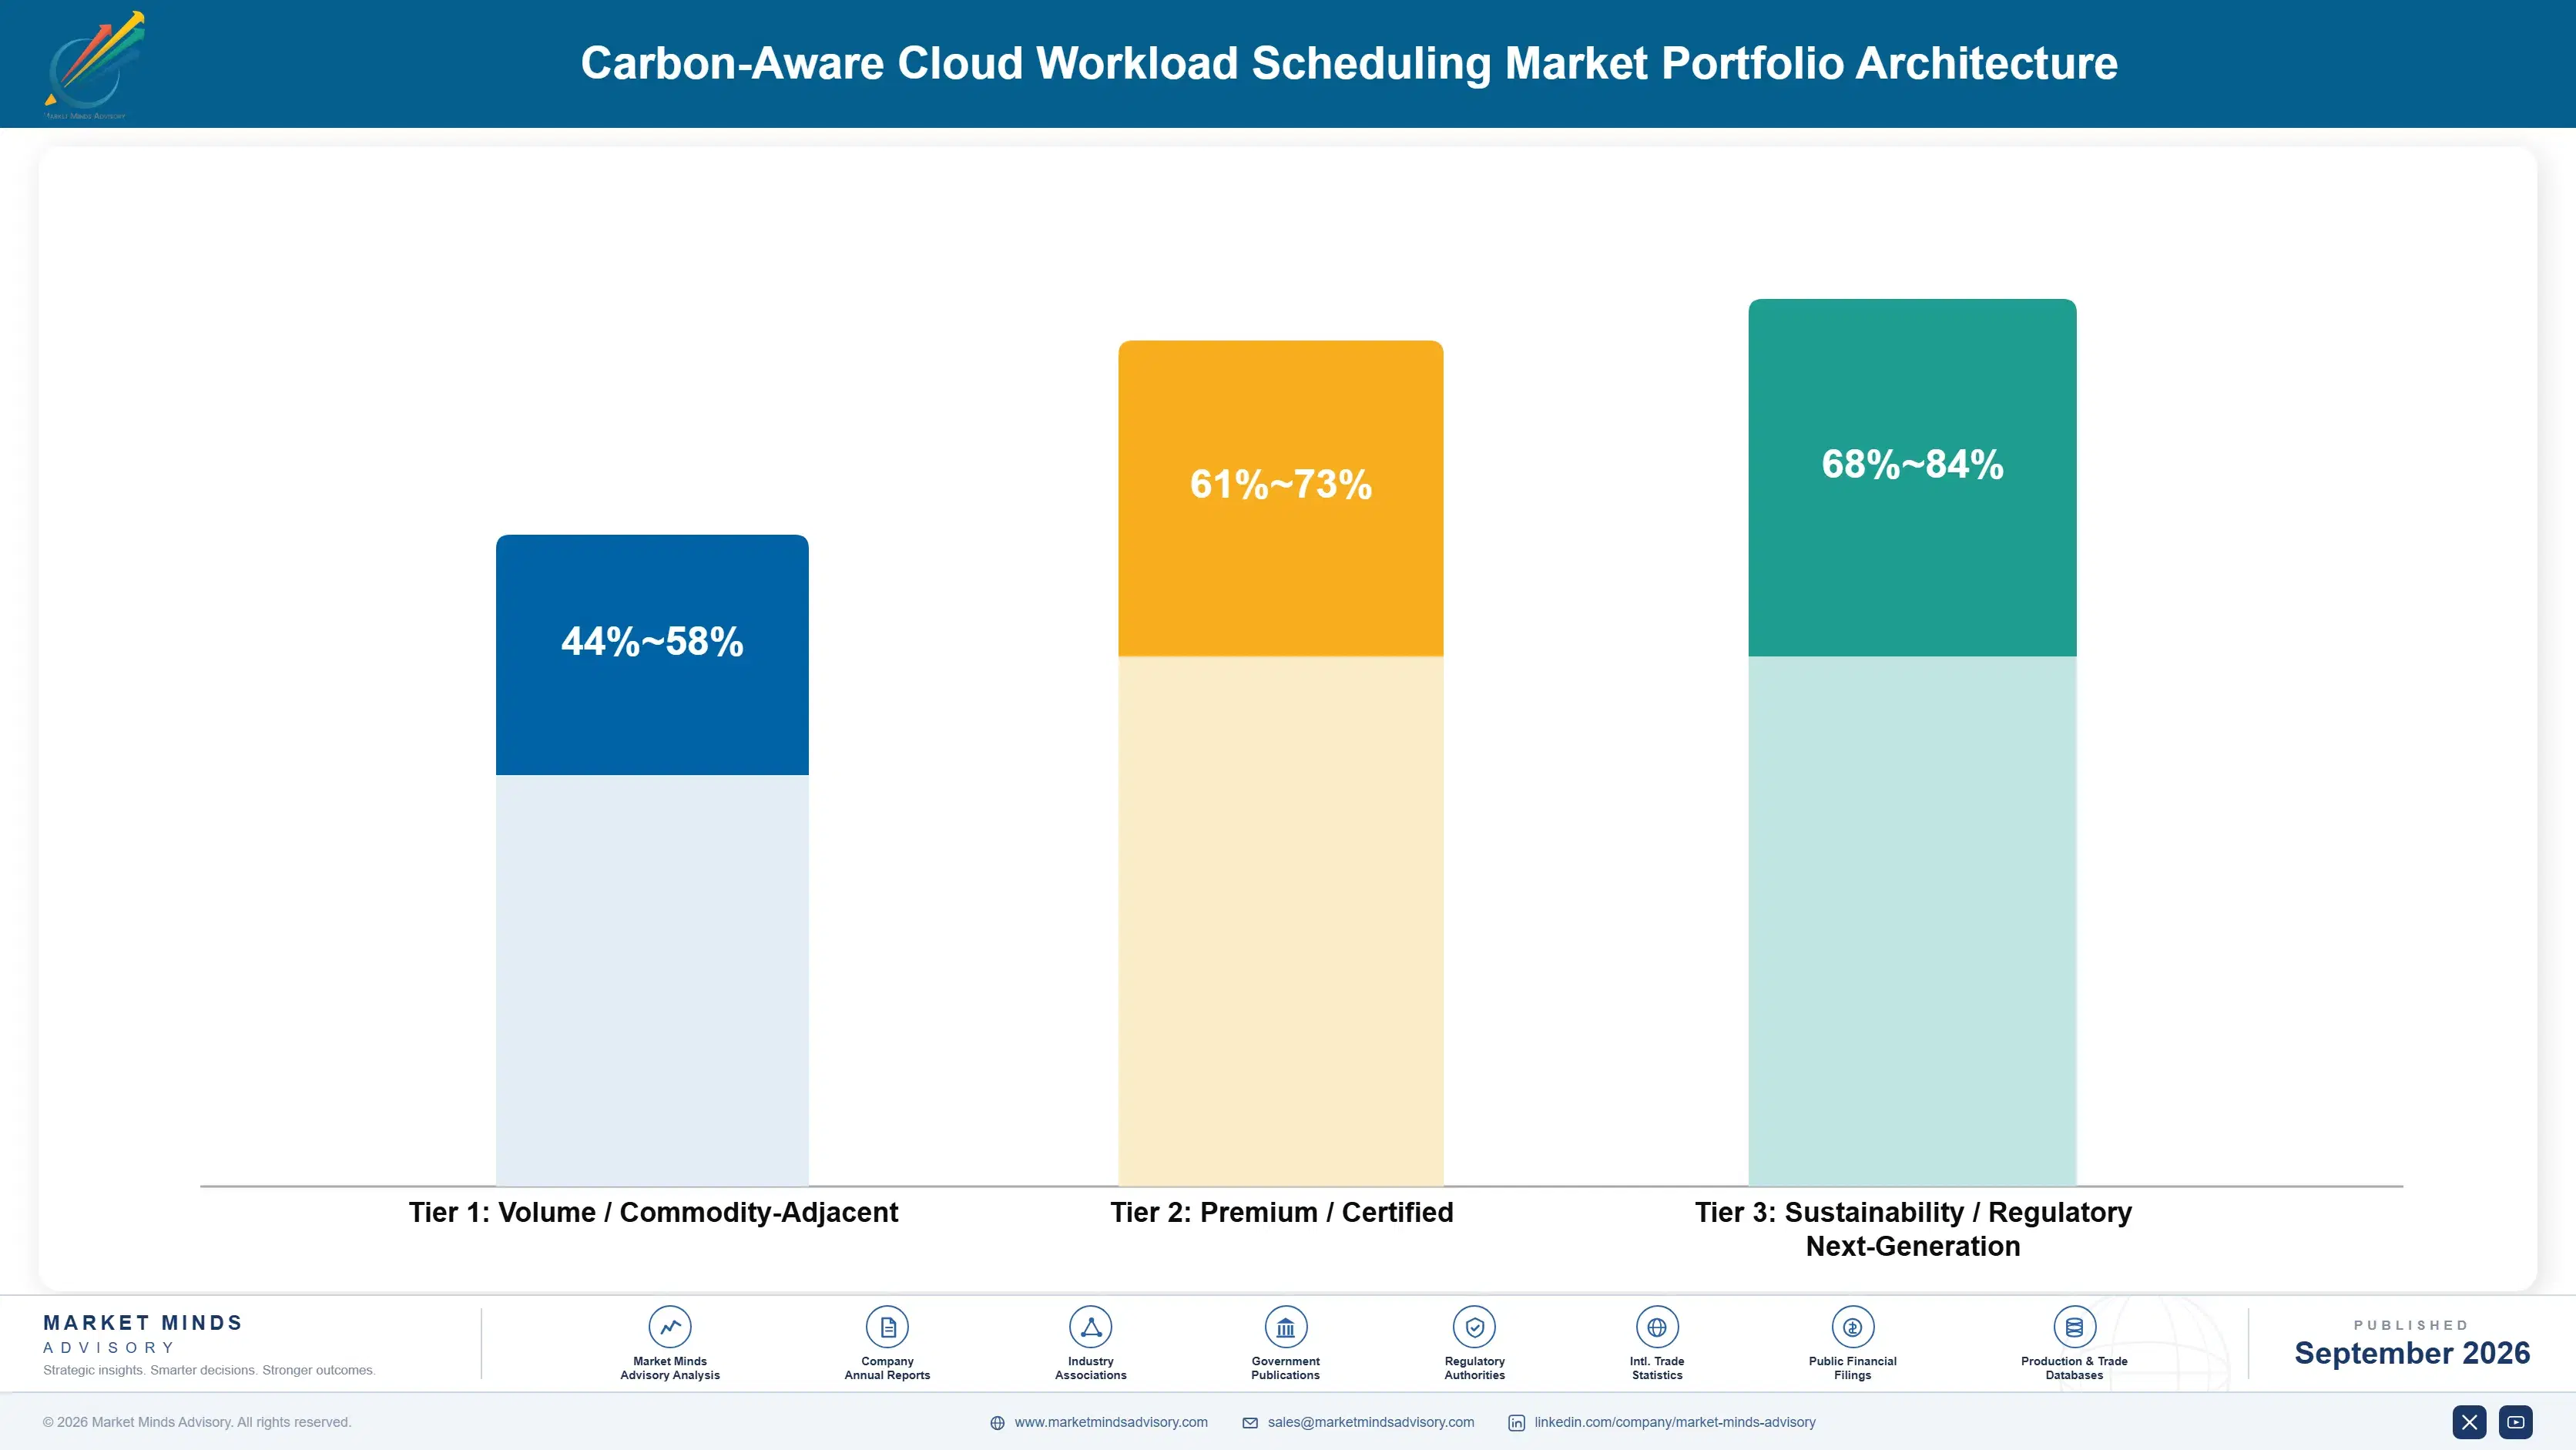
Margin architecture in this market separates by layer more cleanly than in most software categories. Grid data and signal businesses run the highest gross margins once coverage is built, because another customer on an existing grid costs almost nothing to serve. Application and measurement software sits considerably lower, squeezed between free platform features and enterprise suite bundling. Operations integration earns well but carries genuine field engineering cost per deployment.
The volume tension is between selling to sustainability teams and selling to operations. Sustainability budgets are numerous, small and easily reprioritised, while operations budgets are fewer, larger and tied to obligations that cannot be deferred. Most vendors started with the first because it was easier to reach and are now trying to move toward the second, which requires engineering capability and reference sites rather than a repositioned sales message.

High-value revenue concentrates in marginal emissions data and in grid-integrated scheduling for constrained sites. Both carry a buyer facing a consequence, an assurance failure or a connection condition, that dwarfs the fee. Cloud emissions measurement occupies the volume position and generates most of the customer count, but free platform features have already set what enterprises will pay, and that ceiling is low.

Volume / Commodity-Adjacent

Cloud emissions measurement and reporting dashboards sold to enterprise sustainability functions. The wide range separates vendors with assurance-grade methodology from those competing directly against free platform features. Price ceilings here are set by what hyperscalers give away rather than by delivery cost.
Gross Margin: 44-58%

Premium / Certified

Scheduling and placement software with joint cost and carbon optimisation, sold to platform engineering teams with a reporting obligation behind them. Margin holds because the optimisation logic and multi-cloud coverage are genuinely difficult to replicate. Renewal depends on the underlying disclosure obligation persisting.
Gross Margin: 61-73%

Sustainability / Regulatory / Next-Generation

Marginal emissions data services and grid-integrated demand response for constrained sites. The widest range in the portfolio, since data businesses scale at near-zero marginal cost while operations integration carries field engineering per site. Highest margin and the most defensible positions in the category.
Gross Margin: 68-84%
carbon-aware-cloud-workload-scheduling-market-portfolio-architecture-1788417755225

High-value Sub-segments and Strategic Watch-out

Marginal Emissions Data Services

High value and high growth together, because every product in this category needs the data and few firms can model it credibly. The margin range reflects grid coverage breadth against a largely fixed cost base. Audit expectations moving toward marginal factors strengthen this position further.
Gross Margin: 74-84%

Grid Integrated Demand Response

High value with moderate growth, sold to data centre operations against connection conditions that make flexibility a requirement rather than a choice. The range reflects field engineering content, which varies substantially by site. Revenue per deployment runs several times enterprise software subscriptions and renewal is effectively assured.
Gross Margin: 62-74%

Cloud Emissions Measurement

The volume core and the most exposed part of the market, competing directly against capability hyperscalers include at no charge. It generates the customer count and the reference base that other products are sold into. Vendors need it and cannot price it well, which is uncomfortable indefinitely.
Gross Margin: 42-56%

Hyperscaler Native Scheduling Features

The strategic watch-out, carried at zero because these features are given away rather than sold. Each expansion downward removes commercial space from independent vendors, exactly as happened in cloud cost management. Vendors assuming platform providers will stop at measurement are repeating a mistake that category already made once.
Gross Margin: 0-0%

How This Spending Repeats

Renewal in this market depends almost entirely on whether an external obligation sits behind the purchase. Where a disclosure rule requires an assured figure or a connection condition requires flexibility, renewal is automatic because dropping the tool creates a compliance gap. Where the purchase rested on an internal target, renewal competes against every discretionary line and loses when targets are revised. Roughly 71% of current purchases carry an obligation behind them.
Adoption depth varies considerably by vertical. Financial services buy for disclosure and use the tooling shallowly, since workloads are latency-bound and regulated in place. Media and entertainment shift transcoding and rendering genuinely and see real reductions. Pharmaceutical computing shifts batch simulation readily. Retail adopts lightly outside reporting. Data centre operators are the deepest users, because their obligation is physical and ignoring it costs capacity.

The buyer profile has shifted from engineering advocacy toward obligation ownership. Early deployments were driven by platform engineers who found the problem interesting and built with open-source tooling. Current purchases are made by sustainability reporting owners and data centre operations managers who have a named obligation and a defined deadline. Vendors still selling to the enthusiastic engineer address someone without a budget.
carbon-aware-cloud-workload-scheduling-market-end-use-penetration-index-1788417755719

Where This Category Pays

These are among the four positions where our research anticipates prominent divergence between winners and laggards over the coming forecast period. Each is grounded in the demand model, the regulatory perimeter, and the announced capacity pipeline.
01 / DATA LAYER POSITIONING

Own the marginal emissions signal or resell somebody else's

Grid intensity modelling is the one genuinely scarce capability anywhere in this whole category, and it sustains price points running roughly 4 times those achievable on published average factors. Vendors holding it sell to competitors as readily as to end users, which is comfortably the most defensible commercial position available anywhere in this whole market. Everyone else buys the data, which means their cost base scales with usage and their most important supplier is frequently also their most direct competitor.
02 / FINANCE FUNCTION ALIGNMENT

Optimise jointly for cost and carbon from the start

Carbon-optimal scheduling raises the cloud bill in about 44% of decisions, which turns every single deployment into an argument the sustainability team eventually loses to finance. Joint optimisation with a configurable ceiling on cost increase typically captures 60% of the available reduction at neutral cost, and it converts the finance function from a blocker into an approver. A smaller reduction that actually gets authorised is worth considerably more than a larger one that sits permanently unapproved in a proposal document somewhere.
03 / OPERATIONS BUDGET ACCESS

Sell to data centre operations, not sustainability teams

Sustainability budgets are small, numerous and quietly reprioritised whenever targets are revised, while data centre operations budgets are tied to connection conditions that simply cannot be deferred without losing capacity. Per-site values in grid-integrated deployments run around 8 times what a typical enterprise software subscription delivers. Making that move requires genuine field engineering capability and reference sites rather than merely a repositioned sales message, which is why most vendors talk about making this move considerably more than they achieve it.
04 / PLATFORM ABSORPTION DEFENCE

Assume hyperscalers will take everything demonstrable for free

Cloud providers have already absorbed emissions measurement into their included platform features across all three major platforms, exactly as happened across cloud cost management only a few years earlier. Anything that demonstrates well inside a console will follow it in time. The defensible positions are marginal data modelling, assurance methodology and physical grid integration, none of which a platform provider currently has any commercial reason at all to build, and vendors betting otherwise are repeating a well-documented and expensive mistake.

Engagement Snapshot From the Field

A live engagement with an industry participant carrying material or product regulatory and market exposure ahead of a defining policy shift, showing how our research translates into a defensible multi-year portfolio strategy.
MARKET MINDS ADVISORY · CLIENT ENGAGEMENT SUMMARY
Carbon-Aware Cloud Workload Scheduling Producer Strategic Portfolio Review and Transition Roadmap 2026·Investment Scenario on Carbon-Aware Cloud Workload Scheduling Exposure Evaluation 2025-26
CLIENT PROFILE
A European colocation operator running eleven facilities across four countries with roughly 240 megawatts of contracted capacity (client-reported, unverified by MMA), serving financial services, enterprise and hyperscale customers under agreements carrying quite different service level commitments. Two of its largest sites sat in transmission-constrained regions where new connection applications had been deferred pending demonstrated flexibility.
STRATEGIC CHALLENGE
The operator needed to demonstrate dispatchable load reduction to secure roughly 90 megawatts of additional connection capacity (client-reported, unverified by MMA), but held no direct control over customer workloads and had contractual availability commitments that appeared to prohibit curtailment. Its sustainability team had separately procured a cloud emissions reporting tool that operations considered irrelevant to the actual problem.
MMA APPROACH
MMA separated the connection problem from the reporting problem, which the client had been treating as one initiative. We assessed contracted service levels to establish what curtailment was genuinely prohibited rather than assumed, and interviewed seven customers, two transmission operators and four vendors. Vendor evaluation was scored on grid dispatch integration and evidence of delivered flexibility rather than on emissions reporting capability.
KEY FINDINGS
  1. Only 31% of contracted capacity carried service levels that genuinely prohibited curtailment, far below the operator's internal assumption that almost all of it did.
  2. Three hyperscale customers were already running carbon-aware batch scheduling internally and would have participated in a site flexibility programme had anyone asked them.
  3. The incumbent reporting tool could not produce marginal emissions figures or grid dispatch integration, and no configuration of it would ever address the connection requirement.
  4. Uninterruptible power and thermal inertia provided roughly 14 minutes of usable response headroom before any customer workload needed to be touched at all.
CLIENT PROFILE
A European colocation operator running eleven facilities across four countries with roughly 240 megawatts of contracted capacity (client-reported, unverified by MMA), serving financial services, enterprise and hyperscale customers under agreements carrying quite different service level commitments. Two of its largest sites sat in transmission-constrained regions where new connection applications had been deferred pending demonstrated flexibility.
STRATEGIC CHALLENGE
The operator needed to demonstrate dispatchable load reduction to secure roughly 90 megawatts of additional connection capacity (client-reported, unverified by MMA), but held no direct control over customer workloads and had contractual availability commitments that appeared to prohibit curtailment. Its sustainability team had separately procured a cloud emissions reporting tool that operations considered irrelevant to the actual problem.
MMA APPROACH
MMA separated the connection problem from the reporting problem, which the client had been treating as one initiative. We assessed contracted service levels to establish what curtailment was genuinely prohibited rather than assumed, and interviewed seven customers, two transmission operators and four vendors. Vendor evaluation was scored on grid dispatch integration and evidence of delivered flexibility rather than on emissions reporting capability.
KEY FINDINGS
  1. Only 31% of contracted capacity carried service levels that genuinely prohibited curtailment, far below the operator's internal assumption that almost all of it did.
  2. Three hyperscale customers were already running carbon-aware batch scheduling internally and would have participated in a site flexibility programme had anyone asked them.
  3. The incumbent reporting tool could not produce marginal emissions figures or grid dispatch integration, and no configuration of it would ever address the connection requirement.
  4. Uninterruptible power and thermal inertia provided roughly 14 minutes of usable response headroom before any customer workload needed to be touched at all.
RECOMMENDED STRATEGY
Phase 1: Separate the flexibility programme from sustainability reporting entirely, funding the work from capacity development budgets rather than from the sustainability budget. Phase 2: Contract a grid-integrated vendor for dispatch response at the two constrained sites, and retain the incumbent reporting tool for its narrower disclosure purpose. Phase 3: Offer participating customers a capacity credit for scheduled flexibility, converting an operational request into a commercial arrangement they benefit from.
OUTCOME
The operator demonstrated dispatchable reduction at both constrained sites within eight months and secured the deferred connection capacity. Programme cost reached roughly USD 2.7 million against capacity worth an estimated USD 40 million in contracted revenue (client-reported, unverified by MMA). Four customers joined the flexibility arrangement voluntarily.

Frequently Asked Questions

Foundational context covering the market sizes, CAGR, scope, country, region and competition that inform every finding below. This section is provided to cover basics and most often pre-purchase conversations, answered from the MMA Primary Research Dataset.

What is the current size of the Carbon-Aware Cloud Workload Scheduling Market?

The market was worth USD 0.3 billion in 2025 and reaches USD 0.35 billion in 2026. Roughly 71% of purchases are driven by a reporting or connection obligation rather than by efficiency ambition.

How large will the Carbon-Aware Cloud Workload Scheduling Market be by 2036?

MMA forecasts USD 1.47 billion by 2036, an expansion of 4.20 times over the forecast period. That represents USD 1.12 billion of incremental annual revenue against 2026.

What is the CAGR for the Carbon-Aware Cloud Workload Scheduling Market 2026 to 2036?

The base case is 15.4% compound annual growth, with a bull case at 16.6% and a bear case at 14.2%. Accelerator capacity scarcity is what separates the three scenarios.

Which segment is growing fastest?

Grid carbon intensity signal and forecasting grows at 23.1%, half again the market rate of 15.4%. Every scheduling and reporting product needs the data and few firms can model marginal emissions credibly.

Who are the major companies in the Carbon-Aware Cloud Workload Scheduling Market?

Schneider Electric, IBM, SAP, Electricity Maps and WattTime lead on measured subscription revenue. Together they hold roughly 34%, which is low and reflects a category still forming.

Which country is growing fastest?

Ireland grows fastest at 21.4%, because transmission constraints have made demonstrable demand flexibility a condition of connecting new data centre capacity. Emissions reporting is a secondary driver there.

Report Segmentation Architecture

The full report scope spans multiple orthogonal segmentation dimensions, with cross-tabulated demand data provided for each dimension pair. Coverage extends further to regional breakdowns, trend trajectories, and the competitive detail needed to support segment-level decision-making.

By Primary Market Dimension

  • Carbon Measurement and Cloud Emissions Accounting
  • Temporal Workload Shifting and Scheduling
  • Spatial and Regional Workload Placement
  • Grid Carbon Intensity Signal and Forecasting
  • Data Centre Demand Response Integration
  • Software Carbon Efficiency Optimisation

By End-Use Industry

  • Data Centre and Colocation Operators
  • Cloud and Internet Platform Providers
  • Financial Services
  • Media and Entertainment
  • Pharmaceutical and Research Computing
  • Retail, Logistics and Manufacturing

By Commercial Dimension

  • Enterprise Software Subscription
  • Data and Signal Licensing
  • Platform Native Features
  • Operations Integration Projects
  • Managed and Advisory Services
  • Open Source Support and Hosting

By Region

  • Western Europe
  • North America
  • East Asia
  • South Asia and Pacific
  • Latin America
  • Middle East and Africa
  • Eastern Europe

Scope, Methodology, and Coverage

Every figure in this report is reproducible from documented input assumptions. The scope below maps the historical period, the forecast horizon, the segmentation dimensions, and the countries covered, alongside the underlying primary and qualitative methodology.
Historical Period
2020 to 2025
Forecast Period
2026 to 2036
Base Year
2025 (USD billions; MMA Primary Research Dataset, September 2026)
Market Definition
This market covers software and data services that schedule, place or shape cloud and data centre compute according to electricity grid carbon intensity, spanning temporal workload shifting, regional placement, grid carbon intensity signal and forecasting services, cloud emissions accounting, data centre demand response integration and software carbon efficiency tooling. Revenue is measured as subscription, data licensing and directly attributable integration services at vendor level. Corporate carbon accounting suites without compute scheduling capability, energy management hardware, power purchase agreement brokerage, renewable certificate trading and general cloud cost optimisation are excluded.
Quantitative Units
USD billions, subscription, data licensing and attributable services revenue
Segmentation Dimensions
Capability layer, end-use industry, commercial model, region
Regions Covered
Western Europe, North America, East Asia, South Asia and Pacific, Latin America, Middle East and Africa, Eastern Europe
Countries Covered
United States, Canada, Ireland, United Kingdom, Germany, Netherlands, Denmark, Sweden, France, Spain, Poland, Czechia, Japan, South Korea, China, Taiwan, Singapore, Australia, India, Brazil, Mexico, Chile, United Arab Emirates, Saudi Arabia, South Africa
Key Companies Profiled
Schneider Electric, IBM, SAP, Electricity Maps, WattTime, Microsoft, Google, Amazon Web Services, ServiceNow, Flexera, CloudZero, Cast AI, Harness, Greenpixie, Climatiq, Watershed, Persefoni, Cycloid, Sweep, Normative
Quantitative Methodology
Primary survey, n=3,800 respondents, Q4 2025, six countries; demand-side model with trade association cross-validation
Qualitative Methodology
47 expert interviews, Q4 2025; applied to validate demand model assumptions, identify emerging dynamics, and assess competitive positioning
Report Format
PDF and XLSX data workbook (Word format preview document)
Publisher
Market Minds Advisory
Report Code
MMA-2026-TEC-771
Published
September 2026
Contact
sales@marketmindsadvisory.com | www.marketmindsadvisory.com

Purchase the full Carbon-Aware Cloud Workload Scheduling Market Report (2026 to 2036).

The full MMA report examines why carbon-aware scheduling works technically and sells narrowly, sizing the addressable slice of shiftable compute and quantifying the cost penalty that constrains adoption. It sizes the market to 2036 across six capability segments, seven regions and 25 countries, with segment growth rates and regional demand mechanisms set out in full. Competitive analysis covers 20 participants assessed on measured subscription and data licensing revenue, including moat and risk assessment for the two leaders. The report quantifies cost structure by layer, grid data acquisition economics and margin architecture across three portfolio tiers. It closes with four strategic verdicts and an anonymised colocation operator engagement.
Six capability segments sized to 2036
Seven regions with demand mechanism analysis
Twenty vendors on consistent revenue basis
Shiftable workload and cost penalty benchmarks
Margin architecture across three portfolio tiers
Anonymised colocation flexibility strategy client engagement

Built For The People Who Decide

From boardroom strategy to bench-side execution, this report is read cover-to-cover by leaders shaping the next decade of their industry, turning demand scenarios, market dynamics and valuation benchmarks into decisions.
CXOs/ Presidents/ VPs/ Managers
M&A and Corporate Development
Strategy Teams and R&D Heads
Procurement and Product Directors
Regulatory and Compliance Leaders
Investor Relations and Equity Analysts