Market Minds Advisory
CAPA Management (Corrective Action / Preventive Action) Market

CAPA Management (Corrective Action / Preventive Action) Market: CAPA Management Market: Investigation Quality, Repeat Failures and Defensive Escalation, 2026 to 2036

Around 31% of new records address a failure a previous action already closed as effective. The software enforces a process built to survive an inspection rather than to fix anything.

Lead Analyst

Published

September 2026

Make Smarter Decisions with Customized Research Insights

Request a free sample report and evaluate market opportunities, growth trends, and competitive dynamics relevant to your business needs.

2025 MARKET VALUE$1.9BMarket Size 2025
2036 FORECAST VALUE$5.3BBase Case , 2026 to 2036
CAGR 2026 TO 20369.8 %Bull 11.0% / Bear 8.6%
INCREMENTAL OPPORTUNITY$3.2BNet 10- year value creation
EXPANSION MULTIPLE2.52x2036 value over 2026 base
Strategic Levers
M&A Pipeline
Regional Outlook
Country Rankings
Competitive Intelligence
Segmental Deep-dive
Call-Us : 91 93563 13602

Executive Snapshot and Market Trajectory.

The most revealing number in this category is 31%. That share of new corrective action records addresses a failure a previous action had already closed as effective. If the process worked as designed, that number would be close to zero, and everyone in quality management knows it.
Investigation and root cause tooling grows at 14.7%, half again the market rate of 9.8%, because the constraint was never workflow. An analyst with 41 hours and a template produces a finding that satisfies a reviewer, which is a different objective from finding the cause. Effectiveness verification follows at 11.3%, since a closure signature has proved to be a poor substitute for a measurement. Signatures are not measurements.
Defensive behaviour explains the backlog. Around 38% of records are escalated beyond what a risk assessment required, because closing something without a formal action looks worse in an audit than a queue does. That produces 23% of open actions running past their committed date, and the overdue queue then becomes the finding. Retention is unusually high and satisfaction unusually low, which validation obligations explain. Overdue closure is itself a common inspection observation.
Market Definition
This market covers software for managing corrective and preventive action processes, including deviation and nonconformance intake, investigation and root cause tooling, action plan and task management, effectiveness verification and closure, supplier and external corrective action, and audit finding and inspection response. It excludes enterprise resource planning and manufacturing execution systems, laboratory information management, standalone document control, post-market surveillance and complaint intake systems, and quality consulting services.
Base Year Value
$1.9B in 2025 (MMA Primary Research Dataset, September 2026)
Forecast Period
2026 to 2036, eleven discrete annual values
CAGR
9.8% base case. Bull 11.0%. Bear 8.6%.
Fastest Growth Segment
Investigation And Root Cause Tooling: 14.7% CAGR
Fastest Growth Country
India: 14.6% CAGR
Fastest Growth Region
South Asia and Pacific: 12.1% CAGR
Largest Region
North America: 33% of 2025 global value
Market Leaders
Veeva Systems, MasterControl, Honeywell, Hexagon, and Siemens lead the field. Source: MMA Primary Research Dataset, July 2026.
Primary Survey
n=3,800 procurement and R&D decision-makers, Q4 2025, six countries
Methodology
Demand-side build-up, cross-validated against public data, 47 expert interviews

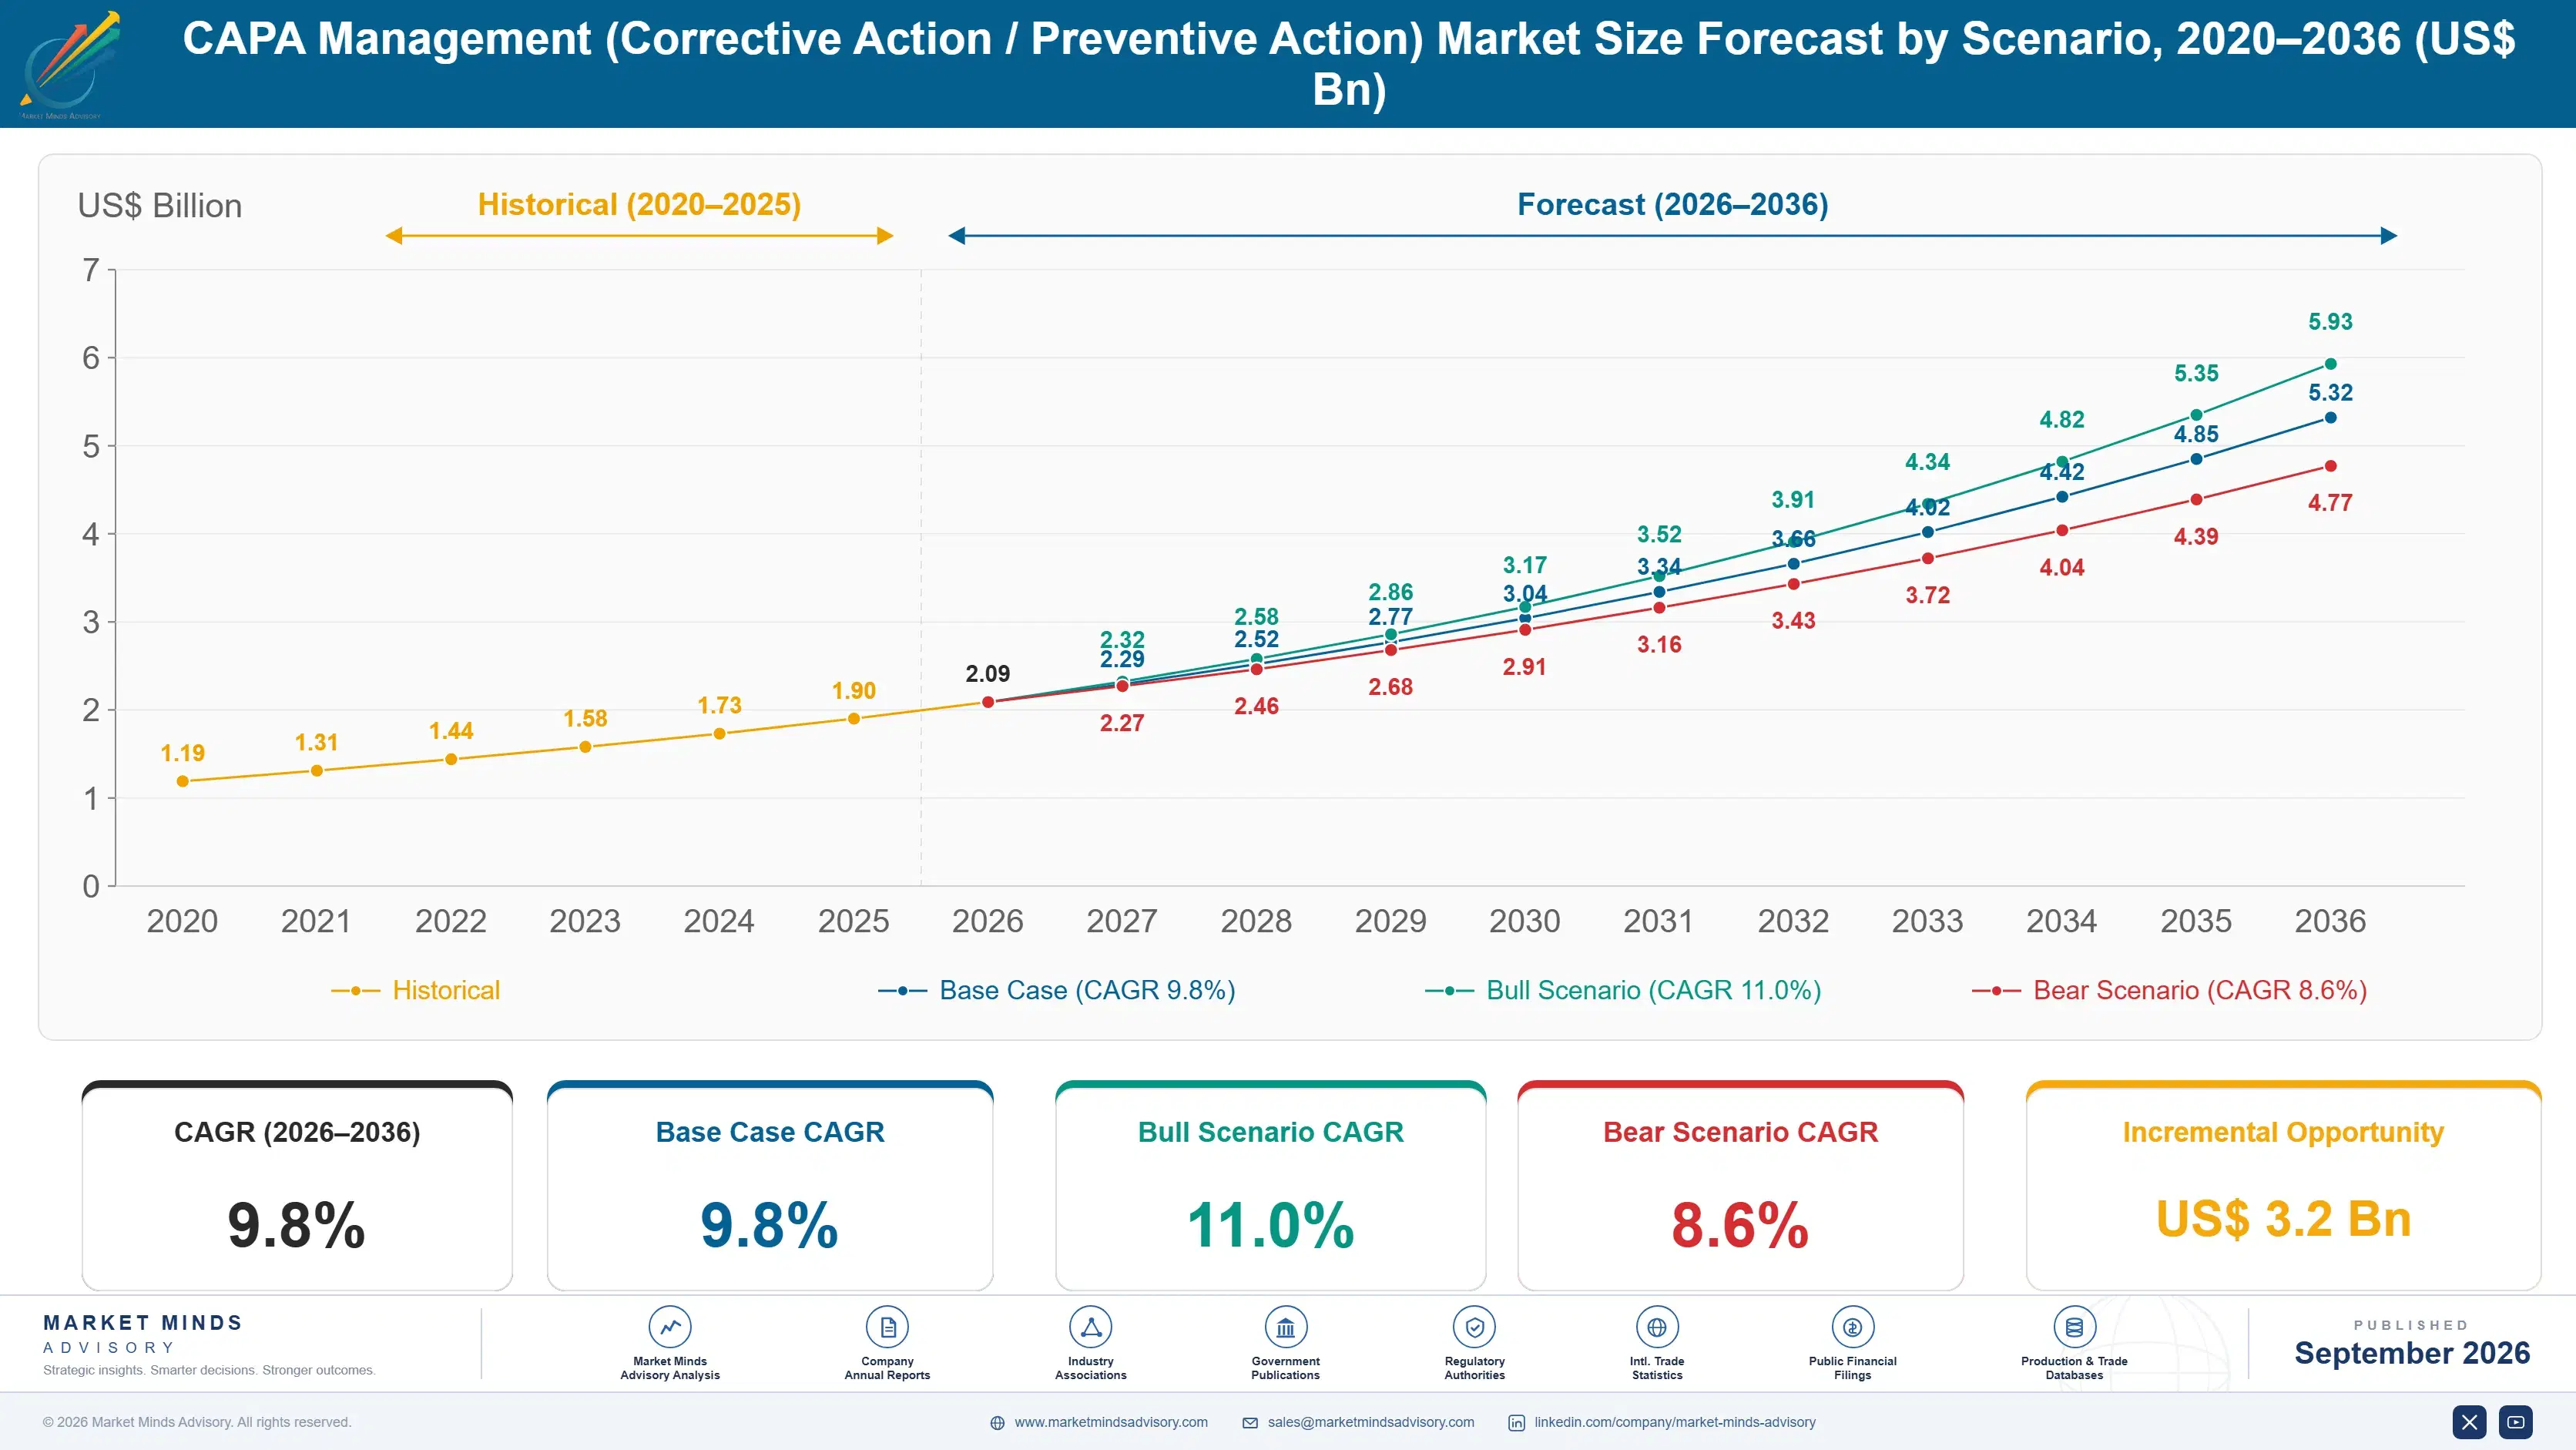
CAPA Management (Corrective Action / Preventive Action) Market Forecast Scenarios

capa-management-market-size-forecast-scenario-1790011002342
Between 2020 and 2025 the category completed a migration and postponed a reckoning. Validated cloud deployment became acceptable to regulated manufacturers, which moved a large installed base off local servers and generated healthy licence growth. What did not change was investigation quality or repeat failure rates. Historical growth of 8.8% reflects a delivery model change rather than improvement.
The base case at 9.8% rests on three mechanisms. Investigation tooling grows as manufacturers accept that routing approvals faster never addressed the cause of anything. Effectiveness verification grows because regulators increasingly ask what evidence supports a closure. And assisted drafting and clustering reduce the analyst hours a single investigation consumes, which is the only lever that meaningfully moves a backlog. Workflow speed appears in none of them, which marks a real change in buying behaviour.
The bull case at 11.0% depends on risk-based triage being accepted in practice as well as in guidance, which would let manufacturers close minor events without full action and release capacity for the ones that matter. The bear case at 8.6% is suite absorption: enterprise platforms bundle adequate corrective action workflow into systems manufacturers already run, compressing pricing for specialists who cannot show better investigation outcomes.

Fixing Or Documenting The Fix

Corrective action software is deployed almost universally across regulated manufacturing and regarded almost universally as a burden. The reason is visible in the design. These systems were built to produce a defensible record for an inspector, and they do that well. Whether the underlying failure was understood and removed is a separate question the software has never really addressed. Retention is high and satisfaction is low, which validation obligations explain entirely.
TOP FIVE CONCENTRATION44%Share of subscription revenue held by the leading vendors
REPEAT DEVIATION SHARE31%New records addressing failures a prior action already closed
OVERDUE CLOSURE RATE23%Open actions running past their committed closure date
AVERAGE INVESTIGATION TIME41 hoursAnalyst effort spent on a single major investigation
AVERAGE ANNUAL CONTRACTUSD 96,000Subscription value averaged across all regulated manufacturing customers
DEFENSIVE ESCALATION RATE38%Records escalated beyond what risk assessment actually required
Repeat rates say what the record cannot. Around 31% of new corrective actions address something a previous action closed as effective, which means the effectiveness check functioned as a signature rather than a measurement. Investigation is where this originates: an analyst with 41 hours and a template will produce a plausible cause, and plausible causes close records without preventing recurrence.
The backlog is a behavioural problem rather than a capacity one. Roughly 38% of records escalate beyond what a risk assessment actually required, because in an audit a queue looks better than a decision not to open an action. That defensive escalation produces 23% overdue closure, and overdue closure is itself among the most common inspection observations, which closes the loop unpleasantly.
"We sampled corrective actions at four manufacturers and roughly a third were fixing something a previous action had already closed as effective. Nobody was surprised. Everyone in the room could name the recurring failure. The system had recorded three successful closures against it, which tells you exactly what an effectiveness check has become."
Practice Director, Quality Systems and Regulated Manufacturing · MMA Technology Practice · September 2026

Market Trends

Investigation Quality Replaces Workflow As The Product

Routing an approval faster never made a cause easier to find, and manufacturers eventually stopped buying speed. Investigation and root cause tooling grows at 14.7% as buyers ask for links to batch records, equipment history, complaint data, and prior events instead of another approval step. An analyst with 41 hours and a template produces a plausible finding rather than a true one, and plausible findings close records while the failure returns later under a new number. Most of those hours go on assembling context that already exists elsewhere in the manufacturer's own systems.
Market Impact: Country grows at 14.6%

Effectiveness Checks Move From Signature To Evidence

A closure signed as effective while the same failure recurs is worth nothing, and regulators have grown noticeably less patient with it. Effectiveness verification grows at 11.3% as manufacturers build checks that measure recurrence over a defined period against data the system already holds. The change is uncomfortable, because honest verification reopens actions that were previously closed and makes the metrics look worse before they look better. Verification now measures recurrence over a defined period against records the system already holds, rather than asking a reviewer whether they believe the fix worked.
Market Impact: Investigations take 41 hours

Market Opportunities and Growth Drivers

Regulatory Observations Concentrate On Corrective Action Systems

Inspection findings across regulated manufacturing repeatedly identify overdue actions, inadequate investigations, and failed effectiveness verification, which makes this software a direct response to enforcement exposure rather than an efficiency purchase. Indian growth of 14.6% leads every country covered, driven by pharmaceutical manufacturing sites serving export markets where inspection outcomes decide commercial access. The purchase is approved by quality leadership answering to a regulator rather than by anybody comparing features. Inspection outcomes decide market access rather than merely compliance standing, which removes price from the conversation almost entirely. Feature comparison rarely enters these evaluations at all.
Market Impact: Escalates 38% of records unnecessarily

Assisted Drafting Reduces The Investigation Hour Burden

A major investigation consumes about 41 analyst hours, most of it assembling context that already exists somewhere in the manufacturer's own systems. Assisted drafting, clustering of related events, and automatic surfacing of prior similar failures cut that materially without removing the human accountability a regulated process requires. Vendors offering it report investigation cycle times falling by a third or more, which is the only lever that genuinely reduces a backlog rather than reorganising it. Human review and approval remain named and recorded, which is what makes the capability acceptable in a regulated process at all.
Market Impact: Freezes practice beyond 3 years

Market Restraints and Challenges

Defensive Escalation Manufactures The Entire Backlog

Around 38% of records escalate beyond what risk assessment required, and the root cause is that a decision not to open a formal action is harder to defend in an inspection than a long queue is. Commercially this floods the system with low-value records, buries the serious ones, and produces 23% overdue closure that becomes an observation in itself. Vendors respond with risk-based triage supported by documented rationale, tiered handling paths, and closure evidence that withstands scrutiny. The guidance already permits proportionate handling; what has been missing is evidence that survives scrutiny.
Market Impact: Segment grows at 14.7%

Validation Cost Discourages Changing Anything Later

Regulated deployments require documented validation of the system and of every material change, and the root cause is that patient safety obligations rightly demand evidence the software does what it claims. Commercially this makes manufacturers reluctant to adopt improvements, upgrade versions, or reconfigure processes, which freezes bad practice in place for years. Vendors respond with pre-validated configurations, continuous validation approaches, and change documentation packages supplied with each release. Customers frozen on an old version never experience improvement, and they renew on price against competitors offering the same ageing capability elsewhere.
Market Impact: Segment grows at 11.3%
4 additional market trends, 3 additional growth drivers, and 2 additional restraints and challenges are covered in the full report. Contact sales@marketmindsadvisory.com to access the complete intelligence.

Segment CAGR and Growth Architecture

Segmentation follows functional module. Six categories cover the market: deviation and nonconformance intake, investigation and root cause tooling, action plan and task management, effectiveness verification and closure, supplier and external corrective action, and audit finding and inspection response. Validation documentation and implementation services are counted within the module they support. Assisted drafting is counted within investigation tooling.
capa-management-market-market-share-analysis-1790011002909

Investigation And Root Cause Tooling

Investigation tooling grows at 14.7%, half again the market rate of 9.8%, because manufacturers finally accepted that faster approval routing never made a cause easier to identify. Buyers now ask for links into batch records, equipment history, complaint data, and prior similar events rather than another review step. The underlying problem is time: an analyst with 41 hours and a template produces a plausible finding, and plausible findings close records while the same failure returns later under a different number. Assisted drafting and event clustering attack that directly without removing human accountability. Vendors with no quality heritage are entering on precisely this dimension. They compete on the one dimension that reduces hours rather than reorganising them.
CAGR 14.7%

Effectiveness Verification And Closure

Effectiveness verification grows at 11.3% as regulators press harder on what evidence actually supports a closure. Around 31% of new records address failures a previous action closed as effective, which is the clearest possible demonstration that the check became a signature rather than a measurement. Modern verification measures recurrence over a defined period against data the system already holds, rather than asking a reviewer whether they believe the fix worked. Adoption is uncomfortable, because honest verification reopens closed actions and makes quality metrics deteriorate before they improve. Quality leaders who adopt it need executive cover for the period when the numbers deteriorate. Regulators have grown noticeably less patient with signatures that mean nothing.
CAGR 11.3%
Full segment breakdown across 6 segments available in the complete report.

Regional Architecture and Country Demand Map

Regional shares follow regulatory exposure and software spending per site rather than manufacturing volume, and those diverge sharply. Three regions sit outside the standard bands, each for reasons named in its paragraph and summarised for operator review below. Site counts and spending intensity rarely move together.

North America

At 33% this region sits above the standard band, and the justification is regulatory weight rather than manufacturing scale: sites under federal inspection carry the heaviest corrective action obligations anywhere and spend the most per site on systems to satisfy them. Enforcement practice here also sets expectations that other regions adopt within a few years. Growth of 8.9% is close to the world rate. Medical device and pharmaceutical manufacturers dominate spending, with food and aerospace quality functions adopting comparable disciplines more recently. Enforcement action here also creates a market for remediation work, since sites under consent obligations invest far more heavily than the general population of manufacturers. Food and aerospace quality functions have adopted comparable disciplines more recently.
Share: 33% | CAGR: 8.9% (2026 to 2036)

Western Europe

Medical device regulation and pharmaceutical good manufacturing practice obligations sustain steady demand, with notified body audits driving as much software investment as any regulator does. German, Swiss, and Irish manufacturing sites account for a substantial share of regional spending. Growth of 8.3% is the slowest of the seven regions, since deployment is essentially universal and growth depends on module expansion rather than new customers. Validation cost makes manufacturers here particularly reluctant to change systems once something is working adequately. Notified body audit cycles drive as much software investment as any regulator does, and manufacturers plan system changes around those cycles rather than around release schedules. Deployment is essentially universal, so growth depends on module expansion rather than new customers.
Share: 21% | CAGR: 8.3% (2026 to 2036)
Regional intelligence for 5 additional markets available in the complete report: East Asia, South Asia and Pacific, Latin America, Middle East and Africa, Eastern Europe. Contact sales@marketmindsadvisory.com.
capa-management-market-country-cagr-analysis-1790011003438

Where Vendors Earn Real Renewals

Four commercial moves separate vendors improving outcomes from those selling a faster version of a process that has not worked. Each addresses either investigation quality or the defensive behaviour that fills these systems with records nobody needed to open in the first place. Faster routing has never made a cause easier to identify. That is now widely accepted.

Prove Recurrence Reduction Rather Than Cycle Time

Around 31% of records address failures a previous action already closed, which is the metric customers actually care about and almost nobody sells against. Vendors demonstrating recurrence reduction using the customer's own historical records win 3.2 times more competitive replacements than those presenting cycle time improvements. Cycle time was always the easier claim and it measures how quickly a record moves rather than whether anything was fixed, which quality leadership understands perfectly well. Quality leadership understands the difference perfectly well and has done for years. Selling against it requires the customer's own data rather than a benchmark.
Market Impact: Wins 3.2 times more competitive replacement awards overall

Attack Investigation Hours With Assisted Drafting

A major investigation consumes about 41 analyst hours, most of it assembling context that already exists inside the manufacturer's own systems. Assisted drafting, event clustering, and automatic surfacing of prior similar failures cut that by 30 to 44% while leaving human accountability and audit trail intact. It is the only lever that reduces a backlog rather than reordering it, and quality leaders approve it faster than any workflow improvement because the hours saved are visible immediately. Quality leaders approve it faster than any workflow improvement, because the hours saved are visible immediately.
Market Impact: Cuts analyst investigation hours by 30 to 44%

Support Risk Triage With Defensible Rationale

Roughly 38% of records escalate beyond what risk assessment required, because declining to open a formal action is harder to defend than a queue. Systems that capture triage rationale in a form that survives inspection let quality functions close minor events properly, and customers report record volumes falling by a quarter while serious investigations receive more attention. The obstacle was never the guidance, which permits this. It was the absence of defensible evidence. Serious investigations then receive the attention they were always supposed to have. The guidance permitted this all along, and evidence was the missing piece.
Market Impact: Cuts total record volume by roughly 25% overall

Ship Validation Packages With Every Release

Validation obligations make manufacturers reluctant to upgrade, which freezes poor practice in place for years and blocks the improvements vendors have already built. Suppliers providing pre-validated configurations and change documentation with each release report upgrade adoption 2.6 times higher than those leaving customers to produce it. Customers who upgrade regularly also renew far more reliably, because they experience the product improving rather than remembering the version they bought. Customers who never upgrade remember the version they bought rather than the product it has become since. Regular upgraders renew far more reliably than frozen ones do.
Market Impact: Raises customer upgrade adoption by 2.6 times over

Who Controls the Margin Pool

Concentration is moderate. Five vendors hold 44% of subscription revenue, measured consistently on that basis across all participants, and the field divides between quality suites serving regulated life sciences, broader industrial platforms, and specialists serving medical device or food manufacturers. Enterprise platform providers bundle adequate workflow into systems manufacturers already run, which complicates any straightforward comparison.
Competition currently turns on three things: investigation tooling depth and the data connections behind it, validation packaging that lets customers actually upgrade, and evidence of recurrence reduction rather than cycle time. Workflow configurability was the differentiator for two decades and now decides comparatively little in serious evaluations. Price decides lightly regulated buyers who see no reason to pay separately for what a platform already bundles, and decides far less at sites whose market access depends on inspection outcomes.

Pressure comes from two directions. Enterprise resource and manufacturing platform providers absorb basic corrective action workflow at no incremental charge. Meanwhile assisted investigation capability arrives from vendors with no quality heritage at all. Rankings will shift toward participants who reduce recurrence and investigation hours, since neither is available from a bundled workflow module. Workflow-only vendors hold the weakest position here.
capa-management-market-company-positioning-matrix-1790011003966

Competitive Moat and Risk Dimensions

VEEVA SYSTEMS

Moat: Life Sciences Data Adjacency

Quality records sitting alongside clinical, regulatory, and manufacturing data in one environment make investigation genuinely easier, since most of the 41 hours an analyst spends goes on assembling context from elsewhere. Competitors must integrate across vendors to assert the same thing, and integration is exactly what validation obligations make expensive.
VEEVA SYSTEMS

Risk: Narrow Industry Concentration Exposure

A position anchored in life sciences provides limited advantage in food, aerospace, automotive, or general manufacturing quality, which together represent a growing share of demand. Expanding means competing against industrial platforms already embedded in those manufacturers' operational systems and holding the data adjacency argument in reverse.
MASTERCONTROL

Moat: Validation Packaging And Upgrades

Pre-validated configurations and documentation supplied with each release let customers upgrade without producing evidence themselves, which is the practical barrier that freezes most regulated software in place for years. Customers who upgrade regularly experience the product improving, and they renew considerably more reliably than those running an ageing version.
MASTERCONTROL

Risk: Investigation Depth Against Newcomers

Assisted investigation capability is arriving from vendors without quality heritage, competing on the one dimension that reduces analyst hours rather than reorganising them. Matching it means engineering work outside the document and workflow disciplines the company built its position on, against competitors who started from that problem.

Players Tracked

Prominent Players

Veeva Systems
MasterControl
Honeywell
Hexagon
Siemens

Other Key Players

Cority
Intelex
Ideagen
Qualio
Greenlight Guru
AssurX
PTC
Dassault Systemes
SAP
ComplianceQuest
QT9
SafetyChain
TIP Technologies
Plex Systems
Caliber Technologies

Recent Developments

FEBRUARY 2026

Veeva Systems Releases Assisted Investigation Drafting With Retained Accountability

Veeva Systems released assisted drafting and event clustering for investigations, surfacing prior similar failures automatically while requiring named human review and approval so that audit trail and accountability obligations remain fully intact. Assembly of batch, equipment, and complaint context is automated, which is where most investigation hours were being consumed.
Signal: Vendors are attacking analyst hours rather than workflow speed, because hours are what create the backlog.
OCTOBER 2025

Hexagon Acquires Quality Analytics Developer For Recurrence Measurement

Hexagon completed an acquisition of a quality analytics developer, adding recurrence measurement across historical records so that effectiveness verification can rest on observed data rather than on a reviewer's judgement at closure. Building historical analysis inside a workflow product had proved slow, which the company cited when explaining the purchase.
Signal: Recurrence measurement is being bought because building historical analysis inside a workflow product is slow. Signatures no longer suffice.
JUNE 2025

MasterControl Restructures Pricing Toward Record Volume Not Seats

MasterControl restructured commercial terms around record volume rather than user seats, a pricing model change involving no acquisition or partnership, reflecting quality functions where occasional contributors far outnumber daily system users. Occasional contributors across operations and engineering far outnumber daily system users in any functioning quality process.
Signal: Seat pricing penalises the wide participation that good investigations actually require from operations. Wide participation improves investigations materially.

What This Software Costs To Run

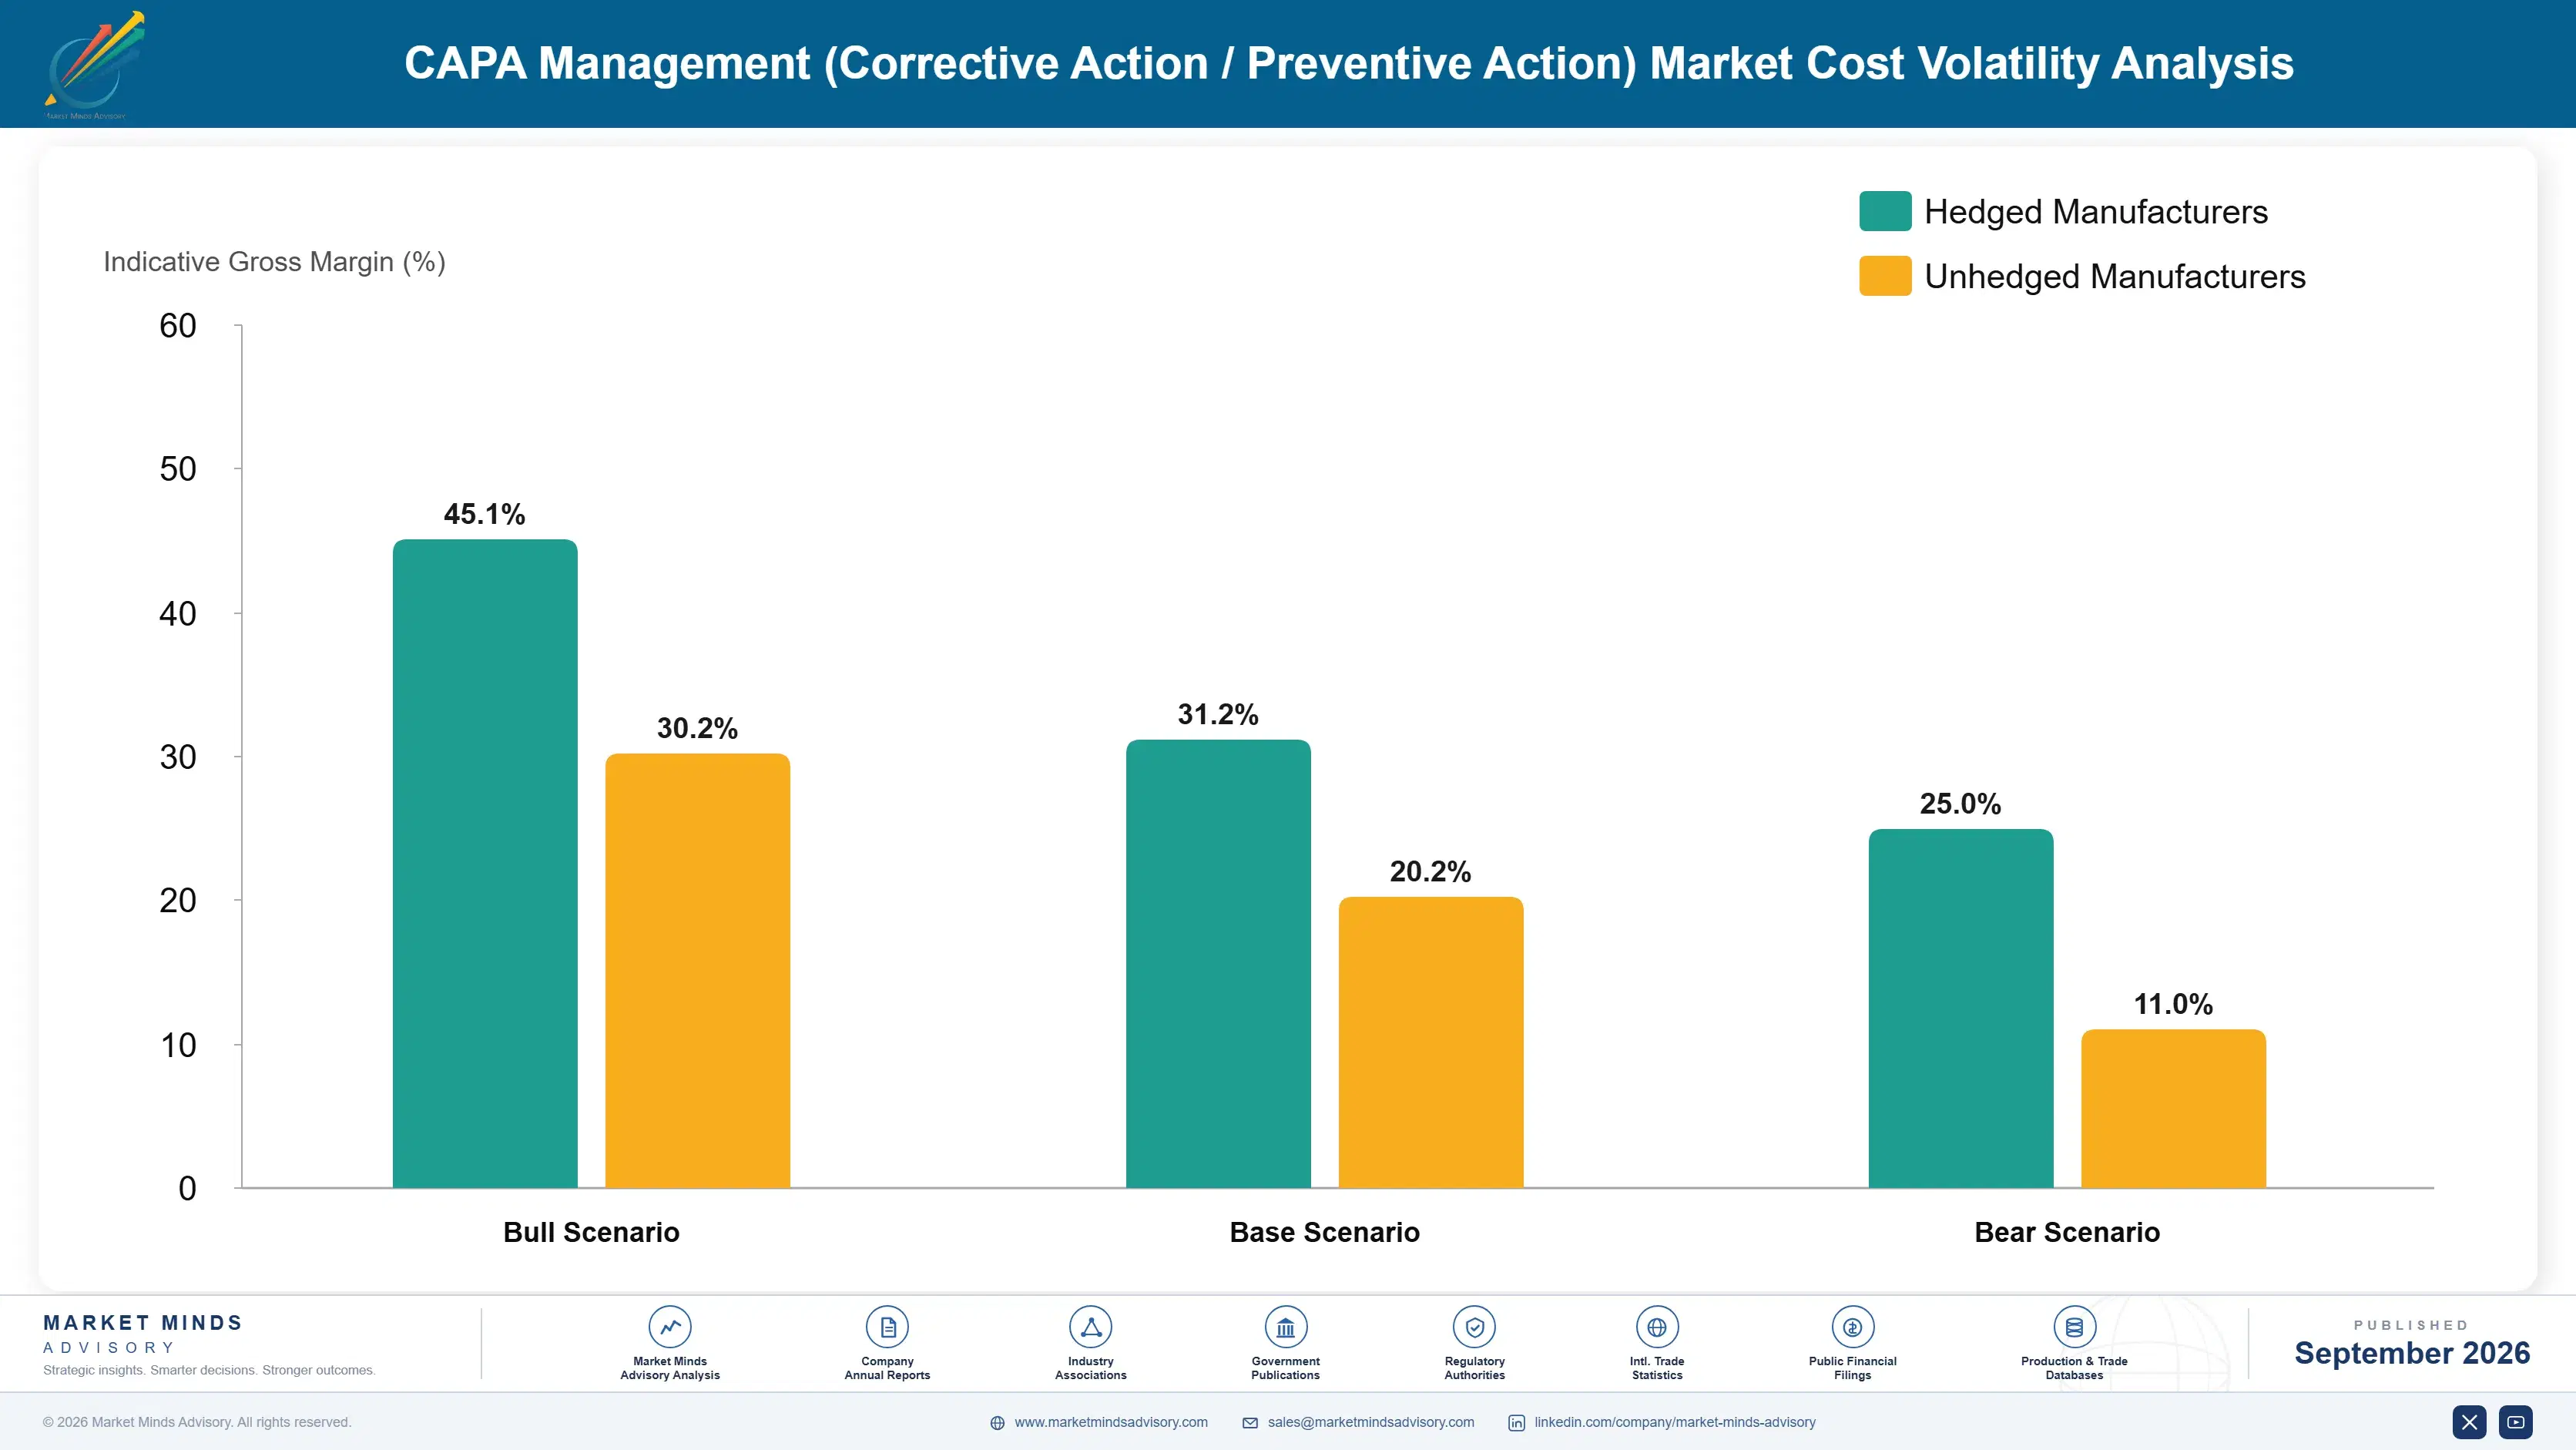
Three input groups dominate cost of revenue. Platform engineering runs 38% to 46%, concentrated in North America, Western Europe, and India. Validation and regulatory documentation take 20% to 28%, which is far higher than comparable enterprise software categories and rises with every release a vendor ships. Cloud hosting and long-term record retention add 16% to 24%, since regulated records must be retained and remain retrievable for many years after closure.
Validation documentation costs rose through 2024 and 2025 as regulators sharpened expectations around computerised system assurance and data integrity, and several vendors described the additional documentation effort in their annual reports for those years. Guidance published by the Food and Drug Administration shifted emphasis toward risk-based assurance, which lowered burden for low-risk functions while raising it for anything touching product quality decisions directly. Vendors shipping frequently carry that cost on every release.

The competitive disadvantage mechanism runs through validation packaging rather than product capability. A vendor who leaves customers to produce their own change documentation finds those customers refuse to upgrade, which freezes them on old versions and makes every subsequent improvement commercially invisible. Exposure varies by vendor type, and platform providers treat it as a customer obligation.
capa-management-market-cost-volatility-analysis-1790011004163

Build Validation Documentation Into The Release Process

Customers who cannot upgrade never experience the product improving, and they renew on price against competitors offering the same ageing capability. Producing change documentation as part of each release costs a defined amount and converts a blocked upgrade path into a reason customers stay, which is worth considerably more than the documentation effort involved.

Tier Retention Storage By Record Age And Access

Regulated records must remain retrievable for many years after closure, yet almost none are accessed after the first two, and undifferentiated storage carries that cost indefinitely. Tiering by age and access pattern reduces hosting cost materially while preserving the retrieval obligation, provided retrieval times still satisfy inspection expectations comfortably. Inspection expectations still have to be met.

Align Assurance Effort With Actual Product Risk

Regulatory guidance now supports risk-based assurance, which permits lighter evidence for functions that do not touch product quality decisions directly. Vendors and customers still applying uniform validation to every function are funding effort no regulator requires, and that misallocation shows up as slower releases rather than as a visible cost line. Slower releases are the hidden cost.

Portfolio Architecture for Margin Defence

Margin follows how hard the capability is to bundle. Intake and action tracking are close to commodity, since enterprise platforms include adequate workflow in systems manufacturers already pay for. Supplier corrective action earns better because it spans organisations. Investigation tooling and recurrence measurement earn most, because both require data connections and analysis that a bundled workflow module cannot provide. Resistance to bundling rather than functional depth decides this entire hierarchy.
The tension between volume and premium runs through regulatory exposure. A manufacturer under light obligation buys the cheapest system that records an action, generates modest revenue, and switches when a suite bundles something adequate. A site whose export access depends on inspection outcomes buys investigation depth, validation packaging, and evidence quality, and rarely changes vendor once validated.

High-value pools concentrate where an inspection finding carries commercial consequence: pharmaceutical and biologics manufacturing, medical devices, and any site whose market access depends on regulatory standing. None of those buyers leads on price. Where quality management is a customer audit requirement rather than a licence condition, workflow is adequate and platform bundling absorbs the work steadily. Nobody pays extra for that.

Volume / Commodity-Adjacent

Intake, action tracking, and basic workflow sold into lightly regulated manufacturing, where enterprise platforms include adequate capability at no incremental charge. The ten-point range reflects validation packaging depth rather than any functional difference between competing products.
Gross Margin: 56% to 66%

Premium / Certified

Validated deployments for regulated manufacturing with documentation packages supplied per release, letting customers upgrade rather than freezing on old versions. The ten-point range separates vendors building validation into releases from those treating it as a customer obligation.
Gross Margin: 70% to 80%

Sustainability / Regulatory / Next-Generation

Investigation tooling, assisted drafting, and recurrence measurement across historical records, none of which a bundled workflow module can supply. The twelve-point range reflects the depth of data connections into batch, equipment, and complaint systems behind each product.
Gross Margin: 76% to 88%
capa-management-market-portfolio-architecture-1790011004665

High-value Sub-segments and Strategic Watch-out

Investigation And Root Cause Tooling

Highest value and fastest growth at 14.7%, attacking the 41 analyst hours a major investigation consumes rather than the routing around it. The twelve-point range reflects data connection depth into batch records, equipment history, and prior event archives. Bundled workflow modules cannot supply any of this.
Gross Margin: 78% to 90%

Recurrence Measured Verification

High value with strong growth at 11.3%, replacing a closure signature with measurement against records the system already holds. The twelve-point range reflects historical analysis depth, since 31% of new records address previously closed failures today. Honest verification makes metrics worse before better. Executive cover is required for that period.
Gross Margin: 72% to 84%

Validated Regulated Deployments

Volume core where inspection exposure makes the purchase a licence condition rather than an efficiency choice. The ten-point range separates vendors supplying validation documentation per release from those leaving customers to produce their own evidence. Frozen customers renew on price rather than merit. Validation packaging decides who upgrades at all.
Gross Margin: 68% to 78%

Basic Workflow And Tracking

The strategic watch-out. Enterprise platforms bundle adequate action tracking into systems manufacturers already run, and lightly regulated buyers see no reason to pay separately. The twelve-point range reflects packaging rather than anything commercially defensible. Pricing pressure here is continuous and one-directional. Lightly regulated buyers see no reason to pay.
Gross Margin: 50% to 62%

How This Revenue Renews

Subscriptions renew annually and expand with site count and module scope rather than with user numbers, which is why seat pricing has been abandoned by several vendors. Quality processes involve occasional contributors across operations, engineering, and supply who far outnumber daily users, and pricing that penalises their participation actively damages investigation quality. Record volume pricing aligns better, though it rewards the defensive escalation that fills these systems unnecessarily.
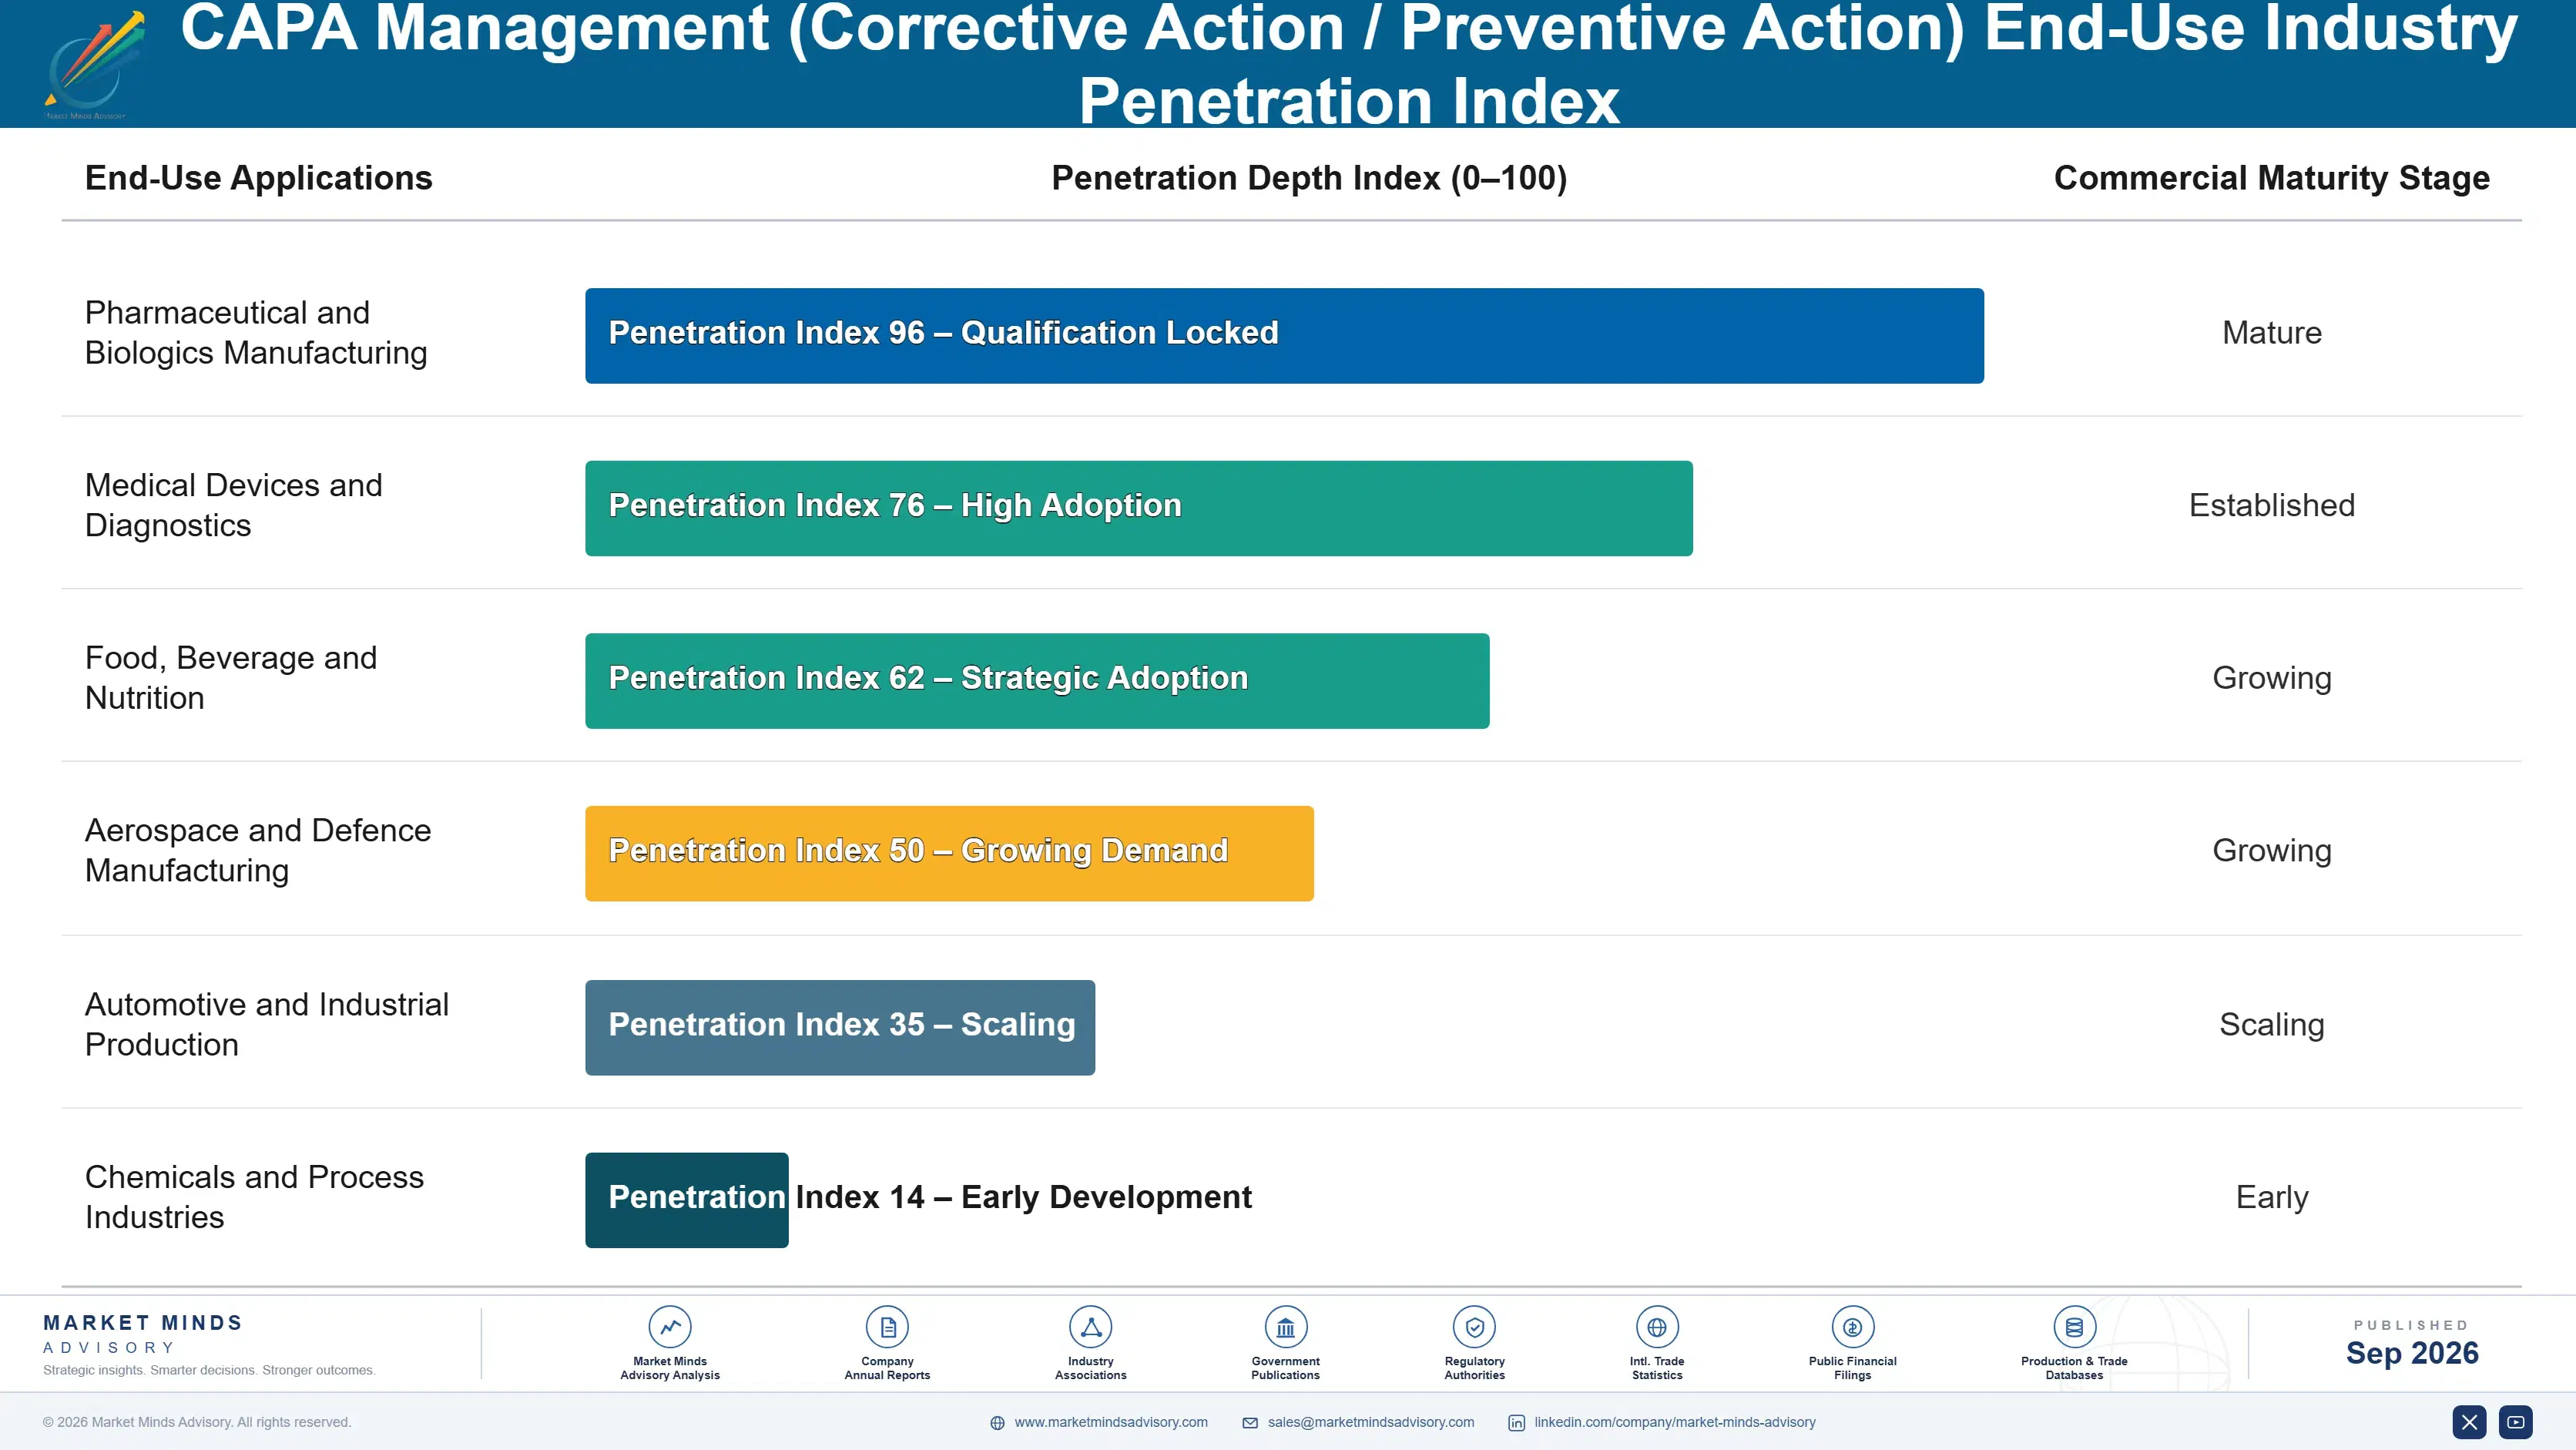
Attachment depth follows validation rather than satisfaction. A manufacturer whose system is validated, whose processes are documented against it, and whose inspectors have seen it will not change vendors without repeating all three under scrutiny. That produces unusually high retention alongside unusually low satisfaction, which is a combination few software categories sustain and none should be comfortable about.

The buyer has moved from quality assurance toward operations and executive leadership. Corrective action systems were once selected by quality managers evaluating workflow configurability. Repeat findings and inspection consequences have raised the decision to operations directors and executives who ask about recurrence rather than about cycle time. Vendors presenting configurability are addressing a participant who no longer decides alone.
capa-management-market-end-use-penetration-index-1790011005191

Where This Market Rewards

These are among the four positions where our research anticipates prominent divergence between winners and laggards over the coming forecast period. Each is grounded in the demand model, the regulatory perimeter, and the announced capacity pipeline.
01 / RECURRENCE EVIDENCE SELLING

Cycle time measures motion, not repair

Around 31% of new records address failures a previous action closed as effective, which is the number quality leadership genuinely cares about and almost nobody sells against directly. Vendors demonstrating recurrence reduction from the customer's own historical records win 3.2 times more competitive replacements than those presenting cycle time gains. Cycle time was always the easier claim, and it measures how fast a record moves rather than whether anything was actually fixed, and quality leadership has understood that distinction for years.
02 / ANALYST HOUR REDUCTION

Backlogs are made of investigation hours

A major investigation consumes about 41 analyst hours, most of it assembling context that already exists inside the manufacturer's own systems rather than analysing anything at all. Assisted drafting and event clustering cut that by 30 to 44% while leaving human accountability and audit trail fully intact. It is the only lever that reduces a backlog rather than reordering it, which is why quality leaders approve it faster than workflow improvements, since the hours saved are visible from the first month.
03 / DEFENSIBLE TRIAGE ENABLEMENT

Queues look safer than decisions, wrongly

Roughly 38% of records escalate beyond what risk assessment required, because declining to open a formal action is harder to defend in an inspection than a long queue appears to be. Systems capturing triage rationale that survives scrutiny let quality functions close minor events properly, and customers report record volumes falling by around a quarter. The guidance already permits this; what was missing was defensible evidence, and serious investigations then get the attention they need, which is what the whole process was supposed to deliver.
04 / UPGRADE PATH OWNERSHIP

Customers frozen on old versions renew reluctantly

Validation obligations make manufacturers reluctant to upgrade, which freezes poor practice for years and makes every improvement a vendor ships commercially invisible to the installed base. Suppliers providing pre-validated configurations and change documentation per release report upgrade adoption 2.6 times higher. Customers who upgrade regularly experience the product improving and renew far more reliably than those remembering the version they originally bought, which is a weak position to defend at renewal, against competitors offering the same ageing capability elsewhere, and every improvement stays commercially invisible meanwhile.

Engagement Snapshot From the Field

A live engagement with an industry participant carrying material or product regulatory and market exposure ahead of a defining policy shift, showing how our research translates into a defensible multi-year portfolio strategy.
MARKET MINDS ADVISORY · CLIENT ENGAGEMENT SUMMARY
CAPA Management (Corrective Action / Preventive Action) Producer Strategic Portfolio Review and Transition Roadmap 2026·Investment Scenario on CAPA Management (Corrective Action / Preventive Action) Exposure Evaluation 2025-26
CLIENT PROFILE
A pharmaceutical manufacturer operating seven sites across four countries, opening roughly 4,800 deviation records annually and carrying approximately 610 open corrective actions at any time. Quality system software and associated validation cost around USD 2.4 million yearly (client-reported, unverified by MMA), across two platforms inherited through acquisition. Neither platform shared historical records with the other at any point.
STRATEGIC CHALLENGE
A regulatory inspection had cited both overdue closures and inadequate effectiveness verification at the largest site, and the executive response had been to add quality headcount. Nobody had established whether the backlog reflected insufficient capacity or an excessive number of records that should never have been opened at all. Headcount had already been approved.
MMA APPROACH
MMA sampled 400 closed corrective actions across three sites, tested each against subsequent recurrence of the same failure, and separated records by whether a documented risk assessment had justified escalation. Analyst hours per investigation were measured directly rather than taken from system timestamps. Record histories were compared across both inherited platforms for duplicate failures.
KEY FINDINGS
  1. Of sampled closures, 34% were followed by recurrence of the same failure within eighteen months, and in 21 cases the recurrence had itself been closed as effective previously.
  2. Around 41% of records had been escalated to formal corrective action without any documented risk rationale, and most concerned events the site's own procedures classified as minor.
  3. Investigations averaged 44 analyst hours, of which roughly 29 went on assembling batch, equipment, and complaint context that existed elsewhere in the company's systems.
  4. The two inherited platforms held no shared history, so investigators at one site could not see that the identical failure had been investigated twice at another.
CLIENT PROFILE
A pharmaceutical manufacturer operating seven sites across four countries, opening roughly 4,800 deviation records annually and carrying approximately 610 open corrective actions at any time. Quality system software and associated validation cost around USD 2.4 million yearly (client-reported, unverified by MMA), across two platforms inherited through acquisition. Neither platform shared historical records with the other at any point.
STRATEGIC CHALLENGE
A regulatory inspection had cited both overdue closures and inadequate effectiveness verification at the largest site, and the executive response had been to add quality headcount. Nobody had established whether the backlog reflected insufficient capacity or an excessive number of records that should never have been opened at all. Headcount had already been approved.
MMA APPROACH
MMA sampled 400 closed corrective actions across three sites, tested each against subsequent recurrence of the same failure, and separated records by whether a documented risk assessment had justified escalation. Analyst hours per investigation were measured directly rather than taken from system timestamps. Record histories were compared across both inherited platforms for duplicate failures.
KEY FINDINGS
  1. Of sampled closures, 34% were followed by recurrence of the same failure within eighteen months, and in 21 cases the recurrence had itself been closed as effective previously.
  2. Around 41% of records had been escalated to formal corrective action without any documented risk rationale, and most concerned events the site's own procedures classified as minor.
  3. Investigations averaged 44 analyst hours, of which roughly 29 went on assembling batch, equipment, and complaint context that existed elsewhere in the company's systems.
  4. The two inherited platforms held no shared history, so investigators at one site could not see that the identical failure had been investigated twice at another.
RECOMMENDED STRATEGY
Phase 1: Phase one: introduce documented risk triage so minor events close without formal action, reducing intake before adding any further quality headcount. Phase 2: Phase two: consolidate onto one platform with shared historical records, so recurring failures become visible across sites rather than only within them. Phase 3: Phase three: connect batch, equipment, and complaint data into investigations directly, removing the assembly work that consumes most analyst hours.
OUTCOME
Formal corrective action volume fell 38% within three quarters while serious investigations received more time (client-reported, unverified by MMA). Overdue closures dropped from 26% to 9%. The proposed headcount addition was cancelled and redirected toward the platform consolidation. Shared history revealed four recurring failures previously invisible across sites.

Frequently Asked Questions

Foundational context covering the market sizes, CAGR, scope, country, region and competition that inform every finding below. This section is provided to cover basics and most often pre-purchase conversations, answered from the MMA Primary Research Dataset.

What is the current size of the CAPA Management Market?

The market was worth USD 1.9 billion in 2025 and reaches USD 2.1 billion in 2026. Value covers corrective and preventive action software, excluding consulting and broader manufacturing systems.

How large will the CAPA Management Market be by 2036?

MMA forecasts USD 5.3 billion by 2036, an increase of USD 3.2 billion across the forecast period. That represents 2.52 times the 2026 base of USD 2.1 billion.

What is the CAGR for the CAPA Management Market 2026 to 2036?

The base case compound annual growth rate is 9.8%, with a bull case at 11.0% and a bear case at 8.6%. Historical growth from 2020 to 2025 ran at 8.8%.

Which segment is growing fastest?

Investigation and root cause tooling grows at 14.7%, half again the market rate of 9.8%. Faster approval routing never made a cause any easier to identify.

Who are the major companies in the CAPA Management Market?

Veeva Systems, MasterControl, Honeywell, Hexagon, and Siemens lead, together holding 44% of subscription revenue. Life sciences suites and broad industrial platforms serve quite different buyers.

Which country is growing fastest?

India grows at 14.6%, driven by pharmaceutical manufacturing sites serving regulated export markets where inspection outcomes decide commercial access rather than merely compliance standing alone.

Report Segmentation Architecture

The full report scope spans multiple orthogonal segmentation dimensions, with cross-tabulated demand data provided for each dimension pair. Coverage extends further to regional breakdowns, trend trajectories, and the competitive detail needed to support segment-level decision-making.

By Functional Module

  • Deviation and Nonconformance Intake
  • Investigation and Root Cause Tooling
  • Action Plan and Task Management
  • Effectiveness Verification and Closure
  • Supplier and External Corrective Action
  • Audit Finding and Inspection Response

By End-Use Industry

  • Pharmaceutical and Biologics Manufacturing
  • Medical Devices and Diagnostics
  • Food, Beverage and Nutrition
  • Aerospace and Defence Manufacturing
  • Automotive and Industrial Production
  • Chemicals and Process Industries

By Commercial Dimension

  • Validated Enterprise Subscription
  • Single Site Deployment
  • Contract Manufacturer Supply
  • Enterprise Platform Bundled Module
  • Implementation and Validation Service
  • Supplier Network Participation

By Region

  • North America
  • Western Europe
  • East Asia
  • South Asia and Pacific
  • Latin America
  • Middle East and Africa
  • Eastern Europe

Scope, Methodology, and Coverage

Every figure in this report is reproducible from documented input assumptions. The scope below maps the historical period, the forecast horizon, the segmentation dimensions, and the countries covered, alongside the underlying primary and qualitative methodology.
Historical Period
2020 to 2025
Forecast Period
2026 to 2036
Base Year
2025 (USD billions; MMA Primary Research Dataset, September 2026)
Market Definition
This market covers software for managing corrective and preventive action processes, including deviation and nonconformance intake, investigation and root cause tooling, action plan and task management, effectiveness verification and closure, supplier and external corrective action, and audit finding and inspection response. It excludes enterprise resource planning and manufacturing execution systems, laboratory information management, standalone document control, complaint intake systems, and quality consulting services.
Quantitative Units
USD billions, subscription and validation service revenue
Segmentation Dimensions
Functional module, end-use industry, commercial dimension, region
Regions Covered
North America, Western Europe, East Asia, South Asia and Pacific, Latin America, Middle East and Africa, Eastern Europe
Countries Covered
United States, Canada, Mexico, Germany, Switzerland, Ireland, United Kingdom, France, Italy, Denmark, Netherlands, Belgium, China, Japan, South Korea, Taiwan, India, Singapore, Australia, Indonesia, Brazil, Mexico, Argentina, Colombia, Saudi Arabia, United Arab Emirates, Egypt, South Africa, Poland, Hungary
Key Companies Profiled
Veeva Systems, MasterControl, Honeywell, Hexagon, Siemens, Cority, Intelex, Ideagen, Qualio, Greenlight Guru, AssurX, PTC, Dassault Systemes, SAP, ComplianceQuest, QT9, SafetyChain, TIP Technologies, Plex Systems, Caliber Technologies
Quantitative Methodology
Primary survey, n=3,800 respondents, Q4 2025, six countries; demand-side model with trade association cross-validation
Qualitative Methodology
47 expert interviews, Q4 2025; applied to validate demand model assumptions, identify emerging dynamics, and assess competitive positioning
Report Format
PDF and XLSX data workbook (Word format preview document)
Publisher
Market Minds Advisory
Report Code
MMA-2026-TEC-781
Published
September 2026
Contact
sales@marketmindsadvisory.com | www.marketmindsadvisory.com

Purchase the full CAPA Management (Corrective Action / Preventive Action) Market Report (2026 to 2036).

The full report sizes the corrective and preventive action software market across six functional modules, seven regions, and thirty countries, with forecasts to 2036 under base, bull, and bear cases. It examines why repeat failures persist despite near universal deployment, how defensive escalation manufactures the backlog that inspectors then cite, and what assisted investigation does to analyst hours. Competitive analysis covers twenty participants evaluated consistently on subscription revenue, with detailed treatment of validation packaging and data connection depth. Cost structure, margin architecture, and regional regulatory drivers are analysed throughout. Primary research includes 3,800 survey responses and 47 expert interviews.
Six functional modules sized and forecast separately
Twenty participants evaluated on subscription and validation revenue
Regional regulatory exposure mapped across seven distinct geographies
Margin architecture by module and bundling resistance
Recurrence and escalation benchmarking across regulated manufacturing sites
Investigation hour analysis measured against backlog and closure performance

Built For The People Who Decide

From boardroom strategy to bench-side execution, this report is read cover-to-cover by leaders shaping the next decade of their industry, turning demand scenarios, market dynamics and valuation benchmarks into decisions.
CXOs/ Presidents/ VPs/ Managers
M&A and Corporate Development
Strategy Teams and R&D Heads
Procurement and Product Directors
Regulatory and Compliance Leaders
Investor Relations and Equity Analysts