Market Minds Advisory
Canned Vegetable Market

Canned Vegetable Market: Canned Vegetable Market. Private Label Pressure and Premium Blends Reshape a Mature Pantry Category.

Pantry-stocking habits keep canned vegetables relevant, yet fresh and frozen competition, rising steel and energy costs, and sodium scrutiny are forcing processors to rethink formats, pack sizes, and premium positioning across retail.

Lead Analyst

Published

September 2026

Make Smarter Decisions with Customized Research Insights

Request a free sample report and evaluate market opportunities, growth trends, and competitive dynamics relevant to your business needs.

2025 MARKET VALUE$95.0BMarket Size 2025
2036 FORECAST VALUE$143.2BBase Case , 2026 to 2036
CAGR 2026 TO 20363.8 %Bull 5.0% / Bear 2.6%
INCREMENTAL OPPORTUNITY$44.6BNet 10- year value creation
EXPANSION MULTIPLE1.45x2036 value over 2026 base
Strategic Levers
M&A Pipeline
Regional Outlook
Country Rankings
Competitive Intelligence
Segmental Deep-dive
Call-Us : 91 93563 13602

Executive Snapshot and Market Trajectory.

Canned vegetables remain a pantry staple, but the category is splitting in two. Basic commodity cans face steady price pressure from private label, while blended, organic, and low-sodium formats earn premiums as households trade up for convenience and perceived quality. Processors are responding with tighter portfolios now.
Prepared blends and beans lead growth, helped by meal-solution demand and plant-based eating, while tomatoes and sweet corn anchor volume. North America and Western Europe still carry the largest consumption, yet the Middle East, Eastern Europe, and South Asia are growing faster as urbanization and modern retail widen access to shelf-stable food. Steel, energy, and crop yields swing margins from one pack season to the next. Newer entrants compete on organic claims.
Competition rests on procurement scale, seasonal crop contracting, and can-line efficiency rather than brand alone, since private label holds a large share of shelf space. Sodium and BPA-free lining rules add reformulation cost, and tariffs on tinplate steel have pushed several regional processors toward consolidation or exit. Retailers increasingly demand multi-year contracts, which favor processors with several plants and diversified sourcing regions. Weather-driven crop swings complicate planning.
Market Definition
Canned vegetables comprise commercially sterilized vegetables, tomatoes, corn, beans, and legumes packed in metal cans and retorted for ambient shelf life. The scope excludes frozen, fresh, pouch-only, and glass-jar products, as well as canned fruit, soups, and finished sauces.
Base Year Value
$95.0B in 2025 (MMA Primary Research Dataset, September 2026)
Forecast Period
2026 to 2036, eleven discrete annual values
CAGR
3.8% base case. Bull 5.0%. Bear 2.6%.
Fastest Growth Segment
Prepared Vegetable Blends: 5.6% CAGR
Fastest Growth Country
India: 6.5% CAGR
Fastest Growth Region
South Asia and Pacific: 5.8% CAGR
Largest Region
North America: 27% of 2025 global value
Market Leaders
Del Monte Foods, Conagra Brands, Bonduelle Group, Seneca Foods, Del Monte Pacific. Source: MMA Analysis, company annual reports.
Primary Survey
n=3,800 procurement and R&D decision-makers, Q4 2025, six countries
Methodology
Demand-side build-up, cross-validated against public data, 47 expert interviews

Canned Vegetable Market Forecast Scenarios

canned-vegetables-market-size-forecast-scenario-1789747426703
Between 2020 and 2025, canned vegetable demand spiked during pandemic pantry loading, then normalized as households returned to fresh and frozen options. Growth averaged 3.4% a year, held up by inflation-driven trade-down toward private label and by steady foodservice and institutional purchasing that kept can volumes resilient throughout the period. Foodservice buyers and private label programs added dependable volume through the period.
The base case assumes 3.8% annual growth through 2036, built on three mechanisms: prepared blends and beans gaining share as meal solutions, rising shelf-stable consumption in urbanizing import-dependent markets across the Middle East and South Asia, and price realization as processors pass through steel and energy inflation. Recycling-friendly steel cans also help the format defend its sustainability credentials against plastic pouches. Retailer demand for recyclable packaging further supports steel cans over plastic alternatives.
The bull case, reaching 5.0%, needs faster premium and organic adoption plus stronger emerging-market retail expansion. The bear case, falling to 2.6%, reflects sustained tinplate tariffs and poor harvests squeezing margins, while cheaper frozen vegetables and fresh-cut value packs pull volume away from the can in mature markets. Either outcome would shift bargaining power toward retailers.

Private Label Scale Meets Premium Blend Innovation

Canned vegetables are a seasonal manufacturing business dressed as a grocery category. Crops are harvested over a few weeks, processed within hours, and sold for years, so plants run flat out in summer and sit half idle the rest of the year. That rhythm rewards processors who contract acreage early, keep lines flexible across several crops, and hold inventory without discounting. Inventory carrying costs matter.
MARKET CONCENTRATION24% CR5Top five processors hold a modest combined share
AVERAGE SELLING PRICE$1.45 per canPrivate label undercuts national brands by a wide margin
TOP PRODUCING COUNTRY22% shareLeading producer supplies a large portion of global output
PRIVATE LABEL SHARE41%Store brands hold the largest slice of shelf space
STEEL COST SHARE28% of COGSTinplate remains the largest single input after crops
PLANT UTILIZATION RATE68%Seasonal packing leaves lines idle for much of year
Private label reshapes the economics. Retailers buy large volumes on annual bids, and processors that win them fill capacity while accepting thin margins, whereas national brands defend price through blends, organic lines, and reduced-sodium recipes. Can makers matter too: tinplate and coating suppliers set a cost floor, and lining rules on bisphenol compounds force reformulation every few years. Coatings and lids add further complexity.
Demand is broadening geographically. In import-dependent regions, canned tomatoes, beans, and mixed vegetables serve as safe shelf-stable protein and produce, especially where cold chains are patchy. Mature markets see the opposite pull: fresh-cut and frozen options erode plain cans, so growth there depends on convenience formats, easy-open ends, and clearer nutrition messaging around sodium and fiber content. Growth therefore favors nimble exporters.
"The can is the cheapest cold chain ever invented, and that is why it keeps winning in places fresh produce cannot reach. Mature markets are where the fight for relevance happens."
Practice Lead, Agricultural Commodities and Packaged Food Practice · MMA Agricultural Commodities and Packaged Food Practice · September 2026

Market Trends

Low-Sodium and Clean-Label Reformulation Spreads Across Brands

Retailers and consumers are pushing processors to cut added sodium, drop bisphenol-based can linings, and simplify ingredient lists. Several major brands now market no-salt-added and organic lines, and regulators in North America and Europe keep tightening sodium guidance for processed foods. Reformulating recipes and switching to non-bisphenol linings costs money and needs retort validation, so smaller regional processors struggle to keep pace while larger groups absorb the cost across wide portfolios. Compliance timelines vary by country, forcing multinational brands to maintain several recipe versions and to validate new linings across every plant before shipping.
Market Impact: institutional demand up 4% yearly

Prepared Blends Convert Commodity Cans Into Meal Solutions

Households want dinner solutions rather than single vegetables, so processors are launching seasoned blends, ready-to-heat vegetable mixes, and bean-based sides with sauces. These prepared formats carry higher prices per ounce than plain cans and shift purchasing from commodity bids toward brand-led negotiations. They also require more complex recipes, additional filling lines, and closer collaboration with sauce suppliers, which favors processors with strong product development teams and flexible multi-format plants. Retailers reward these products with permanent shelf space when sales hold up, which encourages processors to invest in proprietary sauces and seasoning blends instead.
Market Impact: emerging markets growing 5.8% annually

Market Opportunities and Growth Drivers

Inflation Drives Households Toward Shelf-Stable Value Staples

Rising food inflation has pushed many households toward shelf-stable staples that cost less per serving than fresh or frozen alternatives. Canned vegetables offer long shelf life, minimal waste, and predictable pricing, which appeals to budget-conscious families and institutional buyers such as schools, hospitals, and food banks. Government nutrition programs in several countries also specify canned produce, providing steady volume that supports plant utilization when retail demand softens or promotional cycles fluctuate. Foodbanks and school meal programs also buy in bulk, which stabilizes processor order books during years when consumer promotions weaken.
Market Impact: steel adds 28% of production cost

Urban Retail Expansion Opens Import-Dependent Regions

Urbanization and modern retail expansion in the Middle East, Africa, and South Asia are opening new markets for canned tomatoes, beans, and mixed vegetables. Consumers in cities with unreliable cold chains value ambient products that store safely at home for months. Importers and regional processors are adding local canning capacity, and supermarket chains list branded and private-label cans side by side, which widens the addressable market beyond traditional Western pantry shoppers. Regional canning investments are also lowering delivered prices, which broadens demand among lower-income households that previously relied on informal fresh markets alone.
Market Impact: plain can volumes falling 2% yearly

Market Restraints and Challenges

Tinplate Steel Tariffs Compress Processor Margins Sharply

Tinplate steel is the largest packaging cost, and tariffs plus limited domestic tinplate capacity in some regions have raised can prices sharply. The root cause is concentrated steel supply combined with trade measures that restrict imports. Processors absorb part of the increase, but retailers resist price rises, compressing margins. Mitigation includes lightweighting cans, qualifying alternative tinplate suppliers, and negotiating index-linked contracts that share steel volatility between processor and retailer. Larger groups with captive can supply or long-dated contracts weather the squeeze better, while independent canneries have little room to negotiate with suppliers.
Market Impact: low-sodium lines now 18% of launches

Fresh and Frozen Alternatives Erode Mature Market Volume

Fresh and frozen vegetables are more available year-round and are widely viewed as healthier, which pulls younger shoppers away from cans. The root cause is improved cold-chain logistics and marketing that frames canned food as heavily processed. Volume erodes in mature markets, especially for plain corn and green beans. Processors respond with easy-open packs, single-serve sizes, transparent nutrition labeling, and messaging that highlights nutrient retention from canning shortly after harvest. Sales of plain cans of corn and green beans are hit hardest, while beans and tomatoes prove more resilient because cooks rely on them as recipe ingredients.
Market Impact: blend segment growing 5.6% annually
3 additional market trends, 4 additional growth drivers, and 2 additional restraints and challenges are covered in the full report. Contact sales@marketmindsadvisory.com to access the complete intelligence.

Segment CAGR and Growth Architecture

Canned vegetables are segmented by vegetable type, because crop economics, seasonality, and consumer use differ sharply between tomatoes, corn, legumes, and blends. Prepared blends and beans are growing fastest as meal solutions gain share, while plain single-vegetable cans grow slowly and depend on private label volume and promotions. Blends and beans therefore attract most new investment.
canned-vegetables-market-market-share-analysis-1789747426961

Prepared Vegetable Blends

Prepared vegetable blends are the fastest-growing segment, covering seasoned mixes, vegetable-and-sauce packs, and ready-to-heat combinations that turn a can into a side dish or meal component. These products command higher prices per ounce and are less exposed to private label bidding because recipes and sauces are proprietary. Growth is strongest in North America and Western Europe, where time-pressed households value convenience, and processors are adding dedicated blending lines to capture the premium. Retailers reward the segment with permanent shelf space when sell-through holds, which encourages processors to invest in proprietary sauces and recipes. Competitors find it harder to copy these products quickly, so margins hold up better than in plain cans and promotional discounting stays limited across most accounts.
CAGR 5.6%

Beans and Legumes

Beans and legumes are the second-fastest segment, supported by plant-based eating, low cost per gram of protein, and strong use in both home cooking and foodservice. Chickpeas, black beans, and kidney beans are gaining shelf space, and organic and no-salt-added versions carry premiums. Import-dependent regions in the Middle East and Africa rely on canned beans as a staple, while Latin American processors are expanding local capacity to serve domestic and export demand. Foodservice operators also buy large volumes for burritos, salads, and soups, which adds stable demand. Suppliers that offer organic, low-sodium, and regional varieties can earn modest premiums, but crop swings and retailer bidding still limit how much pricing power they can capture.
CAGR 4.8%
Full segment breakdown across 6 segments available in the complete report.

Regional Architecture and Country Demand Map

Canned vegetable value follows established consumption habits and import dependence, not just crop geography. North America and Western Europe remain the largest buyers, while the Middle East, Eastern Europe, and South Asia post faster growth from smaller bases as modern retail widens access across the forecast period.

North America

North America holds 27% share because United States households buy canned vegetables at unmatched volume, and Del Monte, Conagra, and Seneca operate large Midwestern and Western packing networks close to the crops. Private label captures more than a third of units at major grocers, and institutional channels supply steady demand. Growth is modest, so margin depends on blends, organic lines, and steel cost pass-through rather than volume alone. Foodservice and institutional channels, including schools, hospitals, and food banks, add steady volume that supports plant utilization when retail demand softens. Higher labor, freight, and steel costs are pushing processors toward consolidation of smaller plants, while retailers ask for recyclable packaging claims and clearer sodium labeling on every shelf.
Share: 27% | CAGR: 3.5% (2026 to 2036)

Western Europe

Western Europe holds 21% share, led by Italy, Spain, France, and the United Kingdom, where tomatoes and legumes dominate production and consumption. Italian processors export canned tomatoes worldwide, while French and British retailers push private label and organic ranges. Regulation on packaging recycling and sodium shapes formulations, and mature demand means growth comes from convenience formats and premium regional provenance instead of new consumers. Tomato and legume processors in Italy and Spain export heavily, and price competition from non-European canneries keeps margins under watch. Recycling rules and sodium guidance shape recipes, while shoppers increasingly ask for regional origin and lower environmental impact from the products they buy each and every week.
Share: 21% | CAGR: 2.0% (2026 to 2036)
Regional intelligence for 5 additional markets available in the complete report: East Asia, South Asia and Pacific, Latin America, Middle East and Africa, Eastern Europe. Contact sales@marketmindsadvisory.com.
canned-vegetables-market-country-cagr-analysis-1789747427281

Four Margin Levers Behind Canned Vegetable Profits

Margin in canned vegetables comes from procurement discipline and product mix rather than raw volume, since plain cans face relentless private label pricing. Processors that pair early crop contracting with prepared blends, plant efficiency, and packaging cost control keep returns above the category average even when steel and energy costs move against them each season.

Shifting Mix Toward Prepared Vegetable Blends

Prepared blends sell at 30% to 50% more per ounce than plain vegetables, because sauces, seasonings, and multi-vegetable recipes justify premium shelf pricing and reduce direct comparison with private label. Processors that add blending lines and develop signature recipes can hold margin even during promotional cycles. The investment requires additional filling equipment and recipe development, but payback is usually short once retailers grant permanent shelf space to the range. Investment in blending lines and recipe development is modest compared with the pricing gain, and payback usually arrives within two seasons once retailers list the range.
Market Impact: blend pricing runs 30% to 50% higher overall

Contracting Acreage Early to Lock Crop Costs

Processors that contract acreage and pricing with growers before planting reduce exposure to spot crop swings that can move raw material cost by 15% or more between seasons. Multi-year grower agreements also secure quality specifications and harvest timing, which supports plant utilization during the short packing window. Companies with diversified sourcing across regions gain further protection when local weather damages a crop and competitors scramble for scarce supply. Growers value multi-year commitments and tend to prioritize processors that pay reliably, so contracting also improves crop quality and delivery timing during tight harvest windows.
Market Impact: early contracts cut crop cost swings by 15%

Lightweighting Cans and Qualifying Alternative Steel Suppliers

Tinplate is roughly 28% of cost of goods, so trimming can wall thickness and qualifying additional steel suppliers directly protects margin. Lightweighting programs can reduce steel use per can by 5% to 8%, and index-linked supply contracts share volatility with retailers. These moves need engineering testing and retort validation, but larger processors can spread the cost across billions of cans and make sizeable savings each season. Processors report that lightweighting projects typically pay back within one or two seasons, and index-linked contracts prevent the sudden margin losses that follow abrupt steel price moves in tariff-driven markets.
Market Impact: steel savings of 5% to 8% per can

Raising Plant Utilization Through Multi-Crop Scheduling

Seasonal packing leaves lines idle for much of the year, so processors that schedule several crops across the calendar, from tomatoes in late summer to beans and root vegetables afterward, lift utilization from roughly 68% toward 75%. Higher utilization spreads fixed labor and energy cost over more cases and reduces per-unit cost. Achieving it requires flexible lines, careful inventory planning, and warehouse capacity for finished stock. Doing so also allows processors to spread fixed labor and energy cost across more cases, and it makes the business less dependent on a few large private label contracts that reset each year.
Market Impact: utilization gains of 7 points cut unit cost

Who Controls the Margin Pool

Canned vegetables are moderately fragmented, with the top five processors holding about 24% of global revenue, the basis used throughout this section. Del Monte and Conagra lead in North America, while Bonduelle dominates parts of Europe, yet many regional and private-label specialists still supply significant volume to retailers under contract. Together they still leave most of the market fragmented.
Competitive activity centers on three fronts: private label contract wins, premium blends and organic lines, and cost control through steel sourcing and plant efficiency. Processors are consolidating plants to raise utilization, investing in recyclable packaging claims, and building relationships with retailers that want multi-year supply and reliable harvest-season delivery. Sodium and lining reformulation add development cost that smaller firms find hard to absorb. Customer service performance during harvest peaks also counts.

Emerging pressure comes from Asian and Eastern European processors offering lower-cost cans to import-dependent markets, and from frozen and fresh-cut products gaining share in mature retail. Retailers can also switch private label suppliers quickly, so contract loss risk is real. Rankings shift most through acquisitions of regional canneries, which give buyers new sourcing regions and let sellers exit low-return commodity lines. Buyers of canneries are mostly regional consolidators.
canned-vegetables-market-company-positioning-matrix-1789747427596

Competitive Moat and Risk Dimensions

DEL MONTE FOODS

Moat: Brand Plus Private Label Scale

Del Monte combines a recognized national brand with large private label production volumes, which keeps its plants busy through the packing season. Scale in crop contracting, steel purchasing, and distribution gives it cost advantages over smaller regional canneries and helps it win retailers seeking a single dependable supplier across many vegetable categories.
DEL MONTE FOODS

Risk: Commodity Exposure and Leverage Burden

Heavy reliance on plain commodity cans leaves Del Monte exposed to steel, crop, and energy swings that it cannot always pass through to retailers. Financial obligations limit its ability to fund premium innovation, so competitors with lighter balance sheets can outpace it in blends, organic lines, and convenience formats.
CONAGRA BRANDS

Moat: Portfolio Breadth and Retail Access

Conagra sells canned vegetables alongside a wide range of shelf-stable and frozen products, which gives it negotiating weight with grocers and lets it cross-promote brands. Its marketing budget and product development teams support blends and reduced-sodium lines, and its logistics network delivers consistent service to large retail and foodservice customers.
CONAGRA BRANDS

Risk: Category Not Core Priority

Canned vegetables are a small part of Conagra's much larger portfolio, so the business competes internally for capital against faster-growing categories. Management attention may favor frozen and snack lines, leaving specialist processors to move faster on category-specific innovation and regional sourcing. Decisions may therefore lag more focused rivals.

Players Tracked

Prominent Players

Del Monte Foods
Conagra Brands
Bonduelle Group
Seneca Foods
Del Monte Pacific

Other Key Players

B&G Foods
Princes Group
La Doria S.p.A.
Mutti S.p.A.
Kagome Co. Ltd.
Hanover Foods Corporation
Lakeside Foods
Allens Inc.
Pacific Coast Producers
Bolton Group
Tiger Brands
Conserve Italia
Hero Group
COFCO Tunhe
Golden Circle Limited

Recent Developments

MARCH 2026

Seneca Foods Adds Blended Vegetable Line

Seneca Foods completed an organic capacity expansion at a Midwestern plant, adding a dedicated line for seasoned vegetable blends and no-salt-added ranges. The project is internal capital spending, not an acquisition. It lets Seneca respond faster to retailer requests for premium formats without diverting capacity from its private label contracts.
Signal: Shows even commodity-focused processors now invest in blends to defend margins against private label pressure in mature markets.
OCTOBER 2025

Bonduelle Signs Multi-Year Retail Supply Agreement

Bonduelle signed a multi-year supply agreement with a European grocery chain covering canned sweet corn, peas, and mixed vegetables under private label and branded ranges. The deal is a commercial contract, not an equity transaction. It fixes volumes and pricing mechanisms linked to steel cost indices, giving both sides visibility.
Signal: Confirms multi-year contracts with steel-indexed pricing are becoming standard between large processors and retailers across the whole industry.
JANUARY 2026

Del Monte Pacific Acquires Regional Cannery

Del Monte Pacific completed the acquisition of a Asian cannery producing tomatoes and mixed vegetables for regional markets. The purchase adds sourcing regions and packing capacity outside its core geographies. The plant will serve growing supermarket demand in Southeast Asia while giving the company a lower-cost base for exports.
Signal: Reflects consolidation of regional canneries as processors buy capacity in faster-growing import-dependent markets across several growing regions.

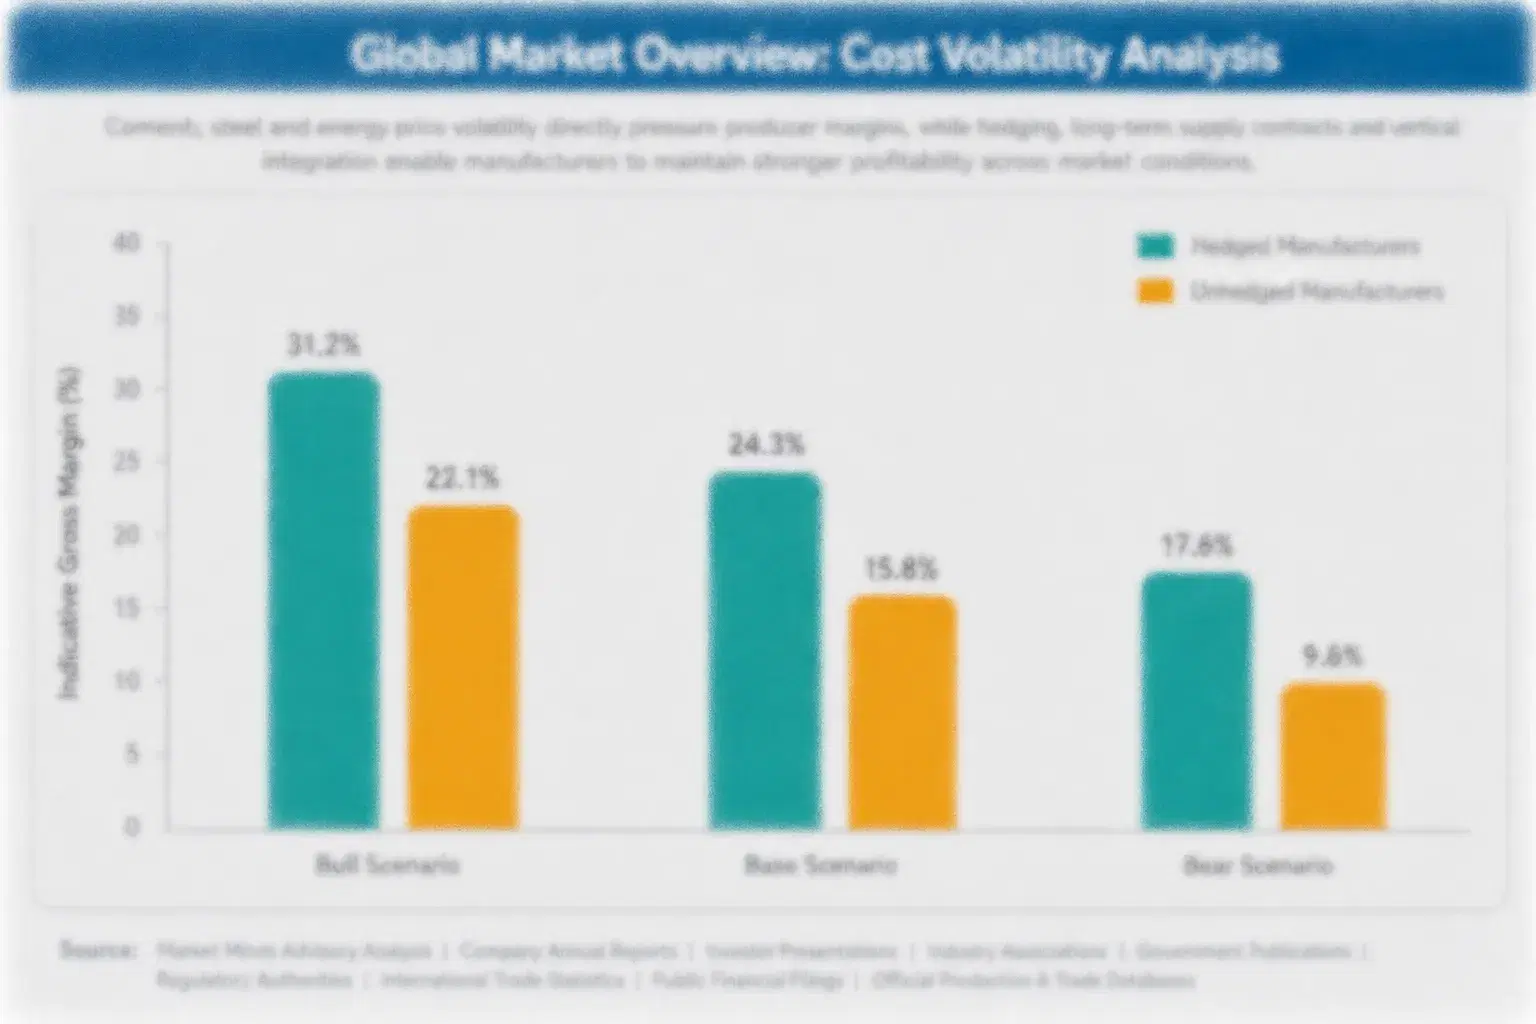
What Drives Canned Vegetable Costs

Raw vegetables account for roughly 35% to 40% of cost of goods, sourced from contracted growers within a few hours of each plant. Tinplate steel for cans adds about 28%, with energy for retorting, labor, and labels making up most of the remainder. Steel comes from a small group of producers, and regional supply gaps can raise delivered costs.
Tinplate prices rose sharply after 2018 United States tariffs on imported steel, according to the U.S. International Trade Commission, and can costs stayed elevated for several years. Seneca Foods' fiscal 2023 annual report cited higher steel and can costs as a major driver of margin pressure. Processors passed on part of the increase through price actions, though retailers resisted, so many absorbed a meaningful share.

Exposure varies by player type and geography. Processors with captive can-making or long steel contracts, and those located near domestic tinplate producers, face lower volatility than firms buying spot steel abroad. Smaller regional canneries lack the volume to negotiate favorable terms, so they feel cost spikes first and most severely. Freight costs add another layer of geographic difference for exporters shipping abroad.
canned-vegetables-market-cost-volatility-analysis-1789747427986

Signing Index-Linked Steel Supply Contracts

Processors negotiate multi-year tinplate contracts with pricing linked to published steel indices, then mirror those indices in retailer agreements so that cost movements are shared. This approach reduces surprise losses when steel spikes, though it also limits gains when prices fall. Scale matters, because only larger buyers can secure favorable terms and reliable delivery from a small supplier base.

Lightweighting Cans and Trimming Packaging Specifications

Engineering teams reduce can wall thickness, shorten lids, and standardize sizes to use less steel per unit without compromising sterilization or shelf life. Savings of a few percent per can add up across billions of units. The work needs testing, retort validation, and equipment adjustments, but it protects margin regardless of where steel prices move next.

Contracting Growers to Stabilize Crop Costs

Multi-year grower contracts fix acreage and pricing corridors before planting, which reduces exposure to crop-price spikes after poor harvests. Processors also diversify across growing regions so a single drought does not strand plants. This requires agronomy support and financing for growers, but delivers steadier quality, packing schedules, and unit costs over time. Contracts also improve planning.

Portfolio Architecture for Margin Defence

Canned vegetable economics run from thin volume-tier margins on plain commodity cans, often sold under private label, to richer premium and next-generation pools built on blends, organic ranges, and low-sodium recipes. Gross margin can roughly double between the volume tier and the top tier, since recipes, certification, and branding all add pricing power over the same raw crops. Mix, not volume, decides which processors earn acceptable returns.
Volume and premium pull in different directions. Private label contracts fill plants and cover fixed cost, yet they leave little profit per case, whereas premium lines earn better margins on smaller volumes and need marketing support. Processors must balance the two so idle capacity does not erode returns, and many use private label to fund the innovation that protects branded pricing. Balancing both is the central portfolio task.

High-value pools concentrate in prepared blends, organic and no-salt-added ranges, and legumes sold to health-conscious households and foodservice buyers. These segments are growing faster than the category, benefit from proprietary recipes, and are harder for retailers to replicate. Suppliers that secure permanent shelf space in them enjoy stickier relationships and steadier margins. Recipes and certifications make these positions hard to copy.

Volume / Commodity-Adjacent Tier

Plain single-vegetable cans of corn, peas, beans, and tomatoes sold mainly on price, often under private label, with thin spreads and heavy dependence on seasonal scale and steel cost across regions.
Gross Margin: 8%-14%

Premium / Certified Tier

Organic, no-salt-added, and non-GMO ranges carrying certifications and brand equity, which earn steady premiums from health-focused households and retailers building differentiated shelf sets across categories. Retailers use them to differentiate shelves.
Gross Margin: 18%-26%

Sustainability / Regulatory / Next-Generation Tier

Prepared blends, bisphenol-free linings, recyclable-claim packaging, and traceable regional sourcing, positioned ahead of stricter sodium and packaging rules and rising retailer sustainability demands. Early adopters gain credibility with regulators and retailers alike.
Gross Margin: 22%-30%
canned-vegetables-market-portfolio-architecture-1789747428329

High-value Sub-segments and Strategic Watch-out

Prepared Vegetable Blends

Prepared blends combine the fastest growth in the category with strong pricing power, because seasoned recipes and sauce packs turn cans into meal solutions and reduce direct comparison with private label. Capital needs are moderate, and demand from time-pressed households is expanding across mature and emerging markets alike.
Gross Margin: 22%-30%

Beans and Legumes

Canned beans and legumes offer healthy growth and stable premiums, supported by plant-based eating, low cost per gram of protein, and strong foodservice use. Organic and no-salt-added versions earn extra margin, though commodity crop swings and retailer bidding still limit how much pricing power suppliers can capture.
Gross Margin: 16%-24%

Plain Tomatoes and Sweet Corn

Plain tomatoes and sweet corn remain the volume core of the category, moving the largest tonnage and filling plants during harvest, even as their share of value slips. Returns depend on scale, crop contracting, and steel cost discipline, and private label buyers dominate pricing negotiations every year.
Gross Margin: 8%-12%

Frozen and Fresh-Cut Substitution

Frozen and fresh-cut vegetables represent the main strategic watch-out, because improved cold chains and health perceptions steadily pull younger shoppers away from cans in mature markets. Processors that also own frozen lines can hedge, but plain-can specialists risk gradual volume erosion without convenience or premium responses.
Gross Margin: n/a (substitution risk)

Why Pantry Habits Keep Cans Selling

Canned vegetable demand behaves like an annuity for processors that hold retailer bids. Once a supplier wins private label or branded shelf space, volumes repeat each season because households restock the same staples and retailers avoid disrupting supply during promotions. Annual bids reset pricing, but the base volume tends to persist for years. Stable repeat orders let processors plan crop contracting a year ahead.
Stickiness varies by end-use vertical. Foodservice and institutional buyers, including schools, hospitals, and food banks, show the deepest loyalty because they value consistent specifications and delivery. Retail shoppers switch more easily between brands, especially on promotion, while households buying beans and tomatoes for cooking show strong habit and pay premiums only for trusted organic or low-sodium versions. Foodservice contracts, by contrast, rarely change once qualified.

Buyer profiles are shifting across generations. Younger households favor convenience, plant-based protein, and clear sodium and ingredient labeling, and they are more willing to buy prepared blends than plain vegetables. Older cohorts still anchor plain-can volume, so processors must serve both groups while gradually moving portfolios toward formats that suit modern cooking habits. Marketing therefore increasingly targets younger cooks with recipe ideas.
canned-vegetables-market-end-use-penetration-index-1789747428637

MMA Verdict on Canned Vegetables

These are among the four positions where our research anticipates prominent divergence between winners and laggards over the coming forecast period. Each is grounded in the demand model, the regulatory perimeter, and the announced capacity pipeline.
01 / BLEND PORTFOLIO INVESTMENT

Shift Mix Toward Prepared Blends Before Rivals Do

Processors that delay investment in prepared blends will find their plain-can volumes increasingly negotiated on price alone. Blends already grow about 1.5 times faster than the category and earn substantially higher margins per ounce, while requiring dedicated recipes and filling lines that take a year or more to establish. MMA recommends moving decisively within the next two years while retailers still have open shelf space, given retailer plans for the next two annual bids and rising consumer interest in convenient meal solutions.
02 / STEEL COST PROTECTION

Lock Steel Costs Through Indexed Contracts

Tinplate is the largest packaging cost and the least controllable, so processors that leave it unhedged carry volatility that retailers rarely absorb. Index-linked supply contracts, lightweighting programs, and mirrored retailer price clauses reduce surprises and protect margin in downturns. MMA advises treating steel management as a core commercial discipline, not a procurement afterthought, especially for mid-sized processors without captive can-making, because contracts signed now determine cost positions for several years and retailers will not readily reopen agreed terms once steel prices have already moved against processors.
03 / EMERGING MARKET ACCESS

Build Import-Dependent Market Positions Early

Growth in the Middle East, Africa, and South Asia outpaces mature markets because ambient staples fill gaps left by weak cold chains. Processors that establish distributor relationships and local packing partnerships now will hold advantaged positions as supermarkets multiply. MMA sees these regions as the primary source of incremental volume and recommends allocating export capacity to them before competitors lock in retailers, since supermarket chains and distributors in these markets are still choosing which national and regional suppliers to list for the coming decade.
04 / PLANT UTILIZATION DISCIPLINE

Raise Utilization Through Multi-Crop Scheduling

Seasonal packing leaves lines idle for much of the year, and every idle month spreads fixed cost over fewer cases. Processors that schedule several crops across the calendar, share lines between products, and consolidate weak plants earn better unit economics than single-crop competitors. MMA regards utilization as the most reliable internal margin lever available, since it depends on planning rather than on market conditions, and it improves resilience when volumes soften or steel and energy prices rise faster than retailers will accept.

Engagement Snapshot From the Field

A live engagement with an industry participant carrying material or product regulatory and market exposure ahead of a defining policy shift, showing how our research translates into a defensible multi-year portfolio strategy.
MARKET MINDS ADVISORY · CLIENT ENGAGEMENT SUMMARY
Canned Vegetable Producer Strategic Portfolio Review and Transition Roadmap 2026·Investment Scenario on Canned Vegetable Exposure Evaluation 2025-26
CLIENT PROFILE
The client is a mid-sized North American vegetable processor with four canning plants and roughly $420 million in annual revenue (client-reported, unverified by MMA). About two thirds of its volume is private label sold to regional grocers, with the remainder under a small regional brand. It had not launched a new product in several years.
STRATEGIC CHALLENGE
Steel and crop cost inflation had cut the client's operating margin by several points, while retailers resisted price increases in annual bids. Management needed a portfolio strategy that raised margin per case without losing the private label volume that kept its plants running through the packing season during peak harvest weeks.
MMA APPROACH
MMA benchmarked the client's margins and mix against six peers, interviewed buyers at five regional grocers, and modeled the economics of adding a seasoned blend line and a no-salt-added range. The work also tested plant scheduling options to raise utilization across crops. Interviews with several growers informed sourcing and contracting options.
KEY FINDINGS
  1. Blended and seasoned products sold at 38% higher prices per ounce than the client's plain cans, with sharply lower promotional discounting across the retailers interviewed.
  2. Two of five grocers indicated they would grant permanent shelf space to a private label blend if delivered with consistent quality and dependable supply.
  3. The client's plants ran at 63% utilization, and consolidating two crops onto shared lines could lift utilization by about seven points annually.
  4. Index-linked steel contracts used by peers reduced margin volatility by roughly a third compared with the client's spot-based purchasing approach during recent years.
CLIENT PROFILE
The client is a mid-sized North American vegetable processor with four canning plants and roughly $420 million in annual revenue (client-reported, unverified by MMA). About two thirds of its volume is private label sold to regional grocers, with the remainder under a small regional brand. It had not launched a new product in several years.
STRATEGIC CHALLENGE
Steel and crop cost inflation had cut the client's operating margin by several points, while retailers resisted price increases in annual bids. Management needed a portfolio strategy that raised margin per case without losing the private label volume that kept its plants running through the packing season during peak harvest weeks.
MMA APPROACH
MMA benchmarked the client's margins and mix against six peers, interviewed buyers at five regional grocers, and modeled the economics of adding a seasoned blend line and a no-salt-added range. The work also tested plant scheduling options to raise utilization across crops. Interviews with several growers informed sourcing and contracting options.
KEY FINDINGS
  1. Blended and seasoned products sold at 38% higher prices per ounce than the client's plain cans, with sharply lower promotional discounting across the retailers interviewed.
  2. Two of five grocers indicated they would grant permanent shelf space to a private label blend if delivered with consistent quality and dependable supply.
  3. The client's plants ran at 63% utilization, and consolidating two crops onto shared lines could lift utilization by about seven points annually.
  4. Index-linked steel contracts used by peers reduced margin volatility by roughly a third compared with the client's spot-based purchasing approach during recent years.
RECOMMENDED STRATEGY
Phase 1: Phase 1 (Months 1-6): Install a seasoned blend line at one plant and negotiate index-linked steel supply agreements with key suppliers. Phase 2: Phase 2 (Months 7-12): Launch private label blends with two anchor grocers while consolidating crop schedules across plants across the network. Phase 3: Phase 3 (Months 13-24): Extend blends and no-salt-added ranges to remaining customers and review plant footprint and shelf allocation by region.
OUTCOME
Within eighteen months, the client raised operating margin by an estimated 3.5 points (client-reported, unverified by MMA), driven by blend sales and steel cost stabilization. Plant utilization rose to 69%, and two grocers granted permanent blend shelf space, while private label contracts remained intact throughout the transition.

Frequently Asked Questions

Foundational context covering the market sizes, CAGR, scope, country, region and competition that inform every finding below. This section is provided to cover basics and most often pre-purchase conversations, answered from the MMA Primary Research Dataset.

What is the current size of the Canned Vegetable Market?

The global canned vegetable market was valued at $95.0 billion in 2025. This covers vegetables, tomatoes, corn, beans, and legumes commercially packed in metal cans for ambient shelf life.

How large will the Canned Vegetable Market be by 2036?

MMA projects the market will reach approximately $149.0 billion by 2036. This represents cumulative growth of roughly $50.4 billion over the full ten-year forecast window.

What is the CAGR for the Canned Vegetable Market 2026 to 2036?

The market is forecast to grow at a 3.8% compound annual rate between 2026 and 2036. The bull case reaches 5.0% while the bear case falls to 2.6%.

Which segment is growing fastest?

Prepared Vegetable Blends is the fastest-growing segment at 5.6% CAGR, roughly 1.5 times the overall market rate. Beans and Legumes follows as the second-fastest segment at 4.8%.

Who are the major companies in the Canned Vegetable Market?

Leading companies include Del Monte Foods, Conagra Brands, Bonduelle Group, Seneca Foods, and Del Monte Pacific. These five players together hold an estimated 24% of global revenue.

Which country is growing fastest?

India is the fastest-growing major market, expanding at approximately 6.5% CAGR each year. Modern retail expansion and weak cold chains in many cities are driving above-market demand for shelf-stable vegetables.

Report Segmentation Architecture

The full report scope spans multiple orthogonal segmentation dimensions, with cross-tabulated demand data provided for each dimension pair. Coverage extends further to regional breakdowns, trend trajectories, and the competitive detail needed to support segment-level decision-making.

By Primary Market Dimension

  • Prepared Vegetable Blends
  • Beans and Legumes
  • Canned Tomatoes
  • Sweet Corn
  • Peas and Green Beans
  • Root and Other Vegetables

By End-Use Industry

  • Retail Household Consumption
  • Foodservice and Catering
  • Institutional and Government Feeding
  • Food Manufacturing Ingredients
  • Export and Trade Distribution

By Commercial Dimension

  • Private Label Supply Contracts
  • Branded Retail Sales
  • Foodservice Distribution
  • Export Trade Channels

By Region

  • North America
  • Western Europe
  • East Asia
  • South Asia and Pacific
  • Latin America
  • Middle East and Africa
  • Eastern Europe

Scope, Methodology, and Coverage

Every figure in this report is reproducible from documented input assumptions. The scope below maps the historical period, the forecast horizon, the segmentation dimensions, and the countries covered, alongside the underlying primary and qualitative methodology.
Historical Period
2020 to 2025
Forecast Period
2026 to 2036
Base Year
2025 (USD billions; MMA Primary Research Dataset, September 2026)
Market Definition
Canned vegetables comprise commercially sterilized vegetables, tomatoes, corn, beans, and legumes packed in metal cans and retorted for ambient shelf life. The scope excludes frozen, fresh, pouch-only, and glass-jar products, as well as canned fruit, soups, and finished sauces.
Quantitative Units
USD billions (current prices); metric tons for volume references
Segmentation Dimensions
By Vegetable Type; By End-Use Industry; By Commercial Dimension; By Region
Regions Covered
North America, Western Europe, East Asia, South Asia and Pacific, Latin America, Middle East and Africa, Eastern Europe
Countries Covered
USA, China, Germany, France, UK, Japan, South Korea, India, Australia, Canada, Brazil, Mexico, Indonesia, Vietnam, Thailand, Malaysia, UAE, Saudi Arabia, South Africa, Nigeria, Egypt, Turkey, Poland, Netherlands, Italy, Spain, Sweden, Switzerland, Argentina, Colombia, and additional markets relevant to this sector
Key Companies Profiled
Del Monte Foods, Conagra Brands, Bonduelle Group, Seneca Foods, Del Monte Pacific, B&G Foods, Princes Group, La Doria S.p.A., Mutti S.p.A., Kagome Co. Ltd., Hanover Foods Corporation, Lakeside Foods, Allens Inc., Pacific Coast Producers, Bolton Group, Tiger Brands, Conserve Italia, Hero Group, COFCO Tunhe, Golden Circle Limited
Quantitative Methodology
Primary survey, n=3,800 respondents, Q4 2025, six countries; demand-side model with trade association cross-validation
Qualitative Methodology
47 expert interviews, Q4 2025; applied to validate demand model assumptions, identify emerging dynamics, and assess competitive positioning
Report Format
PDF and XLSX data workbook (Word format preview document)
Publisher
Market Minds Advisory
Report Code
MMA-2026-AGR-231
Published
September 2026
Contact
sales@marketmindsadvisory.com | www.marketmindsadvisory.com

Purchase the full Canned Vegetable Market Report (2026 to 2036).

The full report delivers a detailed assessment of global canned vegetable demand, processing economics, and competitive positioning through 2036. It includes segment forecasts by vegetable type, country-level data for all seven world regions, and profiles of the twenty companies most relevant to the category. Analysts also receive input cost modeling and portfolio margin benchmarking built from MMA's primary research dataset. A scenario planning module lets subscribers stress-test bull and bear assumptions against their own sourcing and pricing plans. Quarterly updates keep the whole dataset current throughout.
Ten-year segment and regional demand forecasts
Private label and branded pricing analysis
Competitive benchmarking of top twenty processors
Steel and crop cost sensitivity modeling tools
Regional demand mechanism comparative analysis included
Quarterly primary survey data update access

Built For The People Who Decide

From boardroom strategy to bench-side execution, this report is read cover-to-cover by leaders shaping the next decade of their industry, turning demand scenarios, market dynamics and valuation benchmarks into decisions.
CXOs/ Presidents/ VPs/ Managers
M&A and Corporate Development
Strategy Teams and R&D Heads
Procurement and Product Directors
Regulatory and Compliance Leaders
Investor Relations and Equity Analysts