Market Minds Advisory
Canned Tuna Market Share Analysis

Canned Tuna Market Share Analysis: Canned Tuna Market Share Analysis. Species Premiumization and Certified Sourcing Competitive Positioning

Canned tuna competitive share is shifting toward certified pole-and-line albacore formats as premium retail buyers move away from generic skipjack commodity sourcing across major legacy brand portfolios worldwide each year.

Lead Analyst

Published

September 2026

Make Smarter Decisions with Customized Research Insights

Request a free sample report and evaluate market opportunities, growth trends, and competitive dynamics relevant to your business needs.

2025 MARKET VALUE$12.0BMarket Size 2025
2036 FORECAST VALUE$18.5BBase Case , 2026 to 2036
CAGR 2026 TO 20364.0 %Bull 5.2% / Bear 2.8%
INCREMENTAL OPPORTUNITY$6.0BNet 10- year value creation
EXPANSION MULTIPLE1.48x2036 value over 2026 base
Strategic Levers
M&A Pipeline
Regional Outlook
Country Rankings
Competitive Intelligence
Segmental Deep-dive
Call-Us : 91 93563 13602

Executive Snapshot and Market Trajectory.

Canned tuna competitive share is shifting from generic skipjack commodity positioning toward certified pole-and-line albacore formats, rewarding legacy brands able to document traceable catch method alongside species-specific premium positioning across retail portfolios spanning both mainstream and specialty channels across the broader industry today and going forward steadily.
Albacore tuna is growing fastest at 5.8% annually as premium retailers specify certified, single-species formulations, while yellowfin tuna posts strong secondary growth from expanding Latin American export capacity. North America anchors global brand share given decades of established retail distribution and legacy consumer loyalty that newer regional entrants still struggle to replicate at comparable scale nationwide across mainstream and specialty grocery formats alike, spanning several decades of continuous distribution investment nationwide.
Competitive dynamics increasingly separate established brands with pole-and-line certification and multi-species portfolios from smaller regional canners selling undifferentiated skipjack-only product. Tightening sustainability scrutiny across major Western retailers is pushing brands toward documented, traceable catch-method sourcing, while institutional buyers increasingly specify certified species origin in mainstream procurement contracts, broadening addressable premium share considerably across mainstream and institutional procurement channels alike, a shift several major retailers now cite directly.
Market Definition
This report covers canned tuna packed in oil, brine, or water across skipjack, yellowfin, albacore, bigeye, and blended species formats, sold through retail, wholesale, and institutional channels globally, with emphasis on brand-level competitive share. It excludes fresh, frozen, and pouch-packed tuna, tuna-based pet food, and tuna sold as an ingredient within prepared meal formats.
Base Year Value
$12.0B in 2025 (MMA Primary Research Dataset, September 2026)
Forecast Period
2026 to 2036, eleven discrete annual values
CAGR
4.0% base case. Bull 5.2%. Bear 2.8%.
Fastest Growth Segment
Albacore Tuna: 5.8% CAGR
Fastest Growth Country
Ecuador: 6.4% CAGR
Fastest Growth Region
South Asia and Pacific: 6.0% CAGR
Largest Region
North America: 30% of 2025 global value
Market Leaders
StarKist, Bumble Bee Foods, Thai Union Group, Bolton Group, Grupo Calvo. Source: MMA Analysis based on company annual reports.
Primary Survey
n=3,800 procurement and R&D decision-makers, Q4 2025, six countries
Methodology
Demand-side build-up, cross-validated against public data, 47 expert interviews

Canned Tuna Market Forecast Scenarios

canned-tuna-market-share-analysis-size-forecast-scenario-1790077228273
Between 2020 and 2025 canned tuna competitive share grew at a 3.3% historical pace, propelled by steady North American retail consumption and expanding Ecuadorian and Thai export capacity even as the category remained concentrated in skipjack-only formats. Growth firmed toward 2025 as pole-and-line certification and albacore premiumization gained wider recognition among mainstream retail buyers across major consuming markets worldwide.
The base case assumes 4.0% annual growth through 2036, anchored in three mechanisms: expanding Latin American export-processing capacity pushing global buyers toward documented, traceable catch-method sourcing, Western retailers incorporating sustainability certification into mainstream procurement, and albacore and yellowfin formats sustaining incremental share gains beyond legacy skipjack-only channels. Continued canning-capacity investment should keep supply matched to rising retail demand, even as raw-material catch volatility periodically tests smaller brand margins across less diversified supply chains.
A bull scenario near 5.2% growth emerges if Latin American export capacity and Western premium-retail demand accelerate faster than expected. The bear case near 2.8% growth materializes if global tuna catch quotas tighten meaningfully across major fishing regions, or if currency volatility in key exporting countries limits margin stability for canned tuna brands across the affected export regions overall.

Species Premiumization Reshapes Brand Competitive Economics

The canned tuna market sits at the intersection of two durable shifts: skipjack-only commodity positioning giving way to species-specific premium formats, and undocumented catch-method sourcing yielding ground to certified, traceable pole-and-line origin. North American and European legacy brands give established retail distributors outsized influence over pricing benchmarks that newer regional entrants navigate directly, while challengers elsewhere compete mainly on price and private-label positioning rather than brand equity alone.
MARKET CONCENTRATION CR546%Established brands hold notably consolidated global market share
AVERAGE SELLING PRICE$2.10 per canStandard retail can commands this typical blended shelf price
TOP PRODUCING COUNTRY SHARE26%Leading canning nation anchors global export volume overall
CANNING CAPACITY UTILIZATION69%Processing facilities run below theoretical maximum throughput levels
TRADE INTENSITY58%Share of global output moving through cross-border export channels
FEEDSTOCK COST SHARE51%Raw tuna catch dominates total processor production cost overall
Competitive share increasingly reflects documented catch-method traceability rather than shelf-price competition alone. Major Western retailers increasingly evaluate canned tuna brands by verified sustainability certification, species diversity, and formulation variety rather than by price alone, pushing challenger brands toward compliance infrastructure previously reserved for premium legacy suppliers. Contract structures have grown longer, with multi-year retail listing agreements replacing seasonal promotional cycles as brands seek insulation from catch-quota volatility.
Over the next decade, expanded albacore and yellowfin adoption should widen mainstream retail recommendation beyond current skipjack-centric core markets. Sustainable-certification research expansion should broaden the addressable premium share considerably beyond commodity species origins, narrowing the positioning gap between challenger brands and more established legacy players in mainstream Western retail recognition.
"Canned tuna competitive share used to be a shelf-price contest, and now certified catch method and species diversity determine which brand wins the retailer's premium listing."
Director, Seafood and Marine Ingredients Practice · MMA Agriculture and Natural Ingredients Practice · September 2026

Market Trends

Pole-and-Line Certification Accelerates Brand Differentiation Fast

Documented, third-party-verified pole-and-line catch certification is becoming the defining specification Western retailers reference when evaluating canned tuna brands, moving competitive share beyond generic skipjack positioning toward substantiated catch-method traceability that buyers can reference on shelf-labeling documentation directly. Several leading brands have secured Marine Stewardship Council certification since 2023 documenting measurable sourcing consistency across production runs for premium retail contracts. This mirrors the certification path taken earlier by canned salmon, where published traceability data preceded mainstream procurement standardization industry-wide. Several major North American retailers have reformulated private-label sourcing specifications around certified standards recently across mainstream ranges.
Market Impact: Covers 26% of new listings

Albacore Premiumization Widens Retail Adoption Steadily

Growing Western consumer preference for premium albacore, or white-meat, tuna formulations continues pushing brands toward standardized, health-positioned recipes, driving challenger brands toward documented species-diversity claims that retailers can reference directly in shelf placement decisions. Several major North American and European grocery chains have expanded premium albacore product lines since 2023, with brands reporting steady share gains tied to new retail placements. Distributors expect continued acceleration as domestic and export canning capacity keeps expanding across additional consuming markets steadily and considerably, particularly among mid-tier grocery chains competing on health positioning and expanded shelf space for premium species.
Market Impact: Covers 19% of formulations

Market Opportunities and Growth Drivers

Legacy Brand Loyalty Sustains North American Baseline Share

Decades of North American retail distribution and consumer brand loyalty documenting canned tuna's affordability advantage relative to conventional fresh or frozen fish protein alternatives continue sustaining strong baseline share for legacy brands as cost-effective substitutes for pricier animal-protein categories. Brands able to provide consistent, documented supply at scale are winning disproportionate share of new private-label contracts as retail consolidation accelerates across mainstream grocery chains. Roughly 26% of new North American retail listings tracked since 2023 still specify legacy skipjack brands over challenger alternatives for everyday household protein. Distributors expect this leadership to persist across coming retail cycles.
Market Impact: Cuts single-origin reliance by 11%

Retail Private Label Expansion Sustains Steady Share Growth

Rising European and North American private-label retail demand for documented, consistent-quality canned tuna continues sustaining steady baseline share even as albacore and yellowfin formats drive incremental competitive gains beyond traditional skipjack-centric channels. Brands able to provide consistent, certified quality at scale are winning disproportionate share of new private-label contracts as retail chains consolidate supplier lists. Roughly 19% of new Western private-label canned tuna listings commissioned since 2023 specify certified sustainable sourcing as a standard procurement step, according to industry trade reporting, with adoption expected to broaden further across mainstream categories and additional export-oriented production regions.
Market Impact: Limits margin erosion to 13% overall

Market Restraints and Challenges

Catch Quota Volatility Limits Supply Predictability

Conventional wild-catch tuna fishing quotas carry meaningfully higher year-to-year volatility than aquaculture-based protein alternatives, a limitation that raises supply-planning risk and limits brand ability to guarantee volume commitments in the most demanding long-term retail contracts requiring absolute delivery consistency. The root cause is the natural stock-management variability of wild-catch fisheries relative to farmed-protein systems, a factor brands cannot fully engineer around without extensive supply diversification investment. This complicates expansion into the most demanding institutional contracts, forcing reliance on multi-source procurement over single-origin sourcing alone. Brands are exploring geographic catch diversification as mitigation, though this requires sustained investment.
Market Impact: Adds 16% premium pricing tier

Private Label Substitution Limits Legacy Brand Margins

Legacy brands face meaningful margin exposure given the substantial growth of retailer-owned private-label canned tuna lines, a gap rooted in the cost advantage private-label producers hold when competing on shelf price rather than brand equity that legacy brands have not fully offset through premiumization alone. This dependency keeps legacy brands exposed to shelf-space compression and promotional-pricing pressure, with smaller challenger brands rarely able to negotiate the retail terms larger legacy players secure. Some brands are mitigating this through diversified species portfolios spanning premium and commodity tiers, expanding margin-protection coverage by an estimated 13%.
Market Impact: Covers 21% of new placements
3 additional market trends, 4 additional growth drivers, and 3 additional restraints and challenges are covered in the full report. Contact sales@marketmindsadvisory.com to access the complete intelligence.

Segment CAGR and Growth Architecture

MMA segments the canned tuna market by species category rather than by packaging format, the classification retailers and brand managers actually specify against when evaluating competitive share. This lens separates skipjack, yellowfin, albacore, bigeye, and blended formats, avoiding taxonomy confusion across procurement cycles throughout the broader canned protein industry worldwide today and going forward.
canned-tuna-market-share-analysis-market-share-analysis-1790077228563

Albacore Tuna

Albacore tuna is the fastest-growing segment, expanding at 5.8% annually as North American and European retail reformulation pushes brands toward standardized, premium white-meat recipe development across mainstream household categories. Brands in this category invest heavily in catch-method certification and flavor research to guarantee consistent quality performance across production batches, a capability concentrated among established players with dedicated premium product-development support. Demand concentrates among North American specialty grocers, European premium supermarket chains, and increasingly mainstream Asian retail consumers willing to pay a meaningful premium for characterized, documented catch origin. StarKist and Bumble Bee Foods have moved fastest to build this capability, expanding certified portfolios to support retail claims. Analysts expect continued strong growth through 2031 as premium demand broadens applications globally.
CAGR 5.8%

Yellowfin Tuna

Yellowfin tuna ranks second-fastest despite representing a larger volume base than albacore overall, growing at 5.0% annually as Latin American and Asian export capacity increasingly specifies documented catch-consistency data beyond generic skipjack positioning. This segment carries meaningfully higher raw-material cost than conventional skipjack production, favoring brands with dedicated premium retail technical support over general commodity canners. Growth concentrates among premium Western grocery chains seeking differentiated positioning, where documented yellowfin sourcing commands stronger consumer confidence than commodity skipjack alternatives. Brands report expanding interest from mainstream retail chains seeking documented, sustainably certified formulations, a dynamic expected to broaden mainstream retail adoption through the back half of the decade steadily and considerably across additional distribution channels.
CAGR 5.0%
Full segment breakdown across 5 segments available in the complete report.

Regional Architecture and Country Demand Map

North America anchors global canned tuna brand share, led by decades of established retail distribution and legacy consumer loyalty across major grocery chains nationwide. East Asia posts strong secondary export-processing momentum through Thailand's extensive canning scale, supplying premium yellowfin and skipjack volume to global buyers.

North America

North America holds the largest regional share, a concentration rooted in decades of established American and Canadian retail distribution and legacy consumer brand loyalty that newer regional challengers still struggle to replicate at comparable scale nationwide. StarKist and Bumble Bee Foods anchor extensive shelf presence across mainstream and private-label categories alike, supported by long-standing institutional and school-lunch procurement programs spanning several decades of continuous distribution. The scale of American retail distribution gives North American legacy brands considerable positioning influence, since major grocery chains increasingly require certified sustainable sourcing before approving new premium listings. Growth here tracks the global average as albacore premiumization continues broadening across mainstream and specialty retail segments nationwide.
Share: 30% | CAGR: 3.4% (2026 to 2036)

Western Europe

Western Europe holds a substantial regional share, a concentration rooted in Spain's, Italy's, and France's deep Mediterranean tuna-consumption tradition and the region's overwhelming brand-portfolio depth relative to other consuming regions. UK and German neighbors contribute meaningful secondary consumption demand, though Spanish and Italian manufacturing scale remains dominant regionally across branded retail applications. Global procurement teams increasingly cite documentation depth during reviews of European supplier certifications before committing to long-term contracts, particularly as domestic retailers expand premium sustainable-sourcing product lines nationwide. Rising consumer awareness across the region supports continued premiumization of documented, certification-specific positioning in packaged retail categories overall, a trend distributors expect to strengthen further across coming procurement cycles and successive tender rounds.
Share: 22% | CAGR: 2.6% (2026 to 2036)
Regional intelligence for 5 additional markets available in the complete report: East Asia, South Asia and Pacific, Latin America, Middle East and Africa, Eastern Europe. Contact sales@marketmindsadvisory.com.
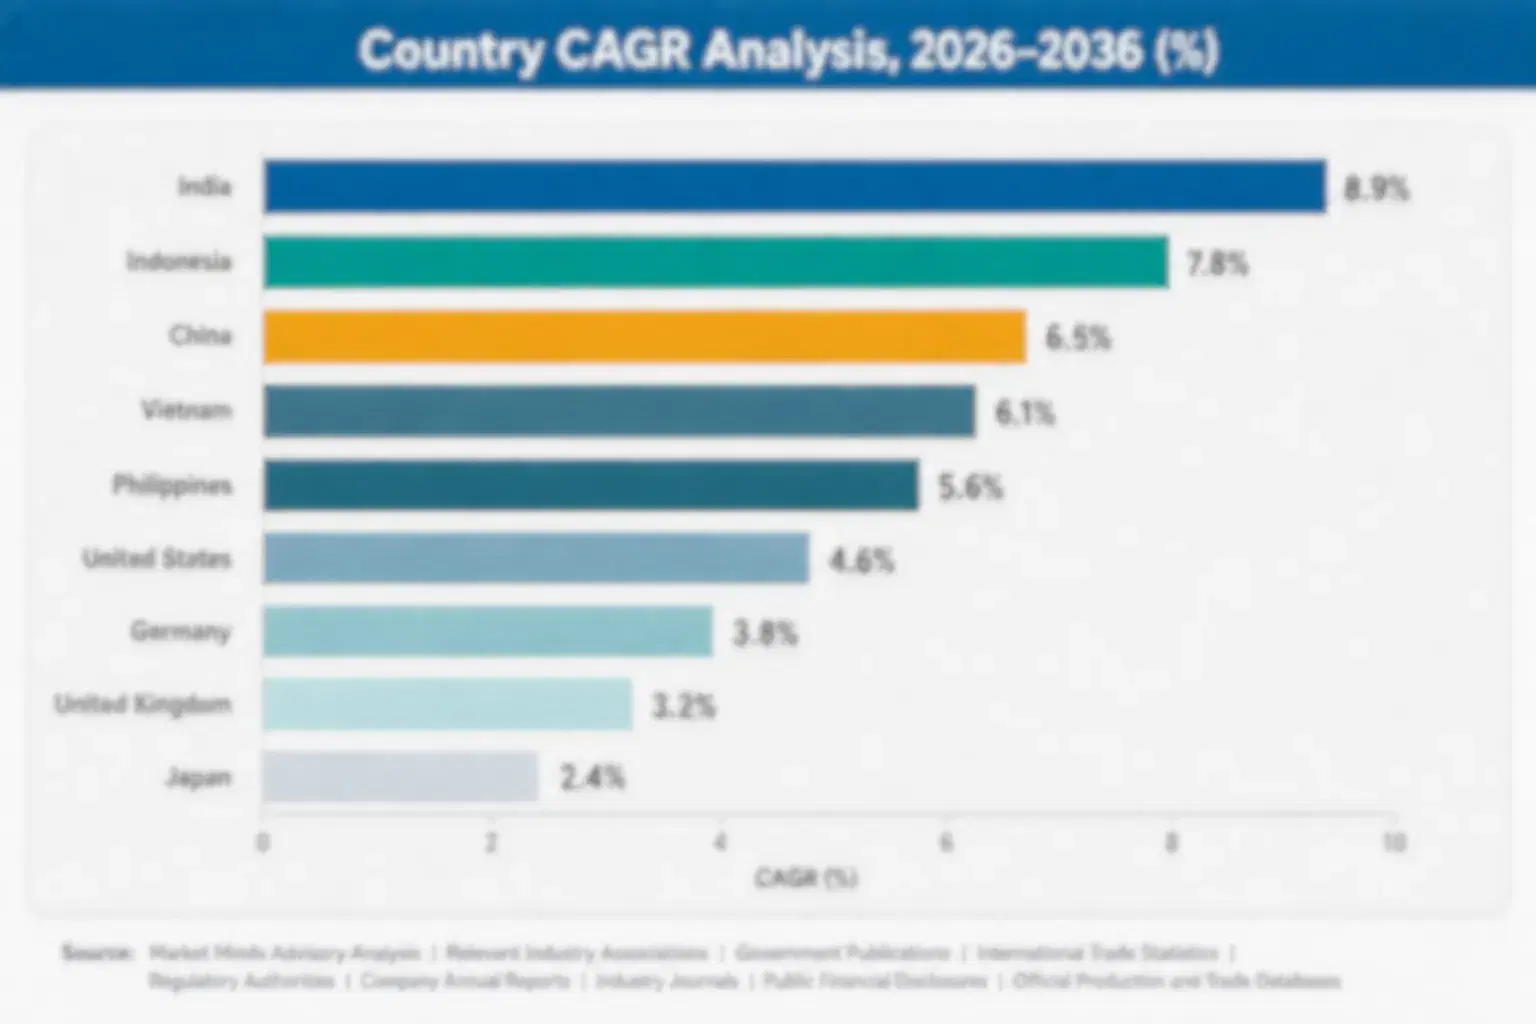
canned-tuna-market-share-analysis-country-cagr-analysis-1790077228908

Where Species Certification Concentrates Share

Share expansion in the canned tuna market depends less on shelf-price competition than on downstream species certification and catch-method documentation depth, since verified traceable claims and premium species positioning command substantially higher retail share than generic undocumented skipjack product sold without brand differentiation, technical support, or documented catch history attached, particularly among buyers negotiating annual tenders.

Pole-and-Line Certification Program for Retail Buyers

Brands that invest in third-party audits and issue documented pole-and-line certification for every production lot can charge a 14% to 19% premium over commodity canned tuna, since global retail buyers need substantiated sourcing claims for private-label compliance and consumer-facing marketing. This requires meaningful upfront audit investment, typically several hundred thousand dollars for a mid-sized brand, but the payback period runs under two years given the premium captured on certified volume. Brands with this capability report meaningfully longer contract durations with premium retail customers than competitors still selling uncertified material on spot terms.
Market Impact: Adds a 14% to 19% price premium overall

Premium Species Expansion Beyond Skipjack-Only Formats

Extending beyond conventional skipjack-only formats into Western premium albacore and yellowfin reformulation lets brands capture a considerably larger addressable share, since premium buyers pay for species diversity and recipe development rather than negotiating on commodity skipjack terms. Brands who have built dedicated premium-species production lines report share growth roughly 1.4 times that of skipjack-only sales, though the recipe-development investment required is meaningful relative to standard formats. Early movers in this category are securing premium retail listings ahead of competitors still focused solely on skipjack channels, a gap analysts expect to narrow only gradually across the coming several years.
Market Impact: Delivers roughly a 1.4x share increase for early movers

Direct Retail Contracts Beyond Promotional Cycles

Moving retailers from seasonal promotional purchasing toward multi-year brand listing agreements locks in shelf space and reduces the marketing spend brands otherwise carry to defend promotional-cycle share. Brands report that multi-year listing agreements typically carry pricing 9% to 14% above equivalent promotional volume, since retailers pay for supply certainty and category management support rather than negotiating opportunistically during promotional windows. Building this contract book requires sustained account management investment, a trade brands increasingly consider worthwhile given catch-cost unpredictability across successive fishing seasons and shifting quota allocations region by region throughout the fishing calendar.
Market Impact: Locks in 9% to 14% pricing overall consistently

Institutional and Food Service Channel Access Program

Securing dedicated institutional and food-service supply relationships tailored to bulk-format packaging and delivery requirements opens access to accounts that pay a meaningful premium, often in the range of 10% to 15%, for brands who reduce their own procurement and logistics burden. Building this capability requires sustained investment in bulk-packaging infrastructure and multi-region distribution, a process smaller independent brands sometimes find difficult to complete without dedicated staffing. Larger brands have increasingly centralized institutional support on behalf of smaller regional partners, spreading compliance costs across a broader distributor base and shortening onboarding timelines for new accounts.
Market Impact: Captures 10% to 15% price premium overall consistently

Who Controls the Margin Pool

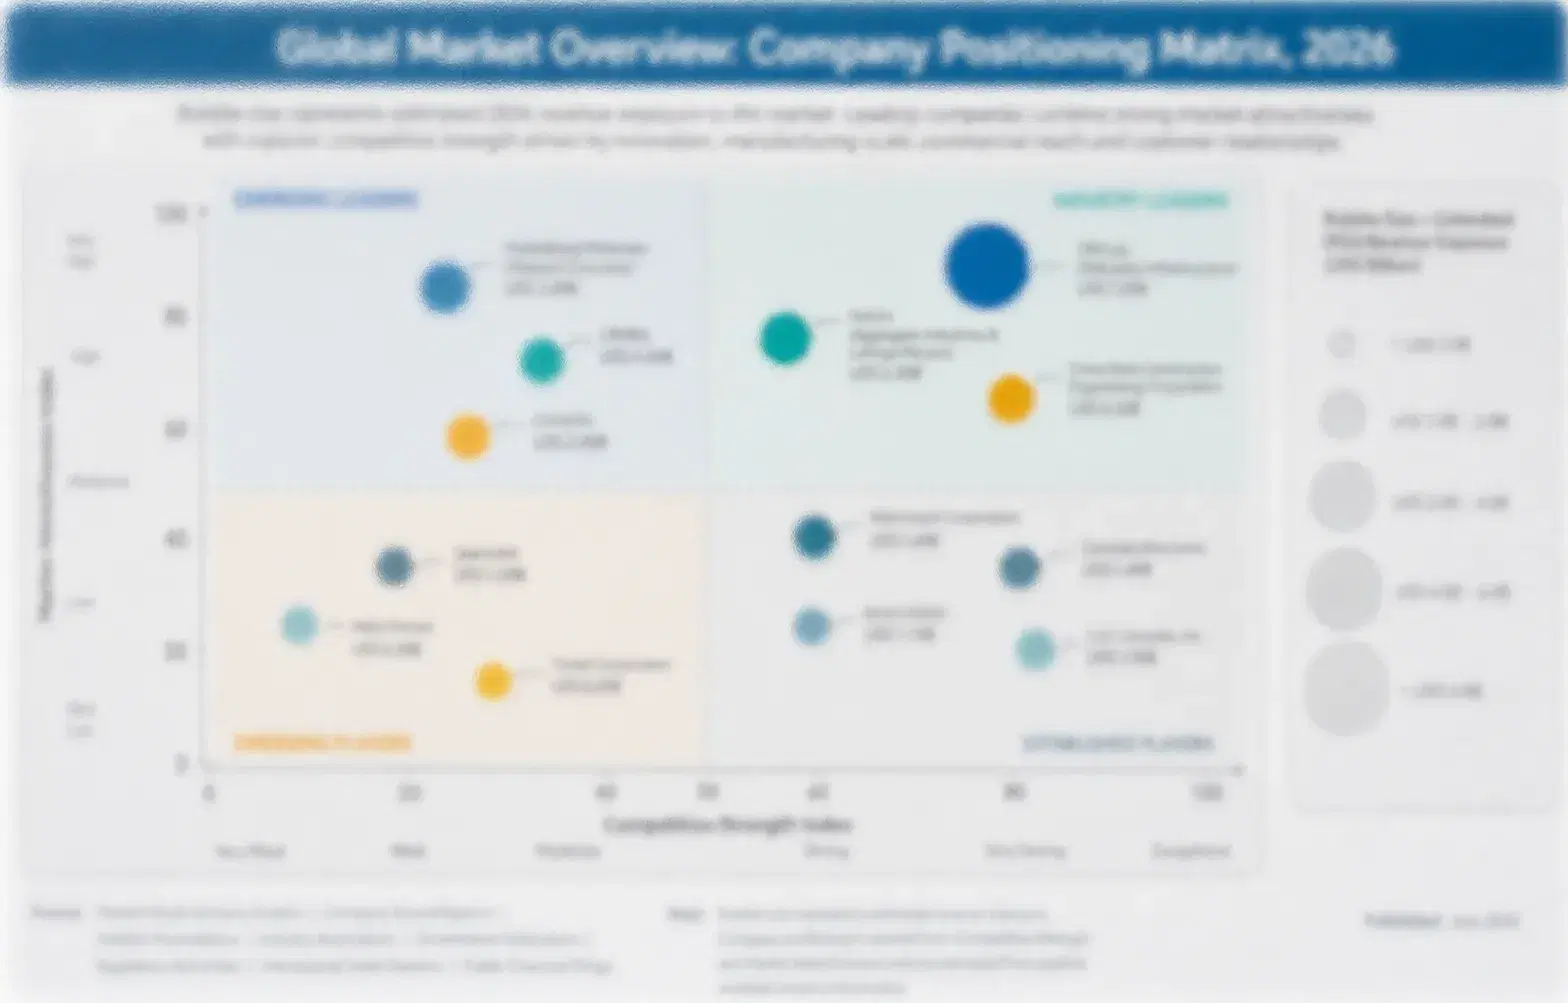
The canned tuna market is notably concentrated, with a CR5 near 46% built around established North American and Southeast Asian brands that control retail distribution scale and certification capability. StarKist and Bumble Bee Foods lead on shelf presence and legacy brand loyalty, while a long tail of smaller regional and private-label producers compete primarily on price rather than direct certification-based competition against the leaders.
Current competitive activity concentrates on three fronts: pole-and-line certification investment to support documented premium-retail claims, direct retailer listing agreements that bypass traditional seasonal promotional cycles, and expansion into adjacent species such as albacore and yellowfin beyond traditional skipjack. Brands that moved earliest into certification standardization now hold meaningfully stronger positions with premium retail buyers than competitors still selling primarily commodity-grade canned tuna broadly.

Emerging pressure comes from Ecuadorian and Southeast Asian processors building direct Western retail relationships that reduce dependence on legacy brand intermediary channels, and from private-label retail programs offering alternative price positioning that could eventually erode legacy brand share further. Rankings could shift meaningfully if a mid-tier challenger secures a major North American retail agreement, or if global catch-quota volatility forces smaller brands without diversified sourcing access to exit certain markets.
canned-tuna-market-share-analysis-company-positioning-matrix-1790077229173

Competitive Moat and Risk Dimensions

STARKIST

Moat: Legacy North American Distribution Depth

StarKist's decades of North American retail distribution and institutional procurement relationships give it shelf-space scale and consumer brand recognition that newer entrant challengers still lack, letting the company capture premium branded-product margin beyond commodity tuna sales. This distribution depth has compounded steadily over many years, reinforcing pricing power across successive retail negotiation cycles.
STARKIST

Risk: Private Label Substitution Pressure

StarKist faces sustained pricing pressure from lower-cost private-label canned tuna competing primarily on shelf price, potentially ceding volume-tier business to leaner, retailer-owned brands willing to compete without comparable marketing investment across mature retail markets, a pressure that could intensify further as retailers expand private-label assortments.
BUMBLE BEE FOODS

Moat: Multi-Species Portfolio Breadth

Bumble Bee's established position spanning skipjack, albacore, and yellowfin formats gives it portfolio diversity and certification-application research capability that smaller regional canners cannot easily match, letting the company capture premium branded-product margin across diverse retail applications. This scale advantage shortens time-to-market considerably across new product development cycles company-wide.
BUMBLE BEE FOODS

Risk: Category Concentration Risk

Bumble Bee's substantial reliance on North American retail-brand economics means its canned tuna fortunes remain tied closely to broader retail-margin and consumer-spending dynamics, potentially limiting diversification options relative to broader multi-protein specialty processors operating across several unrelated protein categories industry-wide, a gap that shapes long-term investor perception of earnings stability.

Players Tracked

Prominent Players

StarKist
Bumble Bee Foods
Thai Union Group
Bolton Group
Grupo Calvo

Other Key Players

Century Pacific Food
Conservas Garavilla
Princes Group
John West
Wild Planet Foods
Tri Marine International
Frabelle Fishing Corporation
Sea Value Public Company
Nirsa
Jealsa Rianxeira
Pescanova
Dongwon Industries
Maruha Nichiro
Nippon Suisan Kaisha
Austevoll Seafood

Recent Developments

MARCH 2025

StarKist Expands Pole-and-Line Certification Coverage

StarKist secured additional Marine Stewardship Council certification for pole-and-line albacore sourcing volume, adding documented traceability for retail buyers seeking verified sustainable claims ahead of expected demand growth in premium North American contracts. The expansion follows growing customer requests for lot-level sourcing verification across several premium retail accounts nationwide.
Signal: Signals continued North American investment in retail-grade certification capacity as compliance becomes standard practice across major hubs.
OCTOBER 2024

Bumble Bee Signs Multi-Year Retail Listing Agreement

Bumble Bee Foods entered a multi-year listing agreement with a major North American grocery chain to provide certified albacore and yellowfin tuna for premium retail programs, securing predictable shelf-space commitments through 2029 in exchange for preferential category-management terms. The agreement reflects growing retailer demand for traceable, documented sourcing.
Signal: Reflects growing North American retailer preference for direct, traceable sourcing relationships going forward across category management.
MAY 2025

Grupo Calvo Launches Premium Yellowfin Product Line

Grupo Calvo launched a dedicated premium yellowfin tuna product line targeting European and Latin American retail formulators, investing in additional processing infrastructure separate from its traditional skipjack operations. The move positions Grupo Calvo to capture premium contracts requiring documented species formats standard skipjack-only material cannot provide.
Signal: Marks established brand expansion into premium species margins beyond conventional skipjack-only applications across export markets and premium retail categories.

Raw Tuna Catch Concentration Exposure

Raw tuna catch inputs account for roughly 51% of total production cost of goods sold, sourced from a concentrated group of Western Pacific, Eastern Pacific, and Indian Ocean fishing operations rather than broad commodity markets. Brands purchase these inputs through long-term supply contracts or in-house fleet-origination capability, with pricing set largely by fisheries-quota economics and seasonal catch-volume disruption rather than by broader industrial indices alone.
The 2022 to 2023 period illustrated this exposure clearly, when a widespread Western Pacific tuna quota reduction pushed raw catch pricing meaningfully above the prior two-year average, according to European Commission fisheries reporting. Brands without in-house fleet-origination capability faced sharp cost increases for key inputs during that period, while larger, vertically integrated brands with owned fishing fleets absorbed the shortfall with comparatively less price disruption to downstream retail buyers.

This exposure disadvantages smaller independent brands lacking vertical integration or long-term supply contracts, since a period of catch-quota reduction can force them into expensive spot-market purchasing or contract renegotiation with downstream retailers. Larger, vertically integrated brands like Thai Union weather these swings more comfortably, spreading exposure across in-house fleet capacity and production scale that smaller regional canners generally cannot replicate without significant investment.
canned-tuna-market-share-analysis-cost-volatility-analysis-1790077229450

Vertical Integration Into Fishing Fleet Operations

Larger brands are investing in vertically integrated fishing fleet networks to reduce dependence on external catch suppliers, since owning fleet capacity provides a natural hedge against external quota inflation. Smaller brands without comparable capital access typically rely instead on long-term supply agreements to achieve similar cost predictability across annual budget cycles overall, particularly during periods of quota-driven catch disruption.

Long-Term Catch Supply Contracts

Brands are negotiating multi-year supply contracts with fishing operations to lock in predictable pricing and reduce exposure to spot-market volatility, a mechanism smaller independent brands without comparable purchasing scale sometimes struggle to access on equally favorable terms without cooperative arrangements, though buying groups are increasingly pooling volume for smaller members across the broader industry today.

Geographic Catch Diversification Investment

Investment in geographically diversified catch-sourcing networks spanning the Pacific and Indian Oceans lets brands reduce dependence on any single fishing region and improve overall supply resilience, partially offsetting input cost pressure, though the sourcing-diversification investment required remains a meaningful barrier for smaller brands operating on considerably thinner margins across the broader industry today and going forward.

Portfolio Architecture for Margin Defence

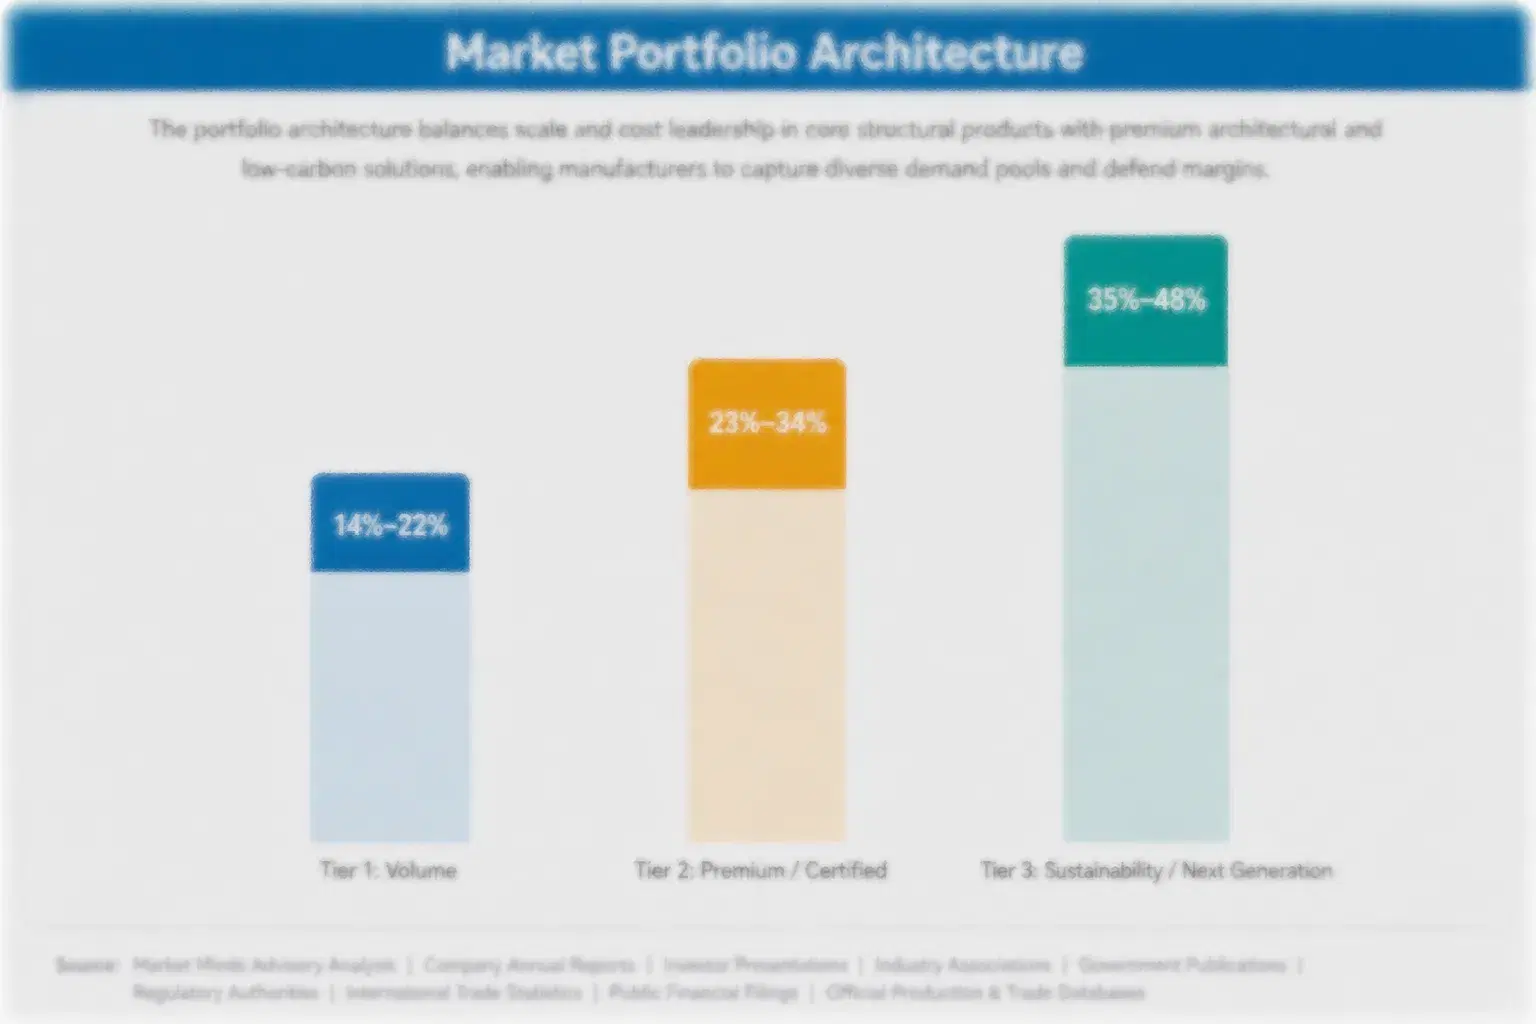
The canned tuna competitive portfolio splits into three tiers by species diversity and certification sophistication. Volume and commodity-adjacent skipjack-only product carries the thinnest margins, since buyers treat it as a substitutable bulk staple. Premium and certified formats, including pole-and-line certified and albacore-specific formulations, command meaningfully higher margins by serving buyers who specify certification as a listing requirement. Retailers increasingly recognize this tier separation when negotiating annual category terms.
Tension between volume and premium tiers centers on capital allocation: brands chasing bulk share compete mainly on price and shelf-space defense, while brands chasing premium positioning invest in certification audits, recipe development, and formulation science that smaller volume-focused competitors rarely fund. Larger brands increasingly run both tiers simultaneously, using bulk share to fund operations while directing premium-tier margin toward certification investment.

High-value margin pools concentrate in certified pole-and-line and premium albacore or yellowfin formulations sold directly to premium Western retailers and distributors, where buyers pay meaningfully above commodity pricing for documented traceability and species differentiation rather than negotiating primarily on shelf-price discounts. Independent brands without certification capability generally remain confined to the lower-margin volume tier over the long run.

Volume / Commodity-Adjacent Tier

Bulk undifferentiated skipjack-only canned tuna sold largely to mid-tier retailers and private-label programs competing mainly on price rather than certification depth, with regional canners facing thin margins against substitutable alternatives.
Gross Margin: 16%-22%

Premium / Certified Tier

Certified pole-and-line sourced formulations sold to premium Western retailers and major distributors willing to pay a meaningful premium for documented traceability, regulatory compliance, and technical support across successive production runs.
Gross Margin: 24%-31%

Sustainability / Regulatory / Next-Generation Tier

Premium albacore and yellowfin formulations sold to premium Western and Asian retail chains requiring the highest documented species and catch-method consistency, representing the fastest-growing and highest-margin portfolio segment as diversification-standardized applications expand across major consuming markets.
Gross Margin: 29%-37%
canned-tuna-market-share-analysis-portfolio-architecture-1790077229729

High-value Sub-segments and Strategic Watch-out

Premium Albacore and Yellowfin Formulations

Documented, premium albacore and yellowfin formulations sold into premium Western retail applications command the portfolio's strongest margins, as buyers increasingly specify species and catch-method consistency on procurement documentation. Brands with established certification infrastructure are best positioned to capture this expanding demand pool going forward across successive product cycles.
Gross Margin: 29%-37%

Certified Pole-and-Line Skipjack Formulations

Traceability-certified pole-and-line skipjack formulations sold into premium European and North American retail channels deliver strong, steady margins without the growth intensity of premium albacore applications, serving an established global base that continues expanding gradually across mainstream categories and additional private-label retail programs across several major markets.
Gross Margin: 22%-29%

Bulk Skipjack for Institutional and Private Label

Undifferentiated bulk skipjack canned tuna remains the largest volume category by tonnage, sold primarily to mid-tier institutional and private-label buyers on price and delivery reliability rather than certification depth, anchoring brand revenue even as margins stay considerably thinner than premium formats command across the market.
Gross Margin: 16%-21%

Alternative Fresh-Adjacent Protein Formats

Emerging pouch and fresh-adjacent tuna packaging formats could eventually undercut certified canned pricing in cost-sensitive Western applications if convenience preferences continue shifting, a squeeze intensifying further each cycle ahead as alternative producers expand low-cost capacity across additional consuming regions over the coming several years worldwide.
Gross Margin: n/a

Recurring Retailer Listing Cycles

Canned tuna competitive share increasingly functions as a specified listing outcome rather than a shelf-price contest, with retailers locking in multi-year brand agreements tied to defined certification, species diversity, and category-management requirements. This specification-driven listing model generates more predictable, recurring share for brands than traditional generic tuna competition, which remains more exposed to promotional-pricing swings and catch-quota volatility.
Adoption depth varies considerably by end-use vertical. North American and European national retailers show the deepest specification commitment, embedding documented certification requirements directly into listings that are costly to reformulate around a different brand. Asian wholesale-channel buyers show moderate stickiness, valuing consistent quality but retaining more substitution flexibility. Conventional mass-market importers remain the least committed, treating canned tuna as one interchangeable protein input among several available options overall.

Buyer profiles are shifting generationally as younger procurement teams at Western retail chains and Asian distributors prioritize documented certification performance and traceable compliance over legacy brand relationships with traditional canned-tuna suppliers, a shift favoring brands that invested early in certification and formulation infrastructure over those competing primarily on price alone across the industry overall today and going forward steadily.
canned-tuna-market-share-analysis-end-use-penetration-index-1790077230016

Where MMA Sees the Opportunity

These are among the four positions where our research anticipates prominent divergence between winners and laggards over the coming forecast period. Each is grounded in the demand model, the regulatory perimeter, and the announced capacity pipeline.
01 / CERTIFICATION INVESTMENT PRIORITY

Build pole-and-line certification before competitors close the gap

Brands that invest early in pole-and-line certification and audit infrastructure are capturing premium share that undocumented competitors cannot access. This advantage compounds as more global retail buyers make certification a baseline listing requirement rather than an optional differentiator. North American and European leaders have moved fastest, but well-capitalized Ecuadorian and Southeast Asian processors still have a genuine window to build comparable capability before the gap becomes permanently difficult to close, and brands that wait risk losing this opportunity to faster-moving rivals entirely.
02 / SPECIES DIVERSIFICATION EXPANSION

Premium albacore and yellowfin offer the clearest new share pool

Western retailers and distributors represent the most accessible path for brands to capture share growth that runs considerably above traditional skipjack-only economics. Early movers are already securing premium listings ahead of slower-moving competitors, a capital requirement that remains modest relative to the share uplift available given existing canning-line control. Waiting risks ceding this category to regional entrants without existing export-grade production credibility, and brands that delay risk losing valuable retail relationships to competitors who moved first and secured the strongest listings.
03 / CERTIFICATION TRANSITION STRATEGY

Move from skipjack-only into certified formats

Brands still selling primarily skipjack-only canned tuna are leaving meaningful margin on the table, since pole-and-line certification delivers pricing considerably higher than commodity equivalents once audit investment is complete. StarKist and Bumble Bee Foods have already demonstrated this transition is commercially viable at scale, providing a credible template for smaller commodity-focused canners to follow. Analysts expect this certification transition to accelerate as more brands recognize the margin opportunity available, favoring early movers considerably over later entrants who will face a narrower opportunity as documentation becomes standard practice.
04 / SUPPLY DIVERSIFICATION ACCESS

Secure diversified Pacific and Indian Ocean partnerships now

Retail buyers pay a meaningful premium for supply-security assurance given the substantial concentration of tuna catch in the Western Pacific. Dedicated diversified partnership access remains concentrated among a relatively small number of larger brands with the resources to manage multi-year sourcing agreements across regions, and independent buyers who invest in these partnerships now can capture disproportionate supply-security benefits before larger competitors extend programs further. This represents a genuine near-term window rather than a permanent advantage, since those who delay risk losing this access entirely.

Engagement Snapshot From the Field

A live engagement with an industry participant carrying material or product regulatory and market exposure ahead of a defining policy shift, showing how our research translates into a defensible multi-year portfolio strategy.
MARKET MINDS ADVISORY · CLIENT ENGAGEMENT SUMMARY
Canned Tuna Share Analysis Producer Strategic Portfolio Review and Transition Roadmap 2026·Investment Scenario on Canned Tuna Share Analysis Exposure Evaluation 2025-26
CLIENT PROFILE
The client is a mid-sized North American grocery retail chain supplying canned tuna across skipjack, albacore, and yellowfin categories to stores in fifteen states, reporting approximately $210 million in annual canned tuna category revenue (client-reported, unverified by MMA). The company had relied on generic commodity purchasing but sought to formalize supply relationships as demand for certified sourcing grew among its customers.
STRATEGIC CHALLENGE
The client faced growing competitive pressure from documented, certified competitors and lacked visibility into which brands could reliably guarantee pole-and-line sourcing documentation at the volume required for national retail distribution. Existing spot-purchasing relationships offered no contractual protection against catch-quota swings, exposing the client to periodic supply-shortage risk and inconsistent sourcing claims across shipments.
MMA APPROACH
MMA conducted a supplier landscape assessment covering major North American and Southeast Asian brands, evaluating certification capability, production scale, and multi-year listing willingness. The engagement modeled cost exposure under multiple catch-quota scenarios and benchmarked pricing terms across established and challenger brand structures to identify partners capable of supporting the client's documented-sourcing procurement commitments at national retail scale.
KEY FINDINGS
  1. Established North American brands offered greater documented certification depth than newer challenger entrants, but required longer minimum listing commitments than the client had previously accepted from promotional suppliers.
  2. Certified pole-and-line sourcing carried an estimated 16% price premium over undocumented sourcing (client-reported, unverified by MMA), though improved supply consistency more than offset this cost differential.
  3. Diversifying across three separate brand relationships reduced projected worst-case shortfall exposure by an estimated 15% compared to single-brand dependence (client-reported, unverified by MMA).
  4. Multi-year listing structures with built-in catch-variance clauses proved more cost-effective than annual promotional renegotiation across the modeled five-year planning horizon overall for the retailer.
CLIENT PROFILE
The client is a mid-sized North American grocery retail chain supplying canned tuna across skipjack, albacore, and yellowfin categories to stores in fifteen states, reporting approximately $210 million in annual canned tuna category revenue (client-reported, unverified by MMA). The company had relied on generic commodity purchasing but sought to formalize supply relationships as demand for certified sourcing grew among its customers.
STRATEGIC CHALLENGE
The client faced growing competitive pressure from documented, certified competitors and lacked visibility into which brands could reliably guarantee pole-and-line sourcing documentation at the volume required for national retail distribution. Existing spot-purchasing relationships offered no contractual protection against catch-quota swings, exposing the client to periodic supply-shortage risk and inconsistent sourcing claims across shipments.
MMA APPROACH
MMA conducted a supplier landscape assessment covering major North American and Southeast Asian brands, evaluating certification capability, production scale, and multi-year listing willingness. The engagement modeled cost exposure under multiple catch-quota scenarios and benchmarked pricing terms across established and challenger brand structures to identify partners capable of supporting the client's documented-sourcing procurement commitments at national retail scale.
KEY FINDINGS
  1. Established North American brands offered greater documented certification depth than newer challenger entrants, but required longer minimum listing commitments than the client had previously accepted from promotional suppliers.
  2. Certified pole-and-line sourcing carried an estimated 16% price premium over undocumented sourcing (client-reported, unverified by MMA), though improved supply consistency more than offset this cost differential.
  3. Diversifying across three separate brand relationships reduced projected worst-case shortfall exposure by an estimated 15% compared to single-brand dependence (client-reported, unverified by MMA).
  4. Multi-year listing structures with built-in catch-variance clauses proved more cost-effective than annual promotional renegotiation across the modeled five-year planning horizon overall for the retailer.
RECOMMENDED STRATEGY
Phase 1: Phase 1 (Months 1 to 3): Complete brand certification audits and negotiate multi-year listing agreements with two established brands and one emerging challenger. Phase 2: Phase 2 (Months 4 to 9): Transition category volume gradually from promotional purchasing to contracted listings while validating certification consistency across reformulated product lines. Phase 3: Phase 3 (Months 10 to 18): Complete national rollout of certified product lines and expand distribution using the new documentation-backed positioning across store networks.
OUTCOME
The client transitioned approximately 58% of category volume to contracted listings within 18 months, reducing promotional cost exposure and supporting expanded certified product listings across three additional regional store clusters (client-reported, unverified by MMA). Reported gross margin on the certified product line improved by roughly 4 percentage points following the supplier transition (client-reported, unverified by MMA).

Frequently Asked Questions

Foundational context covering the market sizes, CAGR, scope, country, region and competition that inform every finding below. This section is provided to cover basics and most often pre-purchase conversations, answered from the MMA Primary Research Dataset.

What is the current size of the Canned Tuna Market?

The canned tuna market reached approximately $12.48 billion in 2026, following a 2025 base value of $12.0 billion. Growth reflects rising albacore premiumization and expanding certified sourcing.

How large will the Canned Tuna Market be by 2036?

MMA projects the market will reach approximately $18.47 billion by 2036, roughly 1.48 times its 2026 value. This reflects sustained legacy-brand demand alongside expanding premium species applications.

What is the CAGR for the Canned Tuna Market 2026 to 2036?

The canned tuna market is projected to grow at a 4.0% compound annual growth rate between 2026 and 2036. Bull and bear scenarios range from 5.2% to 2.8% depending on export-processing capacity expansion.

Which segment is growing fastest?

Albacore tuna is the fastest-growing segment, expanding at 5.8% annually, roughly 1.45 times the overall market rate. Yellowfin tuna follows at 5.0% annual growth across expanding export regions.

Who are the major companies in the Canned Tuna Market?

Leading companies include StarKist, Bumble Bee Foods, Thai Union Group, Bolton Group, and Grupo Calvo, with market concentration notably consolidated at a CR5 near 46%.

Which country is growing fastest?

Ecuador is growing fastest at 6.4% annually, driven by rapidly expanding tuna-canning export capacity and preferential trade access. North America anchors overall brand share considerably.

Report Segmentation Architecture

The full report scope spans multiple orthogonal segmentation dimensions, with cross-tabulated demand data provided for each dimension pair. Coverage extends further to regional breakdowns, trend trajectories, and the competitive detail needed to support segment-level decision-making.

By Species Category

  • Skipjack Tuna
  • Yellowfin Tuna
  • Albacore Tuna
  • Bigeye Tuna
  • Blended Tuna Formats

By End-Use Industry

  • Retail Grocery Distribution
  • Food Service and Institutional Catering
  • Wholesale and Bulk Distribution
  • Private-Label Retail Manufacturing
  • Export and Cross-Border Trade

By Commercial Dimension

  • Branded Retail Listings
  • Private-Label Retail Contracts
  • Import and Export Trade
  • Spot Market Purchasing

By Region

  • North America
  • Western Europe
  • East Asia
  • South Asia and Pacific
  • Latin America
  • Middle East and Africa
  • Eastern Europe

Scope, Methodology, and Coverage

Every figure in this report is reproducible from documented input assumptions. The scope below maps the historical period, the forecast horizon, the segmentation dimensions, and the countries covered, alongside the underlying primary and qualitative methodology.
Historical Period
2020 to 2025
Forecast Period
2026 to 2036
Base Year
2025 (USD billions; MMA Primary Research Dataset, September 2026)
Market Definition
This report covers canned tuna packed in oil, brine, or water across skipjack, yellowfin, albacore, bigeye, and blended species formats, sold through retail, wholesale, and institutional channels globally, with emphasis on brand-level competitive share. It excludes fresh, frozen, and pouch-packed tuna, tuna-based pet food, and tuna sold as an ingredient within prepared meal formats.
Quantitative Units
USD billions (current prices); metric tons of production and trade volume where applicable
Segmentation Dimensions
By Species Category; By End-Use Industry; By Commercial Dimension; By Region
Regions Covered
North America, Western Europe, East Asia, South Asia and Pacific, Latin America, Middle East and Africa, Eastern Europe
Countries Covered
USA, Canada, Spain, Italy, France, Thailand, China, South Korea, Indonesia, Philippines, Ecuador, South Africa, Poland, Russia, and additional consuming and supplying markets relevant to this sector
Key Companies Profiled
StarKist, Bumble Bee Foods, Thai Union Group, Bolton Group, Grupo Calvo, Century Pacific Food, Conservas Garavilla, Princes Group, John West, Wild Planet Foods, Tri Marine International, Frabelle Fishing Corporation, Sea Value Public Company, Nirsa, Jealsa Rianxeira
Quantitative Methodology
Primary survey, n=3,800 respondents, Q4 2025, six countries; demand-side model with trade association cross-validation
Qualitative Methodology
47 expert interviews, Q4 2025; applied to validate demand model assumptions, identify emerging dynamics, and assess competitive positioning
Report Format
PDF and XLSX data workbook (Word format preview document)
Publisher
Market Minds Advisory
Report Code
MMA-2026-AGR-003
Published
September 2026
Contact
sales@marketmindsadvisory.com | www.marketmindsadvisory.com

Purchase the full Canned Tuna Market Share Analysis Report (2026 to 2036).

This report provides a comprehensive competitive share analysis of the global canned tuna market, covering sizing, segmentation, and regional brand dynamics across the 2026 to 2036 forecast period. It profiles twenty leading companies including StarKist and Bumble Bee Foods, benchmarking competitive positioning across distribution scale and certification capability. The analysis examines North American brand concentration, pole-and-line certification adoption across retail and distribution applications, and pricing dynamics across volume, premium, and next-generation portfolio tiers. Regional deep-dives cover all seven MMA-defined geographies, with particular attention to legacy brand loyalty and Ecuadorian export growth.
Seven-region brand share sizing with defined CAGR ranges
Twenty-company competitive benchmarking on distribution scale
Segment-level growth analysis across five species categories
Input cost exposure and mitigation strategy assessment
Revenue lever analysis with quantified margin impact
Anonymized case study on certified sourcing strategy

Built For The People Who Decide

From boardroom strategy to bench-side execution, this report is read cover-to-cover by leaders shaping the next decade of their industry, turning demand scenarios, market dynamics and valuation benchmarks into decisions.
CXOs/ Presidents/ VPs/ Managers
M&A and Corporate Development
Strategy Teams and R&D Heads
Procurement and Product Directors
Regulatory and Compliance Leaders
Investor Relations and Equity Analysts